Trump is Not Mr. Affordable

I wrote many posts during the Biden administration to counteract the recurring false claims about “runaway inflation”. Biden was certainly guilty of spending too much taxpayers’ money for economic recovery, infrastructure, green projects and student loan forgiveness. This aggravated the inflation rate, made it slower to fall and established expectations of higher long-term inflation. However, the primary drivers of inflation were the pandemic driven demand for physical goods after factories closed, loose monetary policy and bipartisan government spending to offset the pandemic. We all enjoyed 20 years of price stability before this. A little bumpiness after a pandemic driven global shutdown was not surprising.

Current Inflation Rate
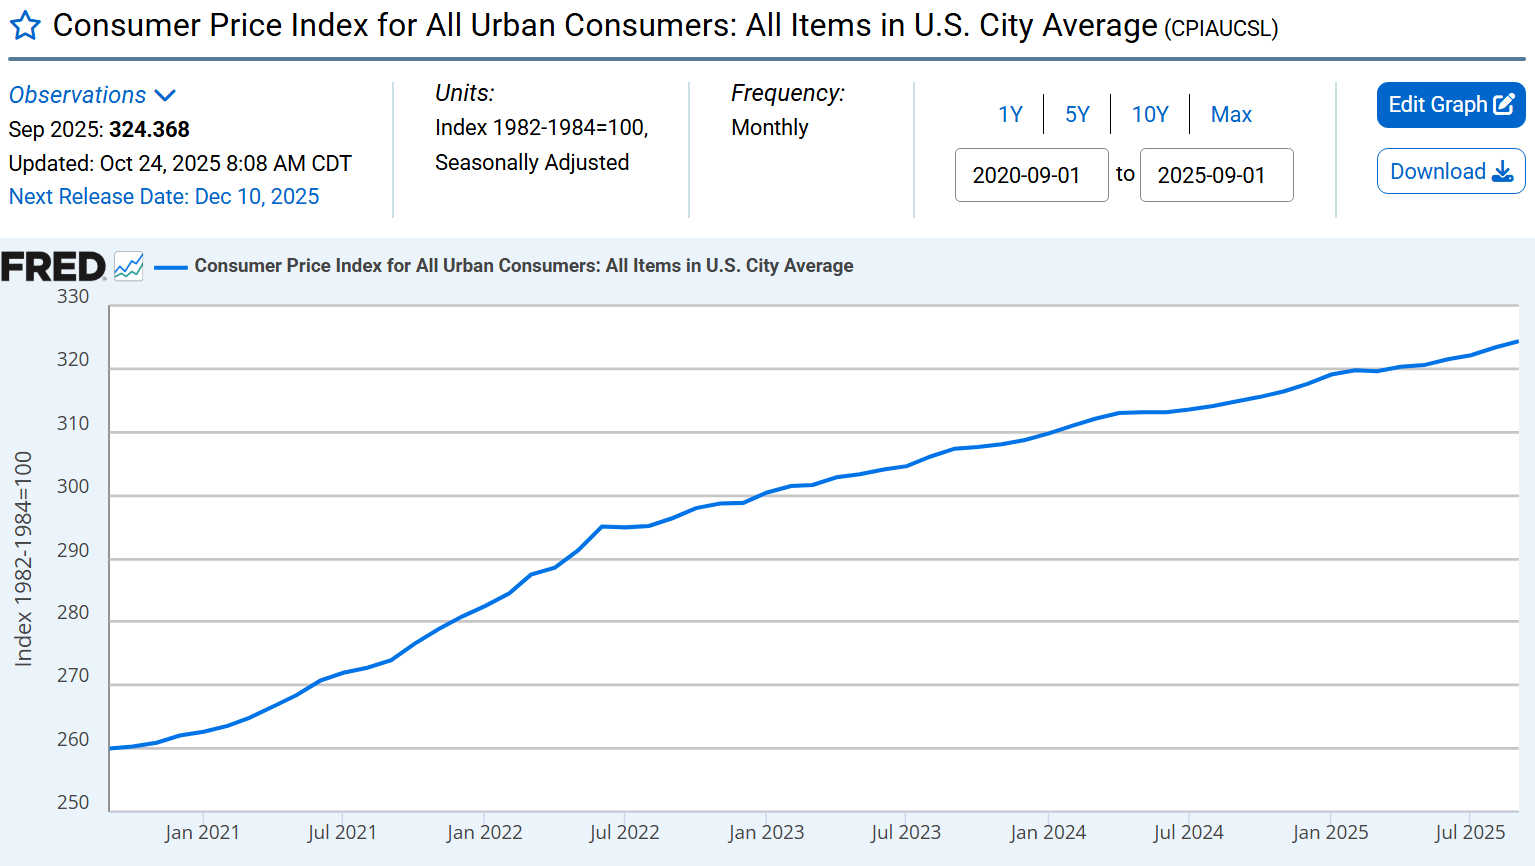
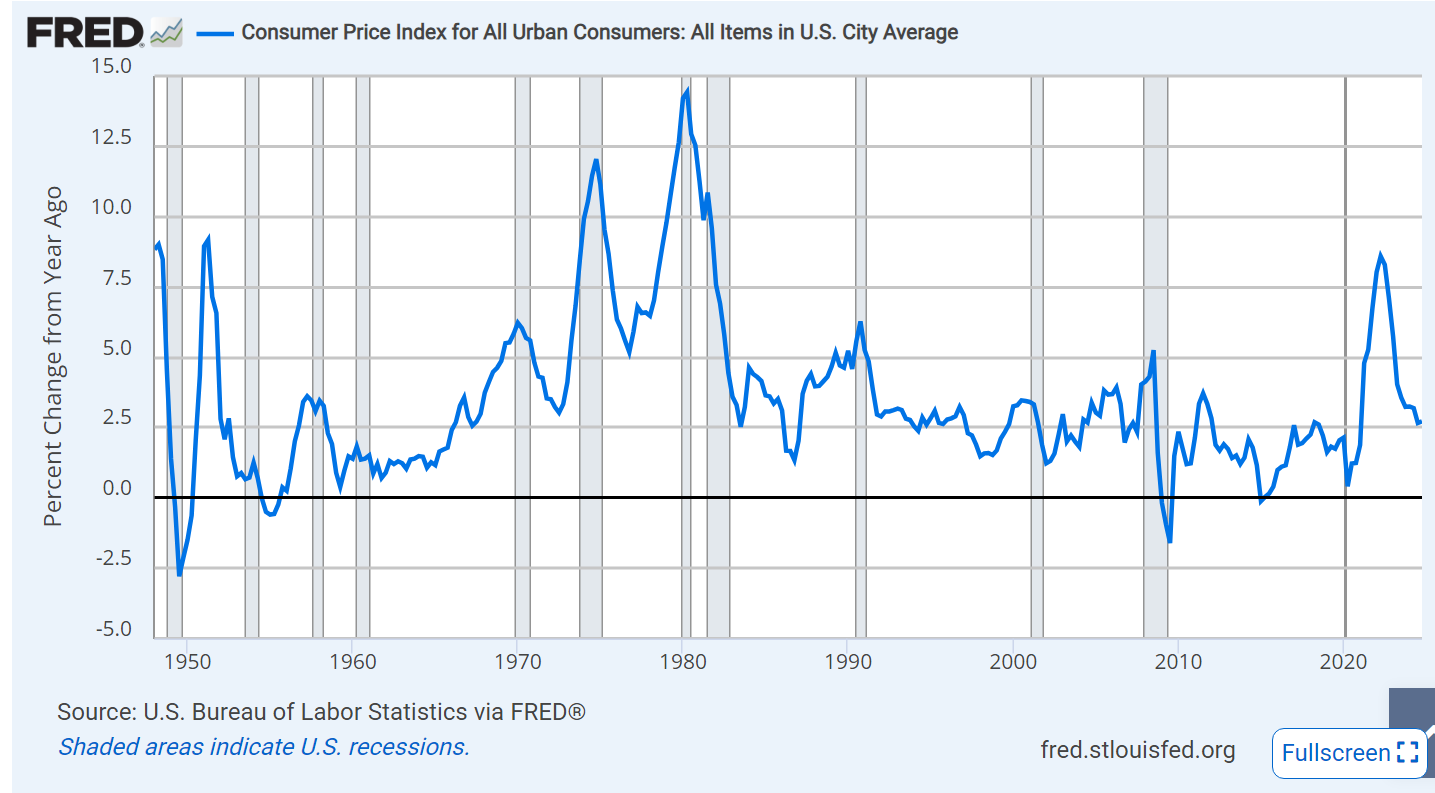
The climbing inflation rate broke in June, 2022 more than 3 years ago. It has not slowed under Trump’s stewardship.

The inflation rate has been in the 3% +/- range for the last 2 years. That means that prices, on average, continue to increase each year. 2% inflation was the normal rate for the prior 20 years. It (3%) seems to be a rate that is “non-accelerating”. Economic agents, including consumers, are able to ignore 2% inflation. It is immaterial, too small to really notice. 3% inflation is on the border of being “concerning”. Inflation can more easily accelerate from 3% to a concerning 5% or higher. President Trump can claim that he has maintained the Biden inflation reduction from 9% to 3% but he cannot claim that he has reduced prices, reduced inflation or made the cost of living more affordable.
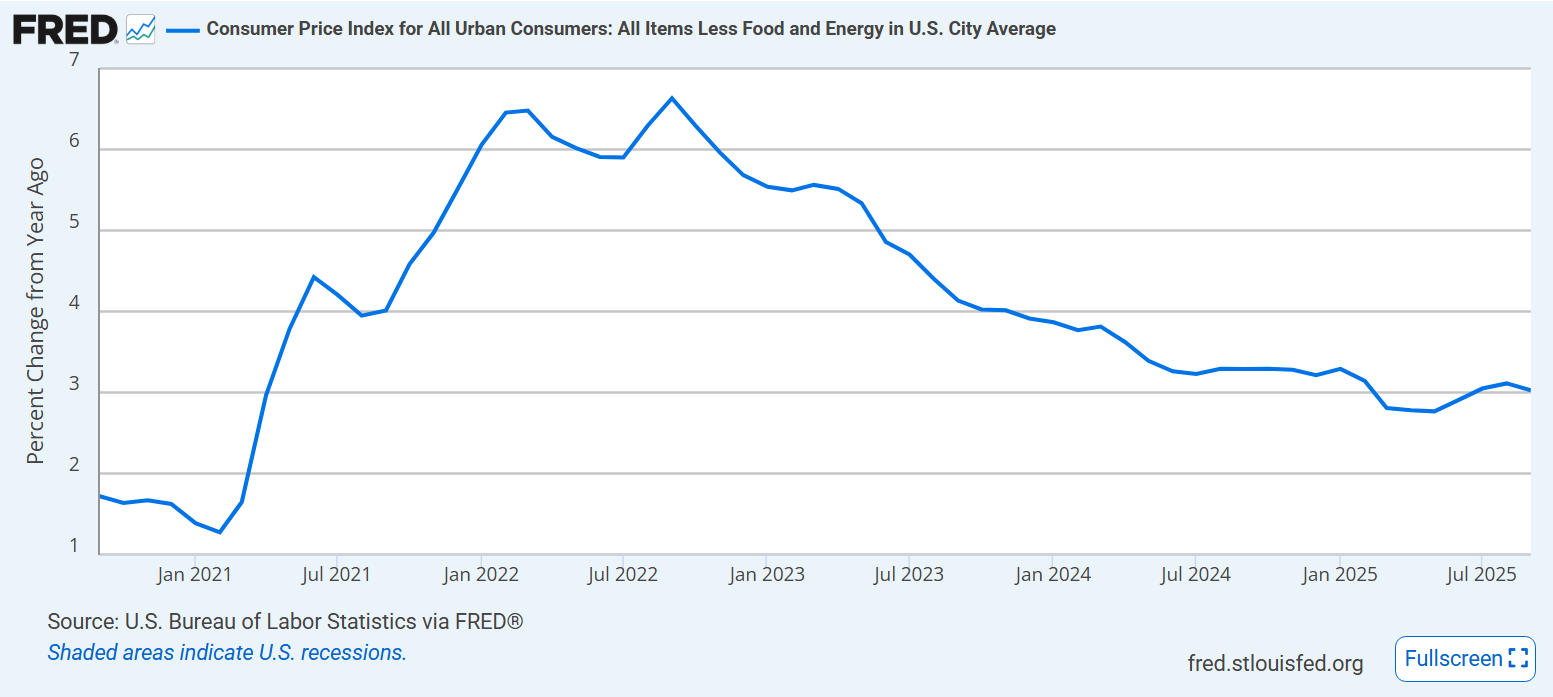
The core inflation rate, excluding the more volatile food and energy prices, has shown the same pattern. It peaked at 6.5% and declined to “about 3%” by June, 2024. It has moved down by one-quarter percent since then. Unfortunately, it seems to be flat. Trump has not moved it down.

Smaller Policy Options

President Trump has pursued 2 of these 12 areas but worked in the opposite way to increase inflation on most. He has pressured drug prices down. He has encouraged increased supply of traditional fossil fuels energy.

Fiscal Policy
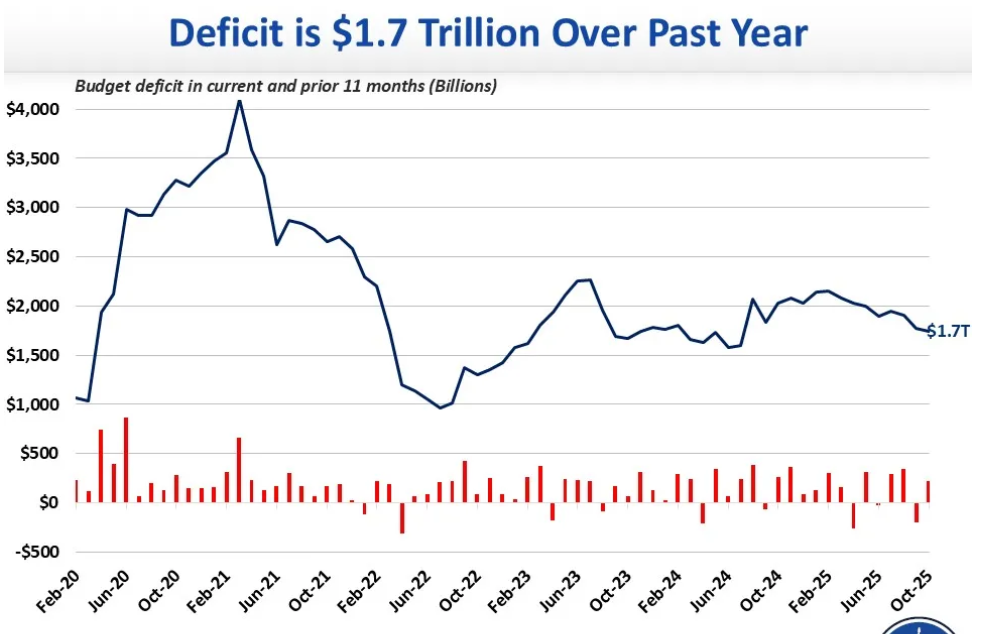
Federal budget deficit remains at an unsustainable $1.7T per year. Too much demand, not enough supply.

Monetary Policy

President Trump has been harassing Fed Chair Jerome Powell (who he appointed) to cut interest rates. The real, inflation adjusted, interest rate is currently 1%. Monetary policy is neutral or a little tight. President Trump encourages looser monetary policy which increases inflation. Not an inflation fighter.

US Dollar
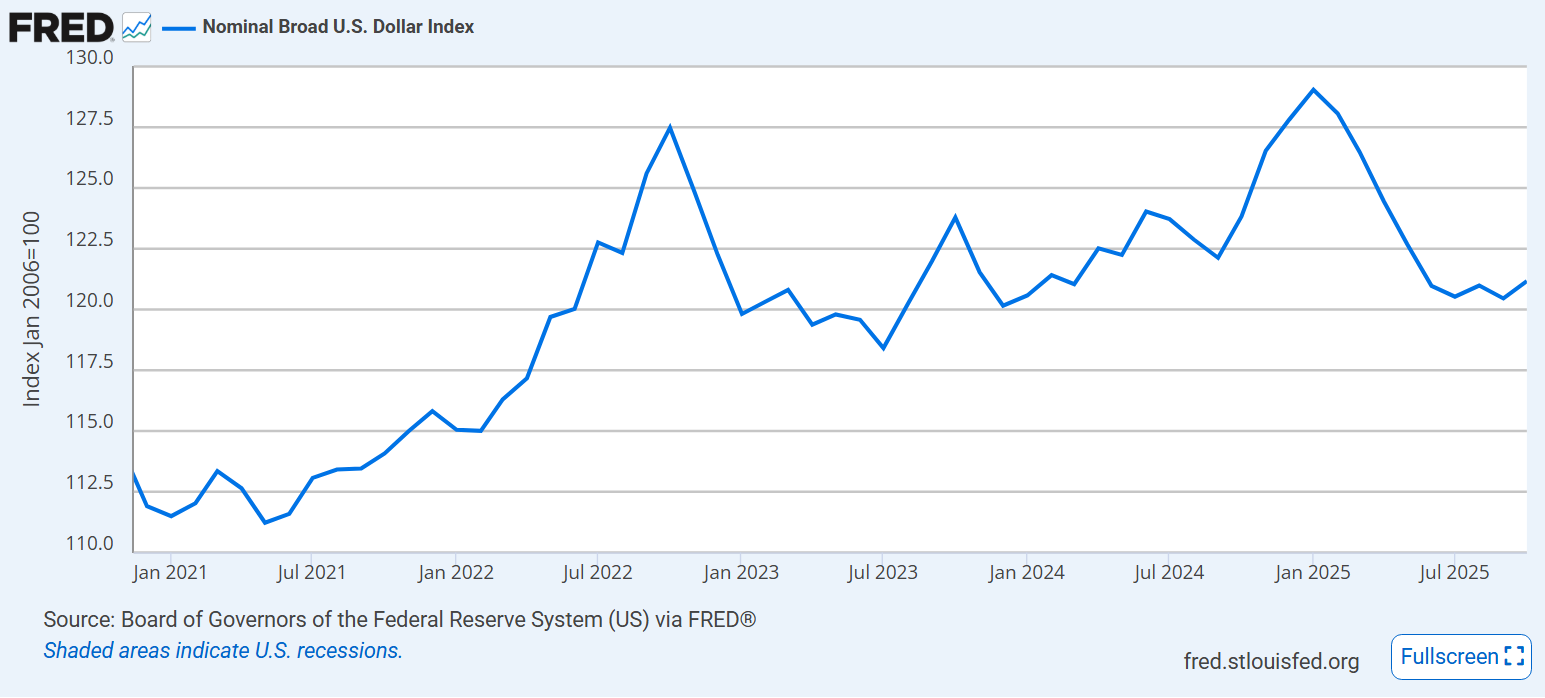
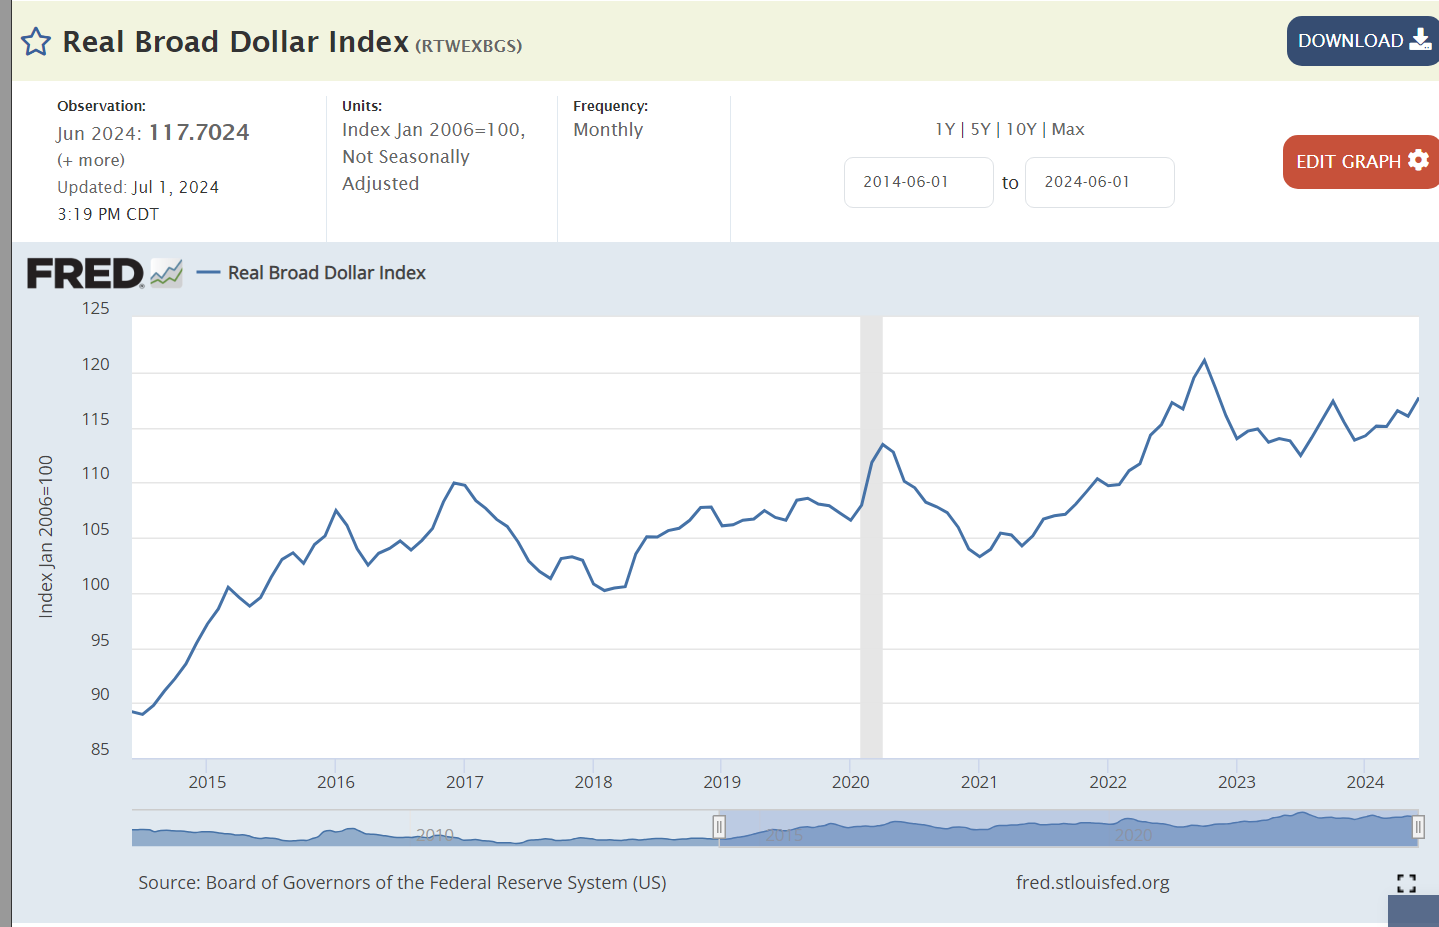
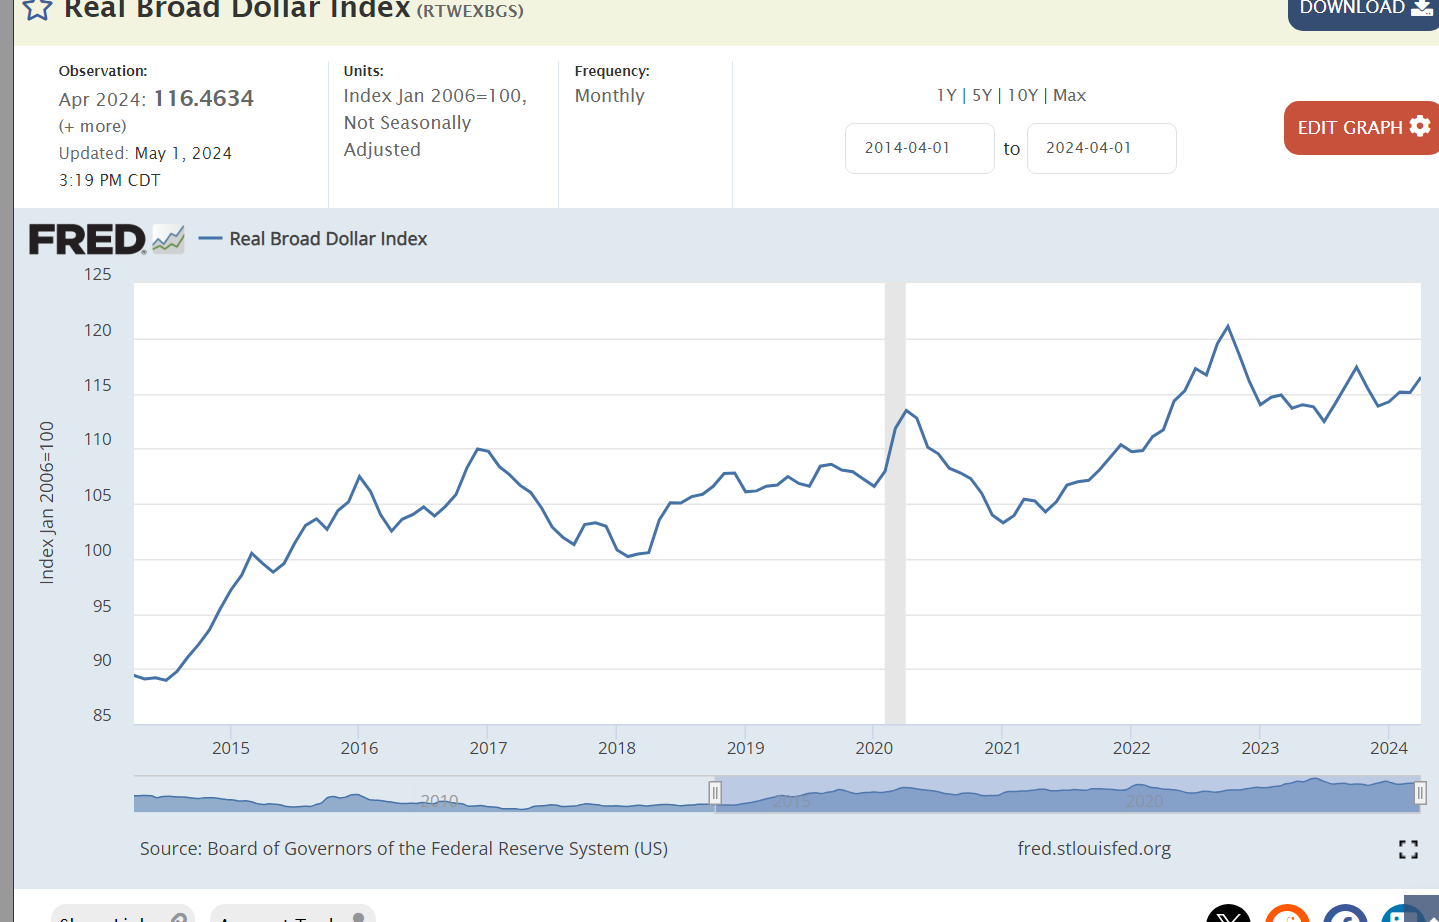
The US dollar has declined in value since Trump took office, making foreign purchases more expensive.

Housing Costs

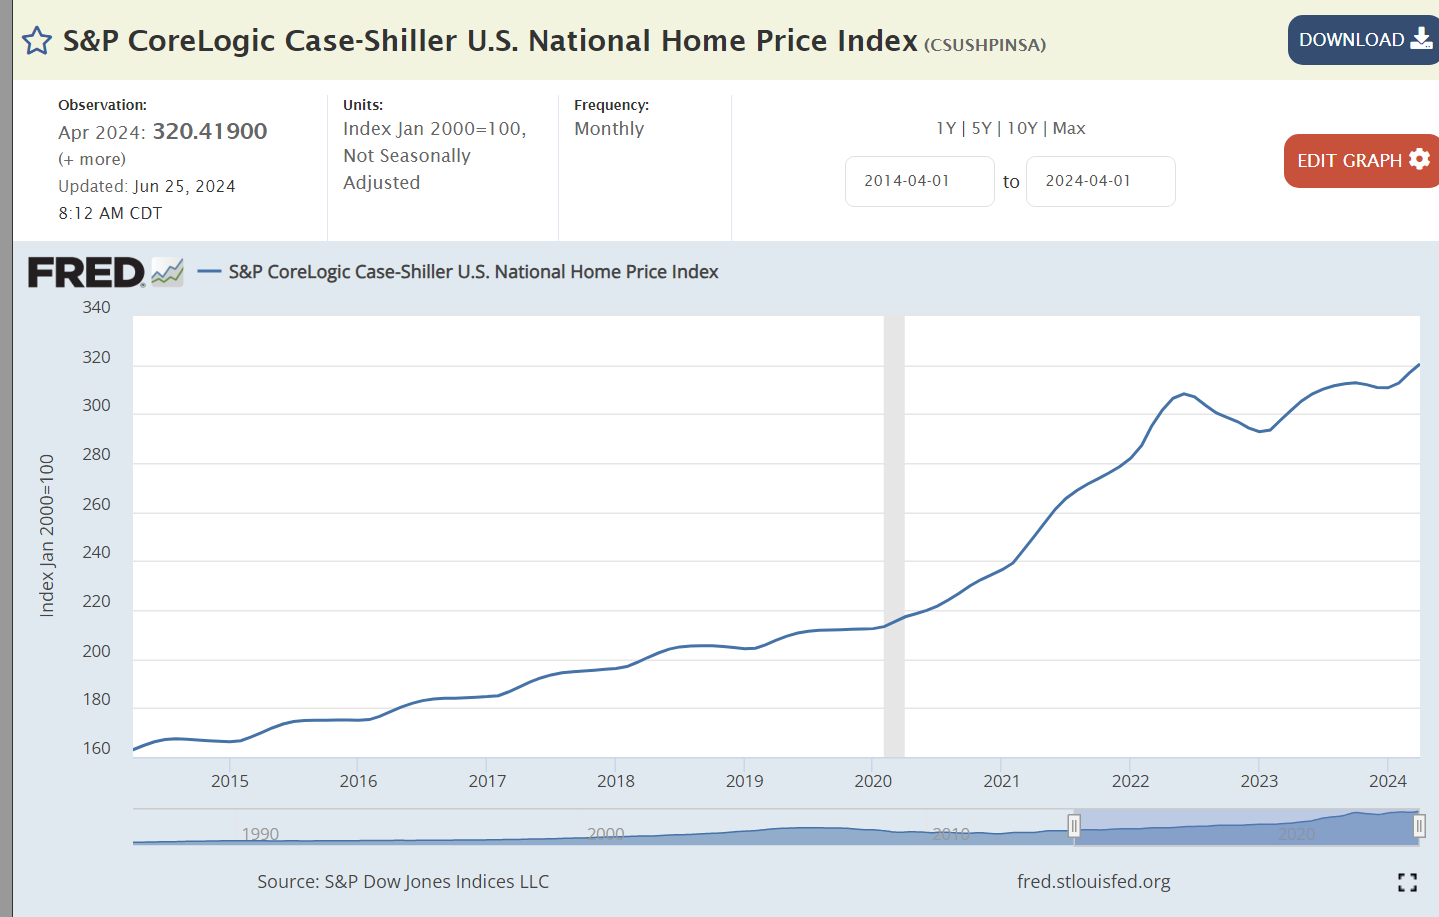
Housing prices peaked in 2022, drifted down by 5% in 2022 and have remained flat for the last two and a half years. Trump policies have no impact here.

Health Care

3% medical inflation continues despite efforts to reduce drug prices.

https://www.cnn.com/2025/08/11/business/prescription-drug-prices-trump

Food
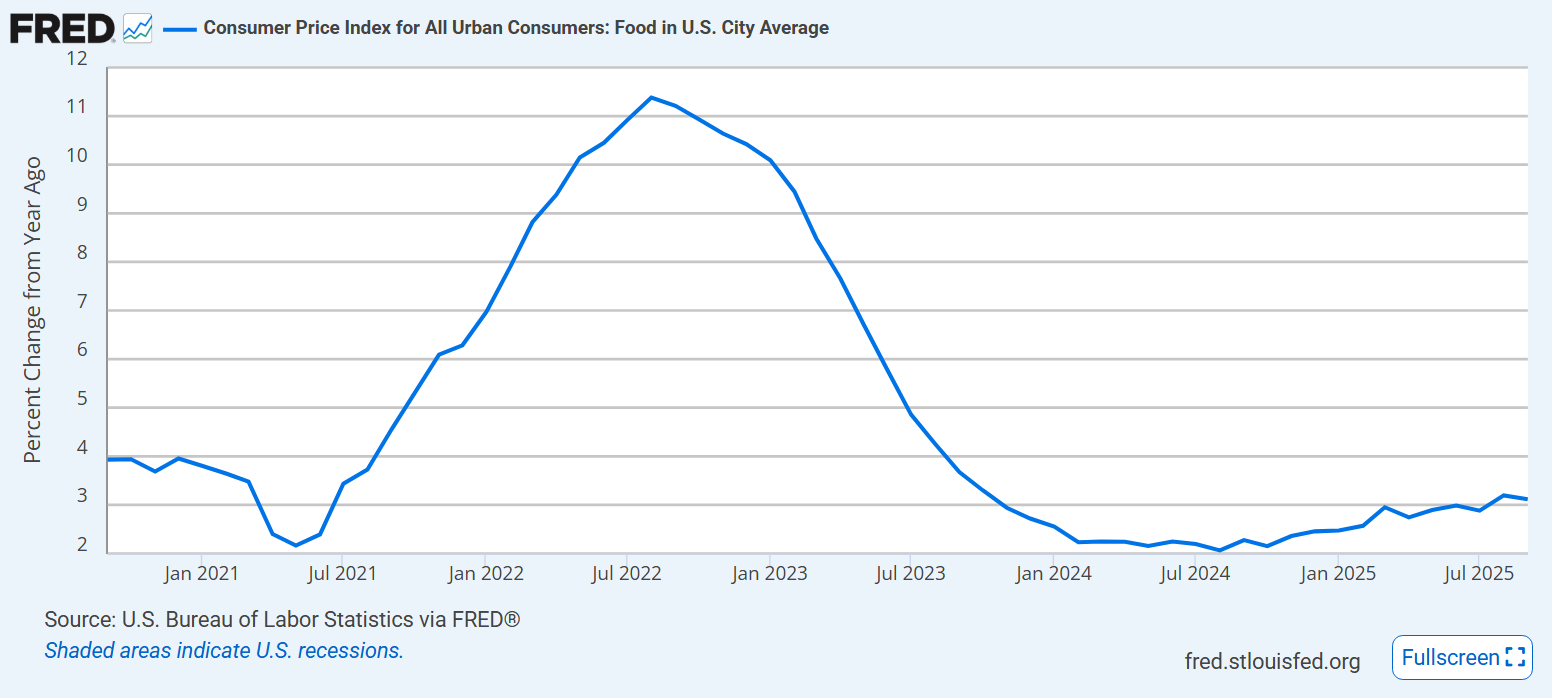
Food prices are more volatile than most. Inflation reached 11% in 2022. It approached 2% in 2024 but has since increased to 3% annually.

Energy

Energy prices jumped in the first 2 years of recovery from the pandemic. They have been flat since then. Trump has cancelled $8B worth of previously authorized energy projects.

https://www.pbs.org/newshour/politics/white-house-cancels-nearly-8b-in-clean-energy-projects-in-blue-states

Gas prices averaged $2.50/gallon before the pandemic, spiked up to $4.50/gallon during the recovery and settled back to $3.00/gallon for the last 3 years.

Tariffs

US consumers enjoyed immaterial average import tariff rates for the last 50 years. Trump has levied an 18% tax on imports, increasing costs for American consumers of the 14% of their consumption that is imported. The inflationary impact of the Trump tariffs has not yet been passed along to consumers. The frequent changes in tariff rates have led businesses to absorb costs in the short run. This will not continue.

Tax Collections

https://www.nysscpa.org/news/publications/the-trusted-professional/article/irs-budget-to-decrease-37-in-2026-from-2025-proposes-a-decrease-in-employees-061125#:~:text=The%20last%20time%20the%20number,filing%20season%2C%20the%20Treasury%20stated.

Trump invests fewer resources in collecting taxes, reducing budget deficits and reducing inflation.

Labor Unions as a Force to Increase Wages

https://www.epi.org/blog/trump-is-the-biggest-union-buster-in-u-s-history-more-than-1-million-federal-workers-collective-bargaining-rights-are-at-risk/

No support from Trump for increased labor union power.

Improve Government Efficiency

https://en.wikipedia.org/wiki/Department_of_Government_Efficiency

https://www.cbsnews.com/news/trump-firings-watchdogs-inspectors-general-60-minutes/

Marginal results from the highly publicized DOGE efforts, despite very large opportunities for improvement.

Government Shutdown Waste

A $10 billion-dollar permanent loss of output.

https://www.politifact.com/article/2025/oct/31/federal-shutdown-cost-economy-trump/

No Tax on Tips

This recent tax change benefits individuals with enough income to pay federal income taxes, so improves affordability for an estimated 4 million people.

https://bipartisanpolicy.org/explainer/how-does-no-tax-on-tips-work-in-the-one-big-beautiful-bill/

No Tax on Overtime [Premium Pay]

This recent tax change exempts the overtime premium from federal taxation, so promotes affordability for hourly wage earners.

Extra Senior Federal Tax Deduction

This provision of OBBA benefits low to moderate income households aged 65 and older. Many experts criticize its structure, but it clearly makes life more affordable for those who benefit from the change.

.https://taxfoundation.org/blog/obbba-senior-deduction-tax-relief/

Higher Limit for State and Local Tax (SALT) Deductions

Higher income taxpayers who itemize deductions received a significant federal tax reduction. This change does not benefit most low to moderate income households.

https://www.fidelity.com/learning-center/personal-finance/SALT-deduction-increase

Increased Cost and Reduced Availability of Child Care

The OBBBA increased tax credits to partially offset childcare costs. Critics considered these changes to be inadequate, noting that a “pro-family” political party should do better.

https://www.pewresearch.org/short-reads/2024/10/25/5-facts-about-child-care-costs-in-the-us/

https://www.usatoday.com/story/money/2025/07/12/trump-child-care-tax-credit-changes-details/84505810007/

https://tcf.org/content/commentary/the-top-five-trump-attacks-exacerbating-the-child-care-crisis/

Real Dollar Hourly Compensation

Real, inflation adjusted, compensation is slowly recovering towards its pre-pandemic level.

Tight Immigration Policies

Greatly reduced net immigration will tighten the labor supply in some industries, leading to higher compensation for some workers and higher prices for consumers. Economists have not reached a consensus on the net impact to the typical American.

Fires Bureau of Labor Statistics Chief

https://www.cbsnews.com/news/trump-firings-watchdogs-inspectors-general-60-minutes/

Summary

Inflation continues at 3% annually. Real wages are keeping up with inflation. The memory of large price increases in 2022 that were never reversed seems to have reset inflation expectations from 1-2% to 3-4% per year. Some tax law changes in the One Big Beautiful Bill meaningfully cut taxes. Fiscal policy remains very loose and drives inflation. Monetary policy is considered neutral by most economists, but Trump is trying to loosen it, which risks further inflation. Trump’s “on/off” tariff negotiations have not yet driven large consumer price increases but have slowed business investments. Trump’s claims to have improved “affordability” rest on his specific actions that point in that direction, not on the economy wide statistics or large-scale policies that might significantly improve affordability for the “average” family.
Good News: The Business Cycle is Done

https://www.yourobserver.com/news/2023/dec/01/construction-begins-legacy-trail-overpasses/

From 1945 through 1985 the US economy regularly accelerated its growth, reached a peak, fell back and then recovered. Businesses, economists, politicians and the public expected that this 3-5 year business cycle would continue forever.

Looking back, it seems like the business cycle was broken by 1985. All of the subsequent downturns have been prompted by extraneous, outside of the system, shocks. In 1990 a second global oil shortage shock.

https://en.wikipedia.org/wiki/Early_1990s_recession_in_the_United_States

In 2000-2001, a stock market bubble popped.

https://en.wikipedia.org/wiki/Early_2000s_recession#:~:text=A%20combination%20of%20the%20Dot,Inverted%20yields%20in%20early%202001.

In 2007, a mortgage lending bubble popped.

https://en.wikipedia.org/wiki/Great_Recession

In 2020, a pandemic driven recession, followed by a very unexpected rapid recovery.

https://en.wikipedia.org/wiki/COVID-19_recession

40 years without a classic business cycle recession is long enough to claim victory.

How could this happen? The independent Federal Reserve Bank has maintained a neutral monetary policy. We have not “shot ourselves in the foot” and we have implemented reasonable policies to offset external shocks. The federal government budget deficit has generally returned towards zero following depression periods. Automatic stabilizers and congressional action have addressed recessionary periods with enough stimulus to stop economic decline and restart recovery.

More importantly, the structure of the US economy has changed. The share of high fixed cost manufacturing has declined as “services” has increased as a share of the total economy. The share of international trade (imports and exports) less directly connected to the domestic economy alone, has increased. The power of labor (unionized or not) has fallen, allowing firms to reduce hours and real wages during a downturn. In most recent times, firms better recognize the cost of attracting and developing highly skilled labor in a complex production world, so they retain key staff even during downturns. Vertical integration has been reduced, allowing firms to respond to minor demand changes more effectively. Based upon the quality revolution, major firms have reset their capacity utilization targets to 80% rather than 95%, providing firms with greater flexibility in managing variable demand and not reaching the point where internal costs increase and the need to increase prices occurs.

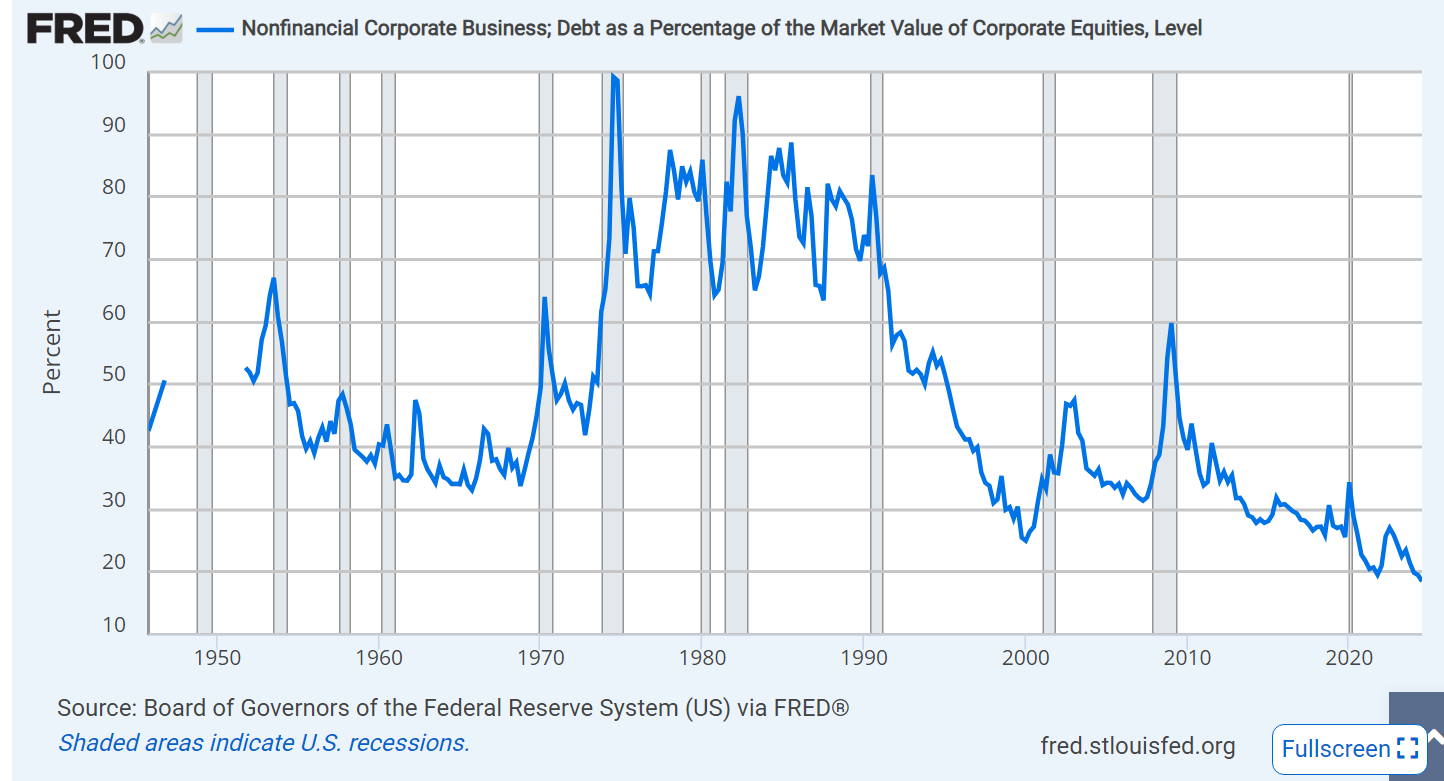
Financial leverage has also decreased. US firms have access to deep bond markets so are they able to incur only necessary levels of indebtedness.

Even with a much greater level of imported goods, retailers hold lower levels of inventory, allowing them to not overreact to changes in demand. Firms have more effective supply chain management processes.

The unemployment rate also shows this structural change. When it was pushed below 5% in the 1960’s, inflation increased and was not permanently checked for 20 years. By 2000 the economy was able to expand and keep unemployment below 5% for extended periods of time without triggering “cost-push” inflation. Unemployment still increases during an economic downturn, but low unemployment does not seem to trigger a recession.

From the 1950’s through the 1980’s inflation tended to increase as the economy overheated before a reduction in credit availability would slow the overall economy. Aside from the Covid pandemic shortages, we no longer see major inflation increases.
Impact

The business cycle caused firms to underinvest because the best available forecast was always that the boom period would be interrupted in 1-5 years. Sales, margins and profits could not be assumed to increase forever.

The business cycle caused firms to follow a stop-start pattern for capital investment projects, process improvement, research & development, new product introduction, new markets, new channels and mergers & acquisitions. Seeing a downturn, firms would cancel existing initiatives, even at a significant cost, in order to conserve cash and signal to stakeholders that management was actively managing the business. Projects would slowly resume after it was clear that the business cycle recovery was under way 2 years later.

For individuals, the “last hired, first fired” cycle applied. Firms froze open position hiring. They released interns and summer workers. They prohibited overtime. They cancel contracts with temporary labor firms. Less experienced workers and minority groups suffered. Labor intensive industries, especially construction, were hard hit. Smaller firms closed. The hiring cycle would resume 2 years later.

Historically, stock market values also followed the pattern of the business cycle closely. Stock market declines were seen as an “early warning” indicator by forecasters. Since stock market values are theoretically determined by a risk-adjusted discount rate, the reduction of business cycle variability allows investors to use a lower interest/discount rate and value future earnings at a higher net present value.

Summary

The business cycle appears to be gone. The modern economy does not have the same high fixed costs it once had. Firms are able to increase their sales, profits and capacities in tandem without greatly overshooting the mark. Our national institutions help to keep growth at a sustainable level. Workers, firms, investors and society all benefit from this great advance, even if it is not publicly celebrated.

The US Economy is Already Great: No Tariffs Required

https://www.wkar.org/arts-culture/2014-05-12/oh-say-can-you-see-we-stand-on-guard-for-thee-exploring-a-hypothetical-us-canada-merger

The president-elect’s tariff threats are rejected by all professional economists and almost all business leaders. They are mistakenly intended to provide international relations negotiating leverage, force firms to build US factories, and increase domestic manufacturing employment employment. They are based upon the misguided belief that the US economy is broken. It is ironic that Democrats and liberal have trumpet the amazing condition of the US economy.

2 Million Obsolete Jobs Eliminated

45 Million Highly Skilled Jobs Added

13 Million Health Care Jobs Added

Labor Productivity More than Doubled

Real GDP Up 7X, As Manufacturing Share Cut in Half

Manufacturing Output Up by One-Third in Last Decade

US Still Produces 10 Million Vehicles Per Year

25 Million Jobs Added Since Great Recession

1 Million Available Manufacturing Jobs

US Economy Creates 2 Million Net New Jobs Year after Year

New Business Creation At 25 Year High

Biden versus Trump Economies

The US economy continues its evolution from agriculture to manufacturing to services to information. President Trump was responsible for the US economy from February, 2017 through January, 2020. President Biden assumed responsibility in February, 2020. In order to compare the two presidents, let’s look at Trump for the 3 years of sustained growth deep in the business cycle before the pandemic. For Biden, let’s look at a comparable 3-year period from June 2021 through June 2024, after the post-Covid rebound. Trump benefitted from an 8-year long business cycle expansion. Biden had to deal with a once in a century pandemic driven economic depression.

Inflation: Advantage Trump

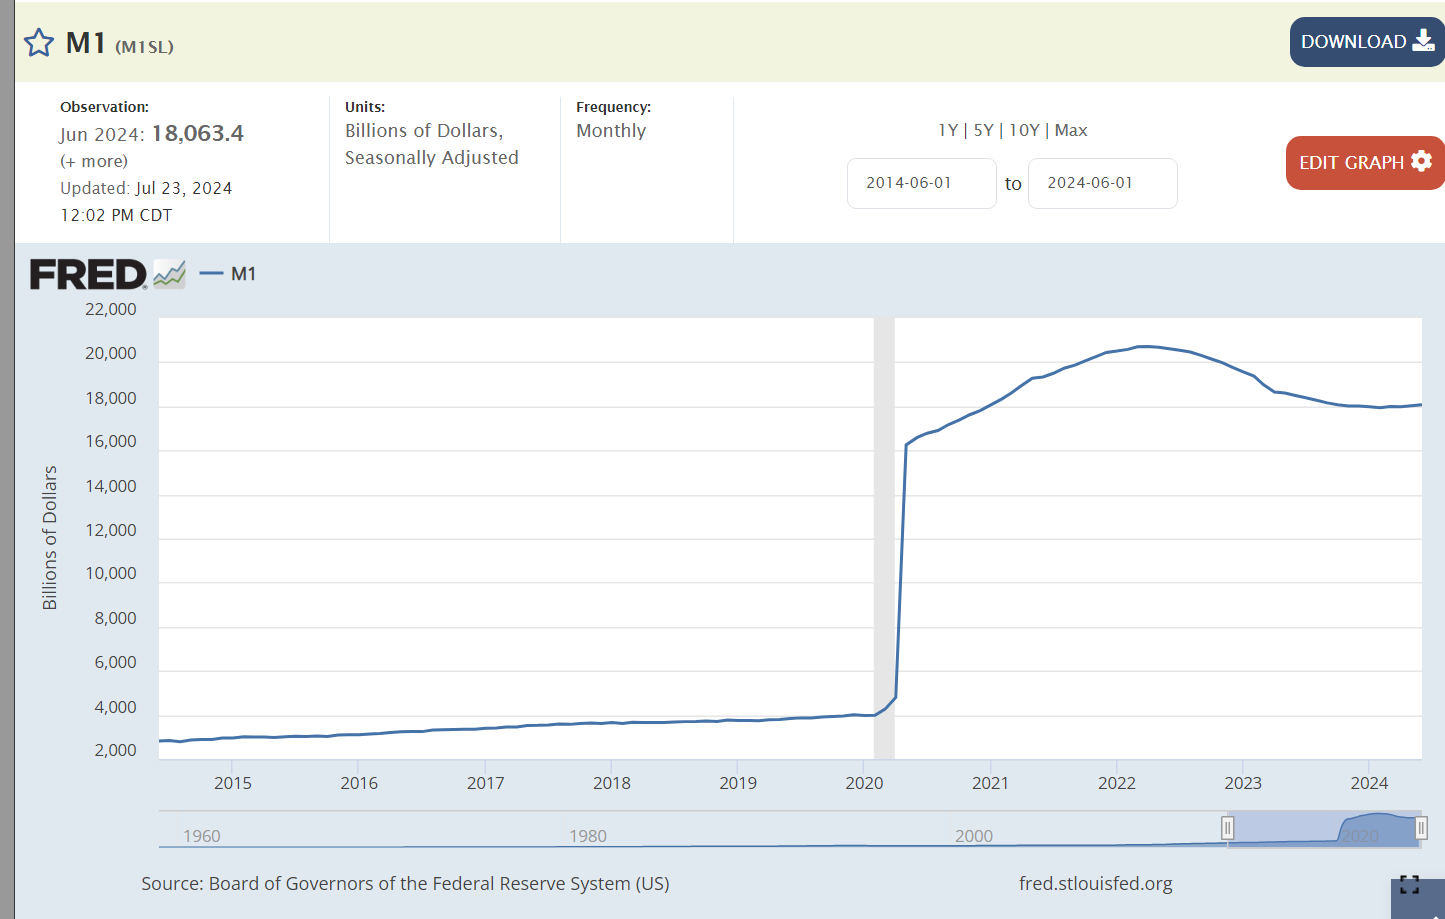
The independent Federal Reserve Board responded to the pandemic by greatly increasing the money supply to ensure that profitable, well-run financial institutions would be able to survive the temporary disruptions in the real economy. The Fed increased the money supply by 4-5 times its prior level to ensure the economy did not collapse! The extra money supply had to end up somewhere. It drove up consumer prices and increased asset values in the stock market and for home prices.

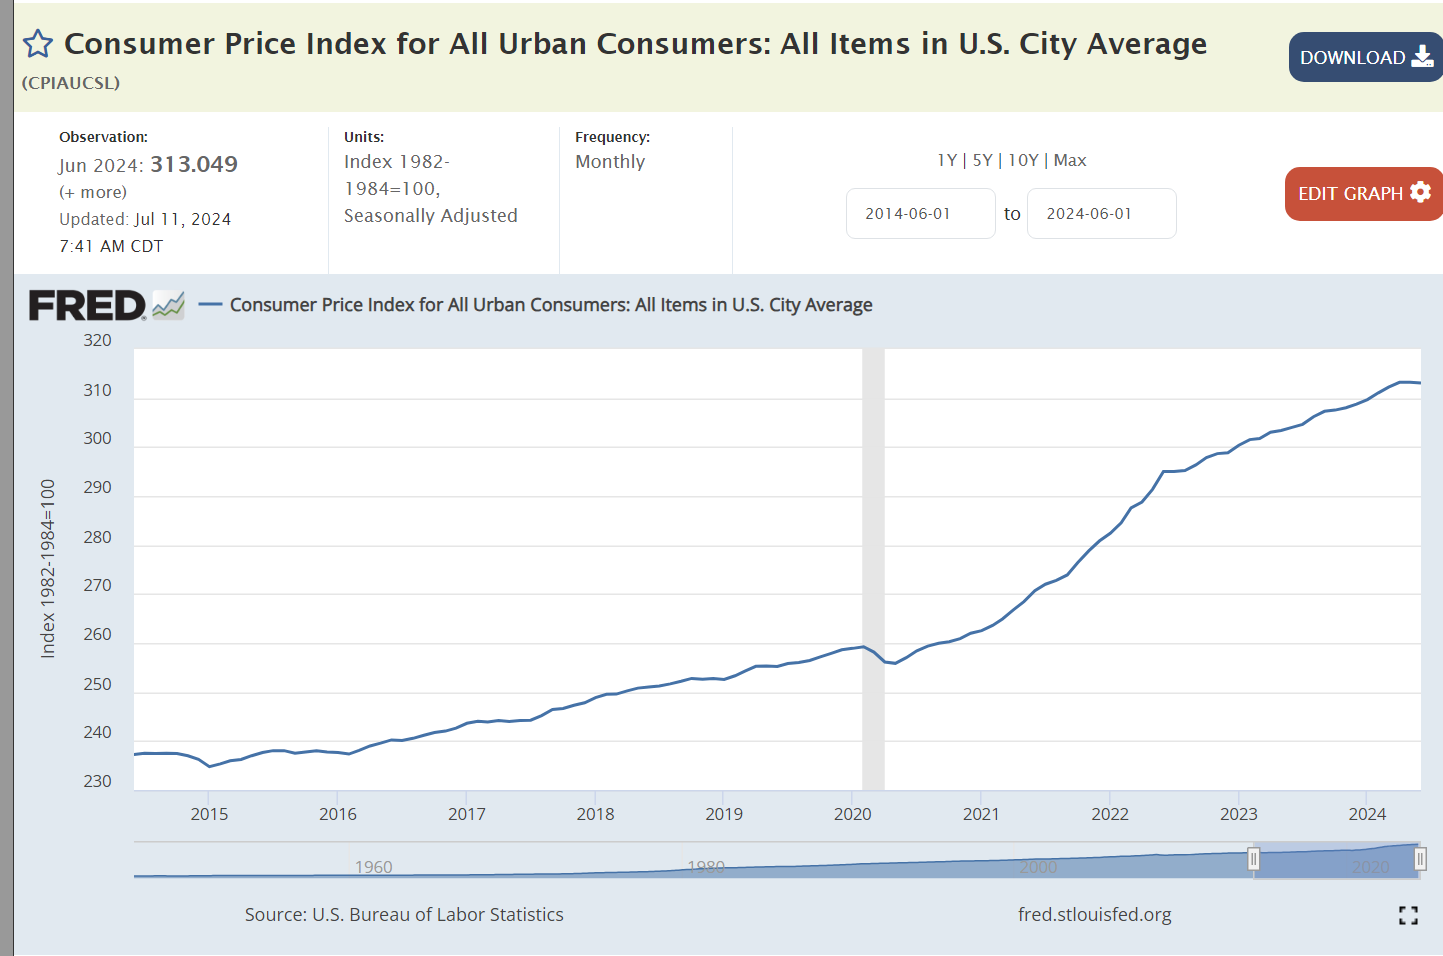
Inflation grew by 2% per year with Trump. It grew by 5% per year, on average, with Biden. Overall prices are 9% higher with Biden. Trump’s economic policies extended the Obama recovery for 3 years without triggering an increase in inflation, despite a low unemployment labor market.

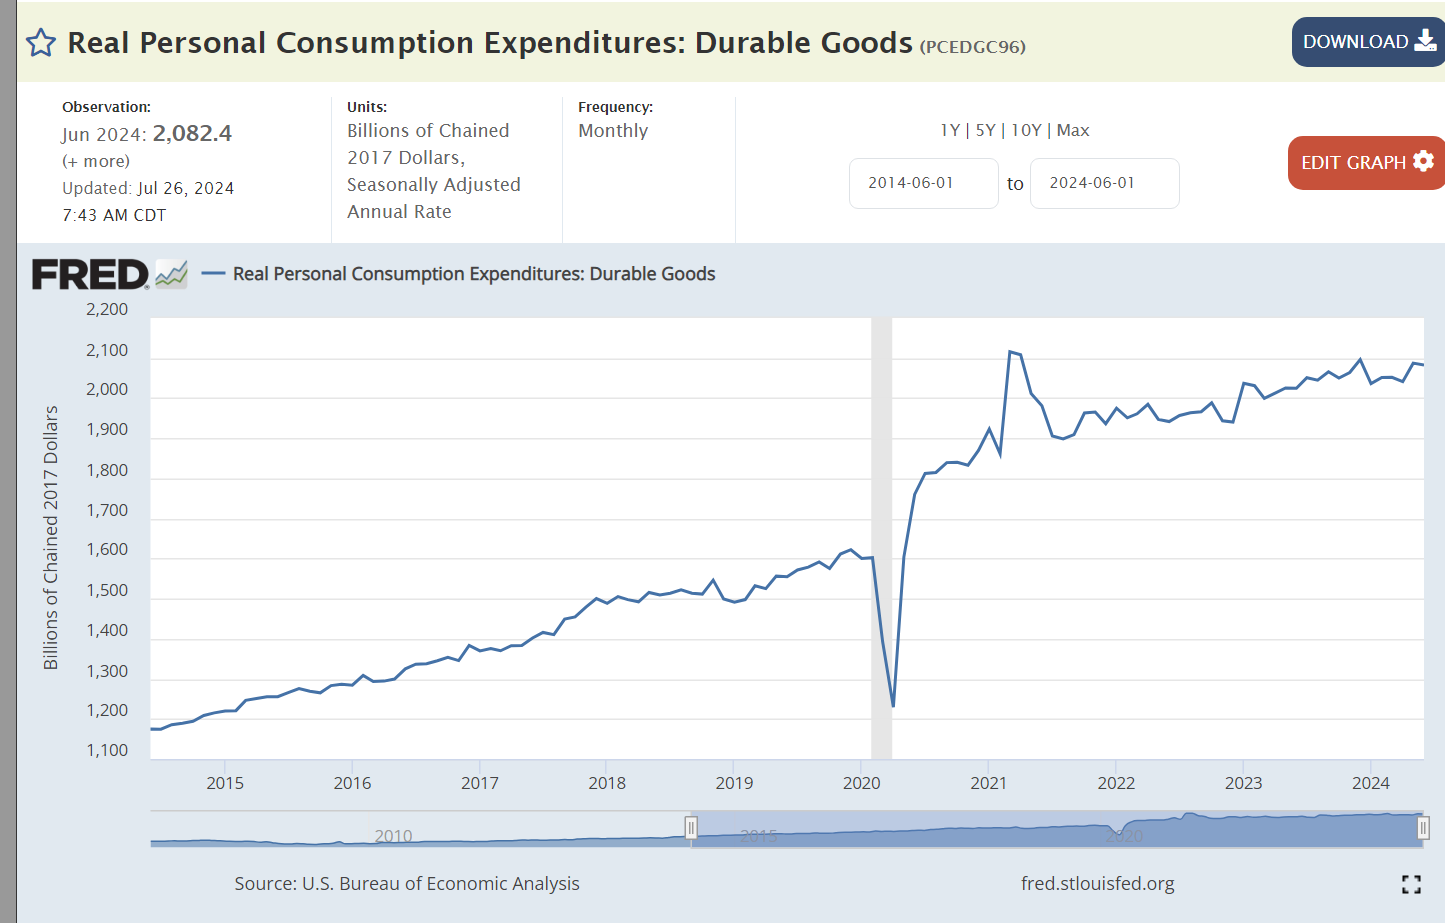
The largest cause of higher than usual inflation in Biden’s term was the 20% spike in US and global demand for durable goods. Factories shut down during the pandemic. Demand rebounded within 6 months as consumers chose to spend money on goods rather than in-person services. Consumer demand at the end of the Biden period is 50% higher than at the start of Trump’s term in office.

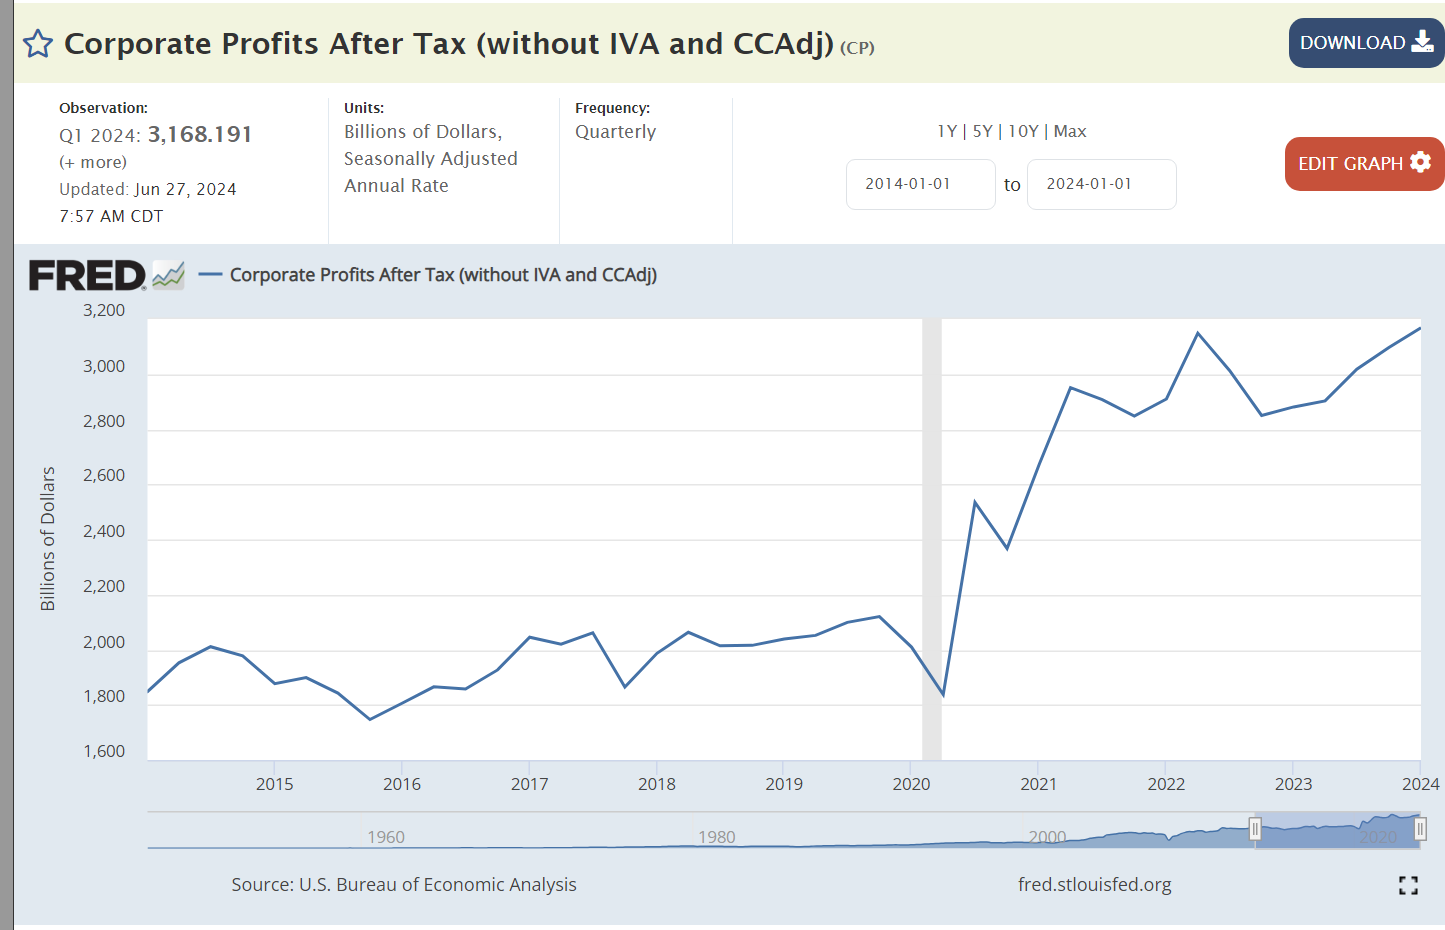
Corporations were able to capture and maintain a 50% profit increases due to market disruptions of the pandemic. Experts mostly reject Biden’s claims that corporate profits were the main driver of inflation, but they clearly aggravated the impact of the supply chain disruptions.

Obama was able to reduce federal budget deficits by two-thirds by the end of his presidency. Deficits doubled on Trump’s watch before the pandemic arrived. Biden cut deficits from their record highs during the pandemic, but they have been 50% higher than the pre-pandemic Trump era. Most economists consider the budget deficits to be the main cause of the continued higher than typical rates of inflation, accounting for 3%, 2% and 1% extra inflation in the 3-year Biden time we’re considering.

High profile gas prices remined flat during Trump’s period. Global supply and demand caused prices to increase from $2.50 per gallon to $3.50/gallon where they have remained for the last 3 years.

Trump enjoyed historically low 4% mortgage interest rates, a thin 2% above the inflation rate. The expansion of the money supply drive rates down to 3% during 2020 and 2021. They rose to 7% as inflation rose sharply and has stayed there. Inflation has fallen but markets typically require years of data to reset expectations of long-term inflation which drive mortgage rates. The Federal Reserve Bank has hesitated to cut its benchmark interest rates until inflation is clearly approaching its 2% target.

Labor Market: Advantage Biden

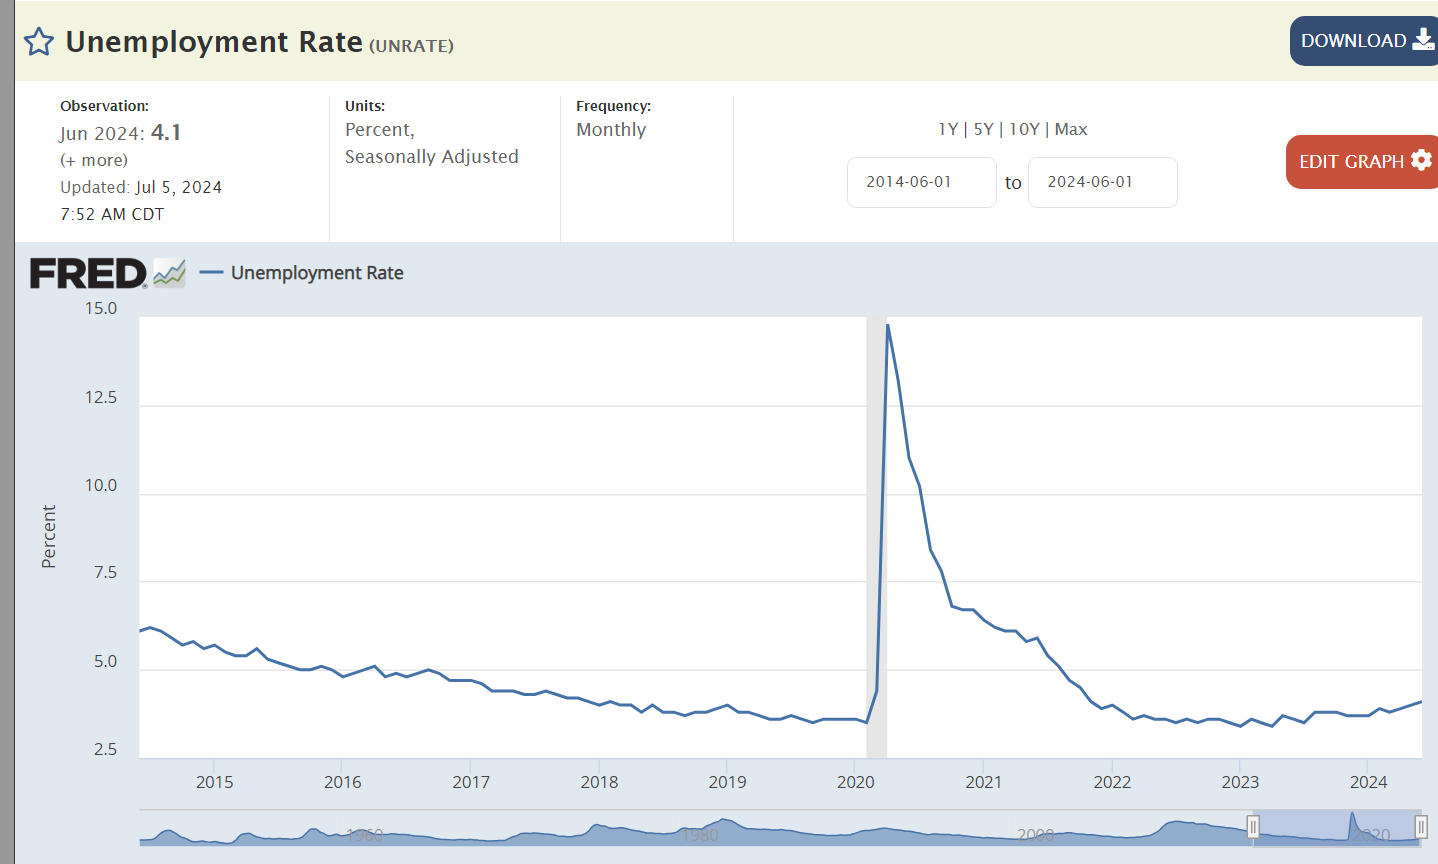
Trump reduced unemployment by 1%. Biden reduced it by 2%. Both presided over best in 50 years overall labor markets.

Layoffs have remained at historic lows, with Biden enjoying slightly lower rates.

Job openings in the Biden market have been 50% higher than the Trump market, reflecting a strong economy with growing labor demand, despite the impact of the pandemic.

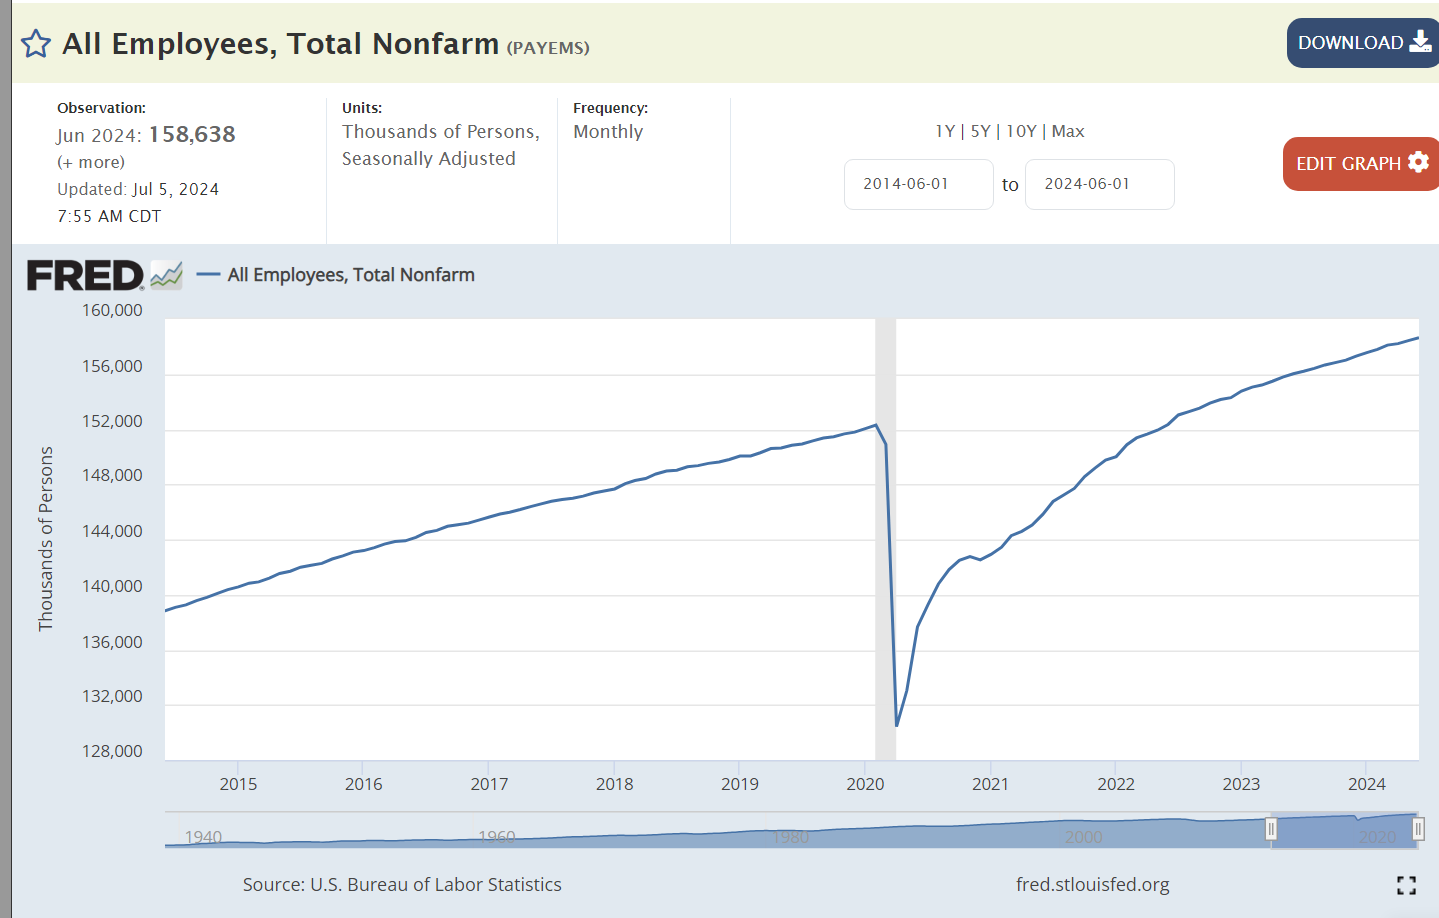
The Biden economy recovered all 20 million jobs lost in the pandemic within 2 years, much faster than expected. Total employment has continued to grow at the trend rate to a record 159 million.

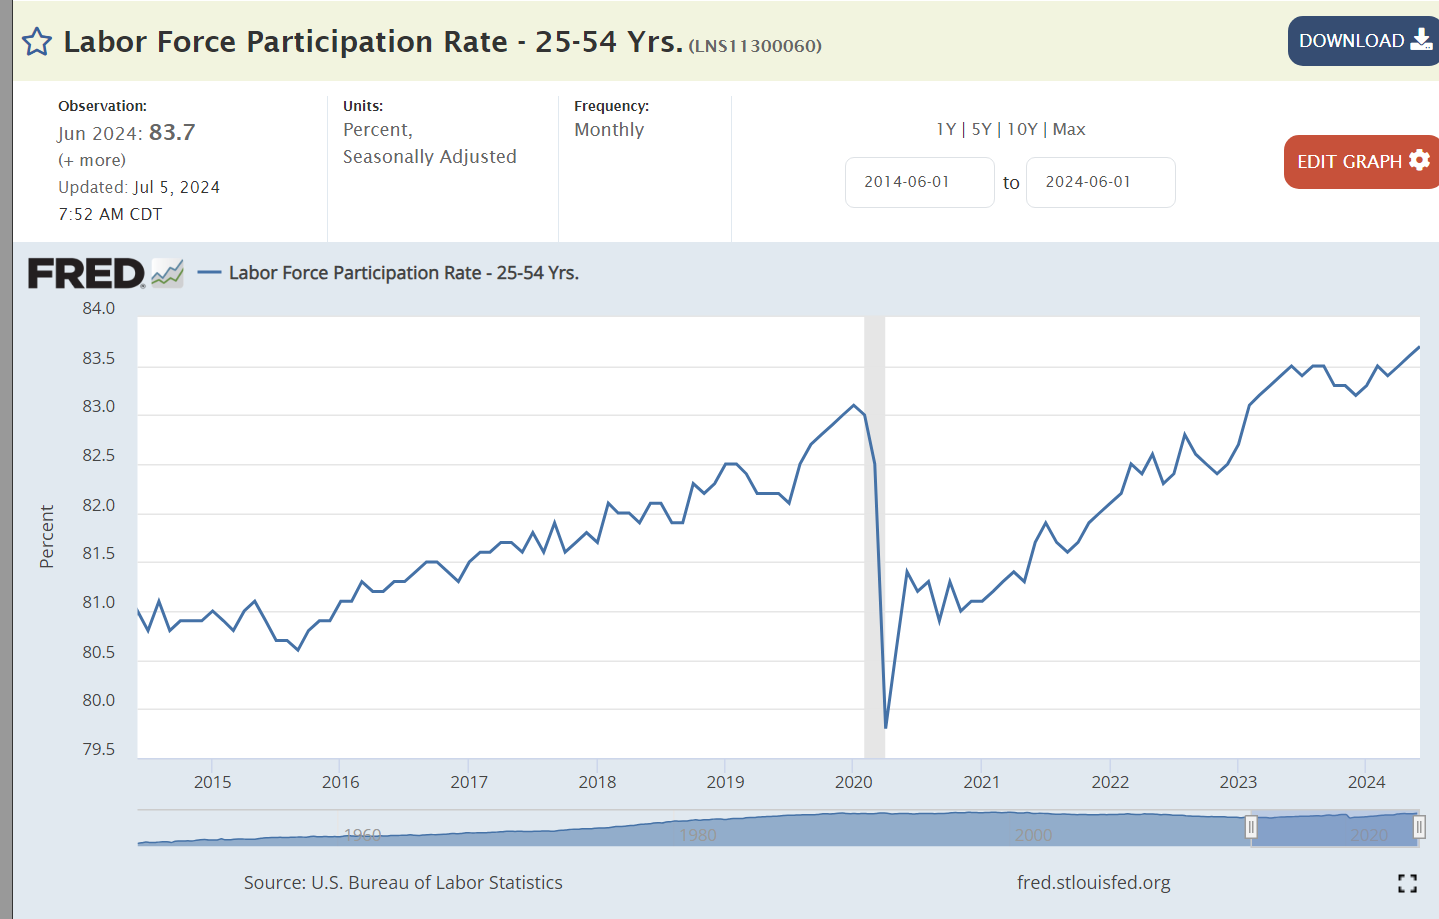
Core labor force participation is 1% higher with Biden than Trump. The current participation rate was last achieved in 2001.

Median real wages have been slightly higher during Biden’s tenure.

Asset Values: Advantage Biden

Despite the pandemic disruptions and losses, US firms are worth 70% more today than before the pandemic. This reflects the 50% profits increase and continued positive future prospects.

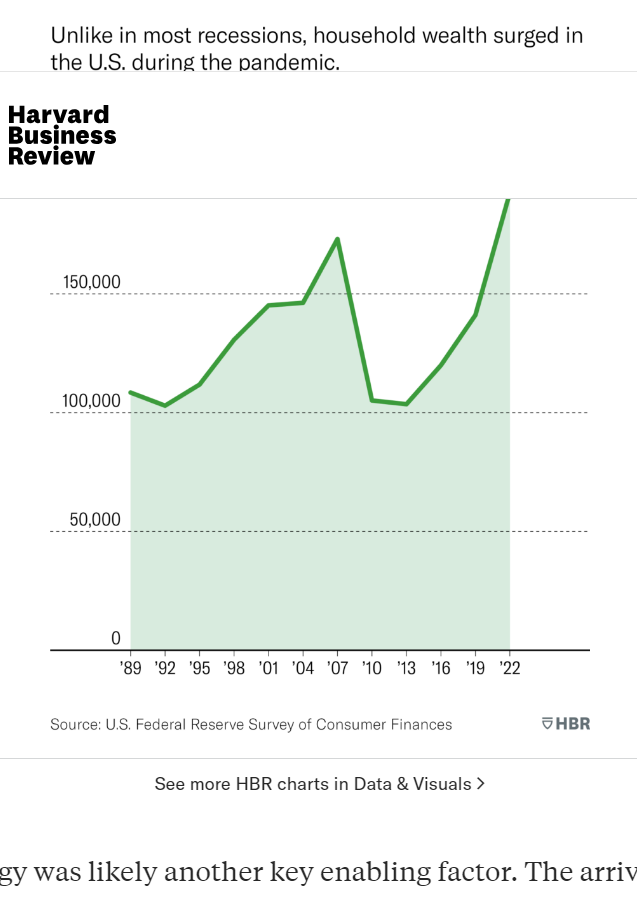
Home prices have nearly doubled since before the pandemic, reflecting the post Great Recession decline in home building, construction issues during the pandemic and general asset inflation caused by the rapid expansion of the money supply.

The US enjoyed a solid 7% savings rate before the pandemic, an extraordinary high 10% after the pandemic, falling to just 4% for the last 3 years.

https://educationdata.org/number-of-college-graduates

Human assets increased during Trump’s presidency and resumed growth after the pandemic. As college graduation rates have increased throughout the post WWII years, the cumulative number of college educated individuals continues to rise each year. The growth in masters and professional degrees is noteworthy.

The Economy – Advantage Biden

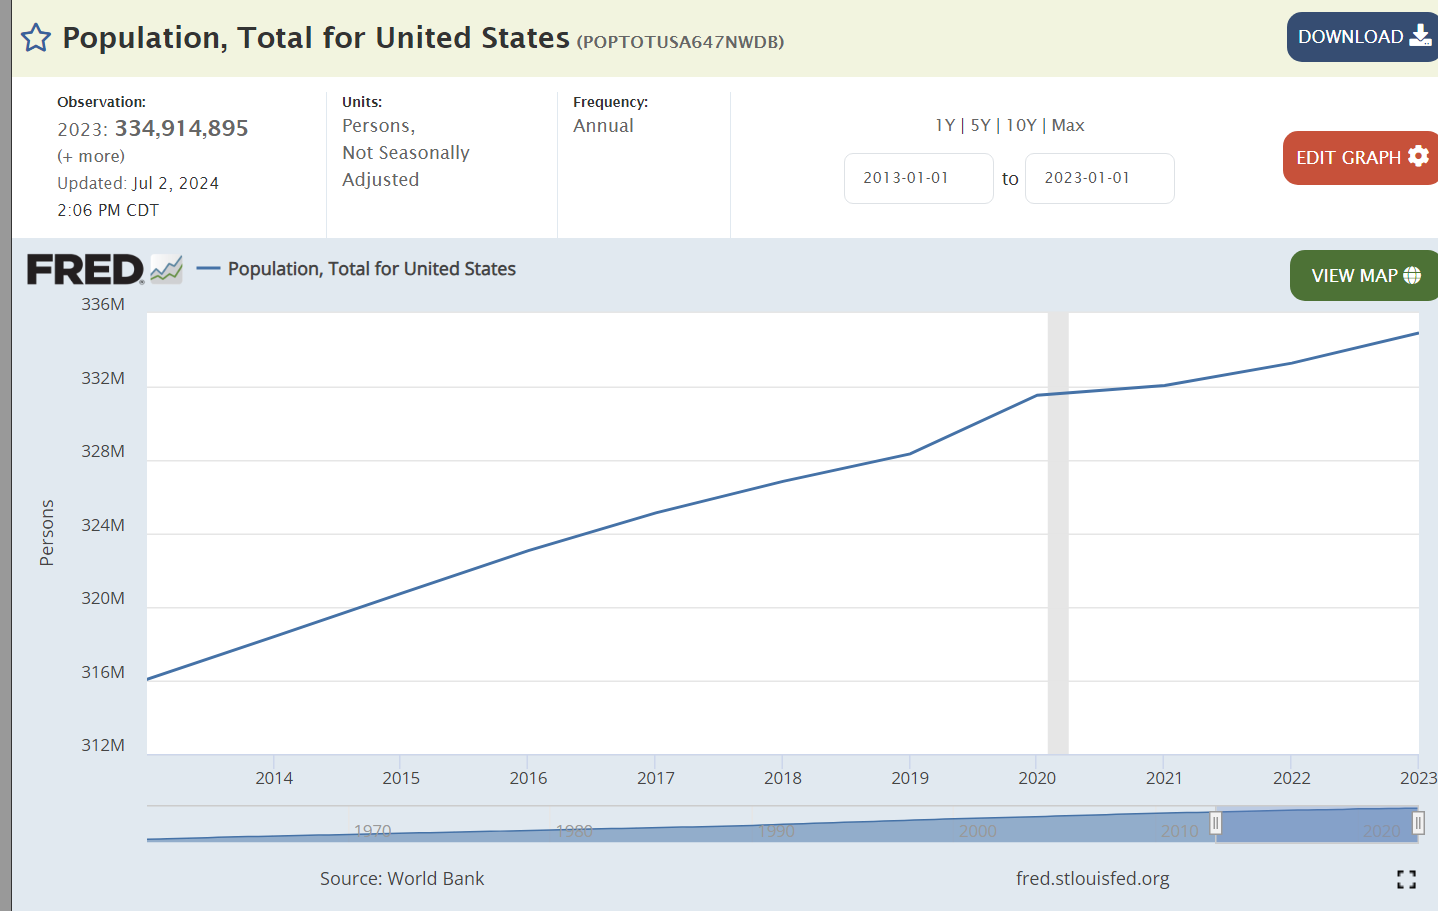
Population growth has resumed after the pandemic.

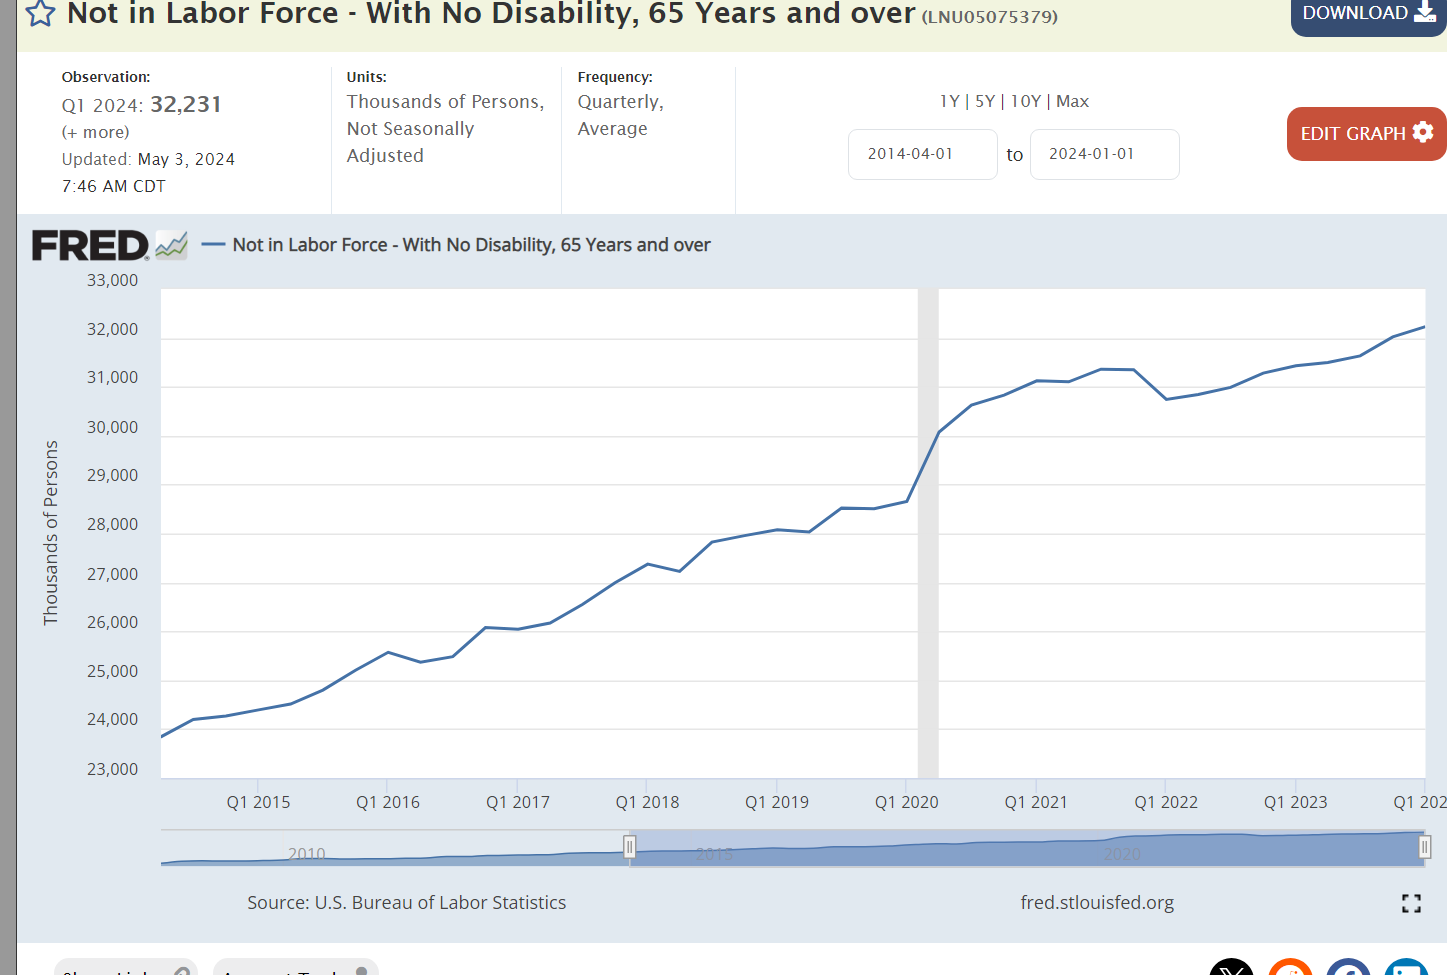
The healthy US economy is able to support 3 million more retirees after the pandemic.

Real dollar GDP is 2 trillion dollars larger than before the pandemic disruption. That increase is the same size as the total GDP of Russia, Canada or Mexico. We added the Canada economy during Trump’s time and the Mexican economy during Biden’s time.

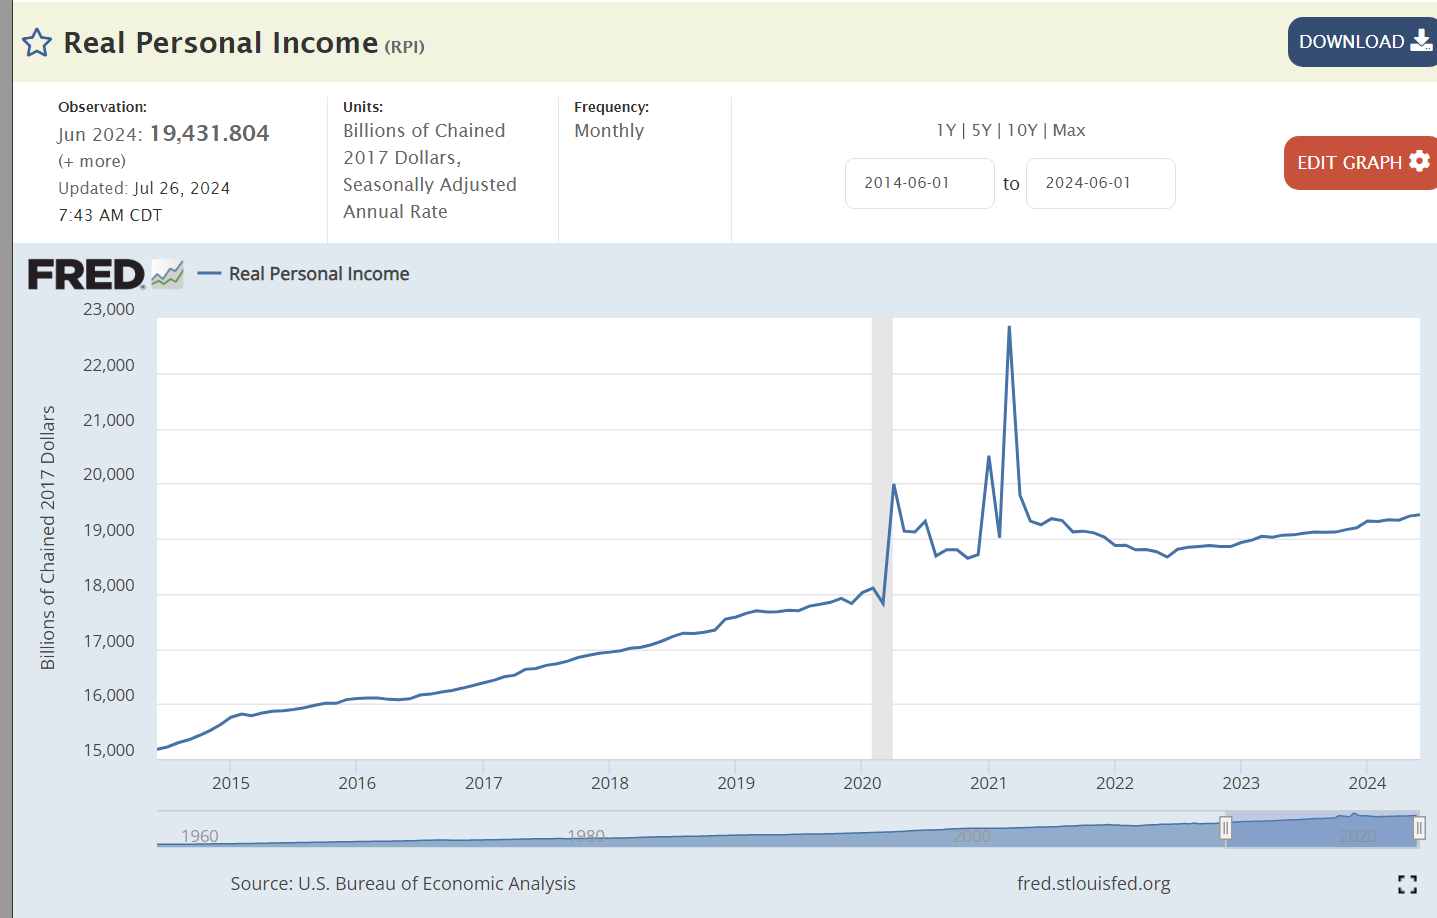
Real personal income grew a little bit faster during Trump’s time and more smoothly. Personal incomes jumped up during the pandemic but have been flat since that time with corporations capturing a greater share of the economy’s returns.

Workers have been 8-10% more productive in the Biden economy.

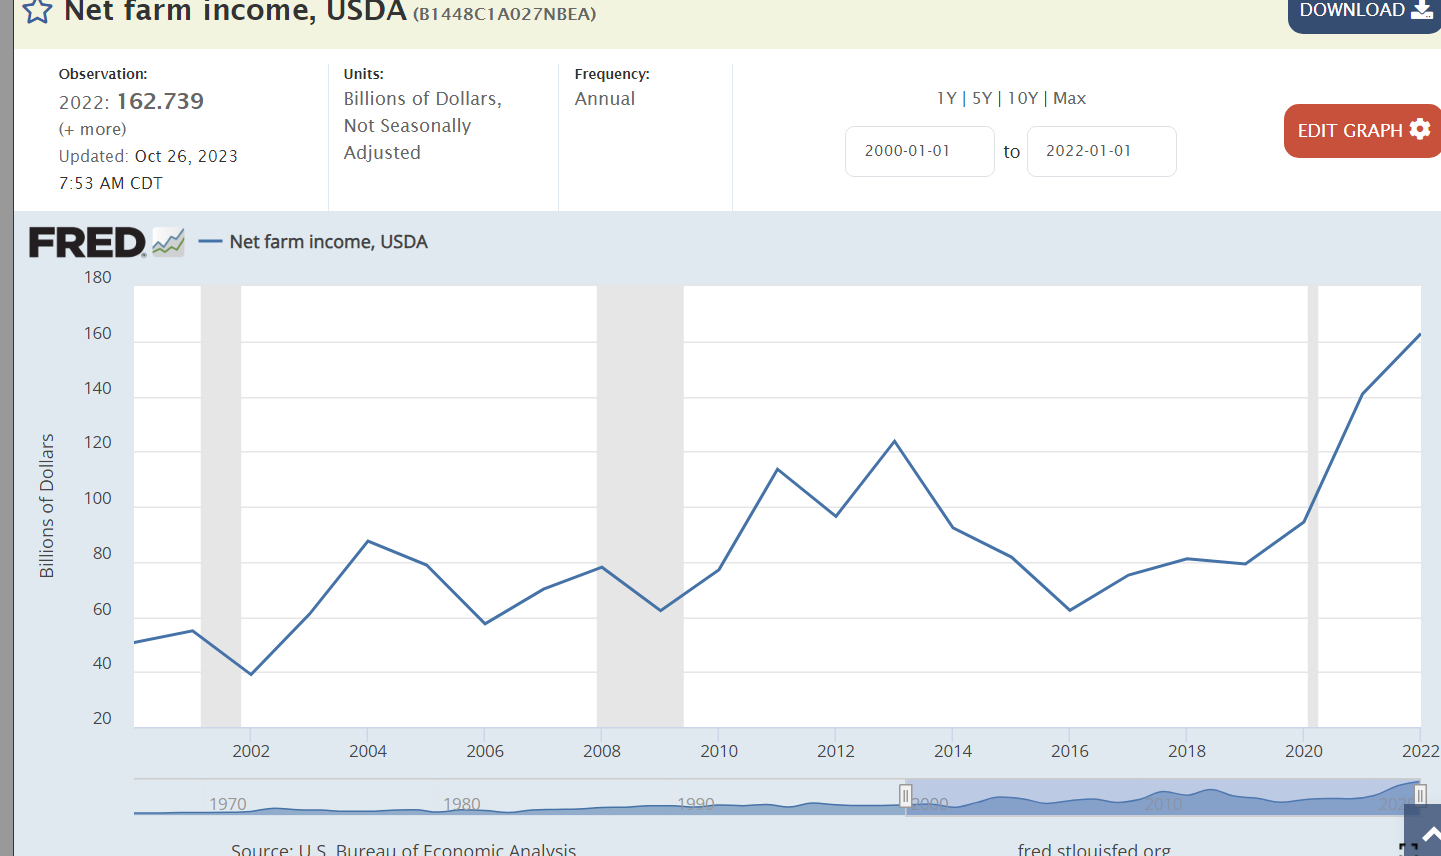
Farm income has doubled in the Biden economy.

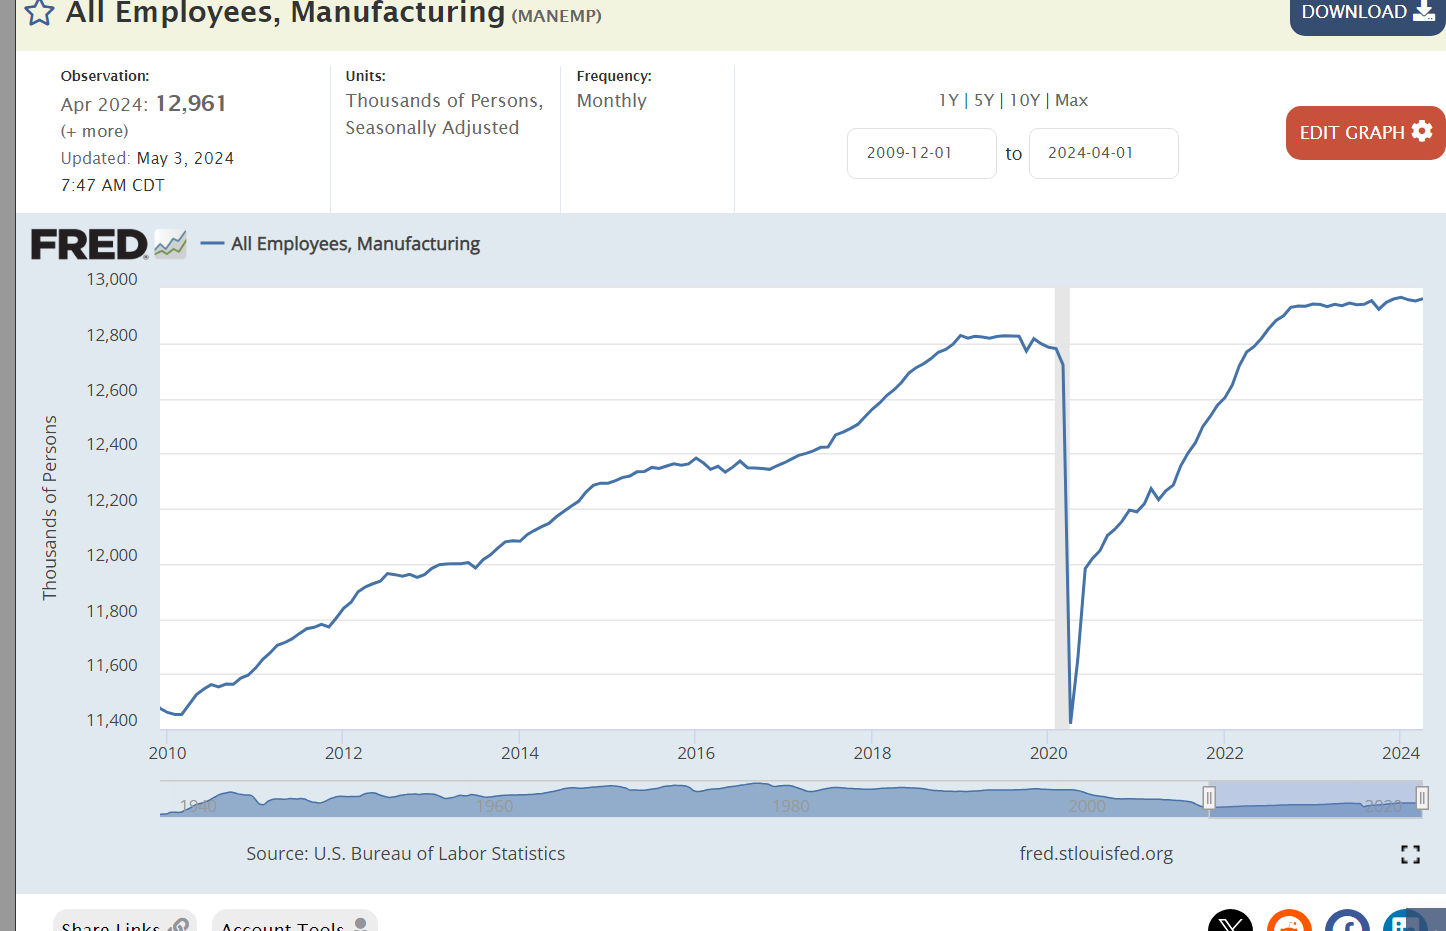
Manufacturing employment grew by a surprising 3% in Trump’s term. It is slightly higher in the Biden era.

Real dollar exports increased during the Trump presidency and then again during Biden’s time despite a greatly stronger US dollar which hampers exports.

The world is willing to pay 10% more to hold US dollars in the Biden period, reflecting strong economic realities and prospects despite the risks of higher US inflation and budget deficits.

Summary

The US economy is very strong. Trump was able to extend the Obama recovery for longer than most expected, keeping inflation, interest rates and unemployment at low levels. Biden managed the recovery from the pandemic induced recession better than expected. The economy, asset prices and labor market have recovered very nicely. Inflation has remained the weak part of the Biden economy. It is lower than in comparable global economies and trending towards the 2% target in 2025. Critics point to excess government spending as an avoidable source of high inflation.

The Trump economy built upon the success of his predecessor. The Biden economy overcame the disruption of the pandemic to produce equal or greater results. Both presidents delivered solid results.

Record US New Firm Creation in a Resilient Economy

https://www.eso.org/public/news/eso1225/

I encourage us to always “look at the big picture”: across time, nations, industries, occupations, institutions and political views when considering the “state of the economy”.

Recent surveys indicate that many (partisan) Americans believe that the economy is in recession, the stock market is down, and unemployment is up (false). The US economy continues to lead the world out of the pandemic driven recession. I’ve documented the tremendous strength of the US economy in GDP growth, job creation, wage growth, profit growth and wealth creation. Today I’d like to focus on entrepreneurship and new firm creation, where the US once again leads the world.

The US economy led the world in creativity, technology, job growth and firm creation in the 1990’s as it recovered from the global economic challenges of the late post-war era. The deregulation and technology driven changes produced benefits into the “oughts”, the first decade of the new century. Unfortunately, the dynamic pace of new firm creation based on economic, trade, relocation and technological changes did not strongly continue in the first 20 years of 21st century. New firm creation lagged. Larger firms held onto jobs as they consolidated industries and protected their positions. Venture capital firms facilitated the most successful new companies to quickly expand market share and vanquish weaker competitors. Many Schumpeter disciples worried that the engines of “creative destruction” had lost their momentum and effectiveness.

The Great Recession of 2007-10 destroyed wealth, slowed economic growth, job creation and new firm starts. The Obama-Trump expansion was longer than expected by historical standards, but slower growing. Many critics and commentators concluded that the US had “lost its entrepreneurial spirit”.

https://hbr.org/2024/01/how-the-pandemic-rebooted-entrepreneurship-in-the-u-s

New firm creation since the pandemic has basically been 50% higher than before the pandemic.

This is an AMAZING and unexpected result for the US. During the pandemic, economic activity ground to a halt. Supply chains stopped functioning. People stayed home. 20 million jobs were lost. 1 million lives were lost in the US. Many firms closed. Global trade and military tensions increased. Trust in governments, corporations and other institutions was damaged. In 2020, there was no reason to believe that the pandemic would be medically controlled soon, or that economic growth would quickly rebound and resume its trend growth rate. But it did!

https://www.census.gov/econ/bfs/current/index.html

The IRS tracks new firm tax license applications. Most firms never really do business, but the ratio of initial applications to real firm creations has been stable through history. The Census Bureau has determined which subset of IRS license applications leads to real new firm creations. Both measures show the tremendous 50% increase between the pre-pandemic and post-pandemic eras.

As Wendy’s Clara spokeswoman exclaimed long ago, “show me the beef”. Did the increased rate of tax applications during 2021-22-23-24 result in new firm creation?

Firms less than one year old are up 16%, not 50%, still a significant increase.

https://www.whitehouse.gov/cea/written-materials/2024/01/11/new-business-surge-unveiling-the-business-application-boom-through-an-analysis-of-administrative-data/

New firms are up by about one-third by this measure.

https://www.bls.gov/news.release/cewbd.t08.htm

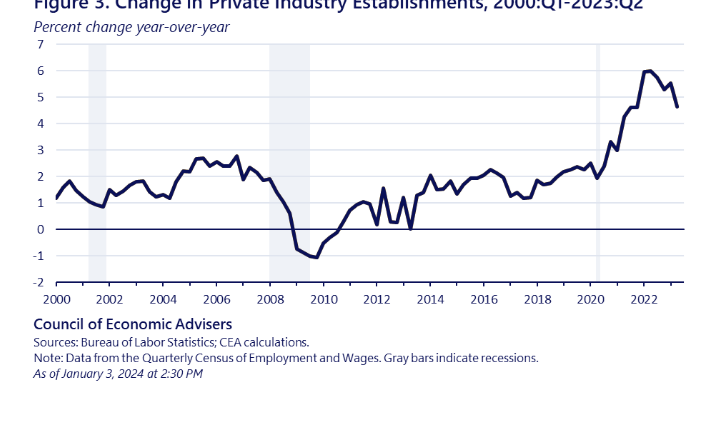
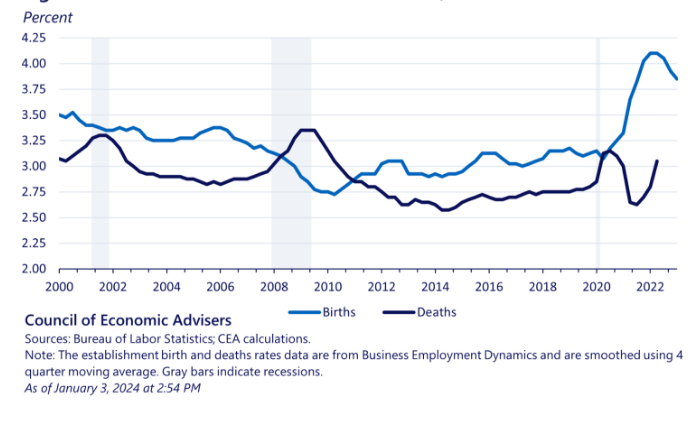
The growth rate of private industry establishments has accelerated.

https://www.whitehouse.gov/cea/written-materials/2024/01/11/new-business-surge-unveiling-the-business-application-boom-through-an-analysis-of-administrative-data/

Three measures reinforce the growth of new firms.

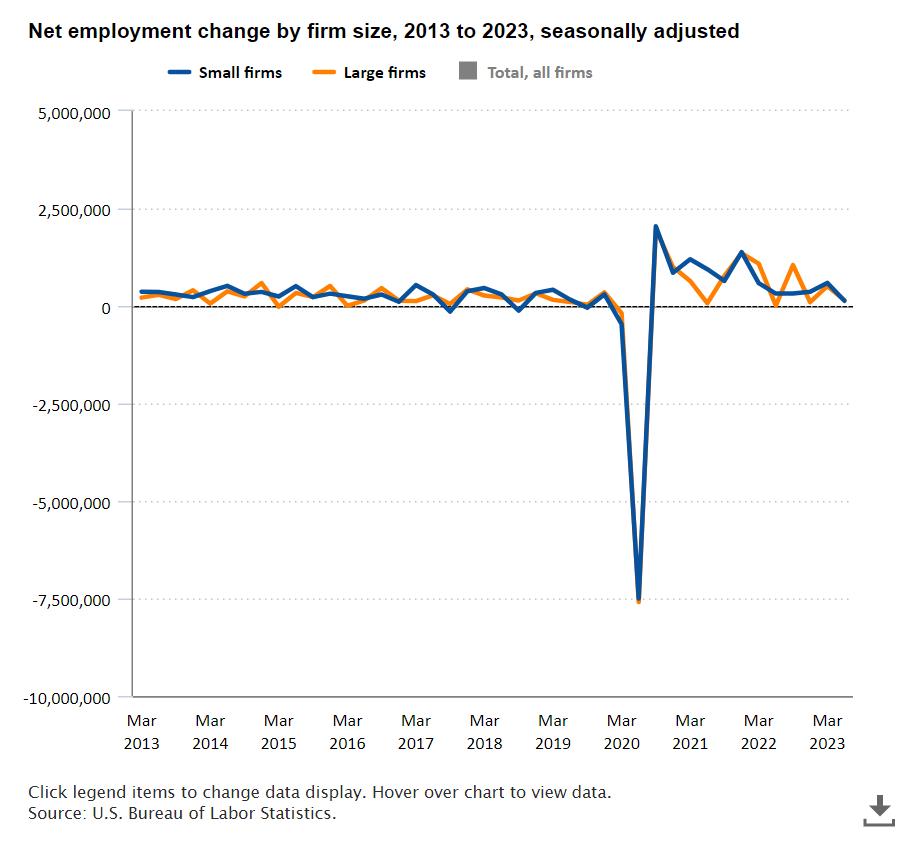
Overall, small businesses have prospered following the pandemic.

The growth in new business formation is real, solid and sustained. Who benefitted?

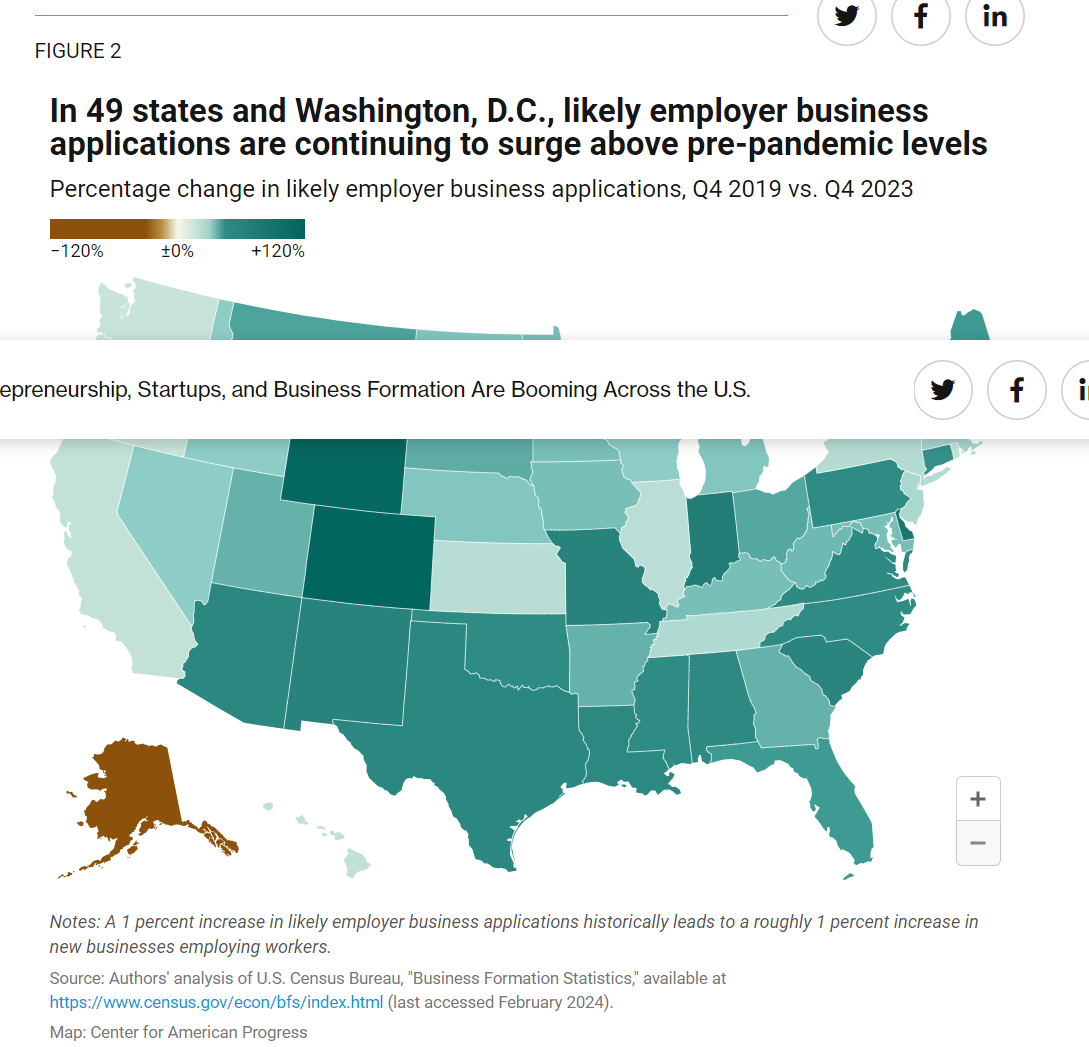
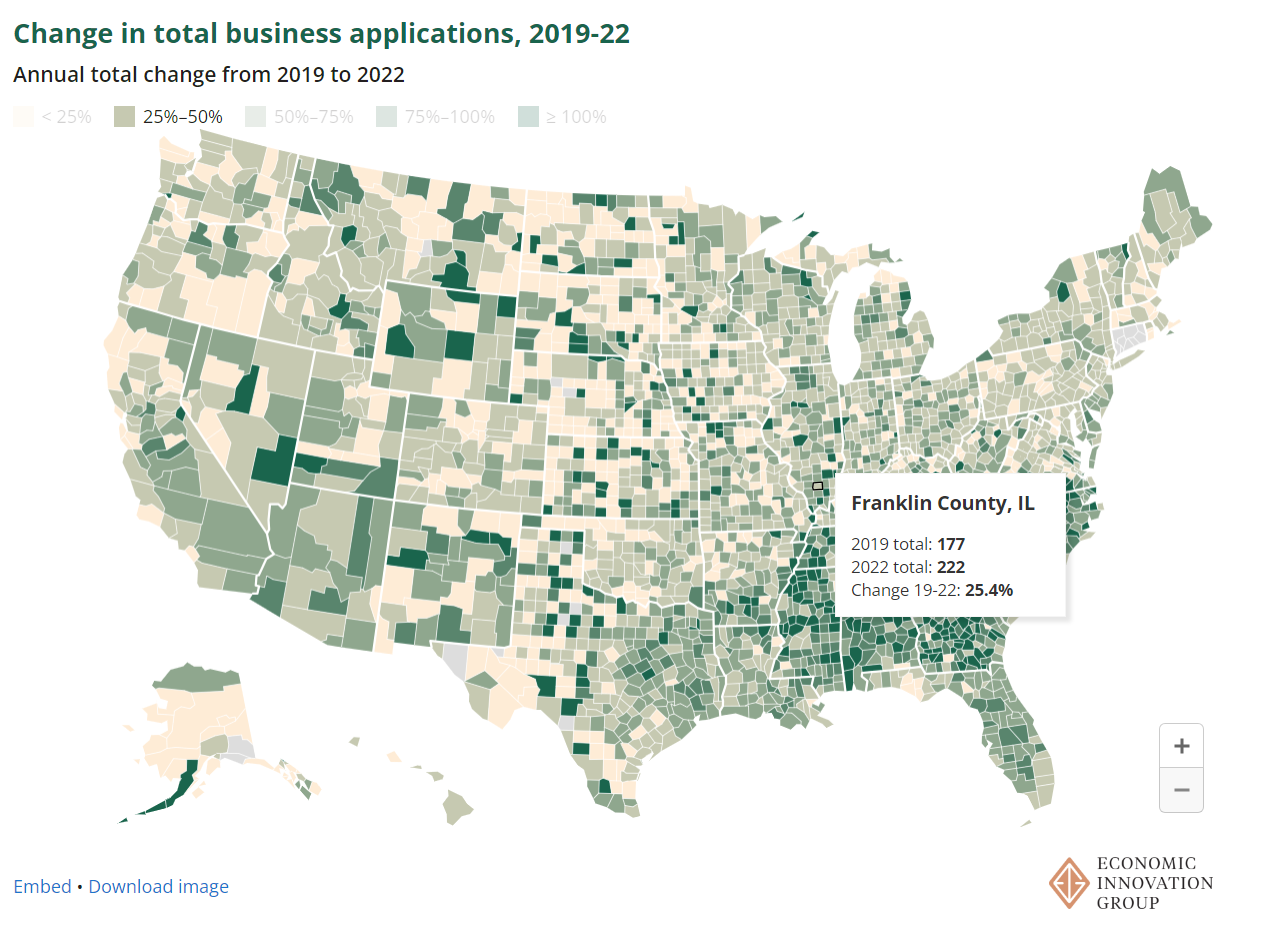
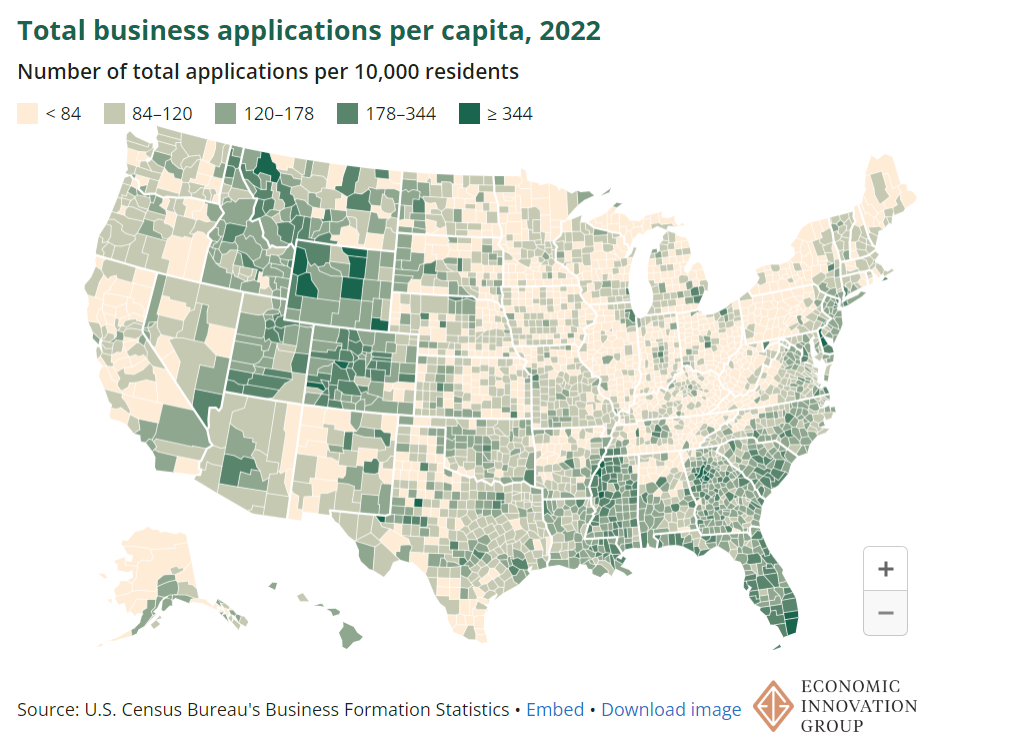
An unusual cluster of SE and SW US showed the highest percentage growth rate.

Once again, a very broad set of states adding new businesses.

The southeast is winning, but growth is widespread.

Nine out of 15 industries saw very strong growth out of the pandemic.

https://www.uschamber.com/small-business/new-business-applications-a-state-by-state-view

The initial surge in new businesses did NOT include the IT or manufacturing sectors which look ready to benefit from AI and government investment policies. Firm creation should continue at its record pace for the next 2-3 years.

https://www.economist.com/finance-and-economics/2024/05/12/america-is-in-the-midst-of-an-extraordinary-startup-boom

https://hbr.org/2024/01/how-the-pandemic-rebooted-entrepreneurship-in-the-u-s

Why/how did this happen? US economy did not see wealth destruction during the pandemic as occurred in the Great Recession. Bipartisan government funding during the pandemic protected small businesses and individuals. The US labor market was strong before the pandemic and recovered very quickly to full employment with high quit rates, high job openings, low layoffs, wage growth, high labor force participation, and new immigrants included. There was no “credit crunch” destroying businesses. Venture capital firms were flush with capital, able to invest in the very best prospects. The US economy was mature as an “information age” economy, identifying opportunities. The virtual economy was mature, allowing individuals with minimal technical skills to easily create new businesses, market their services, and engage skilled resources. Individuals experienced being out of work and at home and determined that they could create new firms from home.

The Biden administration claims that its various public policies have leveraged the “natural” rebound.

https://www.sba.gov/article/2024/01/11/new-business-applications-reach-record-16-million-under-biden-harris-administration

https://www.whitehouse.gov/briefing-room/statements-releases/2023/11/21/fact-sheet-ahead-of-small-business-saturday-biden-harris-administration-announces-latest-steps-to-support-small-businesses/

https://www.whitehouse.gov/cea/written-materials/2024/01/11/new-business-surge-unveiling-the-business-application-boom-through-an-analysis-of-administrative-data/

https://www.sba.gov/article/2024/04/11/new-small-business-applications-soar-over-17-million-under-biden-harris-administration

Various moderate to conservative sources have documented this positive result.

https://www.uschamber.com/small-business/new-business-applications-a-state-by-state-view

https://www.inc.com/melissa-angell/new-small-business-applications-surged-55m-in-2023-marking-yet-another-record.html

https://ny1.com/nyc/all-boroughs/news/2024/06/12/biden-touts-18-million-new-business-applications-since-he-took-office

https://www.forbes.com/sites/rhettbuttle/2024/01/12/three-year-small-business-boom-is-unprecedented/

https://www.entrepreneur.com/business-news/why-are-new-business-applications-at-all-time-high/474614

The US Economy Leads the World

https://www.nrel.gov/computational-science/artificial-intelligence.html

The US economy became the largest in the world in 1890. It still leads the world today 134 years later.

https://en.wikipedia.org/wiki/Economy_of_the_United_States#:~:text=Many%20workers%20shared%20the%20success,of%20GDP%20since%20around%201890.

Of 10 largest economies in the world, the US has the 3rd highest GDP growth rate at 3.0%. Less developed China (5%) and India (8%) lead the way. The median growth rate is 1.2%. The UK and Germany have negative annual growth rates (recession)! The US has the second lowest unemployment rate at 3.8%, only bettered by Japan at 2.6%. The median is between China at 5.2% and Canada at 6.1%. France and Italy record 7.5% while Brazil and India trail at 8%.

https://www.economist.com/economic-and-financial-indicators/2024/05/02/economic-data-commodities-and-markets

The US economy is as large as China, Germany and Japan combined or as large as the 3rd through 10th largest economies combined.

https://www.usnews.com/news/best-countries/articles/the-top-10-economies-in-the-world

The US dollar is worth 10% more than before the pandemic, reflecting its above average recovery.

https://www.goldmansachs.com/intelligence/pages/how-to-diversify-as-stock-markets-concentrated.html#:~:text=The%20US%20stock%20market%20has,with%20about%2030%25%20in%202009.

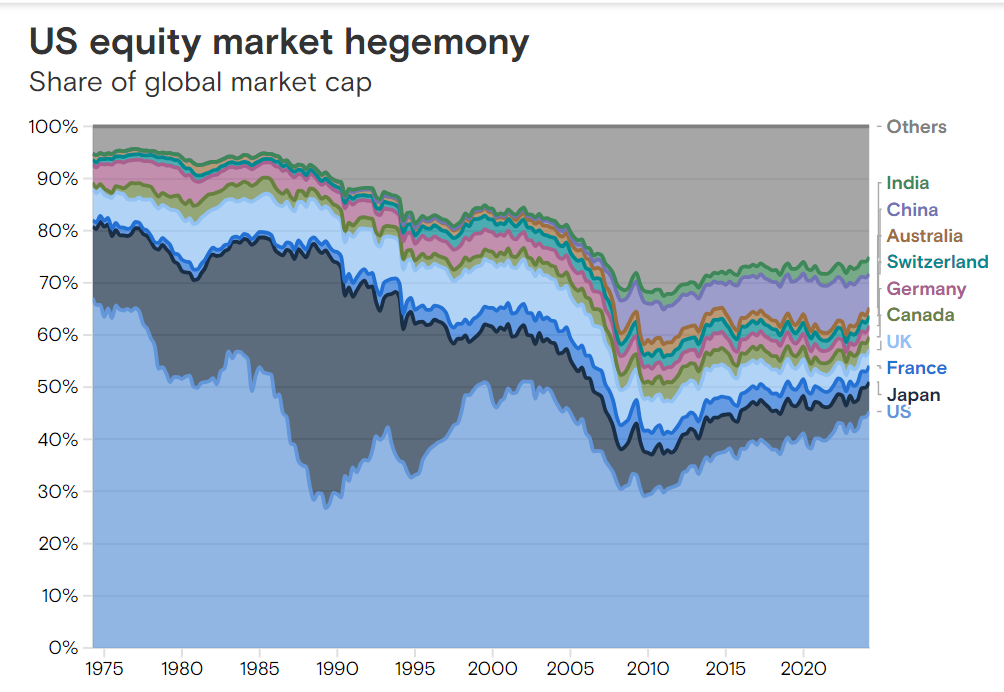
The US stock market has overperformed for 15 years, growing from 30% to 45% of global stock market value.

https://www.goldmansachs.com/intelligence/pages/how-to-diversify-as-stock-markets-concentrated.html#:~:text=The%20US%20stock%20market%20has,with%20about%2030%25%20in%202009.

Despite its high wages, high standard of living and highly valued currency, real dollar US exports exceed the pre-pandemic level.

Real dollar imports have returned to their growth trend level, allowing US consumers to take advantage of the differentiated global economy’s strengths.

https://www.axios.com/2023/12/21/misery-index-economy

The misery index, the sum of the inflation and unemployment rates, is down to 7% and trending lower, materially below the 8% average of this century.

US inflation reached 8-9% in 2022 and has fallen to 3%. The “stickiness” is half caused by the lag in housing and rental prices in the index and half due to the continued high 6% federal government budget deficit as a percent of GDP.

https://bipartisanpolicy.org/report/deficit-tracker/

There is nominal inflation or actual deflation in most sectors of the US economy today!!!!

On average, the US economy has been adding 2 million new jobs per year for 14 years. 28 million jobs. This is an amazing result.

During the same period, 12 million more people have retired.

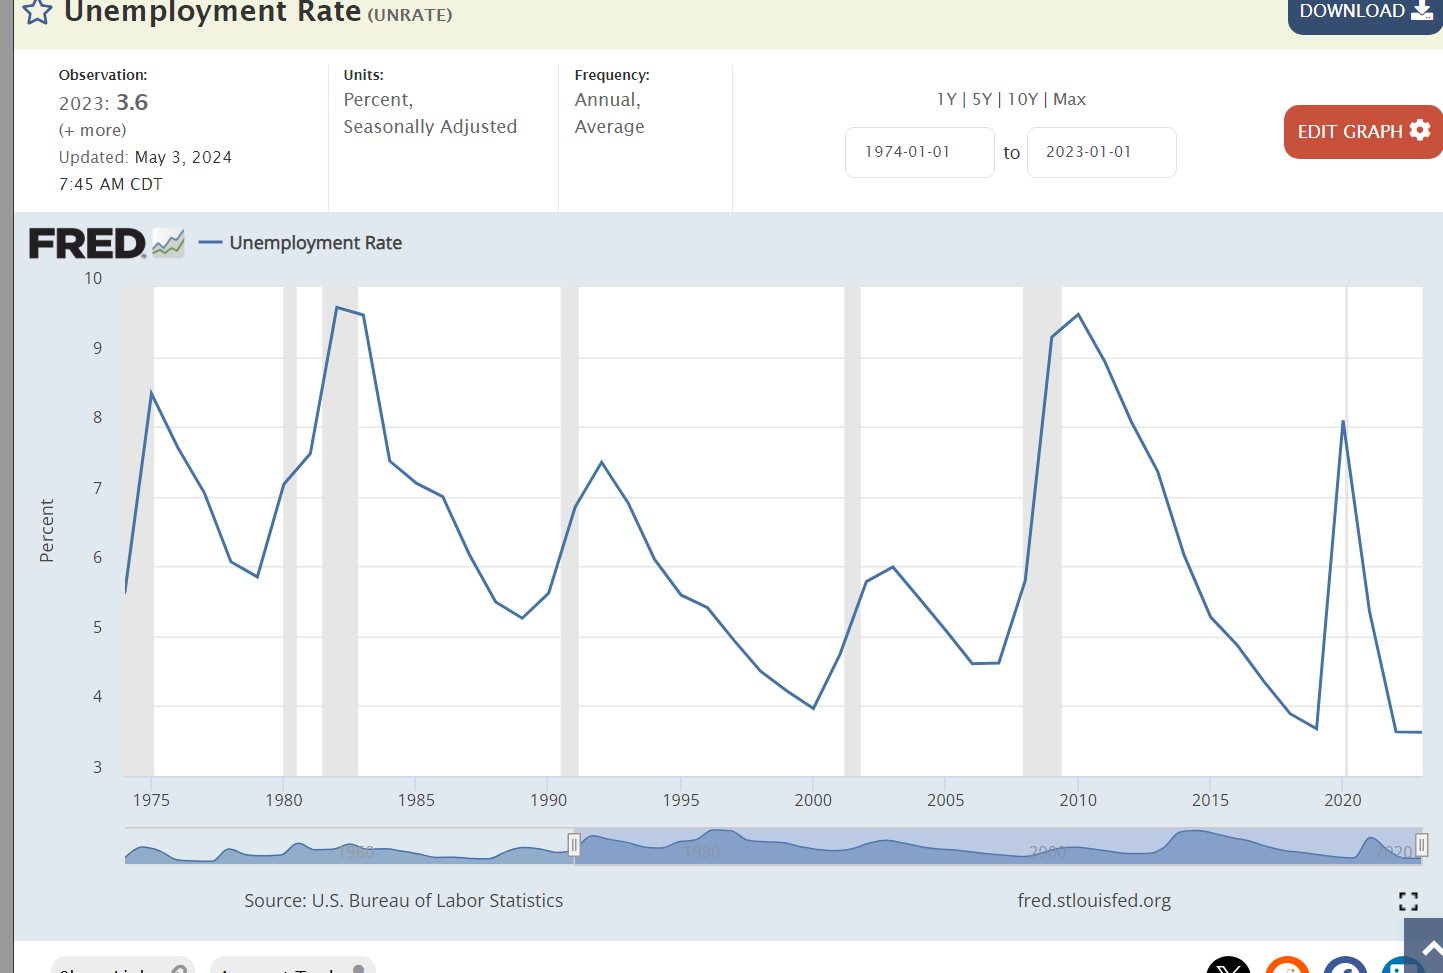
The unemployment rate is at a 50-year low. When I was studying economics in 1974-78, there was a big debate about 5% becoming the lowest possible “structural” unemployment rate possible without escalating inflation. 1997-2007 established that a 4.5% to 5.0% unemployment rate was possible. We raced back up to 9% during the Great Recession. The 35-year average was 6.5%. We experienced 3 years of sub-4% in 2017-19 as economists claimed that this was simply impossible. Unemployment rates are still below 4%.

The Black unemployment rate has been chopped in half, from 11% to 5.5%.

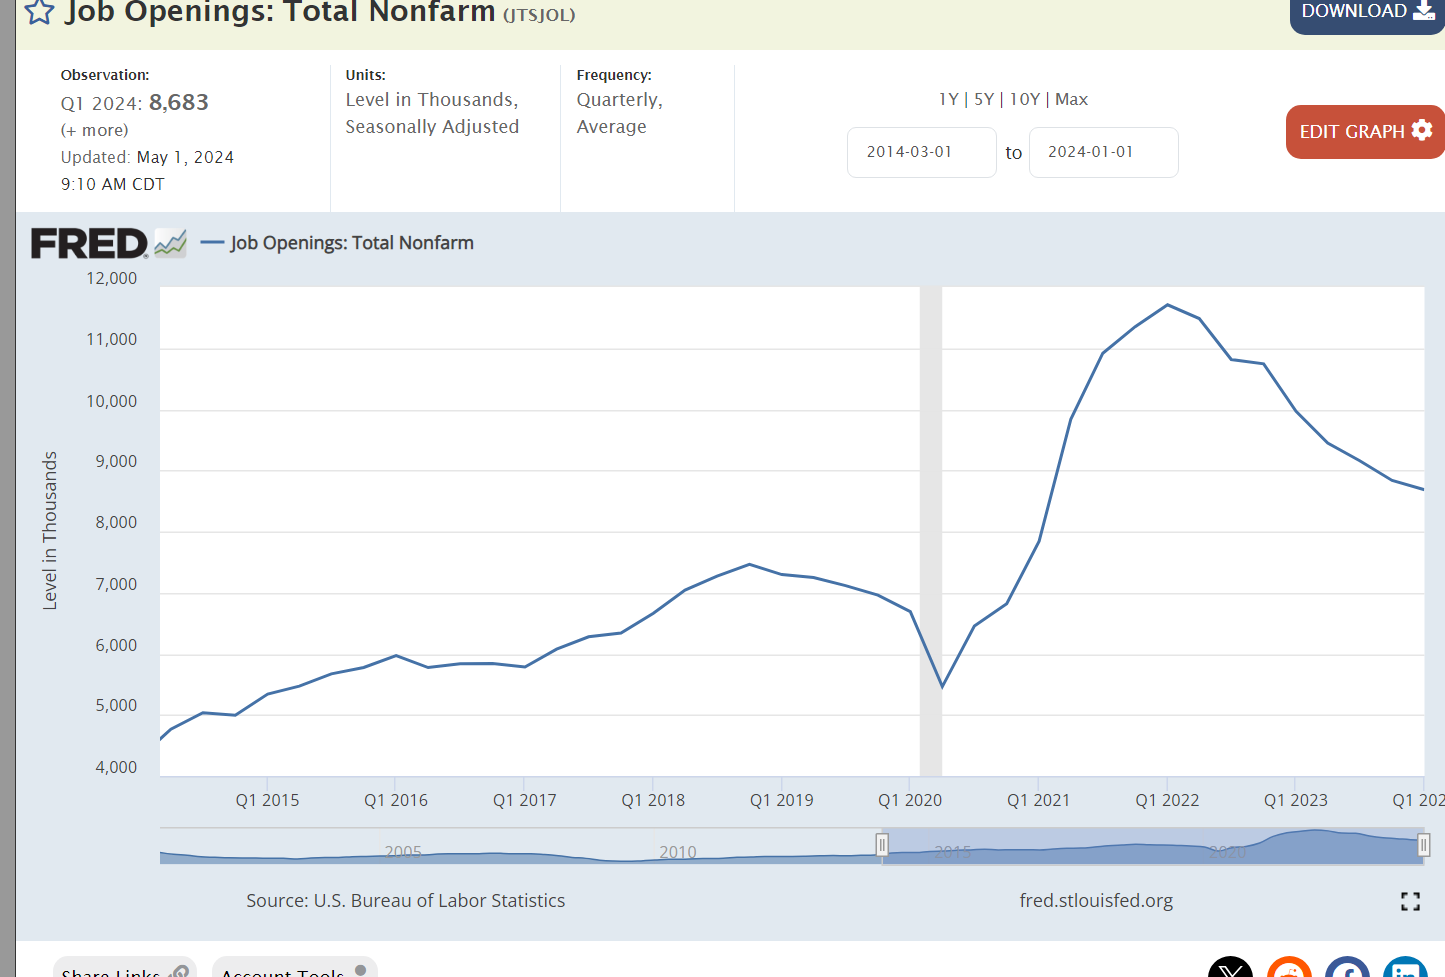
The demand for labor remains high. Job openings peaked at 7.5 million before the pandemic. Job openings remain 20% higher at 9 million 5 years later.

The core labor force participation rate has rebounded from the pandemic reaching a level last seen in 2008.

10% fewer black men participated in the labor force between 1973 and 2013. Participation is now solidly increasing.

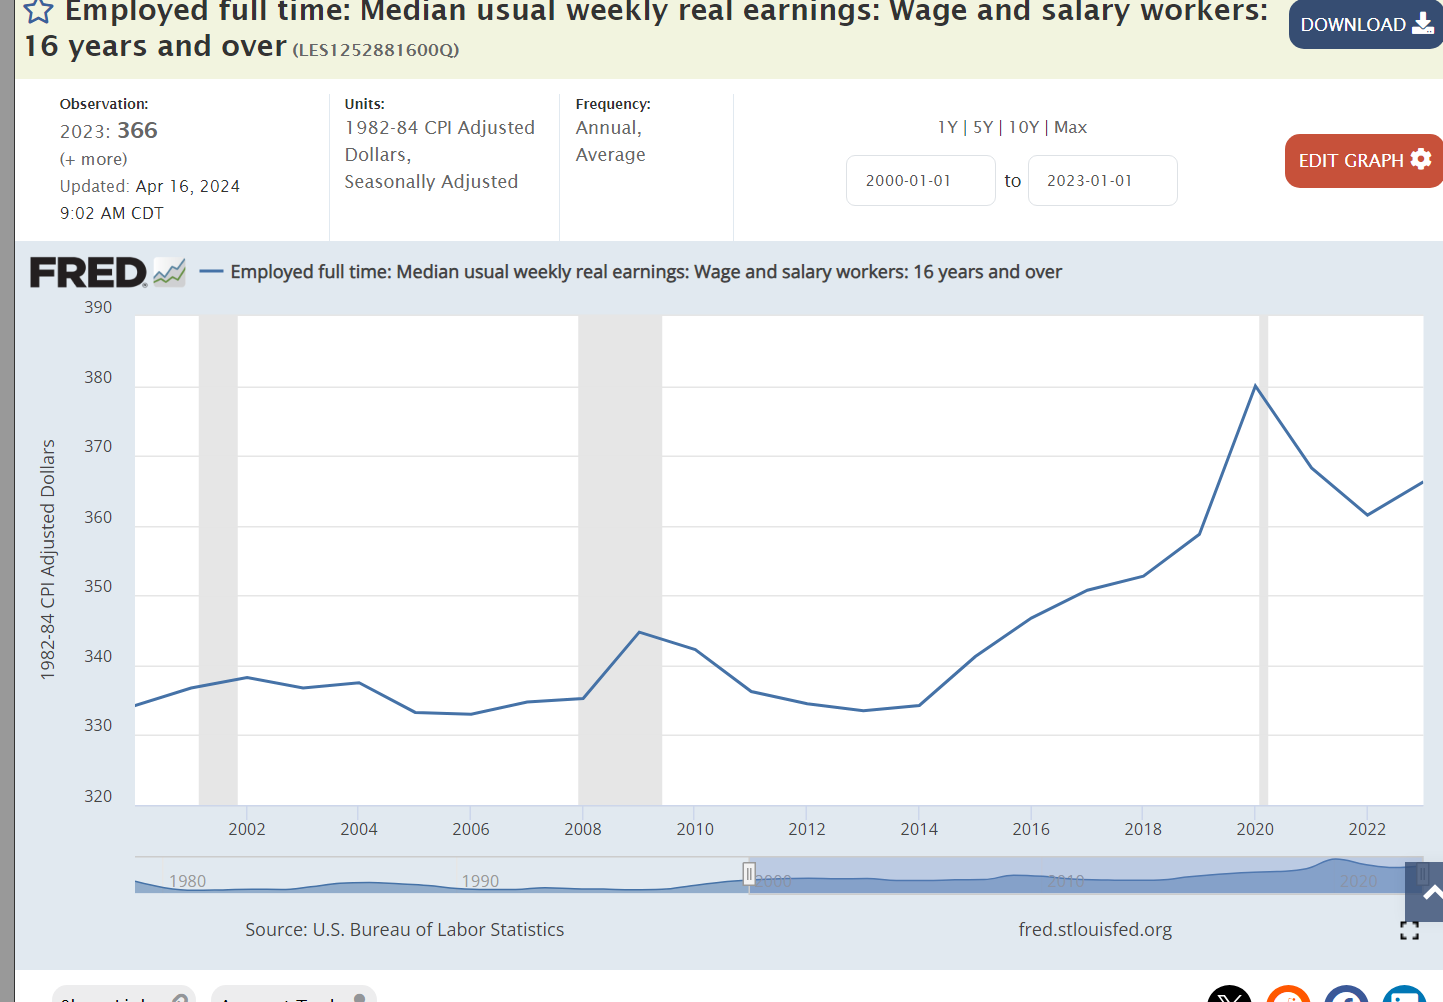
Real wages stagnated from 2000-14. They have increased by 10% since then.

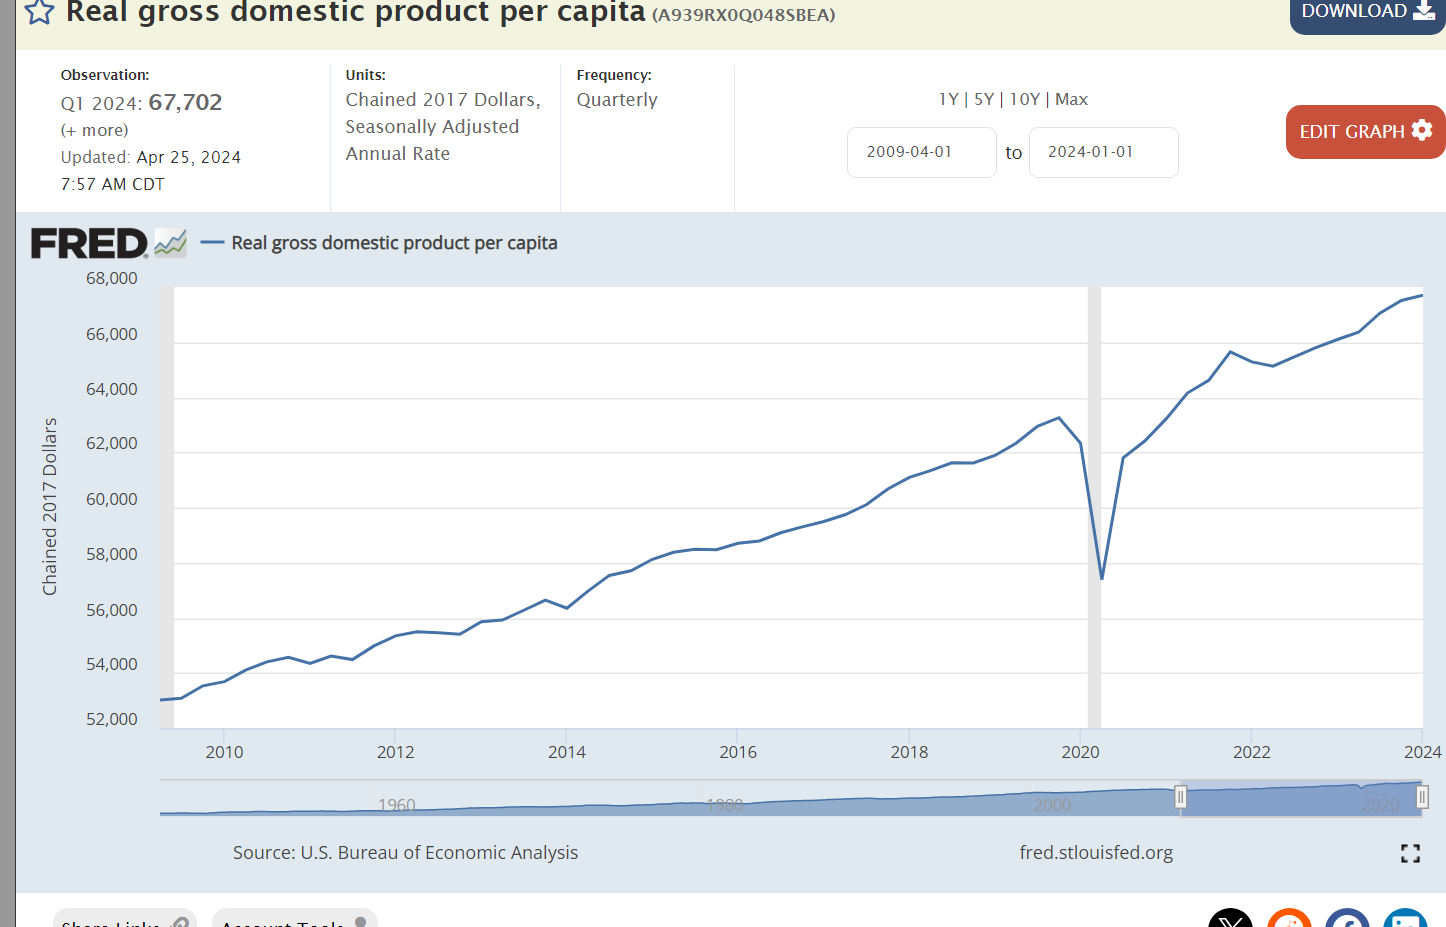
Real GDP per capita continues to grow.

If you’re a homeowner, the recent one-third increase in home values is a windfall. If you’re a prospective buyer, housing is much less affordable.

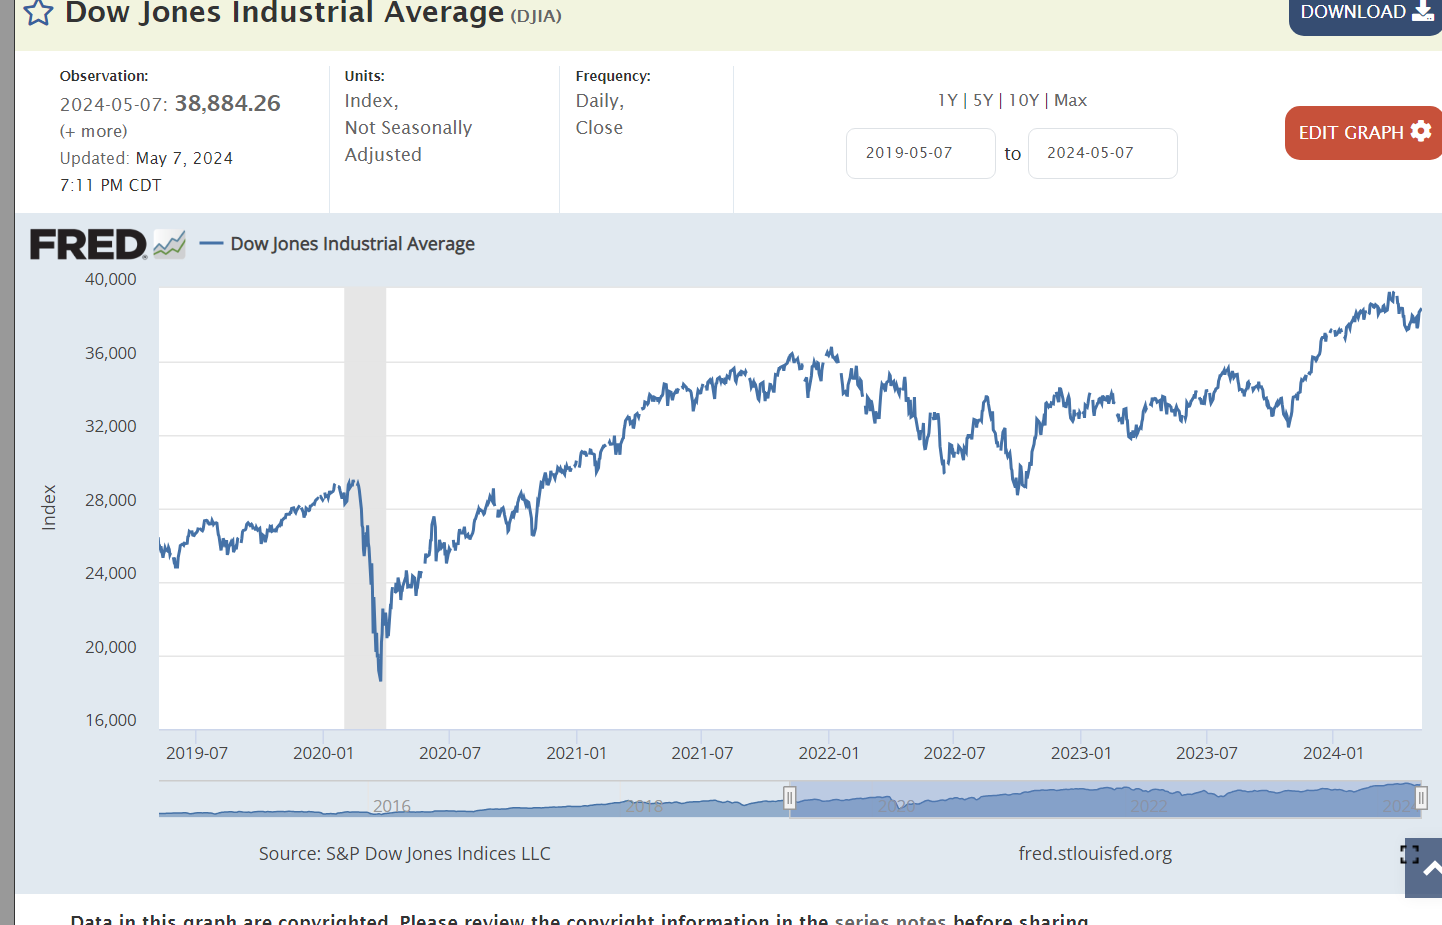
US stock market values are up 50% in 5 years.

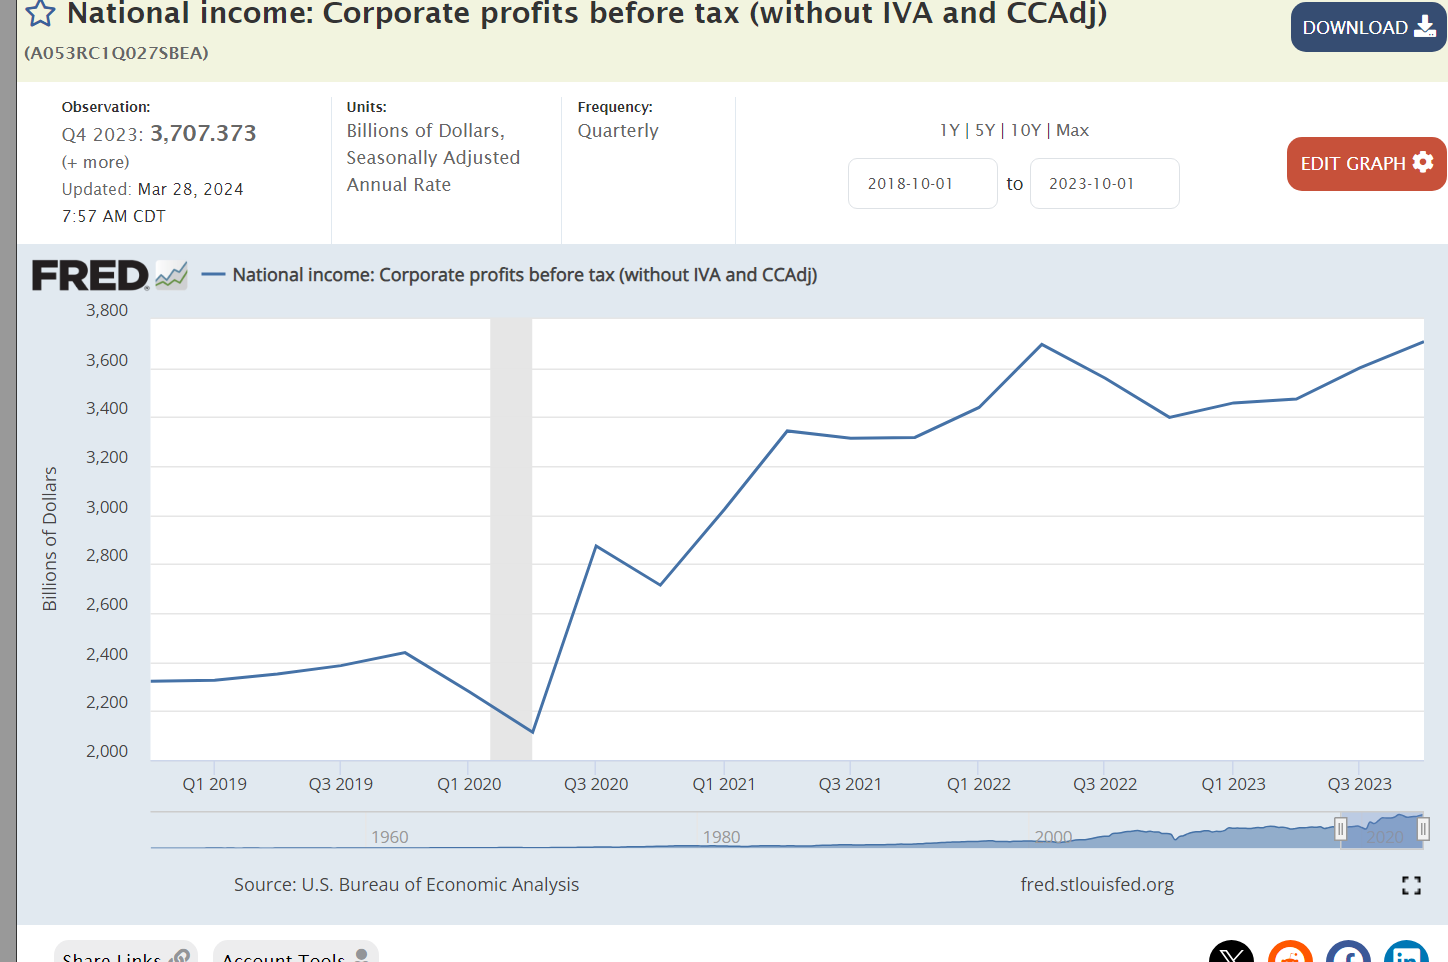
Coincidentally (?), corporate profits are up 50% in 5 years.

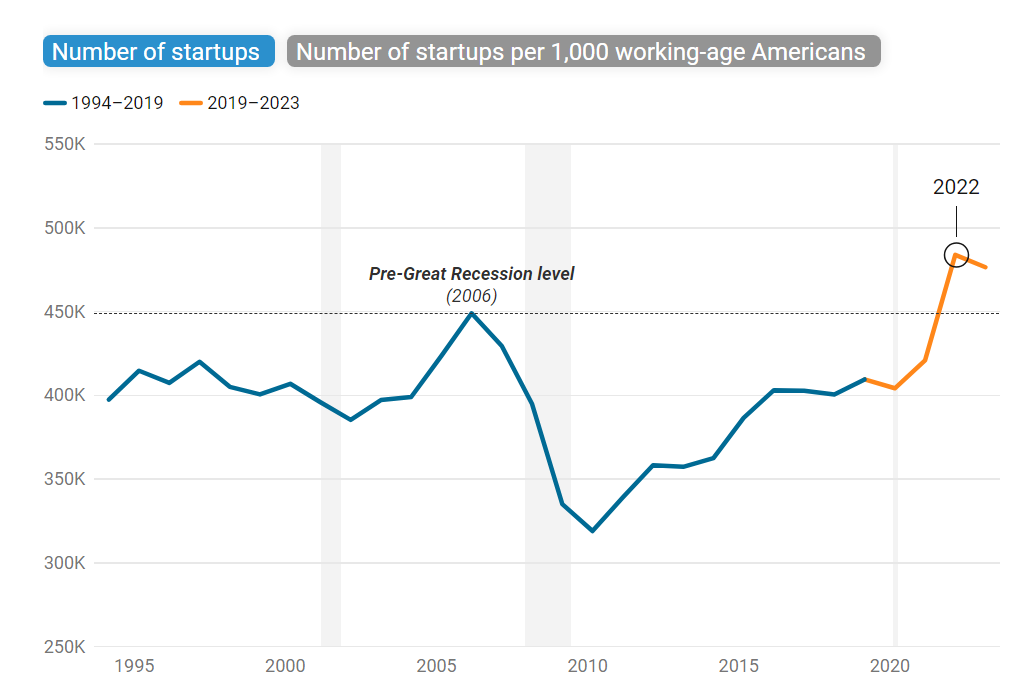
New business creation increased after the pandemic surpassing the pre-pandemic level and exceeding the pre-Great Recession level. Start-ups typically account for all job creation and ensure competition in product and service markets.

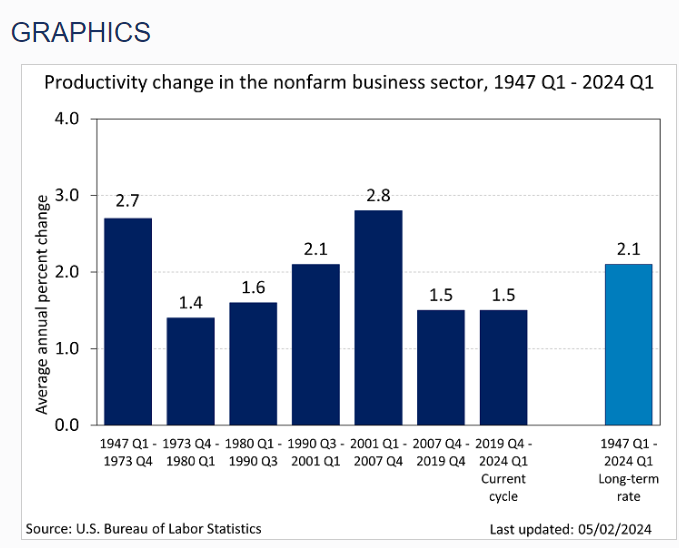
Overall productivity growth in the last 5 years has been the same as in 1973-1990 and 2007-19. In recent quarters productivity has begun to increase at a higher rate and many commentators believe that AI will drive productivity at a higher rate for the next 20 years.

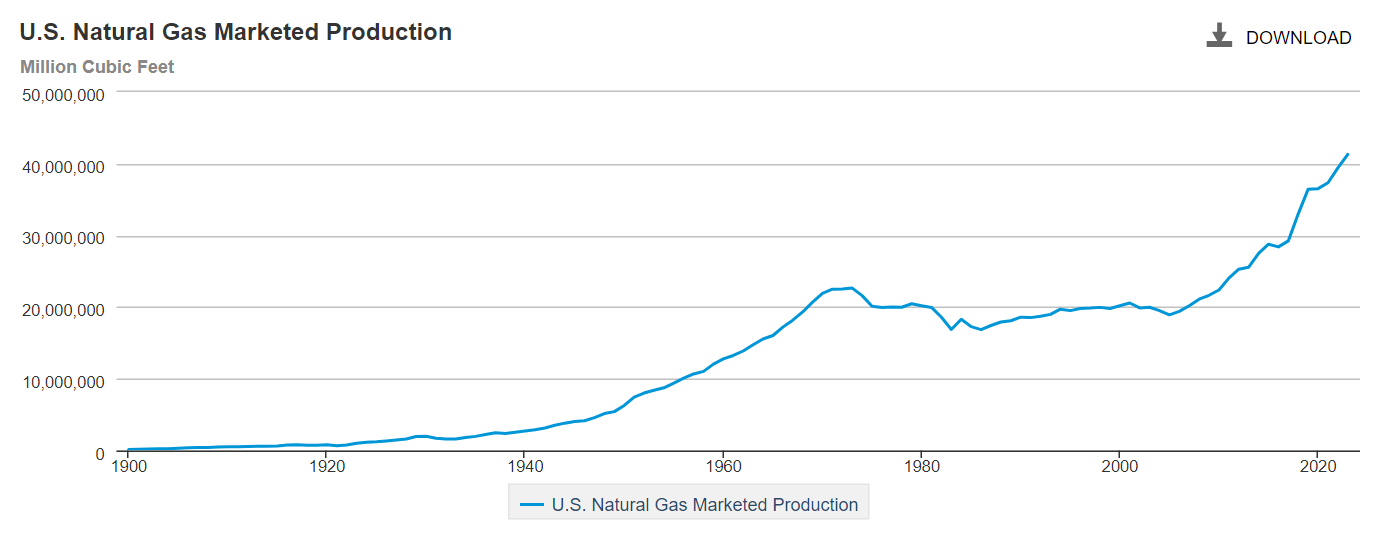
The US has achieved energy independence, doubling its production of natural gas in 20 years.

https://www.eia.gov/todayinenergy/detail.php?id=61242

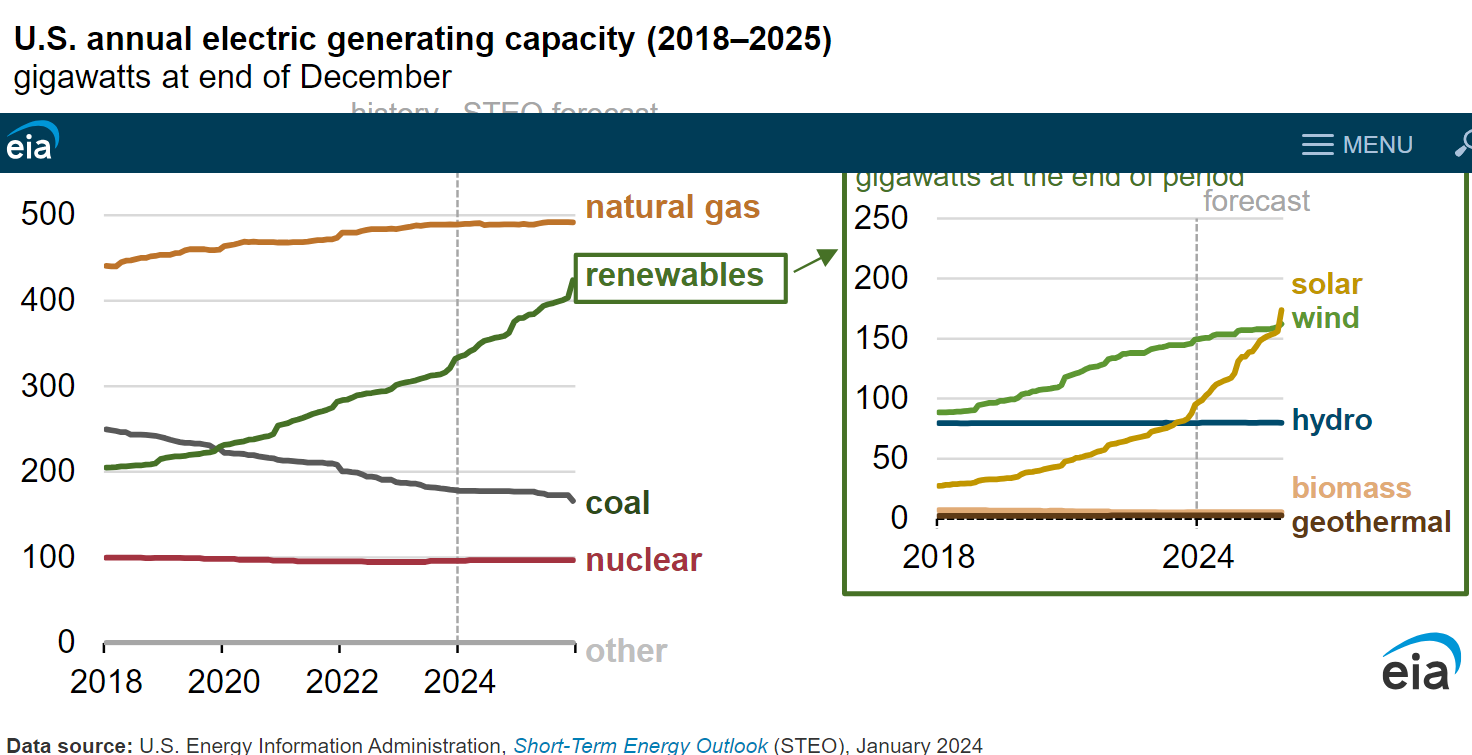
Renewable energy accounts for 22% of US energy generation.

US manufacturing employment has increased by 15% since the Great Recession. It is higher than before the pandemic despite the increase in real median wages and the increase in the value of the US dollar.

Net farm income has doubled since before the pandemic.

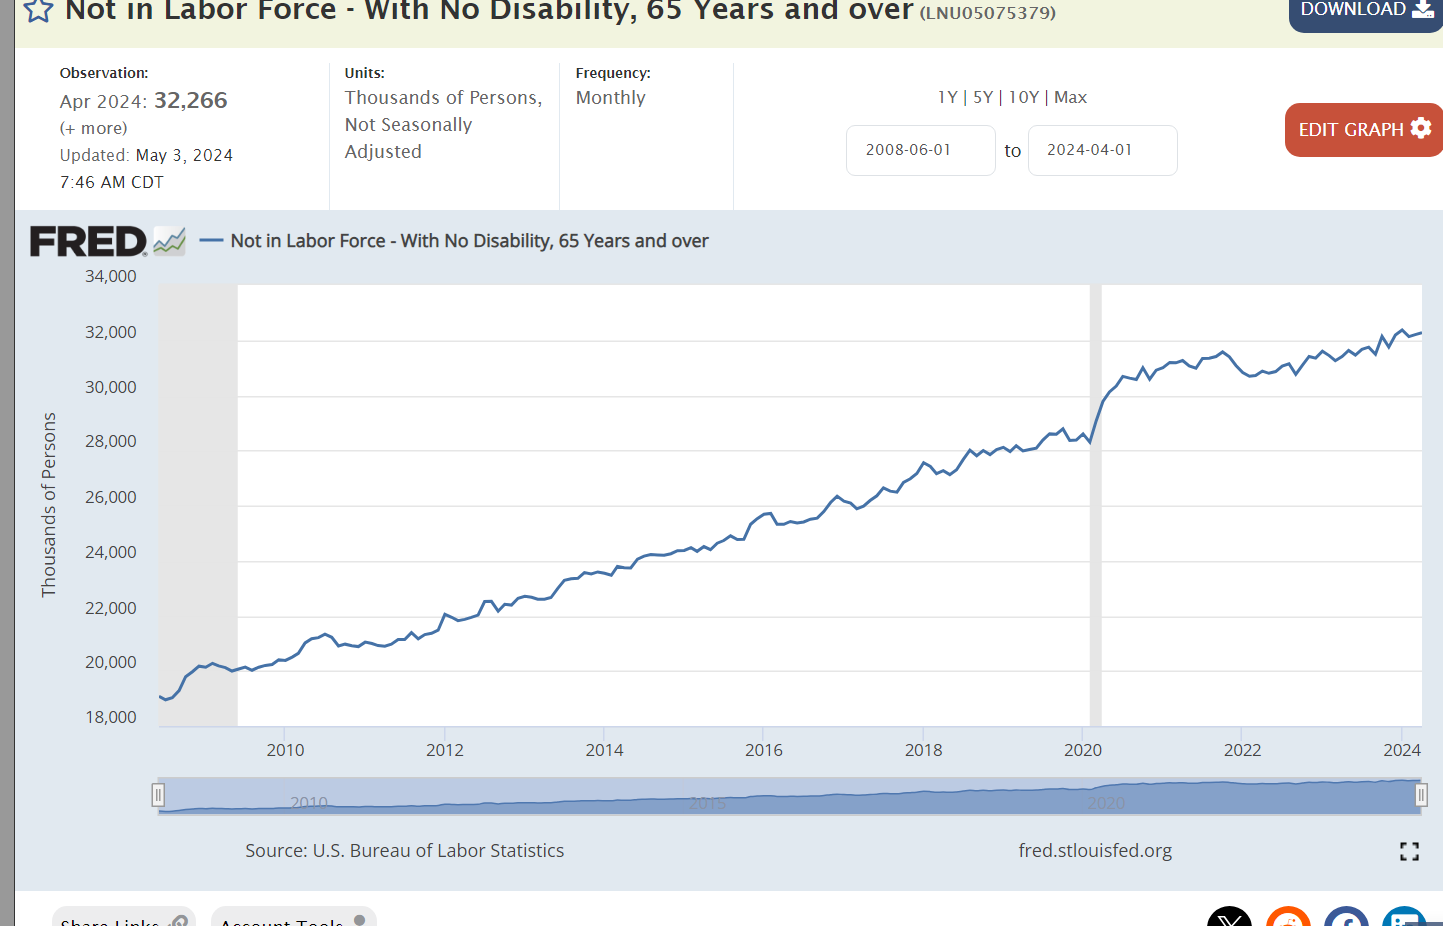
We have one-third more voluntary retirees in 2024 versus 2014.

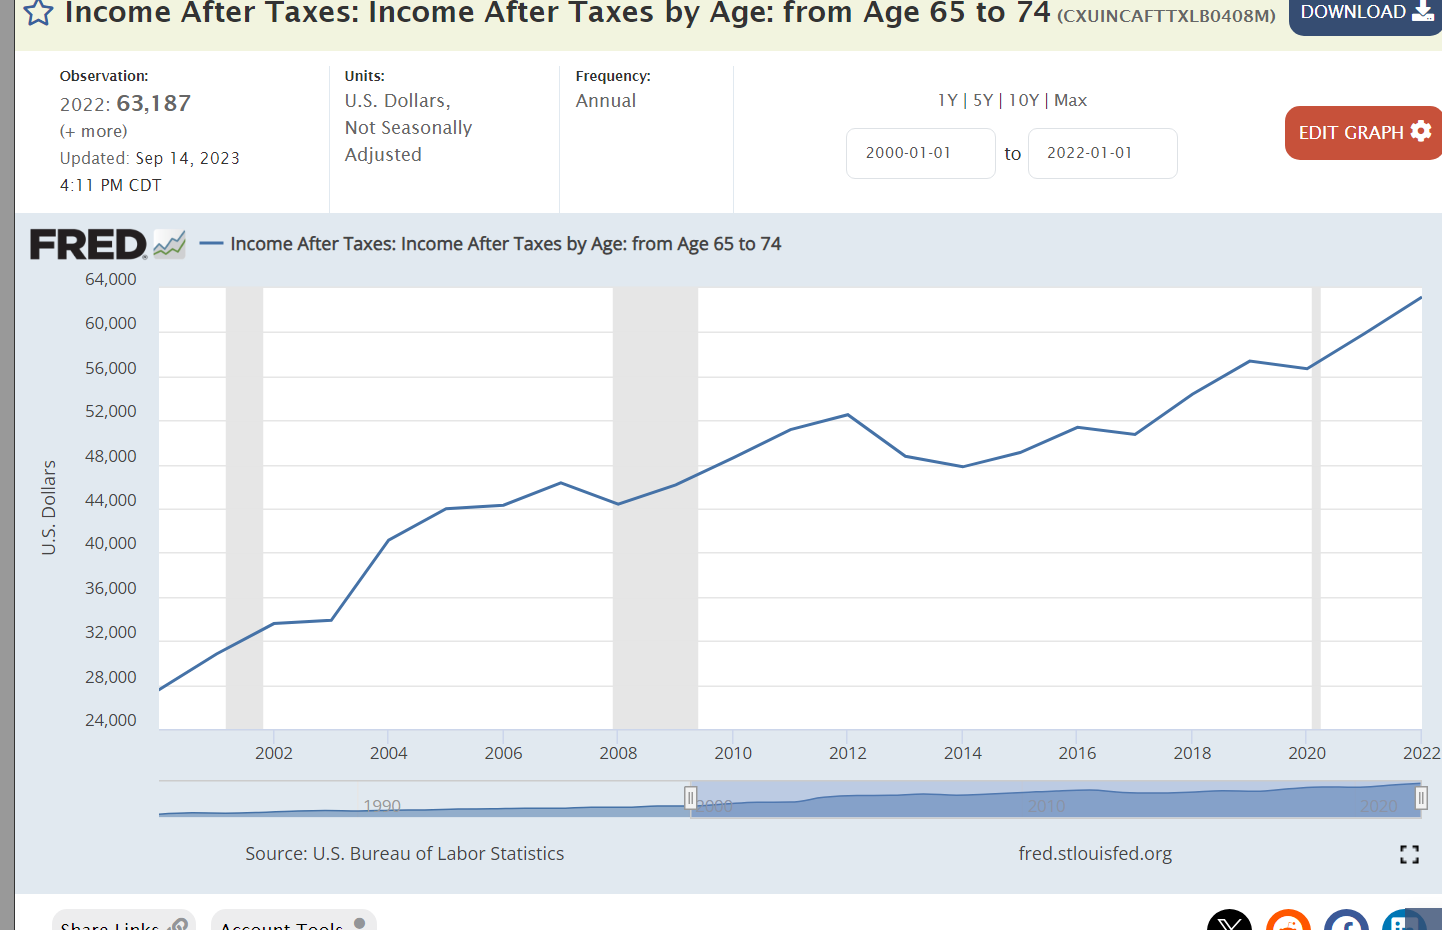
Those retirees are receiving significantly higher incomes.

Retirement assets have increased by 50% in the last 10 years.

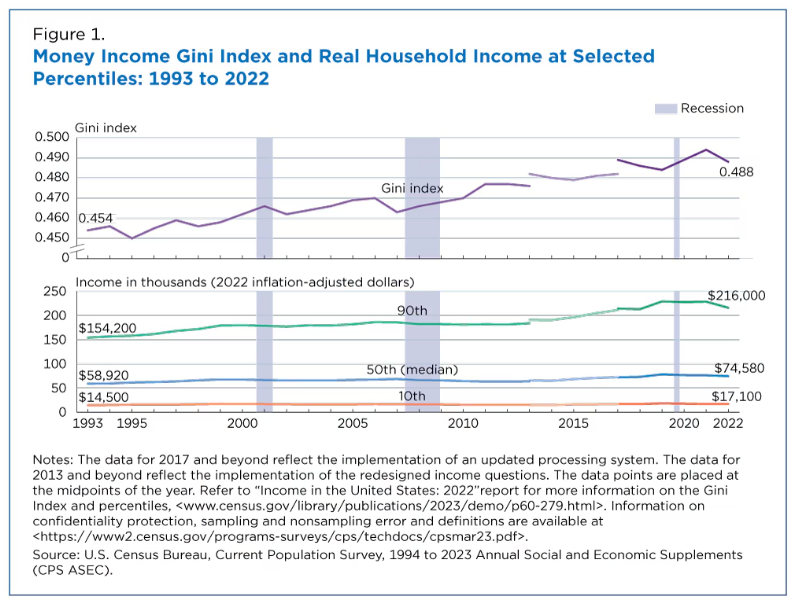
https://www.census.gov/library/stories/2023/09/income-inequality.html#:~:text=The%20ratio%20of%20the%2090th,a%206.7%25%20decrease%20from%202021.

Income inequality has finally peaked in the last 5 years.

The poverty rate has declined by one-third in the last 10 years.

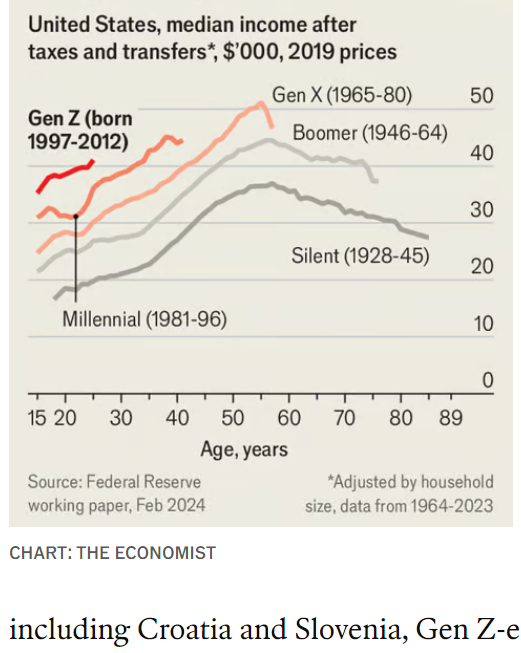
https://www.economist.com/finance-and-economics/2024/04/16/generation-z-is-unprecedentedly-rich

Each generation earns higher incomes in the productive US economy. My first post college job paid $800 per month, $9,600 per year in 1978.

US citizens pay very low taxes compared with their developed nation peers.

Summary

The US economy recovered from the uncertain pandemic period faster than other countries due to the combination of very loose fiscal and monetary policy. The fiscal policy boost was bipartisan. The monetary policy boost was nonpartisan. As the strength of the US recovery became apparent by the end of 2021, both Congress and the Federal Reserve Board should have reduced their stimulus levels. The FRB adapted slowly and increased rates. Congress and President Biden have not adapted.

The US economy is experiencing an extra year of excess inflation due to these actions.

It is important to look at the long-run trends and many indicators of economic health. Monetary policy in an independent Fed is effective. Fiscal policy is ineffective. Inflation is higher than ideal.

Let’s list the positive economic indicators. GDP growth, US dollar value, stock market value, exports, employment, retirees and incomes, unemployment, job openings, labor force participation, home values, corporate profits, startups, productivity, energy independence, green energy, manufacturing employment, farm incomes, income equality, poverty, generational progress, and tax burden.

The US economy continues to deliver very positive outcomes for our country. President Biden could do better on reducing the federal budget deficit by increasing taxes or reducing expenditures. Overall, his policies have allowed the economy to continue to deliver benefits.

2.0% Inflation: Not in 2024

Last July, I predicted that inflation would be “near 2% by the middle of 2024”. That is not going to happen. Let’s look at the components to assess the last year and the likely future.

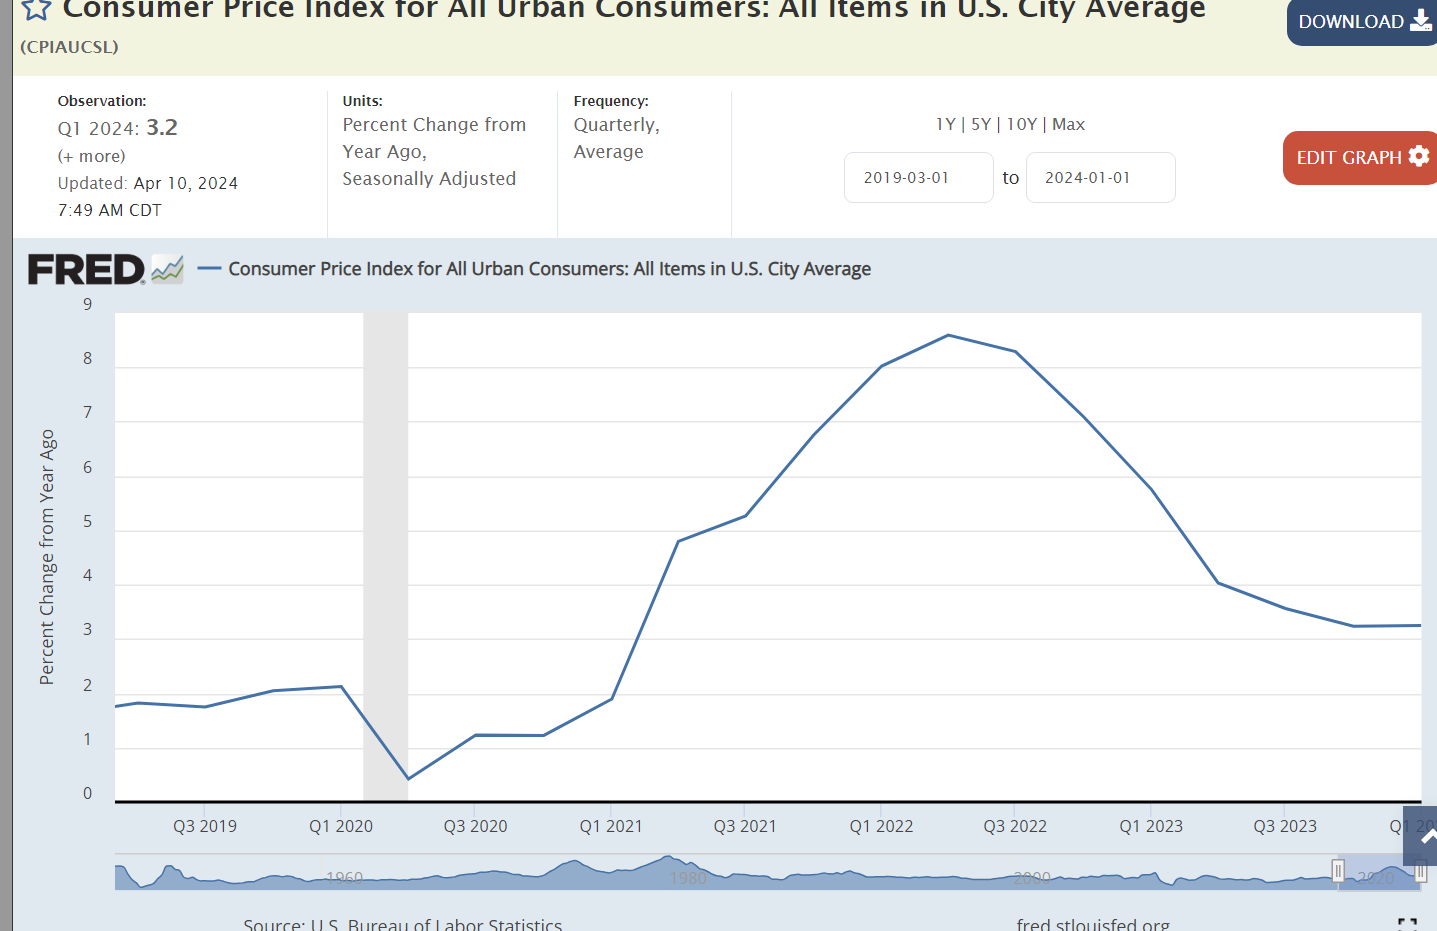
Year over year inflation rate peaked at 8.6% in 2nd quarter of 2022. It was more than cut in half at 4.0% a year later in the 2nd quarter of 2023. The last 2 quarters have been 3.25%. The “easy work” is complete. The “hard work” remains.

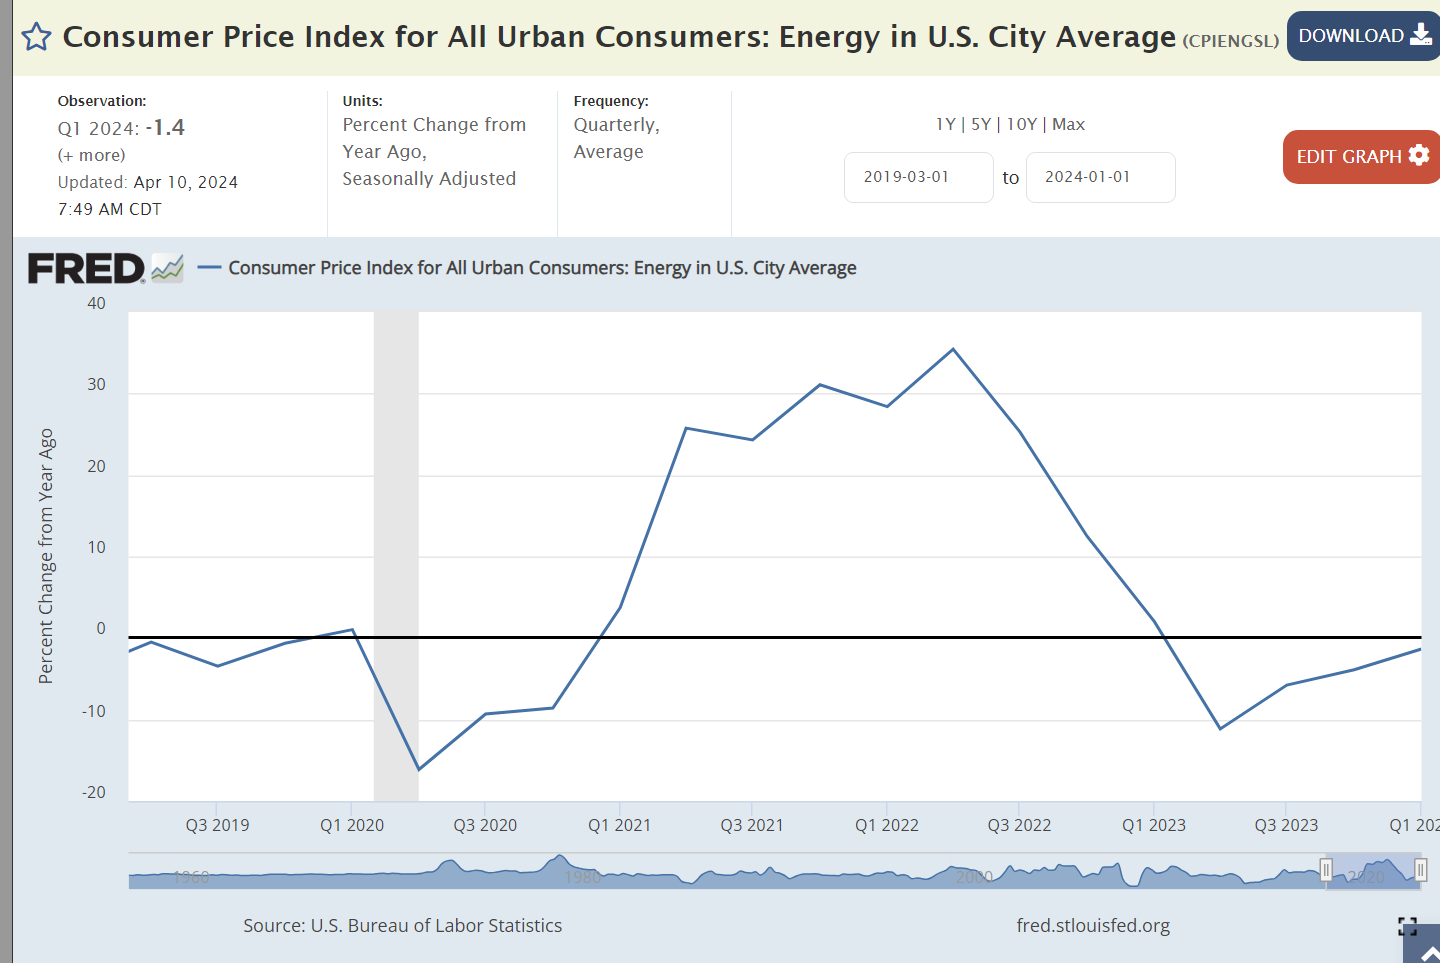
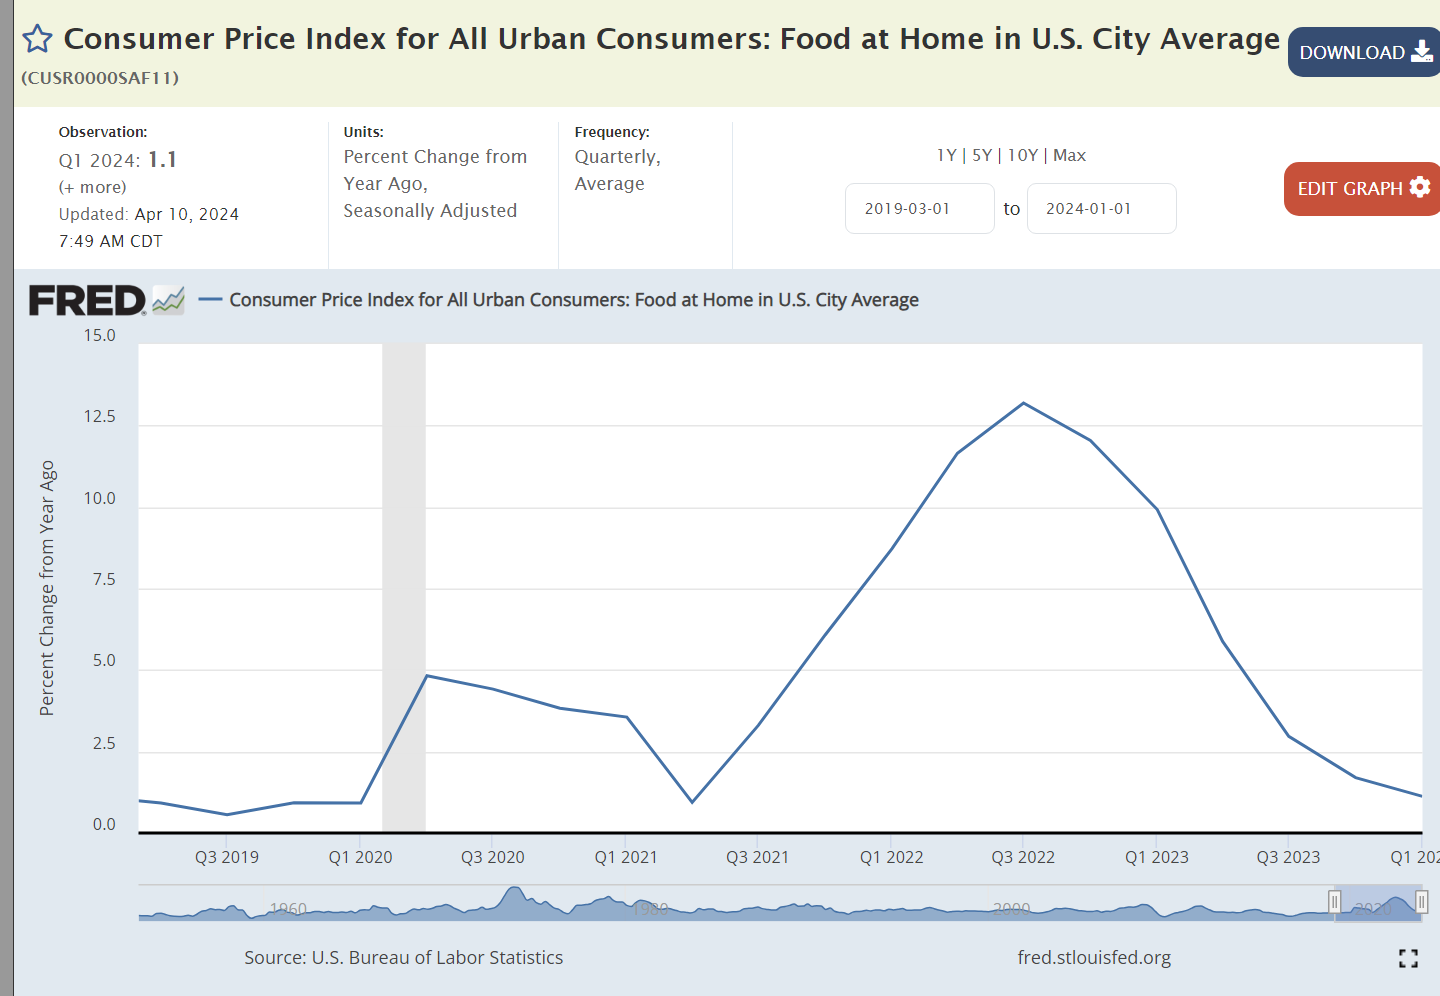
More volatile Food and Energy prices do not explain the continuing 3%+ inflation rate.

We have enjoyed energy price deflation for 3 quarters.

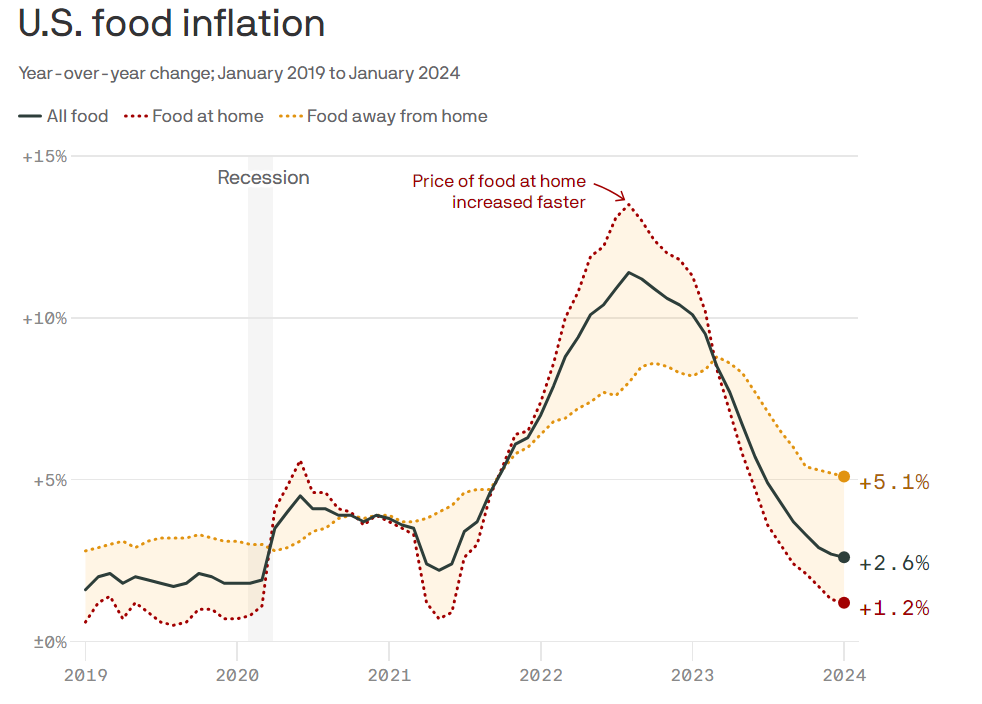
Food consumed at home prices have been nearly flat for the last 2 quarters after the 12-13% inflation during 2022.

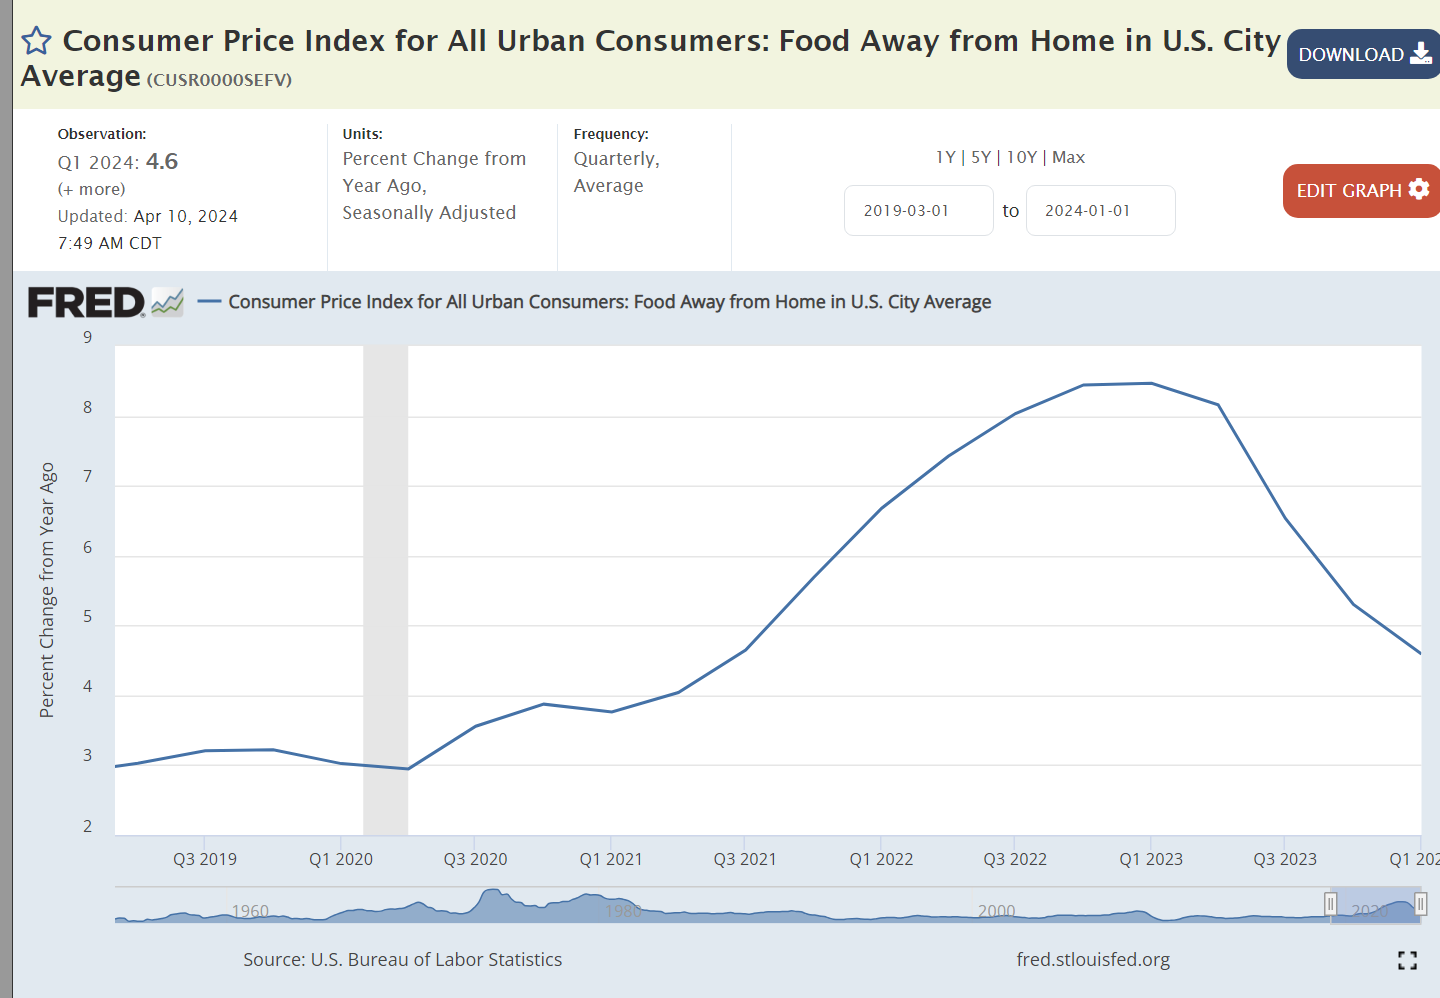
The price of food consumed away from home continues to rise at 4-5% annually. A tight labor market has increased staffing costs for restaurants. High food input costs taught them to better manage their menu prices. Many restaurants went out of business during the pandemic. Restaurants, large and small, lost money during the pandemic and are fighting hard to recover these losses. Following the lean pandemic years consumers have largely returned to their habits of eating out. This is a business sector where high aggregate demand driven by government deficit spending is creating inflation. It is not the “wage-price spiral” of the 1970’s in a manufacturing intensive economy but it is a similar situation in our retail-intensive economy.

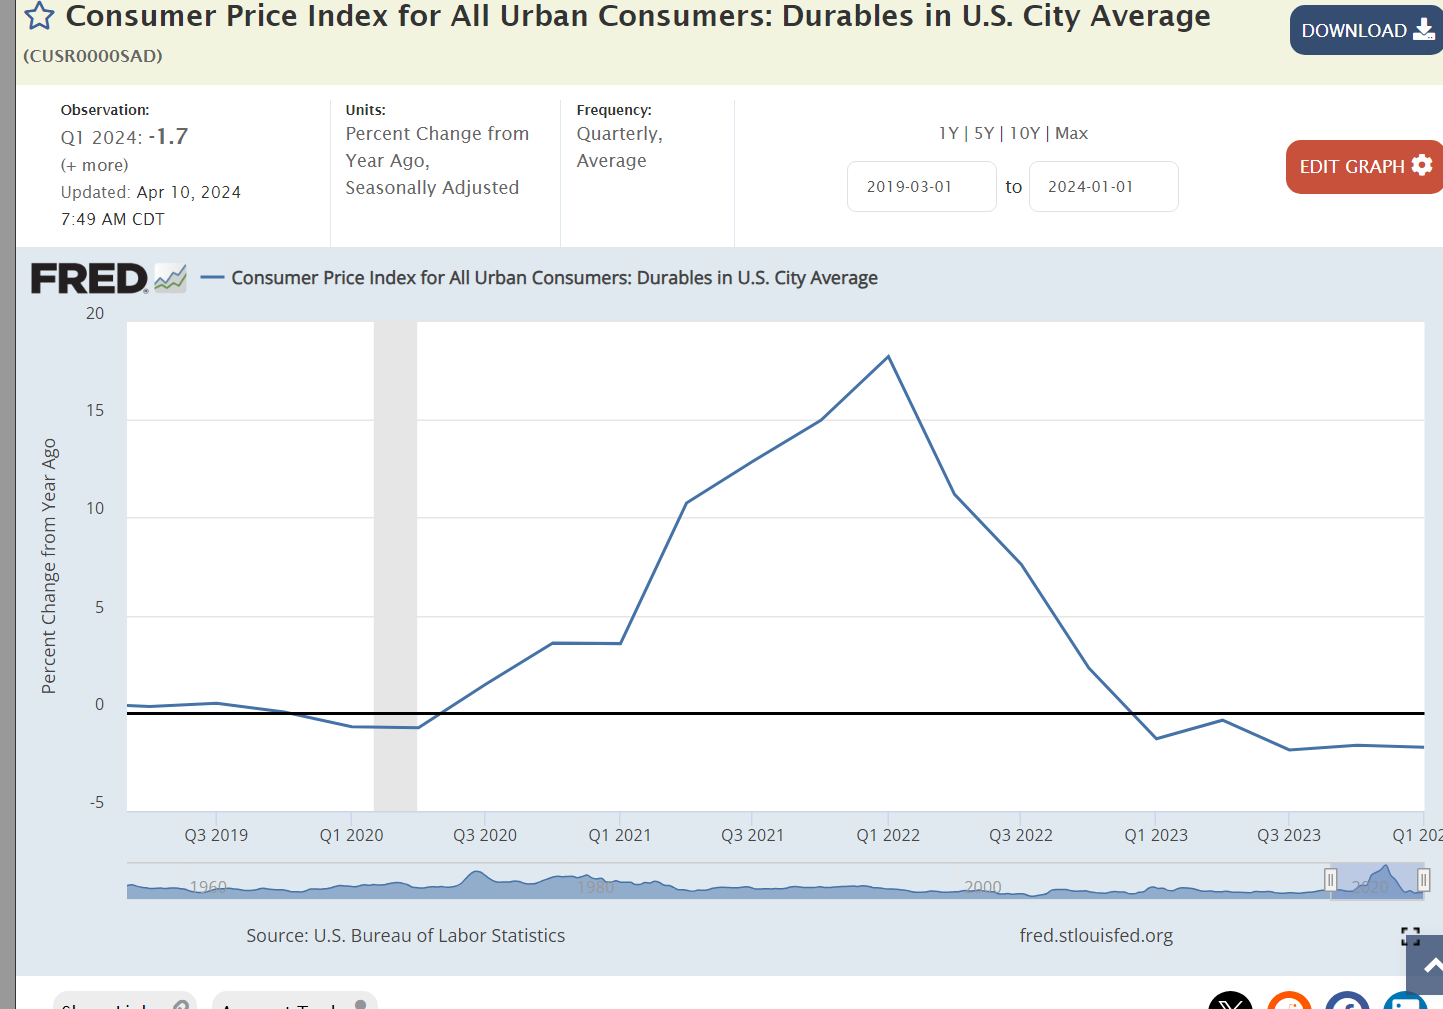
We have enjoyed deflation in durable goods prices for 5 quarters as US and global manufacturers realigned their supply chains with more predictable demand patterns.

Nondurable goods inflation has been below the 2% benchmark for 4 quarters.

The broadly defined “services” sector at 5-6% inflation remains a stubborn problem area. It contains a number of sub-sectors with very different market conditions.

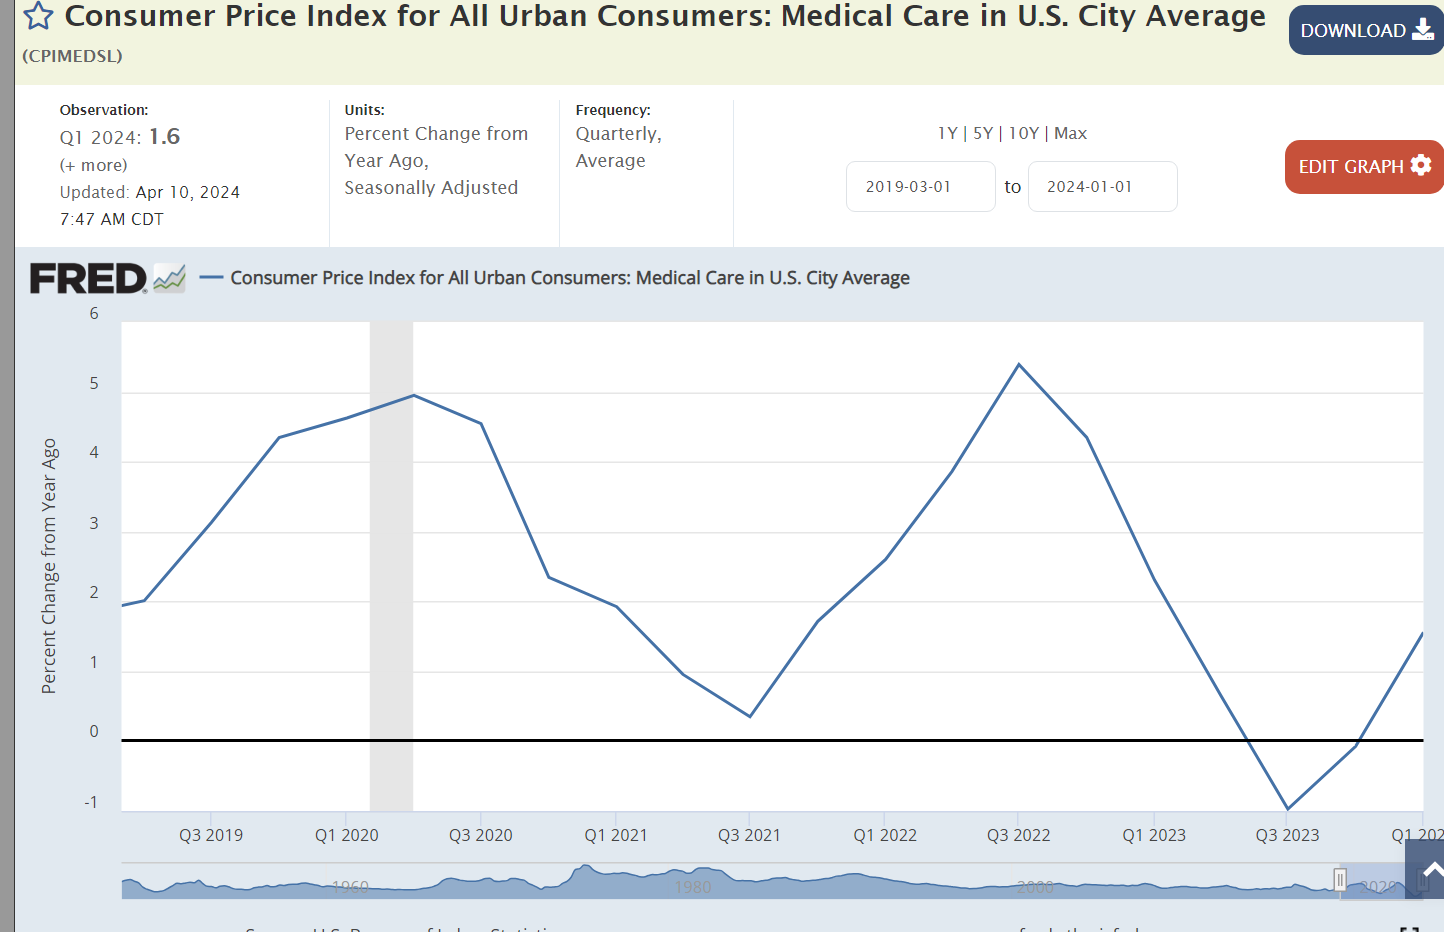
Medical care inflation above the overall inflation rate has been an issue for decades, but it has averaged just 1% for the last 5 quarters.

Transportation services prices have increased by 10% annually. This includes public and private transportation. Public sector transportation is attempting to recover from the pandemic driven decline in ridership. Private rail and truck carriers were disrupted by the pandemic as goods movements plummeted. The prospect of driverless trucks kept freight firms and drivers from returning. Transportation drivers are on the low end of wages. The overall increase in real wages at the low end of the labor market has made these physically demanding, away from home, jobs less attractive. This inflation is part long-term structural adjustment and part short-term recovery of freight flows in the economy. Transportation services is 5% of the CPI, material, but not large enough to drive the total.

The education and communications pair of service sectors has low inflation. Education is higher. Communications is lower.

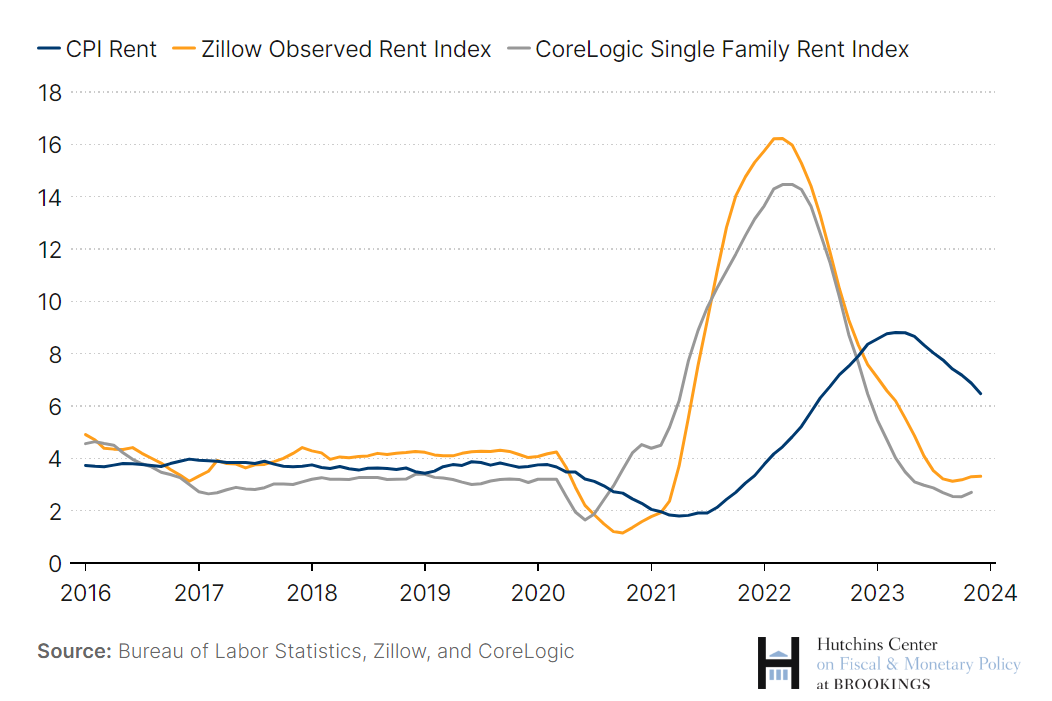
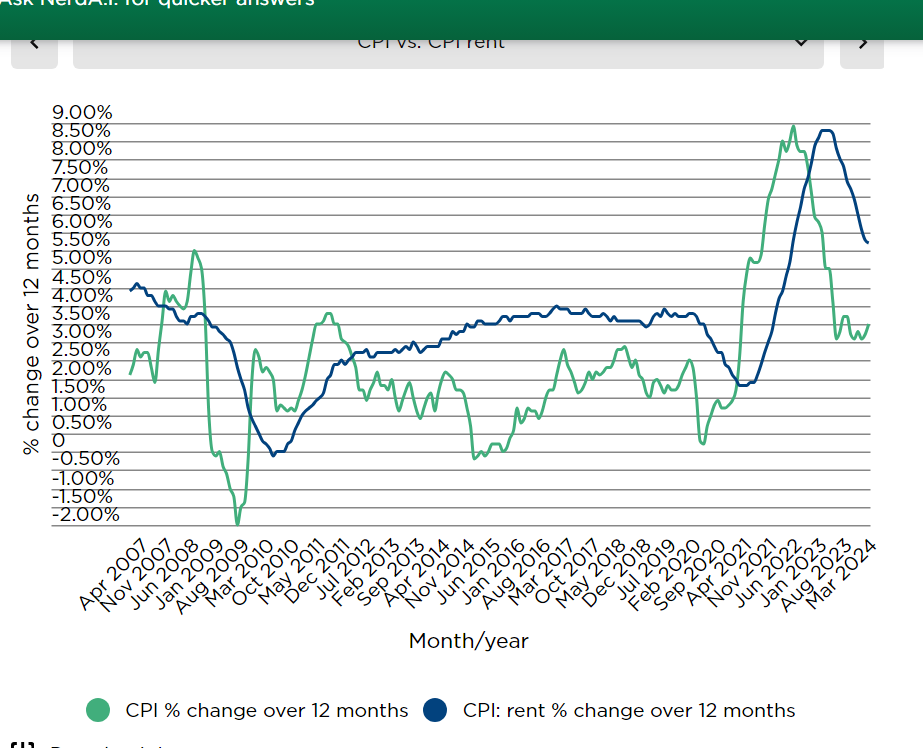
Housing is one-third of the total CPI. It is a very technical, wonky area. It combines a blend of actual rental charges and the estimated rental value of owned homes. Increases in home prices are smoothed out and their impact on the CPI tends to lag by 2-8 quarters. Housing inflation has fallen from 8% to 5%.

Housing sales prices have declined for 4 quarters. This will increasingly blend into the housing CPI, soon producing deflation rather than 4-5% inflation.

https://www.nerdwallet.com/article/finance/rental-market-trends

Market rent inflation remains in the 3-3.5% range based on the cumulative lack of US housing construction since the Great Recession of 2007-9. Combined with falling housing sales prices the combined housing CPI should decline to 2% by the fourth quarter of 2024.

Dreaded “cost-push” inflation is not a major factor for the US economy. A tight labor market has delivered 1% annual real wage increases for the last 5 quarters. This is a factor in inflation but not a driver or barrier to reaching 2% overall.

https://bipartisanpolicy.org/report/deficit-tracker

2024 looks like 2023, a very high budget deficit for a full-employment economy. In classical Keynesian economic terms, the aggregate demand pressure indicates continued 3% inflation.

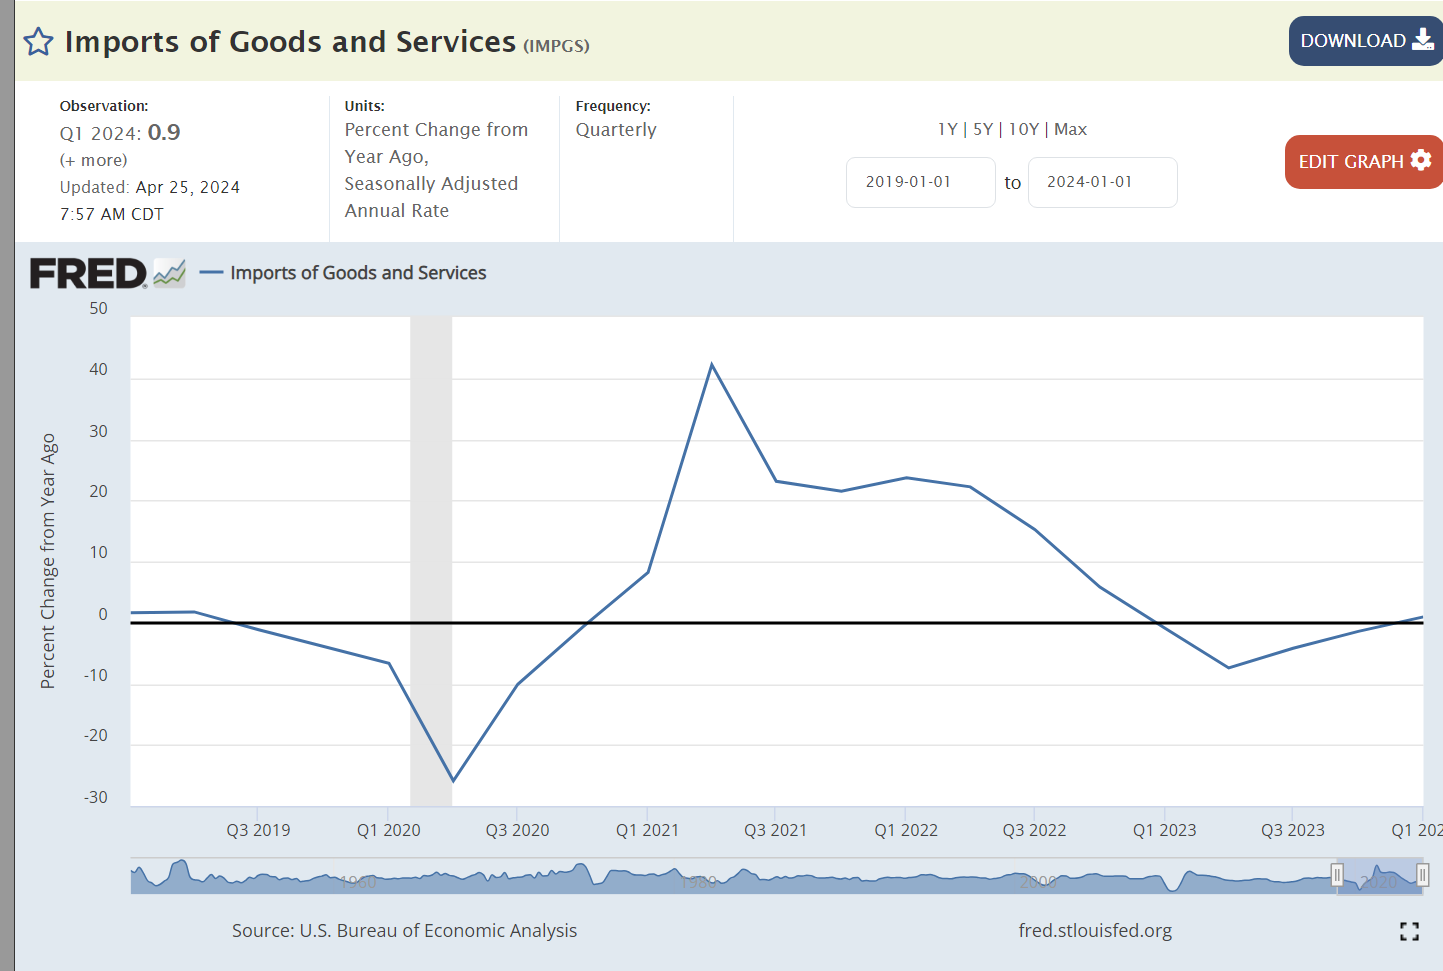
An overheated economy typically shows a strong increase in imports as demand reaches out globally. This is not the situation in the US this year.

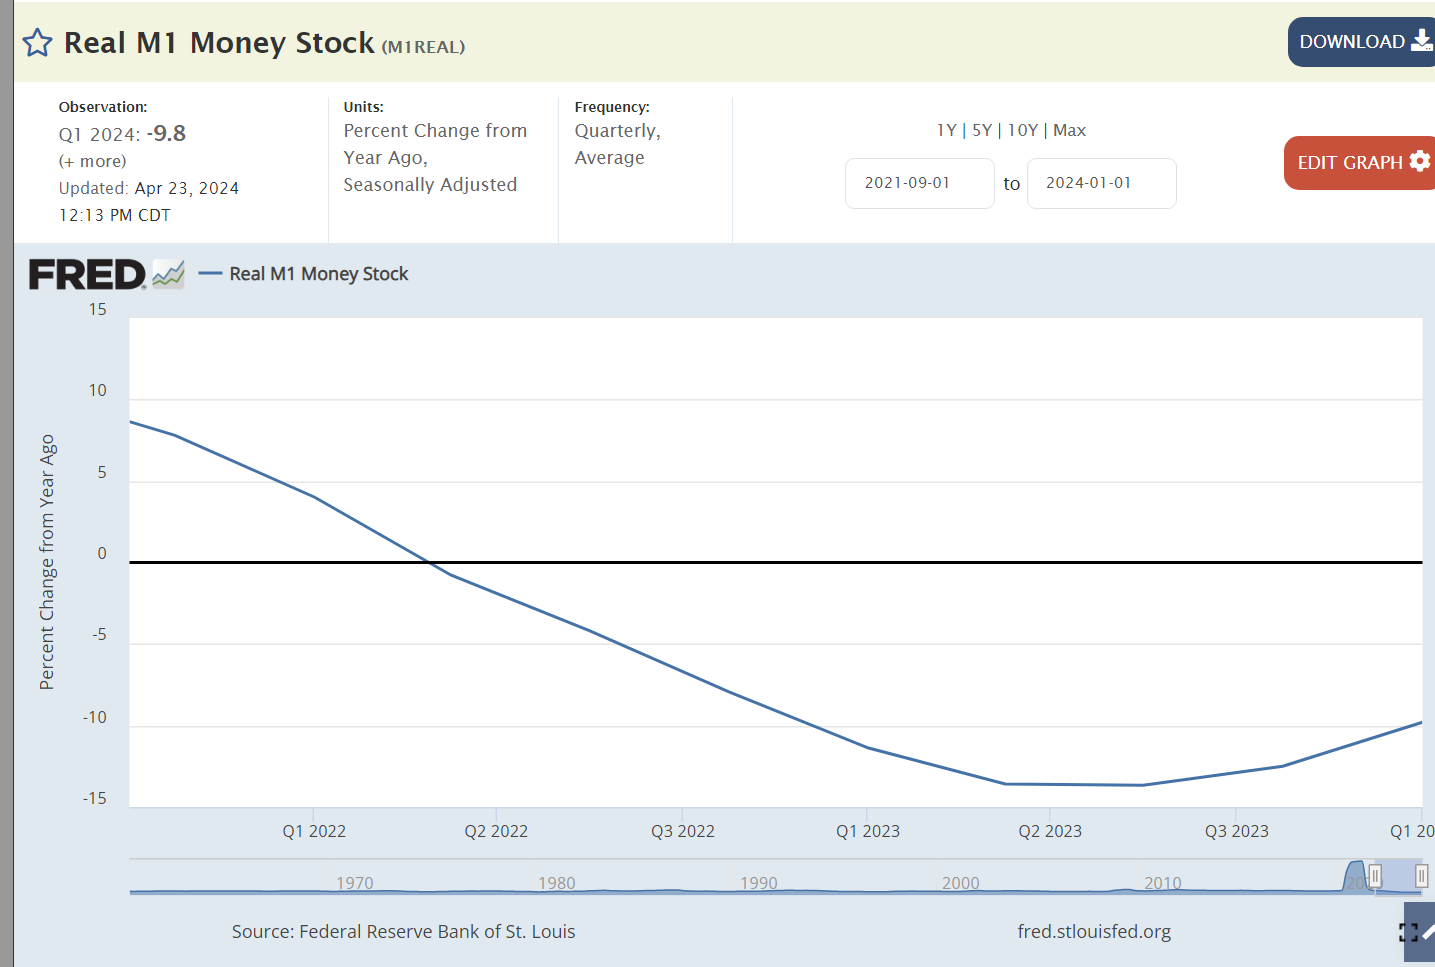
The money supply has a long-term impact on the economy, prices and inflation. The Federal Reserve Bank has been shrinking the “money supply” by 10% annually.

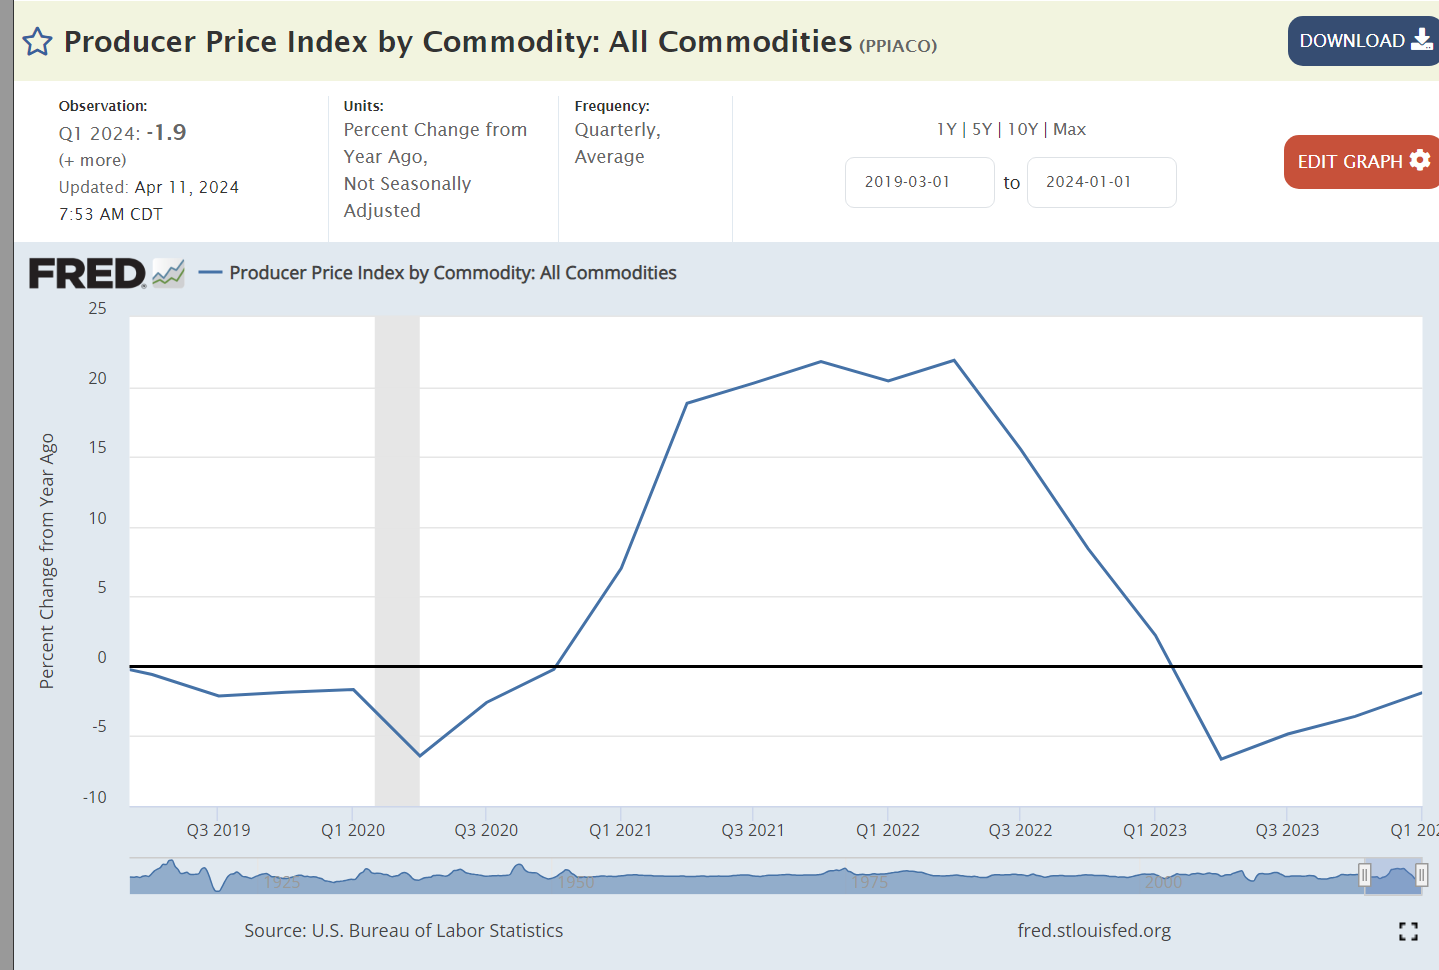
Commodities are the most volatile element of the global economy. Prices jumped by 20% with the unanticipated quick recovery from the pandemic. The last year has delivered commodities price deflation.

Changes in relative market power can drive inflation. Corporations increased profits by 50% in the first year of the pandemic. Profits have been relatively flat since then.

Summary

A dozen sectors point towards 2% inflation by year end. Energy, food at home, durable goods, nondurable goods, medical care, education/communication, housing prices, real wages, imports, money supply, commodity prices and profits.

Four sectors indicate concerns. Food away from home continues to drive high inflation.

https://www.axios.com/2024/02/13/cpi-food-inflation-dining-out

Public and private transportation services have not yet reached equilibrium. This pressure may continue for another 4 quarters but should not be a long-term inflation driver.

https://www.census.gov/construction/nrc/current/index.html

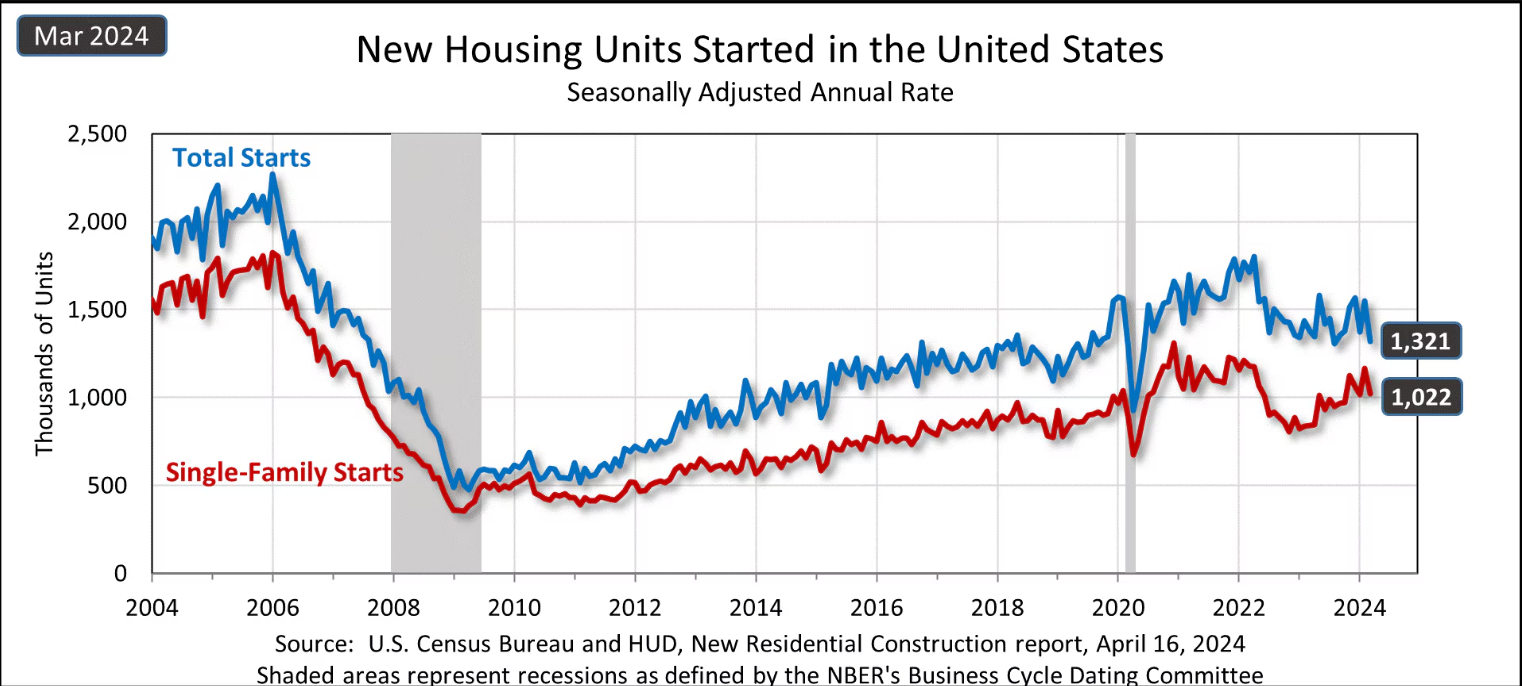
The “Great Recession” destroyed the construction industry. It has slowly recovered. Total construction has increased, perhaps not enough to bring housing supply into balance with demand 15 years later. Rental inflation at 3% is likely to continue.

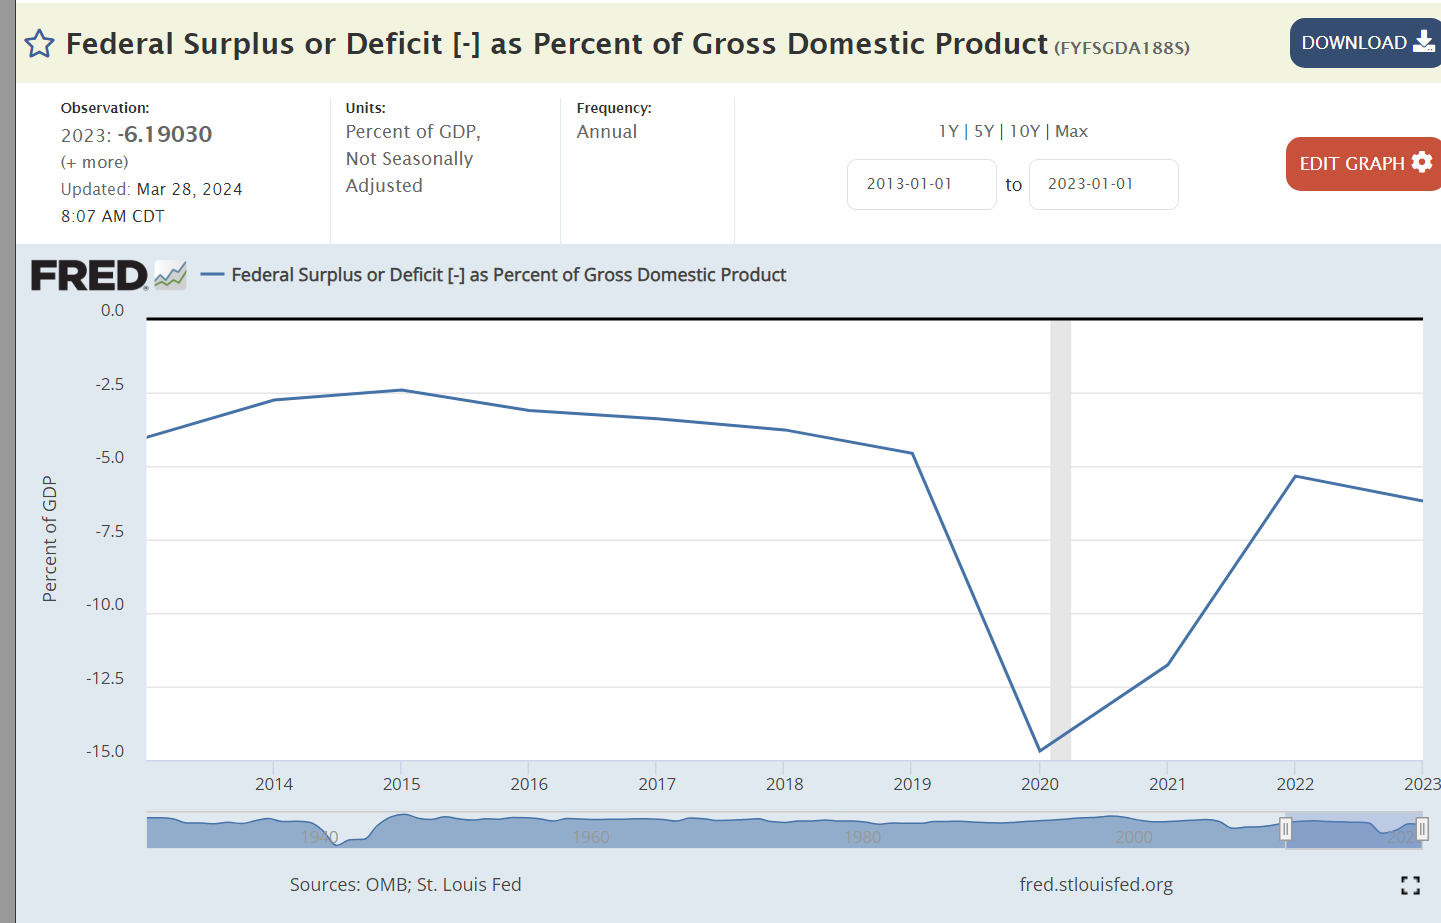
The federal budget deficit is the greatest concern. 6% of GDP is a huge deficit.

Net, net, I predict that the Urban Consumer CPI increase in the fourth quarter of 2024 versus the fourth quarter of 2023 will be 2.25%. The federal government spending deficit will directly and indirectly boost inflation.

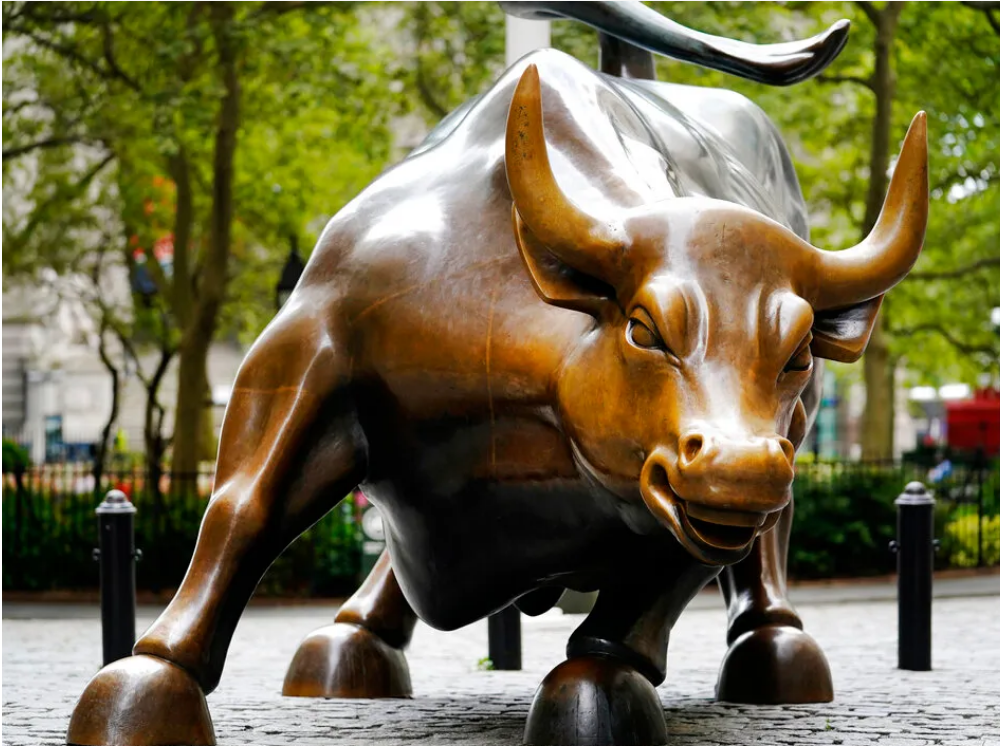
US Economy Consistently Exceeds Expectations (Index)

https://www.artnews.com/art-news/news/wall-street-bull-sculptor-arturo-di-modica-dies-digital-animation-sells-morning-links-1234584300/

Human Progress: Accumulate and Innovate

https://www.cnn.com/2016/03/17/world/gallery/tbt-albert-einstein/index.html

Human progress is based on 4 things, IMHO. We are able to abstract and generalize. We accumulate our lessons learned. We innovate. We combine our structured, accumulated knowledge with innovations. Creativity and innovation get most of the attention. Yet, the accumulation of our practical and theoretical experience in language, books, records and equations may be equally important. The ability to switch “back and forth” between a fixed structure, history, religion and culture and new innovations may be the most important aspect of all. We have divergent and convergent thinking abilities. We use inductive and deductive reasoning. We intuitively prefer “either/or” but can manage “both/and” logic. The modern history of mankind’s progress points towards the importance of creativity and “both/and” logic.

Abstraction is a relatively recent phenomenon. Democritus imagined atoms, smaller and smaller particles. Heraclitus imagined all as change. The Greeks imagined earth, water, air, and fire beneath everything. Pythagoras and Euclid provided geometric proofs and ideal figures. Aristotle offered a powerful version of formal logic. Plato defined the “forms” and the ideal realm that stands above our experienced reality. Descartes defined mind versus body and the Cartesian coordinate system. Newton rationalized the universe in terms of algebraically defined laws. Kant defined pure logic and the limits to pure logic. The great appeal of abstract rules and an implicit mechanical universe remains to this day. The “Enlightenment” produced new politics, economics, culture, science and religion based upon these powerful insights.

The accumulation of knowledge has occurred in a surprisingly wide variety of forms. Life in DNA. Sexual reproduction. Man’s biological memory. Human consciousness. Spoken language. Music. Myths. Written language. Culture. Laws. Accounting systems and records. Religious practices. Architecture. Books. Libraries. Scribes. Printing. Histories. Universities. Experimental science. Prophets. Peer-reviewed journals. Scientific societies. Mass media. Recordings. Radio. Video. Internet. Wikipedia. Zoom. 

The history of innovation is well known. I want to highlight the general trend away from simple, atomistic, “either/or”, static views to more complex, multi-level, “both/and”, dynamic, organic views that provide much better insights into our real experience.

Physics has moved from statics to dynamics. Classical mechanics has been replaced by complex, probabilistic quantum mechanics. The fixed, static, deterministic perspective has been replaced by Einstein’s relativity. In general, deterministic views are replaced by probabilistic views. The solid atoms have been replaced by waves and fields. Light exhibits both wave and particle behaviors. Heisenberg says we cannot measure everything. The background framework of an “ether” is no longer required. The mathematics required to describe physics has moved from algebra to multi-variate calculus to string theory. Only a handful of people truly understand the frontiers of physics in the last 100 years. 

Mathematics has advanced wonderfully in the last 500 years. Newton and Leibniz invented the calculus. Man could now measure, describe, imagine and control changes through time. There is an equation underlying all activities that can, in theory, predict the future and explain the past. Dynamics can be described. Three-dimensional Euclidean geometry was superseded by multiple-dimensional geometry, Riemann curved space and fractals. Probability theory was developed to clearly describe apparently random activities, providing a solid basis for evaluating the results of experiments. Set theory evolved to encompass all of mathematics and logic, including various conceptions of infinities. Goedel’s 1931 “incompleteness theorem” undercut Russel’s attempt to define a single, bottoms-up, certain, powerful mathematics.

Biology evolved from collecting, illustrating and categorizing specimens to Lamarck’s deterministic evolution to Darwin’s evolutionary survival of the fittest perspective. Society increasingly adopted a biological, process, systems theory perspective in place of a physics, mechanical, materialistic perspective. Nature versus nurture became nature and nurture. The details of genetics is better understood as a very complex process involving multiple genes and other structures.

In philosophy, Hegel defined his dynamic thesis, antithesis, synthesis model. History now ruled. Eternal universals were much less likely. Multiple perspectives were elevated. Certainty was less likely. Marx tried to use Hegel’s general framework combined with an economic, materialist determinism but he failed.

In practical technology, we have seen the rapid accumulation of knowledge. We have also witnessed the great importance of “both/and” solutions. For example, ships and automobiles required the invention of a clutch that provided both solid propulsion and slippage. Powered vehicles first required rails but were turned loose as motor carriages. Wheels evolved from steel to rubber to accommodate shocks, turns and rough roads. Vehicles added suspension systems. 

In economics, we advanced from mercantilism to comparative advantage and free trade. We left behind land, labor or capital as the only sources of value with the insights of the marginal productivity economists. We moved from static to dynamic perspectives and focused on the determinants of growth in advanced and developing nations. Keynes demonstrated that national economies were more than the sum of individual markets and that self-regulating equilibriums were not inherent in a market system. 

Computer systems have evolved from fully defined linear and logical systems to massively parallel systems capable of artificial intelligence and spoken interaction with humans.

Businesses have replaced assembly lines and Taylor’s experiments with a deeper understanding of individual tasks in probability terms and the sequence of events in any process. Firms have embraced Japanese style process management and improvement, delivering constantly improving results. Supply chains span the globe. Project management is now “agile”. Strategic planning is no longer deterministic, but focused on mission, vision, values, strengths, weaknesses, opportunities, threats and culture. Investments are considered within the framework of portfolios of risks and returns. Entrepreneurs and leaders are valued above technical and professional experts.

For many, religion has evolved from a legal, literal, deterministic perspective to one that emphasizes the principles, insights, opportunities, feelings, experiences and possibilities of a given creed, despite the loss of absolute certainty in a “Secular Age”. 

As humans we prefer a simpler, more deterministic view of the world. Yet the world shows us that it is more complex and that we will never fully understand it. 

Good News: Golden Age for US Jobs Growth (21st Century)

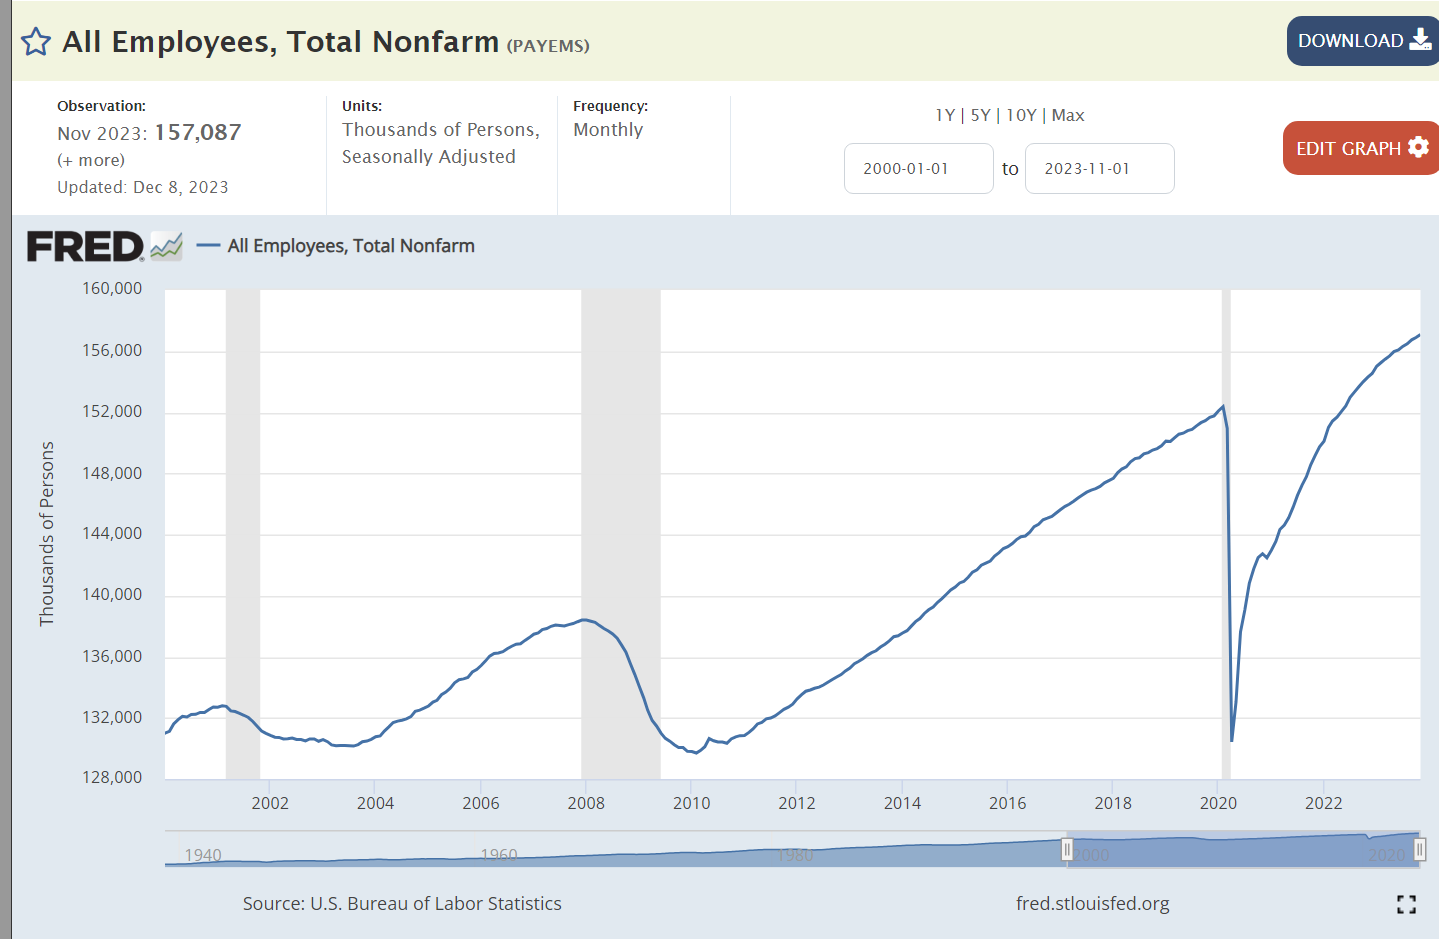
Economists prefer to measure data at business cycle peaks and troughs. After the Millenium Y2K scare, we endured a mini recession. Employment peaked at 132.8 million jobs in March, 2001. Today, in October, 2023, we have 156.9 million jobs, an increase of 24 million jobs in 22 1/2 years, almost 1.1 million new jobs created each year! This is despite the job destroying effects of the Great Recession and the Pandemic.

The longest business expansion in US history ended after 10 years in February, 2020. The pandemic eliminated almost 22 million jobs in 2 months, leaving the economy with just 130.4 million employed, barely above the trough of 129.7 million in February, 2010.

The economy replaced those jobs in just 26 months when the June, 2022 figures were reported! In addition to replacing the first 22 million jobs, the economy has added another 4.5 million jobs in the last 16 months, averaging 280,000 per month or 3.4 million per year! At the same period after the Y2K recession, the economy averaged 2.6 million new jobs per year. At the same period after the Great Recession, the economy averaged 2.8 million new jobs per year. Our economy averages 1 million new jobs per year and can accelerate to 3 million per year when recovering from a recession. The current recovery is stronger than either of the last two.

Another way to gauge progress is to measure jobs added from peak to peak. The economy added 5.6 million net new jobs by December, 2007, or 836K per year. In the 13 years until February, 2020 the economy added 22.7 million jobs, or 1.141M per year. Since then, the economy has added 4.5 million jobs, or 1.240 per year, a very solid result.

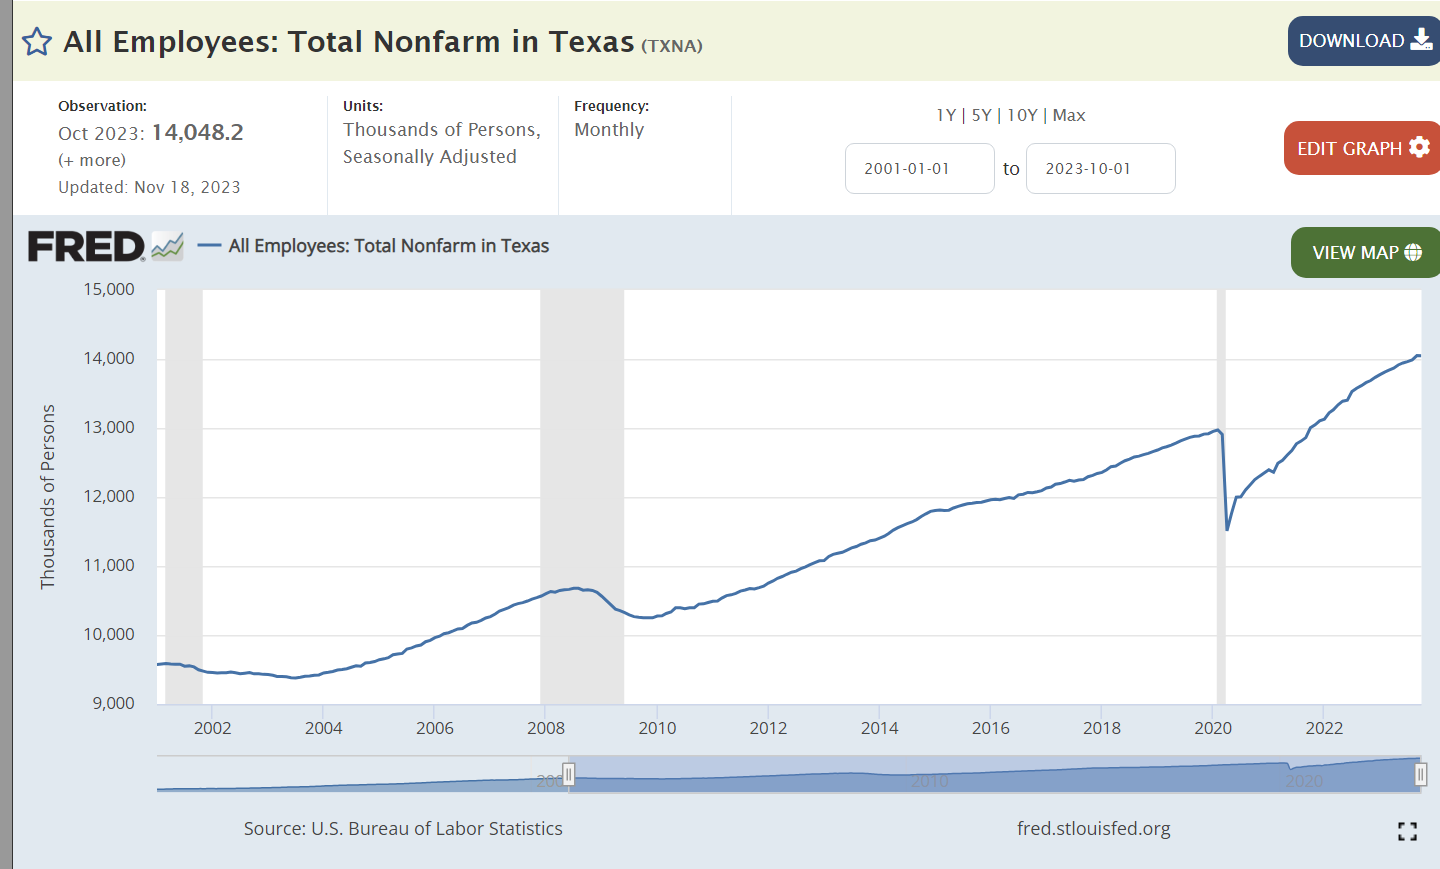
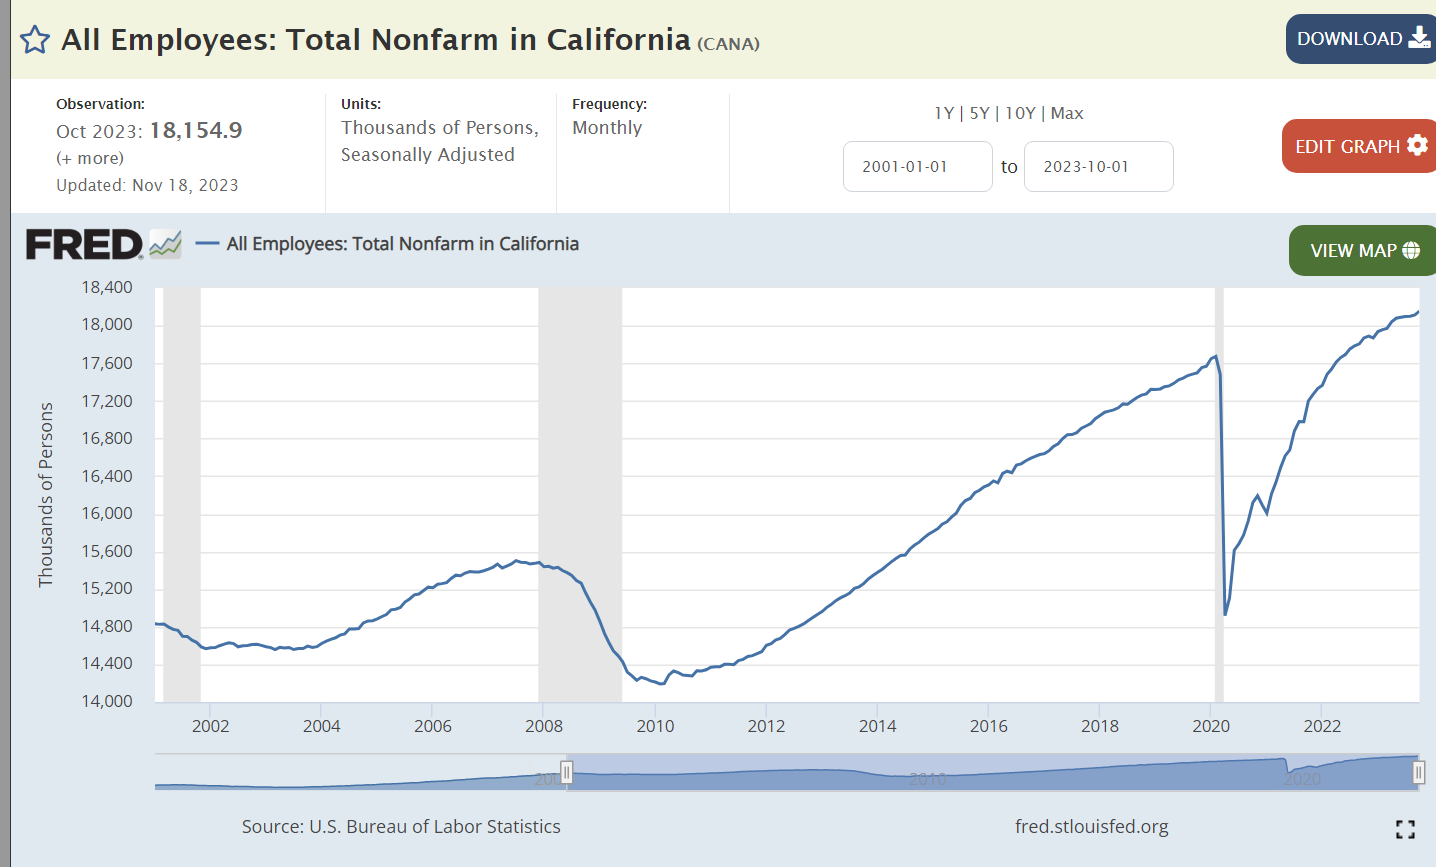
Where are the extra 4.5 million jobs? 38 states exceed their pre-Pandemic totals. Texas (1.1M), Florida (750K), California (500K), North Carolina (300K) and Georgia (250K) lead the way. Arizona, Utah, Tennessee, Nevada, South Carolina, Washington, New Jersey and Indiana each added at least 100K, for a total of 4 million by these 13 states. On the downside, New York remains 125K short and Vermont, DC, Hawaii and Rhode Island are more than 2% below February, 2020.

The post-pandemic economy is creating jobs slightly faster than the post-Great Recession economy. 17 states are growing at least 2% faster than their pre-Pandemic trend rate. Idaho, Nevada, Montana, Utah and Florida are growing at least 4% faster than before. 9 states trail their prior growth rates by at least 2%. North Dakota, Hawaii, New York and DC trail their prior growth rates by 4% or more, for various reasons.

During the full 23 years, Texas (4.5M), California (3.3M), Florida (2.7M), New York (1.1M) and North Carolina (1.0M) added the most jobs. Washington, Nevada, Arizona, Utah, Colorado, Tennessee, Georgia and Virginia each added more than one-half million, for a total of 18 million in the 13 leading states. While the nation added 18% more jobs during this period, 9 states grew by 3% or less: Louisiana, Mississippi, Illinois, Michigan, Ohio, West Virginia, Rhode Island, Connecticut and Vermont. These states accounted for more than one in six citizens in 2001, so their weak performances limited the overall economy.

Summary

The economy started the 21st century slowly with a small recession and weak jobs growth during the Bush years. Obama started his first 2 years with a 9 million job deficit before starting a very strong and long 10-year recovery that added 23 million jobs. Economists did not expect the recovery to last during the Trump administration but almost 9 million net jobs were added on his watch before the pandemic. Biden refilled the 22 million lost jobs in 26 months and has added 4.5 million more in the next 16 months. With the Fed’s higher interest rates, job growth is slowing but is generally expected to exceed 1.25 million in 2024. The US economy continues to outperform.

https://www.bls.gov/web/laus/statewide_otm_oty_change.htm

https://www.cbpp.org/research/economy/tracking-the-recovery-from-the-pandemic-recession

https://www.stlouisfed.org/publications/regional-economist/2023/nov/slower-gdp-growth-falling-inflation-us-economic-outlook-2024

https://www.forbes.com/sites/jackkelly/2023/11/18/heres-why-the-job-market-will-improve-in-2024/?sh=eedb8d139ead

https://www.morningstar.com/markets/why-we-expect-job-market-slow-2024