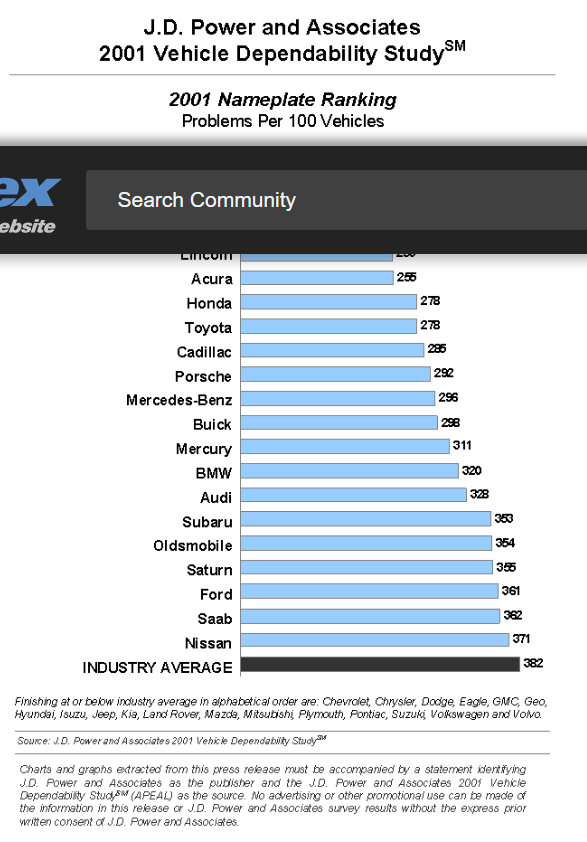
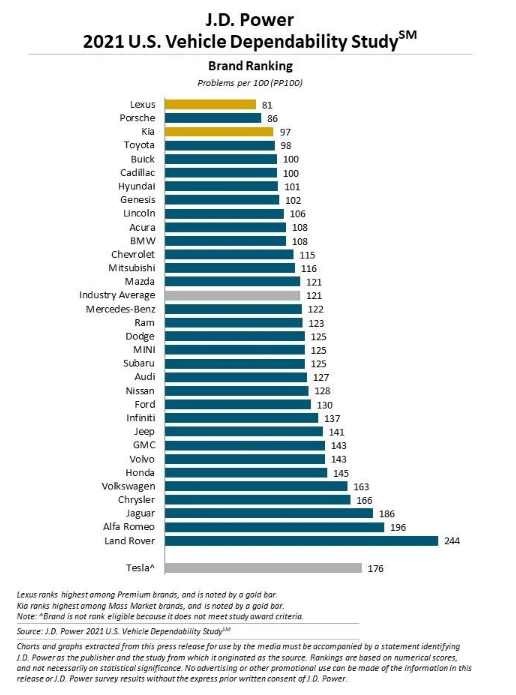
#1 Carmel is a Self-fulfilling Prophecy

National Awards

Why Carmel, Indiana, Is the Best Place to Live in 2026-2027 | Real Estate | U.S. News

City Wide Awards | Carmel, IN

Carmel, Indiana is a 46 square mile city of 105,000 people a dozen miles north of downtown Indianapolis.

As 28-year mayor Jim Brainerd once quipped, “We don’t have mountains, valleys or an ocean, but neither does Paris”. How could an Indiana city create such a natural reputation for success?

James Brainard – Wikipedia

Common Advantages

Carmel is a suburb of Indianapolis, so it has benefitted from suburban growth since the 1950’s.

Indianapolis, like Columbus, Nashville, and Minneapolis, has been a heartland growth winner.

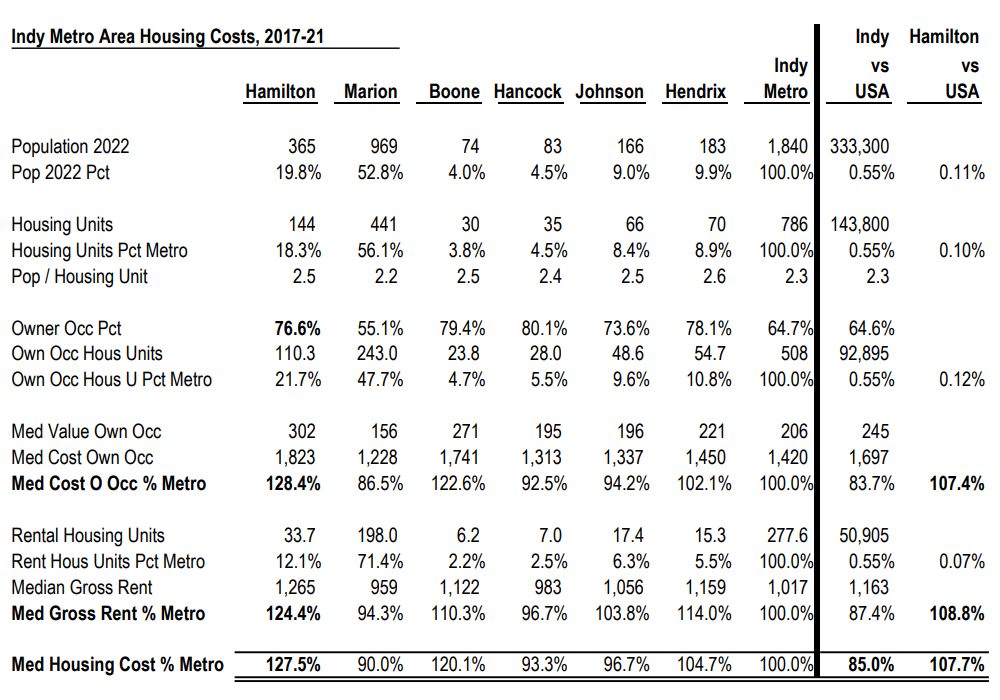
Indiana is a low cost of living location, benefitting from being the “Crossroads of America”.

Indiana is a low tax and low government services state, with expectations that government needs are best addressed at the lowest possible level.

Indianapolis has no natural geographical constraints to growth or limits that raise the cost of living. The Northwest Territory’s 6×6 mile townships expand in all directions.

Most metro areas have a preferred direction for wealth and growth. Indianapolis chose to develop straight north along Meridian Street across the Marion County border into Carmel by the 1950’s.

This branding and “first mover” advantage is common among America’s 50 large metro areas. Carmel benefitted from competitors in NW Zionsville limiting development to preserve the small village character, NE Geist having limited lakefront property and NNE Fishers limited main highway access.

History | Carmel, IN

Carmel’s Quaker Roots and Early Settlers: A Historical Perspective

Local History – Carmel Clay History Museum

A BRIEF HISTORY OF CARMEL, INDIANA

Carmel – Encyclopedia of Indianapolis

Good Political Choices

While Indiana today is considered a deeply red state, historically it was more purple, with heavy manufacturing/worker counties balanced by rural/farming counties. Indianapolis was a local government innovator, creating county wide Unigov in 1970 to combine the city and county, preserving Republican dominance. Indianapolis has elected centrist mayors for 6 decades: Lugar, Hudnut, Goldsmith, Peterson, Ballard and Hogsett.

List of mayors of Indianapolis – Wikipedia

Carmel became a city in 1976. Many of these elected officials have served the community for 50 years!

Carmel City Council celebrates 50th anniversary of its first meeting 

Jim Brainerd served as mayor from 1996-2024 as a centrist/practical Republican in the Governor Daniels mode, focusing on local economic issues and needs, without being distracted by national wedge issues.

Mitch Daniels – Wikipedia

Carmeltopia

Carmel understood the power of zoning and used this to adopt overlay zones to guide denser and higher quality development in the Meridian corridor, Range Line Road, Arts & Design District and Midtown areas. Politicians understood that Carmel was a valuable place for developers and set limits to ensure that the community would also benefit from growth.

Mayor Brainerd used the powers of the Indiana strong-mayor system to create tax increment finance (TIF) districts to capture the future property tax values of areas to allow for leveraged government investments in infrastructure.

A less taxing approach?: Carmel embraces benefits of TIF for major redevelopment efforts | Aim

Carmel Redevelopment Commission | Carmel, IN

Mayor Brainerd and the city council also allowed the city to borrow at advantageous interest rates to finance other investments to promote the city’s growth.

Carmel’s Billion-Dollar Bet

Debunking the sensationalism of Carmel’s debt

Independent review of Carmel’s debt raises no red flags

Like many governments, Carmel offered tax incentives to attract corporate developments.

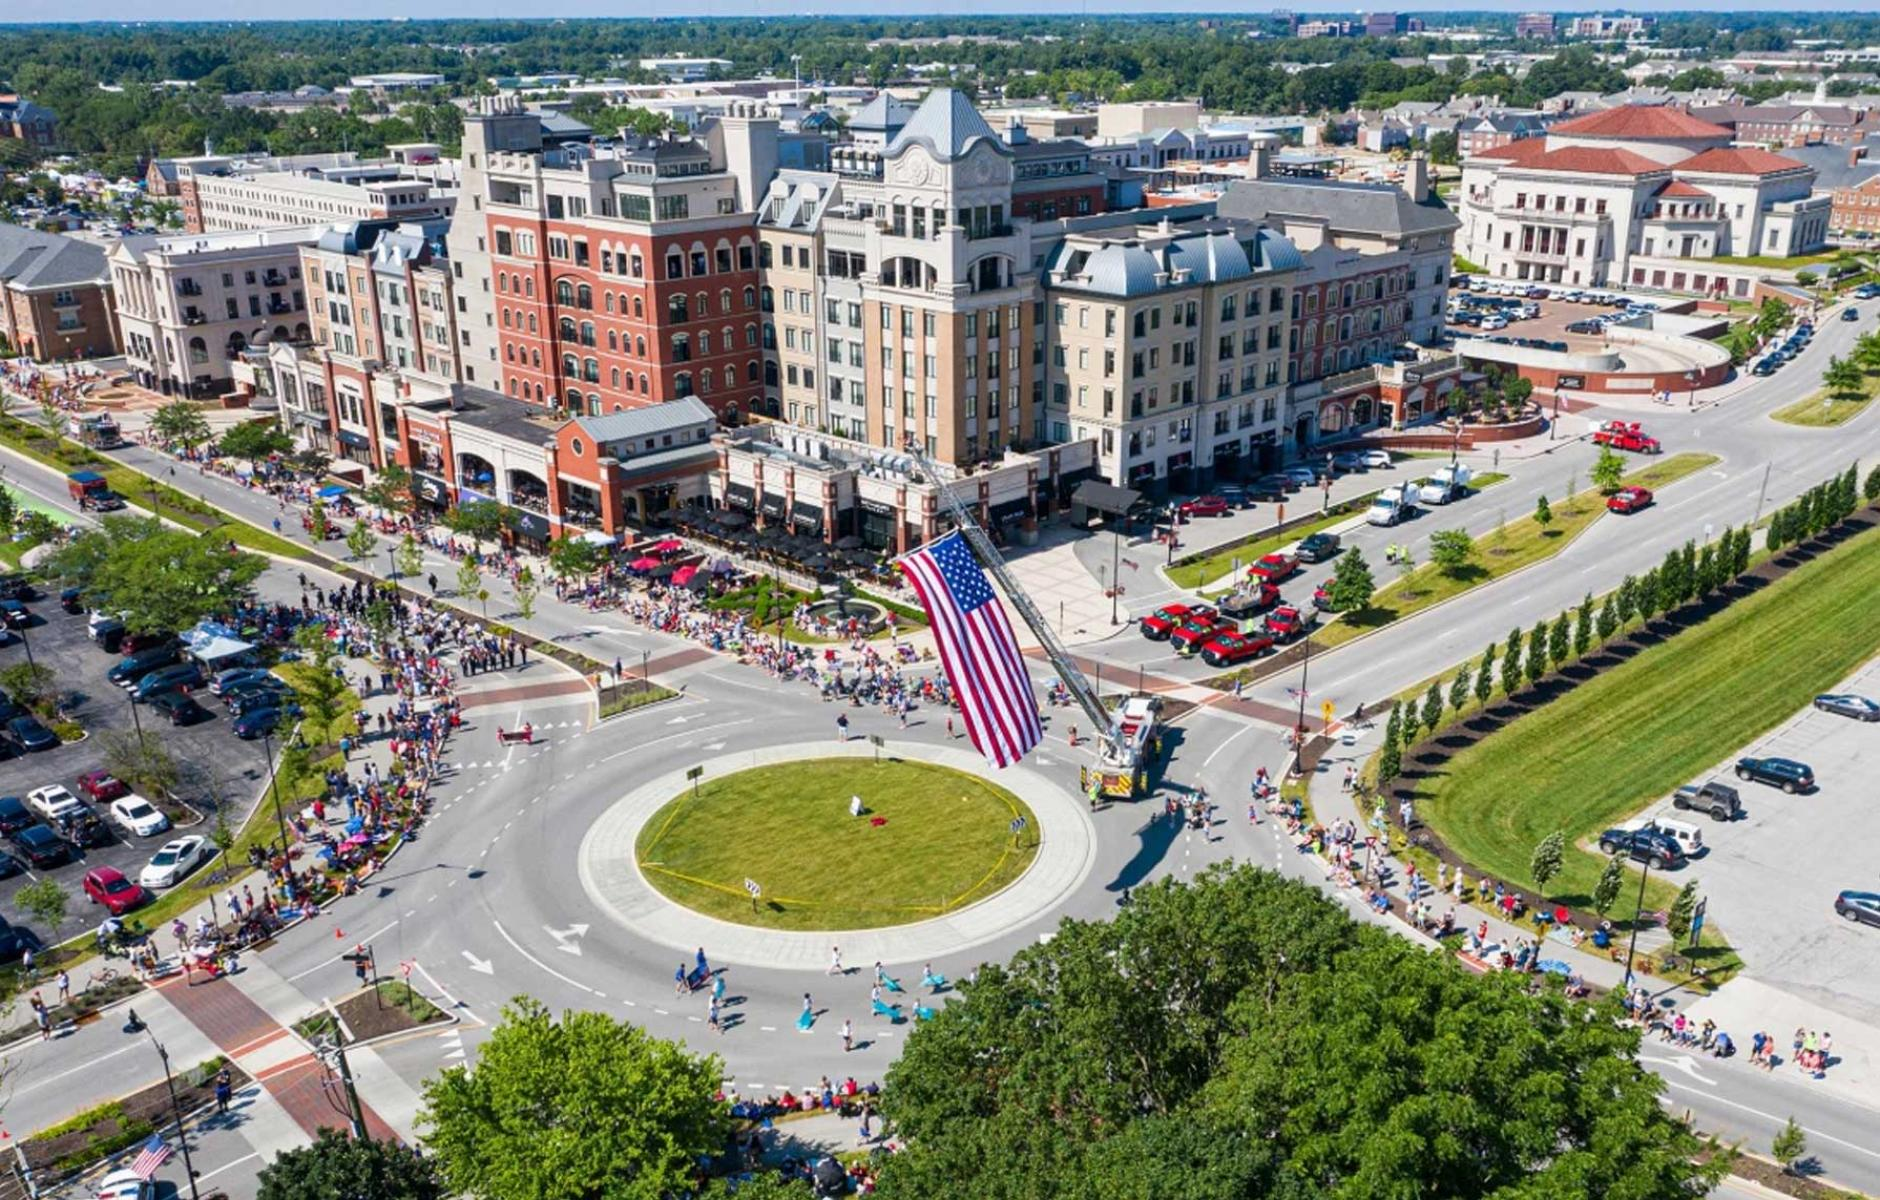
Mayor Brainerd found that roundabouts were a local, traffic, aesthetic, environmental, safety, time, and cost winner. He prodded the city the install 150 roundabouts.

Mayor Brainerd incorporated a small investment into the arts and not-for-profits into the annual budgeting cycle. Local citizens applauded.

Mayor Brainerd chose to invest in community art, statues downtown and in the roundabouts. Again, the community applauded.

Roundabout Art – Carmel Roundabouts

Roundabout Art Map

City unveils ‘Homage to Hoagy’ sculpture | Allied Solutions Center for the Performing Arts

Carmel Style Takes Flight

Beacon Bloom sculpture welcomes motorists to Carmel

Carmel unveils 2026 arts grants recipients

How roundabouts transformed Carmel | CNU

Carmel Indiana Roundabouts: Case Studies: ERIT: Environmental Resilience Institute: Indiana University

People Committed to Excellence

Journalistic histories emphasize the role of Mayor Brainerd in “transforming” the sleepy suburb into a new urbanist “edge city” and nationally recognized place to live. Mayor Brainerd deserves credit as a visionary and catalytic leader who delivered the goods for 3 decades. Yet the Carmel story begins before him and continues today. It relies upon political, government, community and volunteer leaders who believed that Carmel could deliver the highest possible quality of life for its residents and neighbors. I point to a few representative leaders who deserve credit.

Mayor Brainerd, 1996-2024

Meet the Mayor Who Totally Transformed His City

James Brainard – Wikipedia

Mayor Jane Reiman, 1980-87, member of initial 1976 city council.

Foundation builder: Carmel’s first two-term mayor reflects on key events that helped shape

Dave Coots, member of initial 1976 city council, practicing law in Carmel 50 years later.

Attorneys emphasize planning early for smoother retirement – The Indiana Lawyer

James Garretson, Carmel teacher and member of initial 1976 city council, still serving on appointed boards.

Staff Directory • James D. Garretson

Fred Swift, county government executive and member of initial 1976 city council, still serving on appointed boards.

Staff Directory • Fred Swift

Gail Bardach, city and county judge, 1992-2024.

Retiring Hamilton County judge reflects on career 

Christine Altman, Hamilton County Commissioner, representing Carmel 2003 – .

Christine Altman Biography | Hamilton County, IN

Steve Dillinger, Hamilton County Commissioner, 1989 – .

Steve Dillinger Biography | Hamilton County, IN

Mark Heirbrandt, Hamilton County Commissioner, 2013 – .

Mark Heirbrandt Biography | Hamilton County, IN

Steve Holt, Hamilton County Commissioner, 1989 – 2012.

Steve Holt – Upper Captiva Fire

Brenda Myers, Hamilton County Tourism director, 2005 – 2024.

More than a job: Retiring Hamilton County Tourism CEO leaves legacy leadership

John Hensel, Clay Township Trustee, 20 years.

Clay Township Hamilton County – Clay Township Trustee

Sue Finkam, City council 2012-23, mayor 2024 – .

About | Sue Finkam for Carmel Mayor

Kevin “Woody” Rider, council 2008 – 22.

Carmel’s longest-serving city councilor launches mayoral campaign

Ron Carter, council 1996 – 2019.

Center Green becomes Carter’s Green in honor of city councilor

Jeff Worrell, council 2016 – .

Jeff 4 Carmel

Mark Westermeier, parks director, 2003 – 18.

Q&A with Mark Westermeier | Carmel Clay Parks & Recreation

“West Commons” Renamed to “Westermeier Commons” to Honor Director

Nancy Heck, Director of Community Relations and Economic Development, 1998-2024.

Nancy Heck | LinkedIn

One ‘Heck’ of a show

John Duffy, Utilities Director, 1992 – 2025

TRIBUTE TO JOHN DUFFY – Carmel Green Initiative

Judy Hagan, parks founder and Clay Township Trustee

Q&A with Sue Dillon + Judy Hagan | Carmel Clay Parks & Recreation

Carmel Clay Historical Society to remember Carmelot park

Sue Dillon, parks founder and Citizens for Greenspace founder.

SUE DILLON – Carmel Clay Parks & Recreation

Wendy Phillips, library director, 2000 – 15.

Carmel Library director to step down in June

Mo Merhoff, chamber of commerce director, 2000 – 2020.

Mo Merhoff retires – LarryInFishers

Merging Mountains, Two Chambers at a Time – Towne Post Network – Local Business Directory

Volunteer leaders recognized annually by Carmel Rotary Club

Outstanding Service Award | Carmel Rotary

Safety

Carmel has invested resources in making it a safe city. School safety officers requiring a separately approved levy. Formal quality standards for police and fire departments. County level emergency preparedness investments.

Accreditation | Carmel, IN

Accreditation | Carmel, IN

Carmel School District Puts State’s First $40M Safety Referendum On Ballot

Hamilton County starting work on new 911 and emergency operations center in July

$85 million public safety center to be built in Hamilton County | Fox 59

Unified response: New facilities to enhance public safety operations in Hamilton County

Already low, criminal activities further decline in Carmel • Carmel, IN

Schools

Carmel public schools are consistently rated among the best in Indiana. Critics say this reflects the wealthy socioeconomic status of the community. “The proof is in the pudding”.

Carmel Clay Schools – Indiana – Niche

Carmel has 50+ National Merit Semifinalists each year, more than 8 states.

District News – Carmel Clay Schools

Our Hamilton County: More National Merit Scholars than 13 States – Good News

Nearby Guerin Catholic HS attracts Carmel students to its highly rated programs.

Guerin Catholic High School | 317-582-0120

University HS was established in Carmel by a group of community leaders in 1998, serving the needs of high potential students.

Mission, History, & Facts – University High School

Indiana schools are mainly funded through a statewide formula. Indiana property taxes are capped as a percentage of value. Carmel residents have chosen since 2010 to approve property tax levies to exceed the formula and the standard maximums. Recent state tax, budget and formula changes are driving new requests.

(20+) Operating Referendum History: The first CCS… – Carmel Clay Schools | Facebook

Carmel Clay Schools bracing for greater than expected financial loss from property tax law 

Carmel library has moved twice, expanded its main location and added a branch location. Carmel library has been nationally ranked for its activity, circulation, programs and financial investments.

Carmel Clay Public Library – Wikipedia

Carmel Clay Public Library – RATIO

Our Hamilton County: Busy Public Libraries – Good News

Carmel PTOs are strong, investing in students through financial and volunteer support. Carmel HS organizations enjoy similar support.

how strong are carmel indiana ptos – Google Search

Diversity

Carmel aspires to be a diverse community. It has been a primary corporate transfer and health care professional destination, welcoming non-Hoosiers and preparing residents and students for national and global roles.

Carmel has more economic diversity than some expect, with many middle-class and young adult neighborhoods south of 116th Street and within the boundaries of Keystone Parkway and Meridian/US 31.

Home Place – Encyclopedia of Indianapolis

Carmel development to bring parking garage, apartments to downtown

Historical Facts about Woodland Springs — Woodland Springs, Inc – Carmel, Indiana

Carmel has been an active sister cities participant and welcomed global cultures.

Sister Cities | Carmel, IN

Chinese Mooncake Festival | Carmel, IN

Another individual driving progress.

Cultivation and Contribution – Carmel – Towne Post Network – Local Business Directory

Kawachinagano Japanese Garden: A Carmel Hidden Gem

Women have played a leading role in Carmel’s success.

Carmel’s 3 female mayors share stories at historical society’s spring tea

She L.E.A.D.S. Conference | Hosted by Carmel Mayor Sue Finkam

History making all female leadership team

Our Hamilton County: Women Hold 40% of Elected Public Offices – Good News

Quite Religious

Historically.

Back in the day: White Chapel among county’s oldest religious structures

Carmel Friends Church 1 – Carmel Friends Church

quaker history carmel indiana – Google Search

Our Hamilton County: Diverse Religious Traditions – Good News

Mainline Protestant.

Orchard Park Presbyterian Church – Welcome, we’re glad you’re here!

St. Christopher’s Episcopal Church – Embracing God’s Expansive Lov

Home

Open and Affirming Church in Carmel, Indiana -St. Peters UCC | St. Peter’s UCC Carmel

St. Mark’s United Methodist Church of Carmel Indiana Inc. – Home

Carmel – Cornerstone Lutheran Church

King of Glory Lutheran Church – Home

Welcoming Disciples of Christ Church in Carmel | Carmel Christian Church

Catholic churches.

St. Elizabeth Seton Catholic Church | Carmel, Indiana

Our Lady of Mount Carmel Catholic Church | Carmel, IN

St. Maria Goretti – Westfield, IN

Nondenominational Churches.

Campus Details | Northview Church

Community & Worship Services | Grace Church Noblesville

Mercy Road Church – Carmel | Carmel: Live Boldly. Love Deeply. Carmel, Indiana | Carmel, IN

Location Detail | Traders Point Christian Church

World religions.

Holy Trinity Greek Orthodox Church, Carmel, United States – World Orthodox Directory

Congregation Beth Shalom

Carmel breaks ground on 1st mosque | wthr.com

Indianapolis Indiana Temple | ChurchofJesusChristTemples.org

Economic Development

Density is good. Commercial property tax base is good. Employers are good. These 3 statements seem trivial and obvious, but many “professional class” suburbs reject them, wishing to live in an idyllic rural paradise. Carmel has always embraced manufacturing, offices, retail, and apartments.

The Meridian Corridor overlay district promoted dense development and prevented strip malls. The Range Line Road overlay district required dense and multi-use development. The early overall zoning plan encouraged economic development in the central 8 square miles of the city, within the 46 square mile footprint.

Carmel employed TIF districts and public borrowing to attract investors to its central city developments.

It employed the usual tax abatement tools to encourage major corporations to locate within Carmel.

Midcontinent Independent System Operator – Wikipedia

New Corporate Headquarters in Midtown | Allied Solutions | Allied Solutions | B2B Financial Services | Risk Management | Insurance

history of conseco in carmel indiana – Google Search

Republic Airways’ New Campus Takes Indiana’s Largest Airline to New Heights | Republic Airways

Allegion | Creating a Safer and More Accessible World

ADESA

enVista | Supply Chain and Enterprise Technology Consulting

Underground Utility Location and Damage Prevention | USIC

CNO Financial Group

IU Health North Hospital – Carmel | IU Health

Luxury Home Builder Central Indiana | Custom, Curated & Townhomes | Old Town Design Group

Corporate Website | Delta Faucet Company

Home – Zotec Partners

Belden

Sun King Brewery, Carmel, IN — Sun King Brewery

CSBN | Carmel, IN

OneZone Chamber – Org Name

A Virtuous Growth Cycle

By decade, Carmel’s population grew from 1950 to 2026 in thousands as 2, 10, 20, 33, 43, 65, 83, 99, 105. 4 decades of 10,000 population growth followed by 4 decades of 15,000 population growth. Growth may slam shut in 2030-2035. Growth provides advantages to utilities, realtors, developers, construction firms, media, and governments.

Township Census Counts: STATS Indiana

Indianapolis’ Population is Booming. Savvy Investors are Taking Note. – T&H Realty Services

Good News: Metro Indy is a Midwest Jobs Leader, 1990-22 – Good News

Community Events

Lacking mountains or oceans, the community has developed events for every month of the year to celebrate. Many events were created, grown and managed by small groups of individuals with background support from the city government.

CarmelFest: The festival has come a long way since the days of the stilt walker

CarmelFest | Carmel Rotary

Celebrating 25 Years of the Carmel Farmers Market

Carmel Farmers Market – Winter

How authentic German culture made Carmel’s Christkindmarkt #1 yet again

Carmel Christkindlmarkt | Authentic German Christmas Market Indiana

The Ice at Carter Green

carmel gazebo concerts history – Google Search

Concert Schedule – Summer Family Concert Series at the Gazebo

carmel international arts festival history – Google Search

Carmel International Arts Festival – The Arts Come Alive!

carmel porchfest history – Google Search

About — Carmel Porchfest

Events — Carmel Porchfest

Oktoberfest | Carmel, IN

Japan SpringFest | Carmel, IN

Chinese Mooncake Festival | Carmel, IN

City of Carmel’s annual Memorial Day Ceremony is May 22 • Carmel, IN

HOME | Carmel Jazz Fest

Parade | Celebrate Patriotism – Join the Parade — CarmelFest

Homecoming Week!!! – CHTV

Arbor Day | Carmel, IN

carmel indiana artomobilia history – Google Search

ARTOMOBILIA | Overview 2026

Carmel Food Truck Fridays

Cool Creek Concert Series | Hamilton County, IN

The Center Celebration 2026 presented by Ice Miller | Allied Solutions Center for the Performing Arts

Carmel Veterans Day Ceremony set for Friday

Calendar • Martin Luther King Jr. Commemoration Ceremony

Carmel Pride

Carmel on Canvas – Carmel Arts & Design District

Holiday home tour to feature Shull designs

Calendar • Concerts in the Centerpiece

Home | Carmel Marathon

Public Safety Day | Carmel, IN

RAIN ON MAIN – Home

Americana on Main | Carmel, IN

Festival of Ice | Carmel, IN

Bike Carmel Events | Carmel, IN

Placemaking

Carmel has leveraged its existing natural neighborhoods to develop a sense of place. Real estate developers have built traditional 50-300 home subdevelopments and filled in spaces. The city focused on the central city neighborhoods to define the “arts & design district” and midtown. The parks district has built and enhanced regional and neighborhood assets.

CNAN | Carmel, IN

Kawachinagano Japanese Garden – Carmel Clay Parks & Recreation

The Palladium at the Center for the Performing Arts – Wikipedia

Midtown Plaza Carmel – A new, vibrant revitalization of Carmel’s old industrial area

Home – Carmel Arts & Design District

The Emerging New Aspirational Suburb | Newgeography.com

Carmel: Leadership in Action, Part Two – Aaron M. Renn

Carmel: Leadership in Action, Part One – Aaron M. Renn

Indiana’s Monon Trail – Rails to Trails Conservancy | Rails to Trails Conservancy

The Transformation of the Monon Trail

Reimagining Flowing Well Park | Carmel Clay Parks & Recreation

96th Street Roundabout Art | Carmel, IN

This is Home Place | Yard & Company

The Village of WestClay

Old Town Design Group begins several projects throughout Carmel

Central Park | SmithGroup

Carmel Clay Central Park | Landscape Performance Series

Coxhall Gardens History | Hamilton County, IN

Explore West Park in Carmel: Family-Friendly Fun | WE LIKE INDY

Carmel’s Quaker Roots and Early Settlers: A Historical Perspective

Home – Carmel Clay History Museum

Woodys Library Restaurant – Home

West Park, Carmel Clay Parks & Recreation | SmithGroup

A Defining Moment | Carmel Clay Parks & Recreation

On the horizon: Major redevelopment announcements, parks improvements expected in 2026

Bold corridor attracts investment | CNU

A Bridge to Nature – Carmel Clay Parks & Recreation

Profile – Carmel Clay Schools

Carmel & Clay Center Elementary Schools – CSO

Carmel Clay Public Library – RATIO

Indiana Art: Carmel roundabout artwork has a story behind it

Midtown | Carmel, IN

About – Carmel Clay Schools

Strong Towns Langley – Carmel: Transforming a Typical Suburb

REA

Carmel completes its City Center | CNU

Carmel’s Monon Boulevard wins Community Placemaking Award

Carmel seeking public’s assistance in new neighborhood design

A City Arises from Sprawl: Carmel, Indiana – International Making Cities Livable

This Is the Best Designed Suburb in America – YouTube

Carmel, Indiana Case Study | North Star Place Branding

Why Carmel IN Is One of the Best Places to Live Near Indianapolis

Carmel, Indiana – Hamilton County – Business View Magazine

Column: Placemaking brings us together

Investing in the Future: Children and Youth

See Schools section above.

Carmel Clay Historical Society to remember Carmelot park

carmel indiana boy scouts history – Google Search

Book traces Carmel Dads’ Club roots

Carmel Dads’ Club: Spirit of a Community | PBS

Front Page 2026 – Carmel Icehounds

Marching Band – Carmel Bands

Carmel High School band finishes second at BOA Super Regional

history of carmel swim club – Google Search

How Dominant Is the Carmel High School Girls Team?

State Champions crowned in Girls Swimming & Diving | Indiana High School Athletic Association

Carmel’s Improbable 1977 Basketball State Championship – Towne Post Network – Local Business Directory

Carmel Greyhounds win 200th state championship – Indianapolis News | Indiana Weather | Indiana Traffic | WISH-TV |

Carmel Mayor’s Youth Council | Carmel, IN

PTOs & Greyhound Council – Carmel Clay Schools

Chuck Koeppen | Indiana High School Athletic Association

Former Carmel High School coach Koeppen wraps up legendary head coaching career 

IHSAA girls soccer: Carmel, coach Frank Dixon part ways

Kevin Wright | Carmel High School Football

Droplight Grand Park Sports Campus | Westfield, Indiana

Arts & Entertainment

See Community Events.

New Center Presents season include tribute acts, spoken word series

Songbook Academy in Concert | Allied Solutions Center for the Performing Arts

Tickets & Events | Indianapolis Symphony Orchestra

Home – Carmel Symphony Orchestra

Carmel International Arts Festival – The Arts Come Alive!

Home – Carmel Arts & Design District

Upcoming Programs & Events – Carmel Public Library Foundation

The Great American Songbook Foundation

RAIN ON MAIN – Home

Carmel on Canvas – Carmel Arts & Design District

Carmel Theatre – The Cat

Actors Theatre of Indiana – live. professional. theatre.

HOME – Carmel Community Players

HOME | Carmel Jazz Fest

Carmel Porchfest

Oktoberfest | Carmel, IN

Restaurants with Live Entertainment | Feinstein’s Carmel IN

Palladiscope | Carmel, IN

Public Art & Sculptures – Carmel Arts & Design District

Final life-like sculpture unveiled in Carmel. Here’s how much they cost

Indiana Art: Carmel roundabout artwork has a story behind it

CARMEL BANDS – Carmel Bands

Concert Schedule – Summer Family Concert Series at the Gazebo

Serving the Community

See “people” and “quite religious” above. Individuals and organizations invest in the community.

News Release: Carmel Fire Department awarded International Accreditation status for 3rd time

carmel range line pioneer award – Google Search

carmel pillar of the community award – Google Search

Outstanding Service Award | Carmel Rotary

History | Carmel Rotary

History — Carmel Lions Club

Kiwanis Club of Carmel

PTOs & Greyhound Council – Carmel Clay Schools

Carmel Masonic Lodge #421 – Making Good Men Better in Carmel, Indiana Since 1870

Home – Carmel Youth Assistance Program

Accreditation | Carmel, IN

Carmel Mayor’s Youth Council | Carmel, IN

Volunteer With Us | Carmel Clay Parks & Recreation

Teen Volunteer Corps – Carmel Clay Public Library

Home – Hamilton County Community Foundation

Mission CUMC food pantry

Merciful HELP Center – Carmel, IN

Home – Meals on Wheels Hamilton County

Janus Developmental Services

PrimeLife Enrichment – Senior Center for Hamilton County

Good Samaritan Network of Hamilton County,Inc.

HOME | Familypromisehamcoin

Home | Prevail

Home | Riverview Health

Delbert L. Waugh Post 10003

American Legion Carmel Post 155

HCMGA – INDIANA – Hamilton County Master Gardeners Association, Indiana – Helping Others Grow

Carmel HS Dance Marathon celebrated on ‘The Kelly Clarkson Show’ | wthr.com

Making Connections: Hamilton County Community Foundation focuses support on nonprofits, services

Foundation Home – Carmel Clay Schools

Foundation – Carmel Clay Public Library

Welcome to The Humane Society for Hamilton County

Trinity Free Clinic

Summary

Carmel began with advantages as a growing suburb north of Indianapolis’s historic Meridian-Kessler neighborhood. Political leaders made wise decisions for several decades. Carmel’s measures of success have gained national recognition. However, the character of the community and quality of life is driven by the personal responsibility that citizens take for themselves and their neighbors as symbolized by the moms who built the first park and the dads who started the youth athletics programs.

Carmel Clay Historical Society to remember Carmelot park

Our History Carmel Dads Club.

We’re MUCH Better Off in 2026

Rose Colored Glasses; Man Bites Dog; If it Bleeds it Leads.

Politicians, journalists and influencers of all stripes emphasize the bad, the emotional and the unusual. This burdens us and our society. Allegedly, “it’s bad now, and it was MUCH better in the past”. This eternal NOSTALGIA is a big problem for our society today, leading many people to turn to populists, idealists, authoritarians and charlatans for salvation.

I will outline how much better the United States of America is TODAY than it was in the mid-1970’s. I graduated from high school with the class of 1974. I watched the emotionally mixed American bicentennial celebrations in 1976. I remember Jimmy Carter’s 1979 “malaise” speech in which he said that we, the people, needed to face our challenges directly, especially at a moral level. He was briefly cheered but then criticized for being too negative and pessimistic; an uninspiring leader!

Modern life in the USA is immeasurably better than it was in the 1970’s. It is certainly not perfect. The country has not achieved all that it could have or should have in the last half century. It still faces large global and moral challenges and wonders where it can possibly find the leadership, consensus and engagement to resolve them.

The sheer magnitude of changes in daily life across 50 years is difficult to describe but I hope that my outline will collectively communicate the great scale of improvements we have experienced and the resulting hope and expectation that the next 50 years will deliver the same kinds of positive growth. When we consider the last 50, 100 or 150 years of American life, we should be very optimistic.

Global Threats and Opportunities

  1. The Cold War ended in 1989, relieving the pressure of 4 decades of imminent nuclear destruction. This was a miracle. No war. No revolution. No territories seized. No leaders executed. A quiet end to the threat. The US managed the threat of nuclear terrorism. West Germany embraced East Germany. The European Union welcomed new members. The global economy thrived.
  2. The US established relations with China in 1979, beginning the country’s path to economic prosperity, trade and global influence. The growing trade between China and the world has acted to reduce the threat of conflicts while reducing the cost of goods for all.
  3. The US welcomed the growth of Japan plus the “four tigers” of Hong Kong, Singapore, South Korea, Taiwan, as Asian nations embraced the “Western consensus” of mixed market capitalism, global trade and liberal democracy.
  4. European nations also left behind histories of authoritarian governments or too much socialism to embrace the “Western consensus” and thicken ties through the European Union. Francis Fukuyama prematurely declared “the end of history” but the attractiveness of these successful choices was clear.
  5. The US joined international efforts to reduce tariffs and increase trade leading to a doubling of imports and exports as a share of GDP.
  6. The US adopted a less internationalist position after 9/11/2001, declaring a war on terror, defining the axis of evil, revoking treaty commitments, justifying preemptive war and invading Iraq without UN support. Even with this change, the US largely avoided major military conflicts and losses.
  7. Total immigration to the US grew during this period from 2.3% to 2.9% of the population per decade. Many immigrant groups successfully joined American society.
  8. The US welcomed foreign students to its universities. International tourists increased from 15 to 75 million per year.
  9. The US attempted to resolve the Middle East conflicts with some success, avoiding large scale wars.
  10. The US participated in talks to define and address the threat and impact of global warming. It has taken steps to reduce US carbon emissions.

Politics

  1. Presidents Ford and Carter helped to rebuild confidence in the government after Vietnam and Watergate.
  2. Ronald Reagan established “Conservatism” as a broad political philosophy for the Republican party.
  3. Bill Clinton repositioned Democrats more to the center on economics with his “third way” approach.
  4. Both parties increasingly used wedge issues and either/or choices to polarize parties and choices; although the share of independent voters has grown from 30 to 45%, with the rest evenly split between the two dominant parties.
  5. Perot, Buchannon, Palin and Trump provided social and economic populists with a choice.
  6. The country increasingly accepted racial minorities, women, gays, religious minorities, and immigrants; but the conflict between traditional and modern views was politicized as some could not tolerate the changes and others sought to embed the changes as universal human and legal rights accompanied by social pressures to comply with the dominant “tolerant” view.
  7. Federal government employment was reduced from 5 to 4 million in 50 years, while the population grew by 50%. After Reagan, “government” solutions were inherently suspect. Even Bill Clinton declared “the era of big government” is over.
  8. Total federal, state and local government activities grew a little faster than the economy, with the ratio of tax receipts to GDP inching up from 29% to 32%. The ongoing pressure to “cut spending, taxes and regulations” could not defeat the pressures to address social, political and economic issues and interests.
  9. The top marginal income tax rate was reduced from 70% in 1982 and has remained just under 40% since 1987. Neither party has proposed widespread tax increases.
  10. The Affordable Care Act was enacted in 2010, helping to bring the share of Americans without health insurance down from 20% in 1975 to 8% today.
  11. The US safety net/welfare system has remained intact during this period driving the supplemental poverty rate down from 20% to 15%, while the official poverty rate has declined by just 1%. The share of the elderly (65+) in poverty has fallen from 16% to 8%.

The Economy

  1. Real dollar GDP is 4 times larger at $24 trillion.
  2. US real per capita GDP has remained the highest of all major countries for a century. Continued leadership reflects a dynamically successful economy.
  3. Real per capita GDP has increased by 250% to $70,000.
  4. US fiscal and monetary policy has repeatedly been effective in taming the business cycle and recovering from shocks like the housing crisis and the pandemic.

US Business

  1. Industrial production, including energy, is up by 250%.
  2. The number of business establishments has doubled to 8.6M, providing ownership and employment opportunities in a more specialized, globally traded world.
  3. The number of franchise businesses has grown from 375,000 to 800,000+, employing more than 10 million people.
  4. The rate of new business formation and success increased throughout the period, with a new boost after the pandemic.
  5. Businesses responded to the 1970’s “Japanese invasion” and became strategically more focused, measured more effectively, focused on cost reduction, invested in R&D, and applied information technology and process improvement tools. Foreign and domestic competition led businesses to be more cost effective, improve product quality and offer products better tailored to diverse customer wants and needs.
  6. Firms experimented with factory robots by 1975. They now use 380,000 robots, adding 10% more annually.
  7. Auto production in the US has increased from 8 to 10 million units per year.
  8. Farms produce twice as much using 20% less land and 40% less labor.
  9. Businesses adapted to the world of greater international trade by growing or shrinking facilities, markets, products and product lines. They adapted to the new power of consumers and retailers and reduced power of manufacturers. They divested units and rejected the conglomerate model. They rejected vertical integration, learning to outsource all functions where they did not have a competitive advantage.
  10. Firms embraced more effective banking, equity and bond markets to fund their activities. They tapped global sources and private equity. They learned by use financial leverage to increase net earnings and acquire other less dynamic competitors.
  11. Firms changed organizational structures to have fewer layers, less positional power, more staff experts and the ability to use cross-functional (matrix) approaches to core operations, projects and joint ventures.

Education

  1. Preschool/Kindergarten enrollment up from 5 to 9 million. Nearly all part-time in 1975 and mostly full-time in 2025.
  2. High school graduation rate is up from 75% to 85%.
  3. Intelligence test scores have increased by more than 10 points.
  4. Share of young adults who have earned college degrees has doubled from 20% to 40%.
  5. Share of adults with college degrees has more than tripled from 12% to 38%.
  6. Share of young women with a college degree is up from 17% to 45%; shares for men up from 27% to 37%.
  7. Share of degrees in STEM disciplines has grown from 11% to 19%.
  8. Number of college students studying abroad is up by 5 times.
  9. Law school first-year enrollment remains at 40,000, while the population has grown by 50%.
  10. US holds 18 of top 30 global university spots.
  11. The number of annually earned doctorates has doubled.
  12. US accounts for 50% of Nobel prize winners, up from 40% in 1975.

Transportation

  1. 22% of new cars are electric. Self-driving cars are widely deployed.
  2. Fuel milage has doubled from 13 to 27 miles per gallon.
  3. New car defects have dropped by two-thirds.
  4. Air travel miles are up by 5 times.
  5. FedEx 2-pound overnight service was introduced in 1975 for $75. Service is widespread today at $55.
  6. Same day and next day delivery services are available today, making Amazon.com, grocery and restaurant deliveries common. Catalog mail order lead times were 6-8 weeks in 1975.

Energy

  1. The US faced energy crises in 1973 and 1979 that disrupted businesses, emptied filling stations and led to recessions.
  2. The US imported 35% of its petroleum products in the 1970’s. It is a net exporter today.
  3. Energy intensity, the ratio of energy used to GDP, has fallen by 60% since the 1970’s.
  4. LED bulbs last 10 times longer. Lithium-ion batteries last 4 times longer.
  5. Wind power is 10% of electricity generation. Solar is 10% of electricity generation. Solar is the lowest cost source today, accounting for two-thirds of new generating capacity added.
  6. Coal production is the same today as in 1975, down 50% from its 2007 peak. It is declining rapidly.

Environment

  1. Toxic air pollution measures are lower by 65-90%.
  2. The world resolved the threat to the ozone layer.
  3. Percentage of US homes in communities with treated wastewater has increased from 50% to 80%.
  4. State parks acreage has doubled. Federal parks acreage has tripled. Land trust additions are equal to the state parks area.
  5. Total US forest land area has increased from 750 to 800 million acres, while the US population has grown by 50%.
  6. Nesting pairs of American bald eagles have grown 100-fold, from 700 to 70,000.
  7. US (1976) and global (2014) birth rates are half of historical levels, reducing environmental demands.
  8. US is on track to reach 50% reduction in greenhouse gas emissions by 2030.

Health

  1. Life expectancy has increased from 73 to 78 years.
  2. Infant mortality rate has dropped by two-thirds.
  3. Smallpox has been eradicated. Polio remains eliminated. Other diseases close to zero.
  4. Smoking rate is two-thirds lower, down from 37% to 12% of adults.
  5. Death rates down: Strokes 67%. Cancer 25%. Flu/pneumonia 67%. Heart disease 50%+. Liver disease 25%.
  6. US governments, medical industry, businesses and people responded to the Covid-19 pandemic resulting in a death rate that was half of the 1917 Spanish flu. Novel vaccine development and flexible delivery resources limited the death toll.
  7. Abortion rates have fallen by 50% since 1980.
  8. Medical research continues to develop new science and solutions. Cloning and human genome mapping.
  9. In vitro fertilization births have grown from 0 to 100,000 per year.
  10. Modern anti-depression drugs (SSRI-Prozac) are much safer and more effective than their predecessors.
  11. Kidney dialysis extends lives for 550,000 today versus 25,000 in 1975.
  12. Americans have 40 million MRI scans done on 13,000 machines, up from zero.
  13. Laser eyer surgery has grown from an experimental procedure to 800,000 annually.
  14. 50,000 organs are transplanted each year, up from just a few experiments.

Safety

  1. Property crime rate is down by more than 50%. Violent crime rate is one-third lower.
  2. Both the workplace fatality and injury rates are down by two-thirds.
  3. Traffic fatalities per driven mile are three-fourths lower.
  4. Fire incidents have been cut in half while the population grew by half.
  5. Emergency medical services have grown from 2% to 90% of counties; employing 300,000 people, 50,000 ambulances and 1,300 helicopters.

Consumer

  1. Firms have offered consumers much wider options for products in all industries. A typical Walmart Supercenter has 125,000 different SKU’s.
  2. We enjoy year-round availability of most fruits and vegetables today rather than shopping by season.
  3. Clothing and durable goods prices have been cut by half.
  4. The average automobile is 13 years old versus 6, reflecting massive quality improvements.
  5. Car buyers can choose from 15 major manufacturers instead of just 4.
  6. Appliances in more homes: Washing machines (70-85%), dryers (45-82%), dish washers (28-54%), microwave ovens (4-95%). Refrigerators are 25% larger, half price and 75% more energy efficient.
  7. Median new home square footage has increased by half, from 1,500 to 2,200 square feet.
  8. Mortgage loan rates have declined from 8-14% to 4-7%. Real rates are just 2% today.
  9. Total debt service payments (home, car, credit card, student loan) as a percentage of disposable income have declined from 11% to 10%.
  10. Air-conditioned homes have grown from a hot 55% to a cool 95%.
  11. Away from home food spending has more than doubled from 28% to 59% of total food spending.
  12. Household consumption is up from 87% to 92% of disposable income. Savings is down from 13% to 8%.

Leisure

  1. Many television program options. Top 4 network share down from 90% to 30%. Recording and streaming options exist today.
  2. Cable or satellite TV access has grown from 14% to 100%.
  3. The number of feature films released each year has bloomed from 100 to 700.
  4. Music singles are effectively free today. They cost $7.50 each in current dollars in 1975. The transistor radio has been replaced with portable, wearable devices served by playlists, suggestions and feeds.
  5. Real consumer electronics prices have declined by 80-95%. A 21-25 inch color console was $2-3,000 in 1975 in current dollars. A 50-inch tv is available for $500 today.
  6. A 1982 IBM PC cost $10,000 in current dollars. For $2-3,000 today you get 1,000 times the processor speed, 10,000 times the memory and 100,000 times the storage space.
  7. Video rentals boomed in the 1980’s and 1990’s growing into a digital $100 billion industry.
  8. The $5 billion pinball machine sector evolved into the $50 billion handheld and online gaming industry.
  9. Virtual reality equipment is increasingly popular.
  10. Passports are held by half of US citizens, up from 5% in 1975.
  11. Following deregulation, the real price of air travel per mile has glided down by 40-60%.
  12. Hotel room capacity has doubled from 2.4 to 5.3 million.
  13. Pet food consumption has tripled.
  14. American wine production has increased from 250 to 700 million gallons, along with quality.
  15. American brewery count has increased from 150 to 7,000, along with quality.

Wealth

  1. Mutual funds, index funds and 401K’s offer investing to everyone. Percentage of stockholders has grown from 12% to 60%.
  2. The number of retirement plan participants has grown by 250%.
  3. Real dollar retirement plan assets have grown thirty-fold, from $1.6 to $48 trillion.
  4. Homeownership rate increased from 64% to peak of 69% before falling back to 66%.
  5. Family wealth more than doubled for those in the 1st-25th, 26th-50th, and 51st-90th percentiles between 1989 and 2022. Summary data for 1975 to 1989 is not readily available. Real home prices increased by 20% and the real dollar S&P 500 increased by 75% during this period, overall.

Labor

  1. Compounded labor productivity has increased by 150%, more than 2% per year!
  2. Manufacturing, administrative and farm jobs were reduced by 20% of the total during these 50 years. They were replaced by STEM/analysis, management and health care jobs.
  3. Prime age labor force participation increased from 74% to 84%.
  4. Typical unemployment rate declined from 6.5% to 5%.
  5. Share of self-employed workers increased from 9% to 11%.
  6. According to the Gallup Organization, the share of “engaged” workers has increased greatly in the last 20 years.
  7. Real median family income increased by 40% from 1984 to 2024.
  8. There are dozens of expert calculations of real incomes, adjusted for taxes, government benefits, charity, fringe benefits, hours, etc. Most show that 1975-1990 was flat and that 2000-20 showed modest increases.

Society

  1. The US continues to lead the world in charitable giving as a percentage of income, double the nearest country, Canada.
  2. US migration and population growth in the “Sunbelt” impacted local and national economies, politics and society. Texas (13-31M), California (21-39M) and Florida (8-23M) showed the greatest growth and national influence.
  3. Share of adults cohabiting has increased from 1% to 13%.
  4. Teen pregnancy rate has been cut in half.
  5. The share of married couples has declined from 83% to 67% of households.
  6. Parents now invest 20 hours per week caring for children, up from 12 hours in 1975.
  7. Same sex marriage was legalized by the US Supreme Court in 2015.
  8. Female labor force participation rate has increased from 46% to 57%.
  9. The female to male wage discount has been reduced from 35% to 10%.
  10. The number of congresswomen increased from 19 to 155 (7X).
  11. Women today have access to credit and credit cards in their own names.
  12. Black unemployment declined from 15% to 7%, with the excess above whites falling from 7% to 2%.
  13. Black poverty rate has declined from 30% to 18%.
  14. The Black to White income ratio has improved from 60% to 67%.
  15. The share of interracial marriages has increased from less than 1% to 10%.
  16. Percentage of Americans moving per year has declined from 20% to 12%. Interstate moves have declined from 3% to 2%.
  17. Robert Putnam’s “Bowling Alone” shows a 40% decrease in social participation during this time.
  18. Awareness, tolerance and support for “differences” is higher by an order of magnitude: races, nationality, immigration status, physical or mental disability, gender identity, mental health, autism, obesity, and personality.
  19. Hispanic Americans have increased from 6% to 20% of the population.
  20. The percentage of non-Christians, including religiously unaffiliated, has increased from 12% to 35% of the population.
  21. The share of 40-year-olds never married has increased from 6% to 25%.

Computers

  1. Personal computer software and phone apps provide tools for email, calendars, word processing and spreadsheets to everyone today.
  2. Personal computers are in 95% of homes versus 0% in 1975.
  3. More than 90% of jobs today require computer skills.
  4. Home internet access is 92%.
  5. Digital cameras, music, videos, sound and storage make everything portable.
  6. Voice controlled devices and instant language translation.
  7. Today’s 10-day weather forecasts are as reliable as next day forecasts in 1975.
  8. Google search and artificial intelligence provide access to all of man’s writings and promise thought, itself.

Communications

  1. Internet structure and web browser provide access to everything and everyone.
  2. Smartphones integrate computing and communications. 90% ownership rate. Provides photo, filming and navigating capabilities.
  3. Mobile/cellular phone networks and wifi routers offer universal access to the internet and phones.
  4. Social media networks combine the input of many to build and use networks.
  5. Internet allows for open-source software and information creation.
  6. Video conferencing and internet enabled phone/video calls are common.
  7. Voice mail, answering machines, caller ID and 911 were invented.
  8. Digital books have grown to 25% market share.
  9. Annual first class mail per person increased from 240 to a peak of 360 in 2000 before falling to 130 today.
  10. Daily newspaper subscriptions have plunged from 60 to 20 million.
  11. Share of homes with landlines has fallen from 90% to 30%.
  12. A 3-minute long distance call in 1975 cost $8.70 in current dollars. An international Skye call today is 77 cents.

Summary

The world is a better, richer and safer place. Politics has evolved. The economy is 4 times larger. Businesses and education are more effective. Energy is cheaper. Transportation is better. The environment is much better. Health is much better. Safety is much better. The consumer is king. Leisure options and quality can’t even be compared with 1975. Wealth is up. Incomes are up. Society is digesting many large changes. The computer and communications revolutions have delivered miracles and promise more.

We face social, political and environmental challenges. We have more resources than ever before. Based on American history we should be very confident about solving our challenges.

Management Effectiveness Has More Than Doubled in the Last 50 Years!!!!

https://www.gm.com/heritage/collection/chevrolet/1976-chevrolet-chevette

The Chevy Chevette was the best product of the largest and most successful corporation in 1976. [WOWSER] It was marginally better than the Corvair or the Vega. Major US corporations had taken advantage of the post-WWII opportunity to produce for the world and perfected minor changes each year to further stimulate consumer demand. Functional roles in corporations were largely unchanged since the 1920’s. Japanese competition in the auto and consumer electronics industries in the 1970’s caused American corporations to eventually reinvent themselves and move into a world of perpetual change management.

It’s difficult to describe the size and impact of these changes. They were like a compounded series of paradigm shifts. I worked with many organizations from 1975-1989: Koppers, Avery Label, Sherwin-Williams, multiple S&L’s, United Telephone, AmeriTrust, E&Y, Tandy Radio Shack, EDS, IBM, Microsoft, GM, NASA, Zenith, Allison Transmission, City of Cleveland, McCormick Convention Center, Amway, US Navy, US Health & Human Services, Lorain Community College, Baldwin-Wallace University and the University of South Florida.

I completed a finance MBA at Case Western Reserve University in 1984. I joined Ernst & Young as a junior management consultant and learned from Dr. E. Leonard Arnoff, one of the founders of the discipline of operations research.

https://www.informs.org/Explore/History-of-O.R.-Excellence/Biographical-Profiles/Arnoff-E.-Leonard

FEW of the most important concepts and skills of my 35-year professional career existed or were rarely applied in 1984. The smartest academic and business leaders were aware of some of the changes that would shape the next 50 years, but the typical 1984 manager was still working from a 1930’s view of business.

I’ll group the more than 100 HUGE advances into 6 categories.

Strategy

  1. Strategy really matters. A strategy function is needed.
  2. Competitive advantage is critical (Michael Porter).
  3. Companies cannot be all things to all people.
  4. Strategy is a process to focus and facilitate thinking, not a mainly a means of control.
  5. Market leaders have a better chance of winning. Better to be a leader in a small market segment than a follower in a large one. Long-tail opportunities.
  6. In many markets, leading market share (1, 2 or 3) is essential.
  7. Product differentiation is required to avoid commodity pricing.
  8. Universal customer needs of quality, speed, flexibility, value (price and function), information/transaction costs and personal relations/risk management can all be used for product differentiation. A customer centric strategic view is necessary.
  9. SWOT analysis is essential. Strengths, weaknesses, opportunities and threats.
  10. Mission, vision and values must be articulated. Begin with the end in mind.
  11. Firms must choose between equity alone and multiple stakeholder priorities.
  12. Modelling and simulation tools can be used to identify, understand and prioritize the critical dimensions of every firm.
  13. International and startup competition must always be considered.
  14. Professional functions within each firm are increasingly essential.
  15. A 3-way strategic choice must be considered: low cost, product differentiation or customer intimacy.
  16. Successful firms clearly articulate abstract ends and flex the means of attainment (Collins).
  17. The customer and retail interface may have more power than the manufacturer/service provider.
  18. Smaller firms are available to be purchased in a roll-up strategy.
  19. In the end, dynamic, sustainable [moats] strategies have the greatest value.
  20. China matters.
  21. As firms become more strategically driven, the fixed costs of SG&A rose, requiring firms to prioritize growth and market share.
  22. Intangible assets may be more important than tangible assets.

Marketing

  1. Market size is essential. Market share is next.
  2. Marketing research of customer preferences matters.
  3. Branding is vital.
  4. Focus groups can provide separate insights and validate numbers.
  5. The marketing function exists to create value, not just sell things.
  6. Targeted marketing is essential. Products must match differentiated markets.
  7. Some customers value quality and reliability.
  8. Some customers value timely delivery.
  9. Digital marketing channels supplement analog channels.
  10. In the digital world, search engine optimization [SEO] matters.
  11. E-commerce is a competitor to analog delivery.
  12. Internet promotion is a competitor of traditional media.
  13. Individuals’ identity and social interests can be targeted.
  14. Some customers are better targeted by 2-way communications or influencers.
  15. Politicians, regulators and courts increasingly matter, and firms must invest accordingly.
  16. Tariffs matter. Firms must invest to manage them.

Finance

  1. Access to debt, equity and start-up financing is much easier.
  2. Access to global investors is possible.
  3. More efficient markets through mutual funds, ETF’s, derivatives, and efficient trading markets matter.
  4. Portfolio management applies to investments, projects, product lines, channels and new product development.
  5. Marginal costs/benefits apply to every activity and project.
  6. Cash and management accounting perspectives are best used for making decisions, separated from accrual and financial accounting measures.
  7. Price discrimination is a major opportunity in every market.
  8. The formal discounted cash flow analyses apply to many situations.
  9. Activity based costing helps to identify necessary costs at 4 levels.
  10. Corporate and product level costs are subject to cost reduction just like plant/facility and production costs.
  11. The balanced scoreboard system ensures that all levels of economic activity are planned, measured and managed.

Human Resources

  1. Human resources are productive assets; they are not simply “personnel”. They should be managed accordingly.
  2. Required staff skills must be defined, measured and enhanced.
  3. Clerical support skills must be cost-justified.
  4. Analytical skills can be captured in separate positions.
  5. The general concept of meritocracy matters. Exceptions must be justified.
  6. COO’s and CFO’s are not alone. IT, marketing, risk, merchandise and people managers are equally important.
  7. Legal compliance matters.
  8. The role of “managers” is essential. Managing people, tasks and processes. Developing talents.
  9. Highly skilled MBA’s have important roles to play.
  10. Organizational development is a value added function.
  11. Matrix (cross-functional) management is just as important as functional management.
  12. Project teams play a critical role.
  13. Firms cannot cost-justify employing thought leaders in every function. Management consultants can fill in.
  14. Employees can be outsourced.
  15. HR information systems (HRIS) are essential.
  16. Centralized professional services functions are typically more cost effective.
  17. Corporate culture is a strategic asset.
  18. Clearly defining role requirements, recruiting, hiring and performance evaluation greatly improve performance.
  19. Human beings have personalities, habits, talents and motivations that can be leveraged and improved.
  20. Diversity, equity, and inclusion is a worthy investment today.
  21. Workplace flexibility is highly valued by employees.

Information Technology

  1. Basic financial and operations systems can be automated.
  2. Detailed transactional processes can be automated, controlled and improved.
  3. Processes can be documented, standardized and enforced.
  4. Relational database logic can greatly reduce work and errors.
  5. Detailed functional IT subsystems can be developed to improve operations and feed the financial systems. Warehouse Management Systems (WMS), as one example.
  6. Enterprise Resource Planning (ERP) systems can be used to leverage the universal core processes of firms while customizing the details and integrating functional subsystems.
  7. Critical data can be stored in data warehouses for analysis. Big Data comes later.
  8. Reduced IT costs improve access to various tools and systems.
  9. Staff can effectively use personal productivity tools: word processing, spreadsheets, graphs, graphics, email, databases, queries, report writing.
  10. Personal computers allow local use.
  11. The ongoing reduction of computer costs makes them more effective for more employees.
  12. The internet provides access to information, teams, suppliers, customers, markets and others.
  13. Internet search tools provide smart access to information.
  14. Crowdsourced applications provide zero cost tools.
  15. Social media apps provide the opportunity to connect with others effectively.
  16. Smartphones further reduce the cost and limits of accessing all data, functionality and people.
  17. Artificial intelligence provides tools to greatly leverage personal skills.

Operations

  1. Forecasting and statistical techniques refined and easily applied using personal computers.
  2. Complex, multi-level operations planning models widely used.
  3. Supply chain management using daily or real-time information from suppliers, internal operations and customers optimized.
  4. Long-term supplier partner strategies adopted, reducing sales, purchasing, legal and disruption costs.
  5. Professional logistics profession developed, applying the best options for all types of cargo.
  6. Manufacturing outsourced routinely to lowest total costs sources worldwide.
  7. Distribution, logistics, IT, HR, R&D, product development and all functions outsourced (sometimes globally) to leverage specialized skills and focus internal operations.
  8. Operations research tools routinely applied for optimization problems, especially critical paths.
  9. All fixed-cost capacities set at lower percentages, with secondary capacity options, in order to optimize profits, especially in low and high demand situations.
  10. All processes defined, standardized, refined and optimized in order to apply IT and process engineering.
  11. Multiple feedback loops routinely used to improve processes through time.
  12. Lower communications and transportation costs further increased outsourcing activities.
  13. The value of time to customers was identified and turned into a competitive advantage, from 6-weeks mail order to same day to same hour delivery.
  14. Just-in-time production philosophies implemented, and inventories slashed towards zero intentionally to force improvements.
  15. Production processes re-engineered according to process and final goal needs, displacing functional and “like kind” groupings.
  16. Continuous improvement, kaizen quick fixes and full process re-engineering take advantage of global best practices.
  17. Project management discipline created and refined. Agile project management used. Project management offices created to manage portfolios of projects, project managers and subject matter experts from inside, suppliers, customers and consultants.
  18. New product development managed as a portfolio of projects, each within a standard process framework. Firms adopt the “layer cake” view of value as the sum of annuity returns from a series of new products.
  19. Basic insights of modern Total Quality Management or Lean Six Sigma adopted, focused on activity and process variability with unexpectedly large results. Relentless elimination of waste.
  20. The Quality paradigm shift places the process view on par with the finance view.
  21. The variability of actions within a sequence of events [Goldratt] is seen as the critical driver of final results. Processes, measurements, goals, investments, staffing, operations planning and outsourcing are adjusted for dynamic effectiveness.

Summary

Modern firms have cumulatively adopted and leveraged these interrelated capabilities to become strategically driven, self-aware, well-managed and improving through time. The marginal finance/portfolio view together with the process view allow firms to identify, deliver and monetize customer needs while outsourcing functions that are not deemed strategically essential. Firms generally invest more resources in planning, optimization, new product development and risk management today.

The application of these principles has varied by industry. Government, not-for-profit and health care have great improvement opportunities remaining.

Firms may invest in Joseph Schumpeter’s “creative destruction” or they may optimize within existing market structures if they see higher returns from internal process improvements, incremental product development, supplier squeezing, price discrimination, targeted marketing or regulatory capture. In other words, the capabilities for ongoing world-changing improvements exist but may not be applied for the greater good.

Modern History Index

257 items pulled from all arenas of life. Technology dominates, especially in the last century.

Grouping events into 40-year blocks shows 1940-79 as twice as dynamic as other eras.

1450 – 1779 20

1780 – 1819 12

1820 – 1859 16

1860 – 1899 31

1900 – 1939 47

1940 – 1979 99

1980 – 2025 32

Modern History: Technology

1760 – Industrial Revolution – Power Loom

https://en.wikipedia.org/wiki/Industrial_Revolution

https://en.wikipedia.org/wiki/Power_loom

1765 – Watt’s Steam Engine

https://en.wikipedia.org/wiki/Steam_engine

1800 – Second Agricultural Revolution

https://en.wikipedia.org/wiki/British_Agricultural_Revolution

1802 – Steam-powered Locomotive

https://en.wikipedia.org/wiki/Steam_locomotive

1821 – Electromagnetic induction – Electric Motor

https://en.wikipedia.org/wiki/Electric_motor

1859 – Pennsylvania Oil Rush

https://en.wikipedia.org/wiki/Pennsylvania_oil_rush

1869 – Transcontinental Railroad

https://en.wikipedia.org/wiki/First_transcontinental_railroad

1869 – Suez Canal

https://en.wikipedia.org/wiki/Suez_Canal

1879 – Edison’s Practical Electric Light Bulb

https://en.wikipedia.org/wiki/Electric_light

1882 – Commercial Electricity Generation and Distribution

https://en.wikipedia.org/wiki/Electricity_generation

1886 – Alternating Current Distribution and Motors

https://en.wikipedia.org/wiki/Alternating_current

1886 – Internal Combustion Engine – Benz

https://en.wikipedia.org/wiki/Internal_combustion_engine

1902 – Air Conditioning – Carrier

https://en.wikipedia.org/wiki/Air_conditioning

1903 – Wright Brothers’ Airplane

https://en.wikipedia.org/wiki/Wright_brothers

1905 – Electric Home Appliances

https://en.wikipedia.org/wiki/Home_appliance

1907 – Synthetic Plastics / Bakelite

https://en.wikipedia.org/wiki/Plastic

1914 – Panama Canal

https://en.wikipedia.org/wiki/Panama_Canal

1915 – Home Refrigerators

https://en.wikipedia.org/wiki/Refrigerator

1927 – Nonstop Transatlantic Flight

https://en.wikipedia.org/wiki/Transatlantic_flight

1935 – Commercial Air Travel

https://en.wikipedia.org/wiki/Douglas_DC-3

1956 – Interstate Highway System

https://en.wikipedia.org/wiki/Interstate_Highway_System

1958 – Commercial Nuclear Power

https://en.wikipedia.org/wiki/Nuclear_power_in_the_United_States

1960 – Laser

https://en.wikipedia.org/wiki/Laser

1960 – Third Agricultural Revolution (Green)

https://en.wikipedia.org/wiki/Green_Revolution

1961 – Manned Space Flight

https://en.wikipedia.org/wiki/Yuri_Gagarin

1968 – Boeing 747

https://en.wikipedia.org/wiki/Boeing_747

1969 – Moon Landing

https://en.wikipedia.org/wiki/Apollo_11

https://en.wikipedia.org/wiki/Space_Race

2012 – Wind Energy – largest US new power source

https://en.wikipedia.org/wiki/Wind_power

2020 – Solar Energy – cheapest power source

https://en.wikipedia.org/wiki/Solar_energy

Summary

Energy, transportation and manufacturing continue to advance. See separate posts for communication, computers and biology.

Modern History: Business & Economics

1602 – Dutch East India Company, limited liability corporation, global trade

https://en.wikipedia.org/wiki/Dutch_East_India_Company

1776 – The Wealth of Nations from markets, specialization and trade

https://en.wikipedia.org/wiki/Adam_Smith

1817 – Comparative advantage drives international trade

https://en.wikipedia.org/wiki/David_Ricardo

1865 – Gilded age economic expansion and inequality in the US, laissez faire

https://en.wikipedia.org/wiki/Gilded_Age

1867 – Trade unions legalized in the United Kingdom

https://en.wikipedia.org/wiki/Trade_unions_in_the_United_Kingdom

1910 – Scientific management, Frederick Taylor, Taylor method

https://en.wikipedia.org/wiki/Scientific_management

1911 – Breakup of the Standard Oil Company – anti-monopoly power

https://en.wikipedia.org/wiki/Standard_Oil_Company

https://en.wikipedia.org/wiki/The_History_of_the_Standard_Oil_Company

https://en.wikipedia.org/wiki/Standard_Oil_Co._of_New_Jersey_v._United_States

1913 – Federal Reserve Bank created

https://en.wikipedia.org/wiki/Federal_Reserve_Act

1913 – Industrial assembly line- Ford

https://en.wikipedia.org/wiki/Assembly_line

1929 – Great Depression

https://en.wikipedia.org/wiki/Business_cycle

https://en.wikipedia.org/wiki/Great_Depression

1933 – Securities and Exchange Commission regulates financial markets

https://en.wikipedia.org/wiki/Securities_Act_of_1933

1936 – Modern macroeconomics is outlined

https://en.wikipedia.org/wiki/John_Maynard_Keynes

1939 – Silicon Valley begins with Hewlett-Packard, product and financing innovation

https://en.wikipedia.org/wiki/Hewlett-Packard

https://en.wikipedia.org/wiki/Silicon_Valley

1942 – Creative Destruction is an essential part of effective capitalism.

https://en.wikipedia.org/wiki/Joseph_Schumpeter

1947 – Military industrial sector, defense complex created

https://en.wikipedia.org/wiki/Military_production_during_World_War_II

https://en.wikipedia.org/wiki/Military%E2%80%93industrial_complex

https://en.wikipedia.org/wiki/Military_budget_of_the_United_States

1948 – Japanese companies start modern manufacturing based upon statistical insights.

https://en.wikipedia.org/wiki/Toyota_Production_System

1950 – The study of “sequence of events” leads to modern project management.

https://en.wikipedia.org/wiki/Critical_path_method

https://en.wikipedia.org/wiki/Timeline_of_project_management

1952 – Henry Markowitz formalizes modern portfolio theory.

https://en.wikipedia.org/wiki/Modern_portfolio_theory

1955 – Destination theme park travel begins – Walt Disney

https://en.wikipedia.org/wiki/Disneyland

https://en.wikipedia.org/wiki/Disney_Experiences

1955 – Enclosed Shopping Mall

https://en.wikipedia.org/wiki/Shopping_center

https://en.wikipedia.org/wiki/Shopping_mall

1956 – Intermodal shipping container and freight transport

https://en.wikipedia.org/wiki/Intermodal_freight_transport

1958 – General purpose credit cards

https://en.wikipedia.org/wiki/Credit_card

1958 – A meritocratic work environment was dominating, and critics objected.

https://en.wikipedia.org/wiki/The_Rise_of_the_Meritocracy

1962 – Product and process standardization, franchising take off

https://en.wikipedia.org/wiki/History_of_McDonald%27s

1962 – Discount retailing, big box stores, category killers arise.

https://en.wikipedia.org/wiki/History_of_Walmart

1968 – For profit health care.

https://en.wikipedia.org/wiki/HCA_Healthcare

1970 – Income inequality begins to grow again in the US

https://en.wikipedia.org/wiki/Income_inequality_in_the_United_States

1971 – Discount air travel, standardized routes and aircraft

https://en.wikipedia.org/wiki/History_of_Southwest_Airlines

1973 – How much is a financial option worth?

https://en.wikipedia.org/wiki/Black%E2%80%93Scholes_model

1973 – Reliable express delivery is founded.

https://en.wikipedia.org/wiki/FedEx

1974 – Tax-advantaged individual retirement accounts

https://en.wikipedia.org/wiki/Individual_retirement_account

1975 – Index funds and mutual funds simplify and lower transaction costs of investing.

https://en.wikipedia.org/wiki/The_Vanguard_Group

1978 – Executive stock options provide high levels of tax-advantaged compensation.

https://en.wikipedia.org/wiki/Employee_stock_option

1979 – Monetary policy can stop inflation, at a cost.

https://en.wikipedia.org/wiki/Paul_Volcker

1980 – Junk bonds provide financing for riskier companies and tools for investors.

https://en.wikipedia.org/wiki/High-yield_debt

1980 – Michael Porter clarifies the effective use of business strategy to compete in markets.

https://en.wikipedia.org/wiki/Competitive_advantage

1984 – Eli Goldratt offers a “theory of constraints” as a way to understand and manage complex systems effectively, leading to true “lean manufacturing” and “lean operations”.

https://en.wikipedia.org/wiki/Theory_of_constraints

1994 – On-line retailing, everything is in stock, and available soon.

https://en.wikipedia.org/wiki/History_of_Amazon

2007 – Great Recession highlights the ongoing risks of financial deregulation.

https://en.wikipedia.org/wiki/Great_Recession

Summary

Process standardization. Financial innovation. Highly focused strategies. New business forms. Markets and international trade deliver desired products, lower prices and competition. A role for government regulation remains. The macroeconomy can be managed to reduce the impact of business cycles and shocks.

Our Hamilton County: Very Solid Air Travel Options

http://www.fansmanship.com/the-epicenter-of-awesome/

General Aviation

Hamilton County residents are well served by 5 nearby general aviation airports. The county owns and operates Indy Executive Airport which recently expanded its main runway to 7,000 feet, the longest general aviation runway in the state, now capable of landing all private jet aircraft. The airport hosts 100 aircraft, including 20 jets and conducts more than 40,000 operations per year. It is the fourth busiest non-towered airport in the US. The airport hosted private jet flights from around the country for the 2012 Super Bowl. It was awarded “Indiana Airport of the Year” recognition in 2007.

https://en.wikipedia.org/wiki/Indianapolis_Executive_Airport

https://www.prweb.com/releases/woolpert-celebrates-completion-of-15m-runway-extension-at-indianapolis-executive-airport-301991725.html

https://www.aviationindiana.com/ai-airport-of-the-year/

https://indyexec.com/

Indianapolis Metro Airport is located in Fishers near the Marion County border and operated by the Indianapolis Airport Authority as a “reliever airport”. It has 110 based aircraft and conducts 25,000 operations each year. It has a single 4,000-foot runway and is actively developing half of its 400 acres for aviation-related uses.

https://en.wikipedia.org/wiki/Indianapolis_Metropolitan_Airport

https://www.indystar.com/story/news/local/hamilton-county/fishers/2022/10/10/will-andretti-hq-finally-spur-build-out-at-metro-airport-in-fishers/69544886007/

Eagle Creek, Anderson and Indy Regional airports to the southwest, north and southeast also offer general aviation services to Hamilton County residents.

https://en.wikipedia.org/wiki/Eagle_Creek_Airpark

https://www.flyjetaccess.com/fbo-locations/eagle-creek-airport-eye/

https://en.wikipedia.org/wiki/Anderson_Municipal_Airport

https://en.wikipedia.org/wiki/Indianapolis_Regional_Airport

https://www.flyjetaccess.com/fbo-locations/indianapolis-regional-airport-mqj/

Indianapolis International Airport

Indianapolis is the 34th largest metro area in the US and ranks in the top 50 airports for passenger traffic.

https://en.wikipedia.org/wiki/Metropolitan_statistical_area

The airport completed its midfield terminal project in 2008 and is consistently rated a top US airport.

https://www.ind.com/about/media/media-releases/travel-leisure-readers-pick-indy-airport-as-one-of-the-worlds-best

https://simpleflying.com/indianapolis-airport-customer-satisfaction-award/#:~:text=Summary,security%2C%20and%20exceptional%20customer%20service.

https://www.indystar.com/story/news/2023/03/06/indianapolis-airport-wins-best-airport-in-north-america/69977592007/

Indianapolis boasts main runways of 11,200 and 10,000 feet and a cross-wind runway of 7,200 feet. Indy is home to one of the nation’s 22 FAA control districts. Indianapolis has 40 direct flight destinations. Due to its Fed Ex hub status, it joins its neighbors Chicago, Louisville and Cincinnati as “top 10” US air cargo carriers, ensuring that the airport receives priority FAA funding and maintenance.

Historically, Indy residents took advantage of the US Air hub in Dayton (74th largest metro area) and the Delta hub in Cincinnati (30th largest metro area) within 2 hours, but those attractions have expired. Louisville (43rd largest metro area) is also within 2 hours but has never had preferred flight options.

Similarly, Detroit, St. Louis, Cleveland, Nashville, Milwaukee and Columbus are large metro areas within 5 hours of Indy, but typically do not have super attractive air travel options worth a long drive.

Chicago’s Midway (31st busiest) and O’Hare (4th busiest) airports DO provide solid air travel options for Hamilton County residents, just 3 hours away.

https://en.wikipedia.org/wiki/O%27Hare_International_Airport

https://en.wikipedia.org/wiki/Midway_International_Airport

Despite its relatively small size, Indy has attracted all national carriers and many discount carriers. Its average ticket is $396, just above the $392 national average. Among top 50 metro areas, it ranks 20th at $396, just above the median of $390.

https://www.transtats.bts.gov/averagefare/

Summary

Hamilton County has several top-quality general aviation options. The Indianapolis International Airport is a national leader in quality and service. Prices are roughly average. Indy has a relatively low number of direct flights, so travelers often need to connect through major hubs or drive to Chicago, especially for international destinations.

Our Hamilton County: Cost of Living

https://www.firstib.com/about-us/new-headquarters/

Metro Indy Cost of Living is 7% Below Average

https://www.stats.indiana.edu/about/coli.asp

https://www.bankrate.com/real-estate/cost-of-living-calculator/

In general, Hamilton County’s costs are similar to those of the Indy metro area. It’s 357,000 residents account for just 17% (1 in 6) of the formal Indy metro area’s 2,075,000.

Solid county level data is not available for all areas, but limited comparisons helped to identify goods and services that might differ between Hamilton County and the Indy average.

https://www.bestplaces.net/cost_of_living/county/indiana/hamilton

https://www.epi.org/resources/budget/?gclid=Cj0KCQjwxuCnBhDLARIsAB-cq1rnk521GaWh6Evp4LUs2TaA2Tgx_oufafn9ywPIV32tpToZ0f0FVpwaAhnMEALw_wcB

Housing

Hamilton County’s housing is 8% more expensive than the national average rather than 15-17% lower as seen in metro Indianapolis. The housing stock is also newer, larger and higher quality. The full housing price difference would increase the total cost of living measure by 7%. Considering one-half being due to age/quality and one-half due to prices adds 3.5% to 93.1% to yield a revised 96.6% cost of living ratio.

https://www.towncharts.com/Indiana/Housing/Marion-County-IN-Housing-data.html

https://www.towncharts.com/Indiana/Housing/Hamilton-County-IN-Housing-data.html

The median Marion County house was built in 1971. The median Hamilton County house was built in 2000.

Taxes

Indiana local taxes average 9.3% of income versus 10.2% nationally. This 10% savings on a 10% cost factor reduces the overall cost of living measure back down to 95.6%. State sales and income taxes do not vary by county. Hamilton County’s property and income taxes are lower than its large population peer group in Indiana.

Food Prices

Historically, Indianapolis has been a competitive grocery market. Kroger has a leading market share. Cub Foods and Marsh have left the market, but Meijer’s, Trader Joe’s, Whole Foods, Fresh Thyme, Fresh Market and Market District now compete with the others.

https://www.indystar.com/story/money/2014/03/22/grocery-store-wars-indianapolis-shoppers-profit-foodie-fight/6715177/

https://www.axios.com/local/indianapolis/2023/05/02/indianapolis-grocery-stores-kroger

5% of low-income Hamilton County residents do not live near a grocery store, versus 6% nationwide. The supply of grocery stores is adequate.

https://www.countyhealthrankings.org/explore-health-rankings/indiana/hamilton?year=2023

Hamilton County’s retail sales per capita figure is 14% above the national average, despite the very high concentration of retail stores in Marion County along 82nd/86th Street. The county is well served by retailers of all kinds.

https://www.census.gov/quickfacts/fact/table/US/SBO001217

https://www.census.gov/quickfacts/fact/table/US,marioncountyindiana,hamiltoncountyindiana,hendrickscountyindiana,johnsoncountyindiana,hancockcountyindiana/HSG860221

Food away from home makes up almost 5% of the consumer price index. No restaurant food index is publicly available. However, the Big Mac price in Hamilton County is $4.59 versus the $4.39 national average price, a 5% premium. If this applied to all restaurant prices, the overall cost of living index would be 0.3 higher, 95.9. The average Indiana Big Mac price was just $4.11.

https://worldpopulationreview.com/state-rankings/big-mac-index-by-state

https://pantryandlarder.com/mccheapest

The Economic Policy Institute provides “modest income” food prices that are 19% higher in Hamilton County than in Marion County. Given the proximity of the counties and the long-standing coverage of “food deserts” in Indianapolis contrasted with nearly none in Hamilton County, this indicator is suspect.

https://www.epi.org/resources/budget/?gclid=Cj0KCQjwxuCnBhDLARIsAB-cq1rnk521GaWh6Evp4LUs2TaA2Tgx_oufafn9ywPIV32tpToZ0f0FVpwaAhnMEALw_wcB

Health Care

Hamilton County has 1.8 hospital beds compared with the national average of 1.9 and the Indiana average of 3.3. It has 1.5 primary care physicians versus 1.0 nationally and 1.3 in Indiana. 10% of Hamilton County households have medical bills in collections compared with 17% nationally and 19% in Indiana. Access to health care is adequate.

https://www.usnews.com/news/healthiest-communities/indiana/hamilton-county

The Best Places website uses a simple index of a standard hospital bed night, a doctor’s visit and a dentist’s visit indicating that Hamilton County health care costs are equal to the national average (100).

https://www.bestplaces.net/cost_of_living/county/indiana/hamilton

A Rand Corporation study indicates that Indy metro hospital rates are 25% higher than the national average. This is driving Indiana statehouse political battles with claims and counterclaims. Professional services fees were 25% below the national average.

https://www.rand.org/pubs/research_reports/RRA1144-1.html

https://www.wfyi.org/news/articles/why-are-indianas-health-care-costs-so-high

Although health care is as much as 18% of GDP in the US, the share in the consumer price index is only 5%. If Hamilton County consumer costs are the same as the nation, this would increase the cost-of-living index by 0.6 points to 96.5.

Utilities

Best Places pegs Hamilton County’s utility costs at 93 rather than 107.

Indiana natural gas prices are more than 20% below the 50 state median.

https://www.chooseenergy.com/data-center/natural-gas-rates-by-state/

Indiana and Hamilton County electricity prices are 10% below the national average.

https://www.eia.gov/electricity/monthly/epm_table_grapher.php?t=epmt_5_6_a

https://www.electricitylocal.com/states/indiana/noblesville/

https://www.energysage.com/local-data/electricity-cost/in/

Local utilities are probably at least 10% lower than in the summary statistics, so the COL index should be reduced by 0.9 points based on their share of spending, reducing the index to 95.6.

Transportation

Indiana used car prices are the lowest in the nation, 11% below the average.

https://www.iseecars.com/used-car-buying-by-state-study

Indy fuel prices match the US average.

https://www.axios.com/local/indianapolis/2023/08/11/gas-prices-down-below-average

Indiana auto insurance rates are 40% less than the national average. Hamilton County rates are a little lower.

https://www.bankrate.com/insurance/homeowners-insurance/states/#home-insurance-rates-by-state

https://www.policygenius.com/homeowners-insurance/home-insurance-rates-by-zip-code/

The US Census Quick Facts tool reports that Hamilton County’s average commute time is the same as the country’s.

The 94 score may be high, but no specific change is indicated.

Other Goods and Services

Home insurance prices for Indiana and Hamilton County are variously reported as 10% below, equal to and 10% above the national average.

https://www.bankrate.com/insurance/homeowners-insurance/states/#home-insurance-rates-by-state

https://www.policygenius.com/homeowners-insurance/home-insurance-rates-by-zip-code/

https://www.insurance.com/home-and-renters-insurance/home-insurance-basics/average-homeowners-insurance-rates-by-state

Indiana’s state university tuition rates match the US average.

https://www.collegetuitioncompare.com/state/

Indiana has very high childcare prices.

The Economic Policy Institute and Indiana Family and Social Services Administration indicate that Hamilton County childcare costs are 13% higher than in Marion. Because childcare accounts for just 0.6% of spending, no adjustment is indicated.

https://www.epi.org/resources/budget/?gclid=Cj0KCQjwxuCnBhDLARIsAB-cq1rnk521GaWh6Evp4LUs2TaA2Tgx_oufafn9ywPIV32tpToZ0f0FVpwaAhnMEALw_wcB

https://www.in.gov/fssa/carefinder/provider-reimbursements/

Summary: Hamilton County Costs are 4% Lower than the National Average

County level housing, health care and grocery costs added more than 4% while lower taxes and utility costs subtracted almost 2% for a final score of 95.6, more than 4% below the national average.

Good News: Emergency Medical Services (EMS) Today (1972-2022)

Positive Media Coverage

https://www.imdb.com/search/keyword/?keywords=medical-drama

Since the pioneering 1972 drama Emergency! there have been dozens of TV shows highlighting the critical role of emergency medical services (EMS) personnel.

https://www.imdb.com/search/keyword/?keywords=medical-drama

Vehicles

Modern Emergency Medical Services (EMS) vehicles today are designed to help EMS medical professionals provide world class care. They now meet national standards (1974, 1990) for space, equipment, supplies and client care. These vehicles are stocked with supplies and equipment to meet all typical emergency care needs.

https://www.nremt.org/about/history

Air Medical Services

Helicopter based emergency services started in 1974 in Baltimore, Jacksonville, Pittsburgh, Seattle and Denver leveraging the equipment and pilot experiences of the Vietnam War. Emergency helicopters are staffed with qualified personnel and equipment to handle the most extreme situations. Emergency personnel are staged across the country to respond to emergency situations.

In 2020, there were more than 1,600 helicopters and 700 fixed wing aircraft participating in emergency medical services in the US, making more than 200,000 responses to service requests.

https://www.hmpgloballearningnetwork.com/site/emsworld/article/1223054/air-medical-services-then-and-now

Emergency Medical Profession

The National Registry of Emergency Medical Technicians (NREMT) was established in 1970. This organization has driven the development of a true profession.

https://www.nremt.org/about/history

In 1975 the AMA recognized emergency medicine as a physician specialization and recognized paramedics as allied health professionals. Prior to this time, the training, skills, employers, supervision, equipment and medical protocols of the emerging profession were so varied that initial efforts to define and enhance the professional identity and roles of paramedics and EMTs were often opposed by physicians, nurses, lawyers and hospital administrators. In the 1970’s states began to pass legislation that defined the legal roles which paramedics and EMTs could play without concern for lawsuits from their customers. Specialized emergency physician training was also developed during the 1970’s highlighting the role of paramedics, immediate care, transport care, triage issues, communications and the emergency room admitting and medical services. Emergency medical dispatching programs started in the 1980’s. Military paramedics/EMTs adopted national standards in 1986, aligning the two groups. Paramedic manager standards for training have been defined for most states.

Paramedics and EMTs are regulated at the state level. Definitions of roles, titles, allowable drugs/procedures, supervision requirements, certifications, examinations, renewals and education programs varied widely in the 1970’s. The role of national certification as an option or requirement grew throughout the 1980’s and 1990’s. Today, differences between states remain, but most states (45+) largely conform to recommended national standards for all dimensions.

While most people think of paramedics and EMT’s as specialized staff or extra skills held by first responders, the profession now includes military personnel, dispatchers, air staff, emergency room, jail, blood bank, medical labs, education and interhospital transportation roles. This increased breadth of experiences has helped the profession to improve the content of its services, education, certification and allowable procedures.

https://en.wikipedia.org/wiki/Paramedics_in_the_United_States

Professional Certification

As states defined various paramedic and EMT legal roles, they created state professional certification agencies. The first national EMT exam was administered in 1971 to 1,500 applicants. By 1984 one-half of states required the national exam for certification. By 2005, 46 states recognized or used the standardized national exams.

The national exams incorporated American Heart Association standards in 1986. Major national standards changes were implemented in 1994-95 to include 2 decades of lessons learned, a systems approach to paramedic/EMT roles and a dual focus on theory and practice.

A single national organization (NREMT) sets national standards and reviews those states and programs which adopt them. Certification standards are defined for 5 typical levels in each state and at the national level. A majority of states simply adopt the national standards and almost all accept candidates who met the national standards rather than specific state standards. The “level” of skills, training and experience in states that do not adopt the national standards are generally comparable, with a few exceptions. A national standard curriculum is available which is aligned with the testing requirements. Candidates are evaluated on theory and practice, individual diagnosis/treatment and situation/scenario evaluation. Certification requires a period of field internships. A majority of firefighters earn some level of EMT certification. Almost all states recognize certifications from other states. The national agency accredits training programs and agencies.

https://www.emsmemorial.org/ems-history

https://indianahealth.care/history-of-ems

https://wvde.state.wv.us/abe/Public%20Service%20Personnel/HistoryofEMS.html

Professional Education

Ambulance staff training was first defined in the late 1960’s. The first EMT curriculum was nationally recognized in 1969. Prior to this time, ambulance staff had basic first aid training. National training standards were set in 1973 together with the emerging certification exams. A full national paramedic curriculum was released in 1977. A comprehensive “emergency care” manual was published in 1979. Early training was largely done by individual hospitals in urban areas. Training soon moved to universities and community colleges where it is focused today. While associates and bachelor’s degrees are not required for most paramedic/EMT licenses, they are now commonplace. The number and variety of procedures provided by paramedics and EMTs has grown throughout the period. As emergency room physicians became commonplace and their confidence in EMS staff increased, they supported this growth in “standing procedures” to be taken without physician coordination. With increased experience, documentation, best practices and scientifically based standards improved. The medical profession adopted a “systems approach” to health care beginning in the 1990’s and EMS staff have adopted this approach.

Cardiac Care

Prior to 1972, CPR training was defined and more broadly offered in the US. Portable defibrillators were invented but not broadly available. Emergency cardiac treatment programs were rare.

In the 1970’s heart resuscitation guidelines were published, more portable defibrillators were available and related EMT training began.

Cardiac care has been a key curriculum and certification exam component for paramedics/EMTs since the 1980’s.

The American Red Cross introduced defibrillator training into its first aid course in 1999.

The easier to use AED defibrillator was approved for sale in 2004 and is now widely placed in many communities and millions have been trained to use them.

Pediatric Care

Pediatric care was upgraded in the 1984 curriculum and exam standards for EMS staff. Specialized pediatric care hospitals were clearly established.

Emergency Rooms

Hospitals invested in emergency room space, equipment and staff after 1975 when emergency room physicians became a specialty. In 1983 Level 1 trauma centers and pediatric critical care centers were defined and began to be implemented. Disaster resource centers were defined in 2004. Stroke centers were defined in 2009. While these specialty care centers were defined, a wide variety of immediate care centers were established in many areas, providing additional options for EMS services.

Medical Protocols

EMS professionals have benefitted from the global “process revolution” of the 1980’s. Health care professionals view each patient and situation within a “process framework”. This has allowed paramedics and EMTs to increase the variety and depth of first response diagnosis and treatment which they can legally and effectively provide. Evidence based medical standards replaced the previous “trial and error” standards in the 1990’s. Standard operating procedures were defined for most situations. This allowed EMS staff to act immediately without emergency physician approval in more situations. “Standing field treatment protocols” were widely defined and adopted in 1997 clarifying the roles of paramedics/EMTs. EMS standards were further revised in 2000 using the “medical systems” approach. Standardized EMS data recording and sharing began in 2000 and has expanded since then, allowing improved systems, evidence and medical based changes to accumulate. States generally approve both procedure and medical treatment options for individuals holding each level of EMT/paramedic certification.

Communications

In 1972, police and fire vehicles had basic special purpose radio communications and dispatchers as did taxi fleets. Improved medical dispatching skills accompanied the growth of EMS resources. Revised EMS radio communication standards were adopted in 1973. EMS staff benefitted from the expansion of cellular phone services. 911 emergency call services began in 1968 and expanded nationally throughout the 1970’s. Dedicated EMS to hospital communications as increasingly adopted in the 1990’s. Video services were added after 2000.

Funding

In 1966 a National Academy of Sciences study titled “Accidental Death and Disability” highlighted the comparatively high casualty rates of domestic vehicle accident victims versus those with war injuries! Thousands of Americans were disabled, mistreated and died each year versus the standard treatment offered by the military in combat zones. Congress responded by moving lead responsibility for EMS from the US DOT to US HEW in 1972. 5 demonstration EMS programs were funded in 1972. Further federal investments were made in the 1970’s. However, by 1980, Congress and the president decided that states should manage and fund this component of the health care system.

EMS Professional Skills

Today, when you dial 911 in an emergency, you can expect a nationally certified, trained and supervised team to quickly arrive and provide a high-quality level of services.

Assessment of incident, accident, patient situation.

Compliance with standard care protocols and escalation to physicians.

Triage in mass casualty situations.

Safe movement and extraction of patients from accident situations.

First aid treatment.

Intravenous fluid administration.

ECG, EKG administration and defibrillation (manual and electric).

Intubation.

Drug administration.

Acute asthma treatment.

Heart rhythm assessment and rate correction.

Spinal immobilization.

Transportation to the best next level care facility.

One Million EMS Professionals!

There are 1 million certified emergency medical system (EMS) personnel in the US today, up from basically ZERO in 1972. One-fourth are highly skilled paramedics. A little more than one-half are certified EMTs.

https://www.nremt.org/maps

About one-half of the total were certified at the national level.

Pre-1972

Good News: Vehicle Dependability Continues to Improve

https://www.vwvortex.com/threads/jd-power-dependability-2001-vs-2011.5350295/
https://www.jdpower.com/business/press-releases/2021-us-vehicle-dependability-study-vds

Ongoing defects dropped by 60% from 2001 to 2011 and then dropped by another 20% from 2011 to 2021. The compounded reduction is 68%, a little more than two-thirds of the defects disappearing in 20 years.

JD Powers started its initial quality surveys in 1987 and its Vehicle Dependability surveys in 1990. The summary results are not easily found on the internet. The Consumer Reports defect rates are similarly restricted to paying customers.

https://www.yahoo.com/news/30-years-iqs-perspectives-history-222747086.html

In the 1980’s, Toyota and Honda offered significantly higher vehicle quality. Other manufacturers essentially “caught up” in the next 20 years. A snapshot from 1985 illustrates the gap that was closed by 2000-5, before the Vehicle Dependability improvements shown above.

https://www.carqualityinfo.net/reliability-durability-gpas/car-brands—7-best-brands-of-my-1985/
https://www.jdpower.com/business/press-releases/2022-us-vehicle-dependability-study

The very disappointing 2022 results are inconsistent with the downward defect trend of the last 20 years, reflecting the pandemic production, supply chain sourcing and vehicle prep problems of the last 2 years.