Ronald Reagan skewered Jimmy Carter with this taunt in the 1980 presidential debate. Joe Biden’s approval rating is falling quickly in recent months. US voters need to assess the true state of the US economy under Biden’s leadership after 2 years of a global pandemic, last seen in 1918.
Real Disposable Personal Income Per Capita

Real, inflation adjusted income per person continues to rise. In 2000, average income was just $33,000 per year. It rises quite significantly to $38,000 in booming 2007-10. It remains at this level through 2013. This is a 15% increase over 13 years, a little better than 1% per year. The economy adds another $6,000 in the next 7 years before the pandemic. That’s growth twice as fast, 2% per year during this boom time. Real income has grown another $2,000 to $47,000 in the last 2 years, 2% annually, after the pandemic. Very good news.
Employed Persons

US employment was typically 130M from 2000-2012. Great growth occurred from 2012 to 2020, reaching an unprecedented 152M. The pandemic dropped employment to 130M, an incredible 22M lower. Employment quickly rebounded about half-way to 142M during 2020. It has grown by another 6M in the last year. The employment growth from 2010-20 averaged 2M per year. The 2021 record is a very strong performance, reflecting a healthy economy that has robustly adapted to the challenges of a pandemic environment.
Unemployment Rate

Unemployment averaged about 5% during the first decade of the century, a generally good result compared with 20th century history. It doubled to 10% during the “Great Recession” and then slowly declined to 5% by 2015 and then even further, exceeding economists’ expectations, to 3% in 2018-2020. The pandemic rocketed it up to 15%, but it quickly recovered to 7%. It has since declined to less than 5%, which has historically been the typical definition of “full employment”.
Job Quits
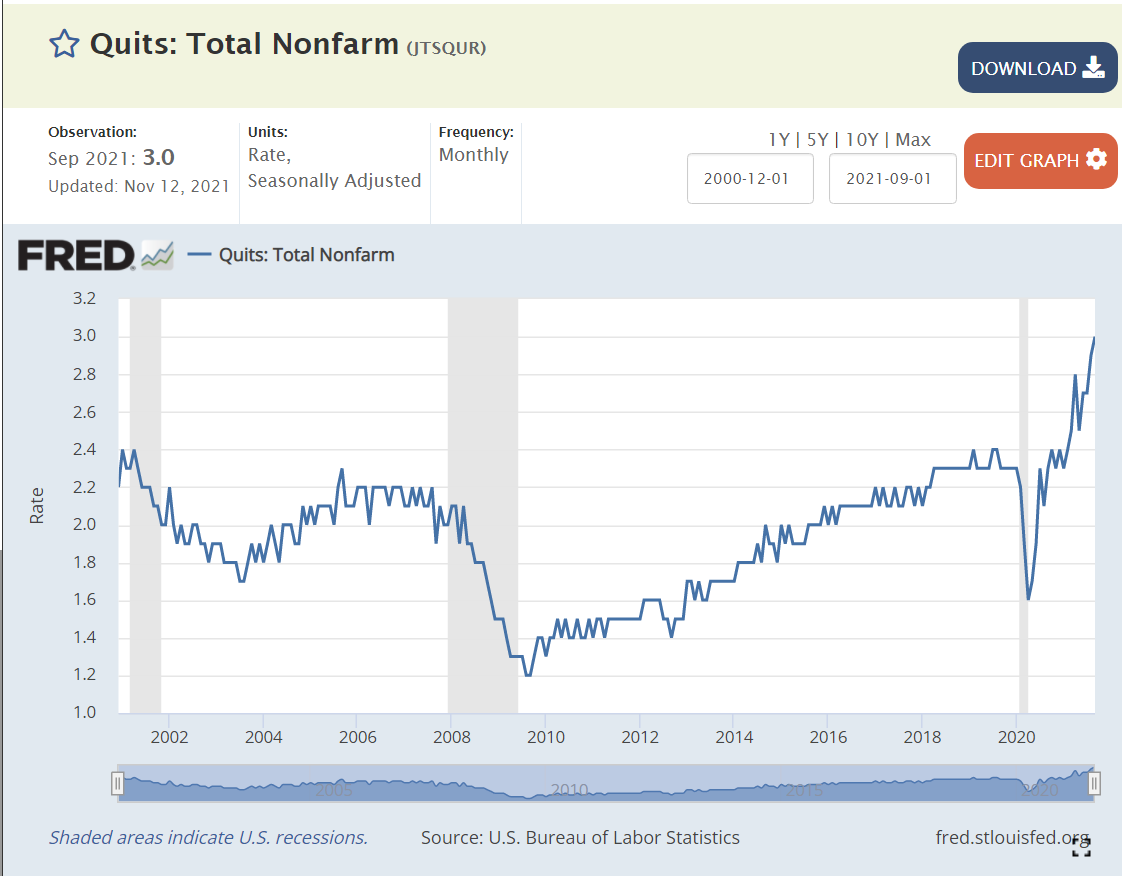
From 2000-2008, about 2% of employees voluntarily left their positions in any given month. The quit rate dropped to 1.5% in the aftermath of the “Great Recession” (2010-13). It very slowly recovered to 2.2% during 2016-18. It increased a little bit to 2.3% in 2019-2020. It rebounded to 2.3% in 2020, and has since increased to an unprecedented 3%. This reflects a labor market where 50% more employees are making a voluntary choice to leave their current employer, apparently confident that they can find an equal or better position.
Job Openings

Job openings averaged 4M from 2000-2014. Openings fell to 3M in 2010-12 after the “Great Recession”. Job openings then grew to 6M in 2017-18 and further to 7M in 2019-20. Job openings quickly returned to 7M early in the pandemic and then began their climb to the current 11M level. Again, these are unprecedented levels, twice as many open jobs as in any time from 2000-15.
Unemployed Persons Per Job Opening

The 2006-7 baseline was 1.5 unemployed persons per open position. The “Great Recession” peak was 6 to 1, an incredibly different labor market, where many older people “retired”; new college graduates went to graduate school, accepted lower positions or remained unemployed; and mid-career professionals accepted positions at 20% lower salary levels. It took 5 years to return to the typical 1.5/1 ratio. This ratio declined a little bit further to 1/1 during 2017-2020 in a tight labor market. The ratio very quickly returned to the historical 1.5 baseline during 2020. It is now at an unprecedented 0.8/1 level. Fewer unemployed people than jobs, not 1.5 to 1, but 0.75/1, half as many potential applicants. This is the first “employees” labor market since the 1960’s.
Home Values

The US Home Price Index was set to 100 in 2000. It increased to 180 during 2005-7. It dropped back to 140 in 2010-13, indicating that part of the rise before “the Great Recession” was a bubble. Prices climbed steadily from 140 to 210 (50% increase) from 2013 to 2020. Despite the pandemic, house prices have continued their climb, exceeding 260, another 25% increase in the last 2 years.
Mortgage Interest Rates
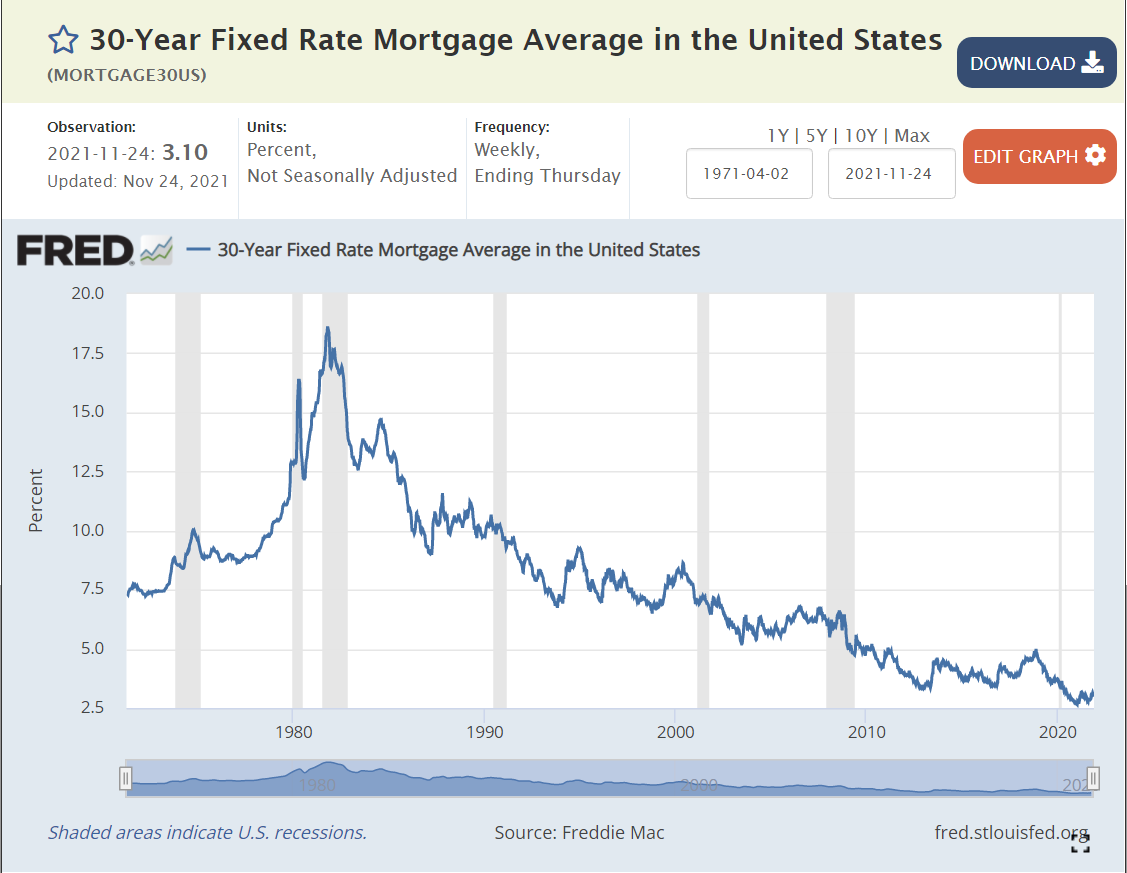
Mortgage interest rates averaged 8% during the 1990’s. They averaged 7% in the 2000’s. They declined even further to 4% during the 2010’s. They fell even further to 3% in 2020-21. The interest cost to finance a house is at an all-time low.
Stock Market
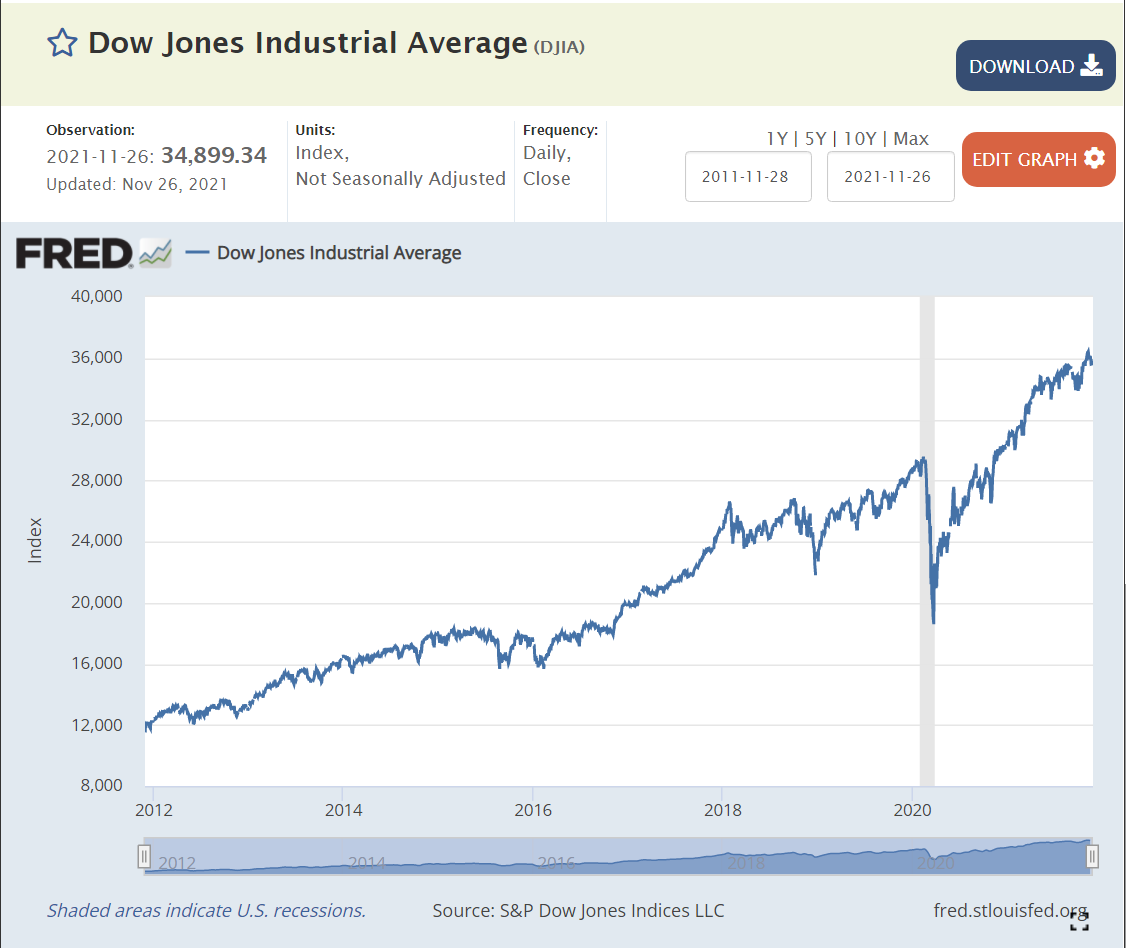
The US stock market averaged 16,000 points from 2014-16. It increased by 50% to 24,000 in 2018, and then climbed to 26,000 and 28,000 before the 2020 pandemic crash. Despite the real financial costs of the pandemic, the market quickly rebounded to 25,000 in the middle of 2020. It has since continued its climb to 36,000, 20% above the pre-pandemic level.
In 1992 James Carville claimed that “it’s the economy, stupid”.
https://en.wikipedia.org/wiki/It%27s_the_economy,_stupid
If so, voters should provide some support to president Biden’s results. Real income is up 2% annually, a record level. Reduction in number of unemployed is 6M in 1 year, another record. Unemployment rate is at 4.6%, below historical “full employment” level. Voluntary quit rate is 50% higher than history, indicating tremendous worker confidence. Nearly twice as many job openings as the historical level, providing great options for job seekers to find their “best” opportunities. Mortgage interest rates remain at historical lows, supporting home purchases. House values have grown by another 25%. The stock market is 20% higher.
This is all at a time when the pandemic unfortunately continues to claim lives and greatly disrupt life and the economy. Overall, the recovery is proceeding at a rate far faster what anyone thought was possible during 2020.