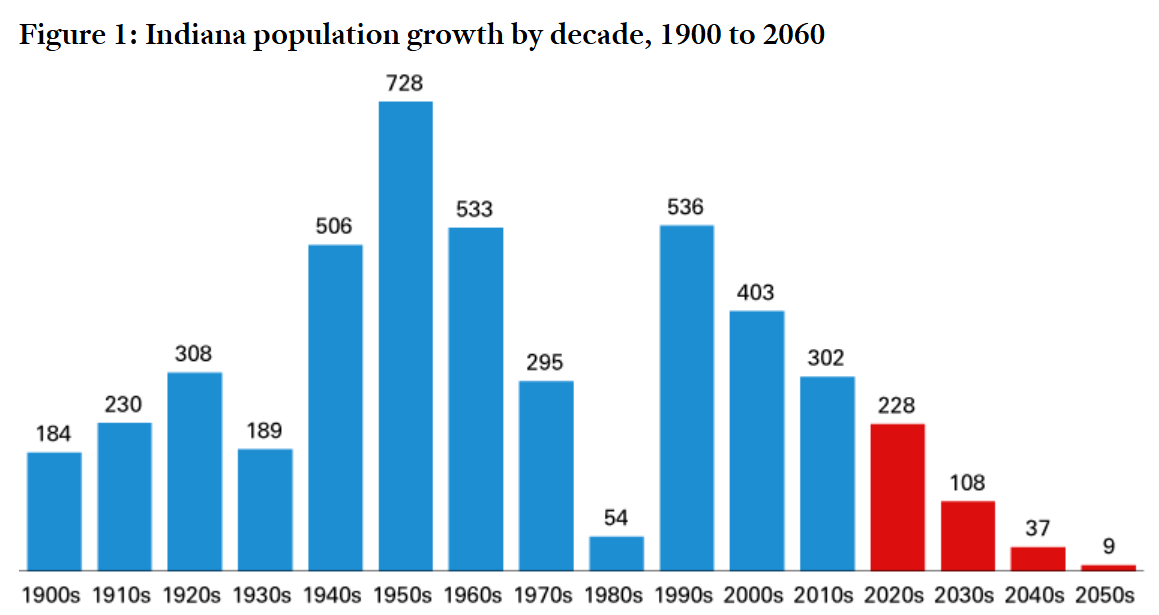
After the two dismal decades of the 1970’s and 1980’s, Indiana recovered with respectable growth for the next 30 years. Based on demographic trends, that growth will be done by the end of the current decade.
Slow-growth drives “win-lose” politics in most times and places.
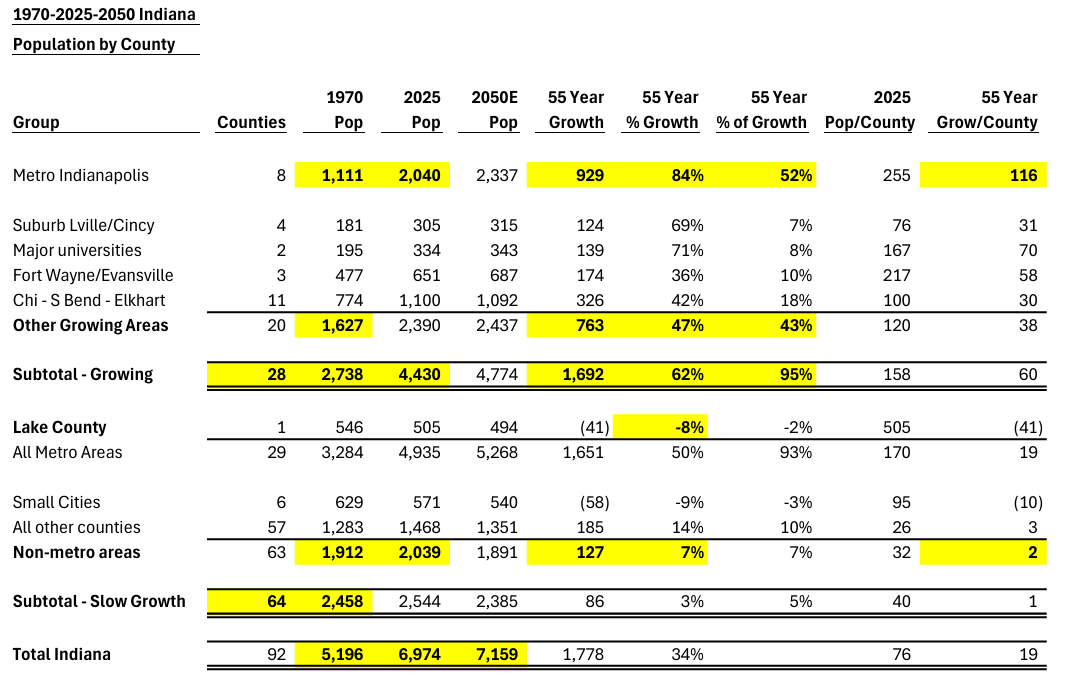
In the last 55 years, about one-third of Indiana counties registered growth and two-thirds did not. In the next 25 years, only 20 counties are forecast to grow. 16 of are part of the 28 in areas that showed growth from 1970-2025. The remaining 4 (Bartholomew, Adams, Daviess and Wells) belong to the group of 64 that saw losses or slow growth across 55 years. In general, the growing areas will show small growth, Metro Indy will grow decently and the rest will decline. Let’s look at the data in chart form.
Data
Analysis
Indiana grew by 1.8 million people between 1970 and 2025, from 5.2M to 7.0M; a gain of 34%.
The 8 counties in Metro Indianapolis accounted for slightly more than half of the total growth.
20 other counties grew, adding 763,000 people. They included Fort Wayne, Evansville, suburban Louisville, suburban Cincinnati, Monroe (IU), Tippecanoe (Purdue) and 11 counties in the Chicagoland “region”, excluding Lake County while including South Bend, Elkhart and Plymouth. Combined, these 28 counties added 1.7M people, while the other 64 counties combined added less than 100,000 people!
The growing counties added 60,000 people per county. They grew by 62%.
The non-growing counties added 1,000 people per county. They grew by 3%.
The contrast is stark and surely drives political views.
In 2025, the 8 metro Indy counties averaged 255,000 people each. The 57 rural counties averaged 26,000; just one-tenth the size.
Lake County (Gary) is set aside as a special case. Part of the Chicago region, but losing a significant 41,000 people; so, grouped with the non-growing counties.
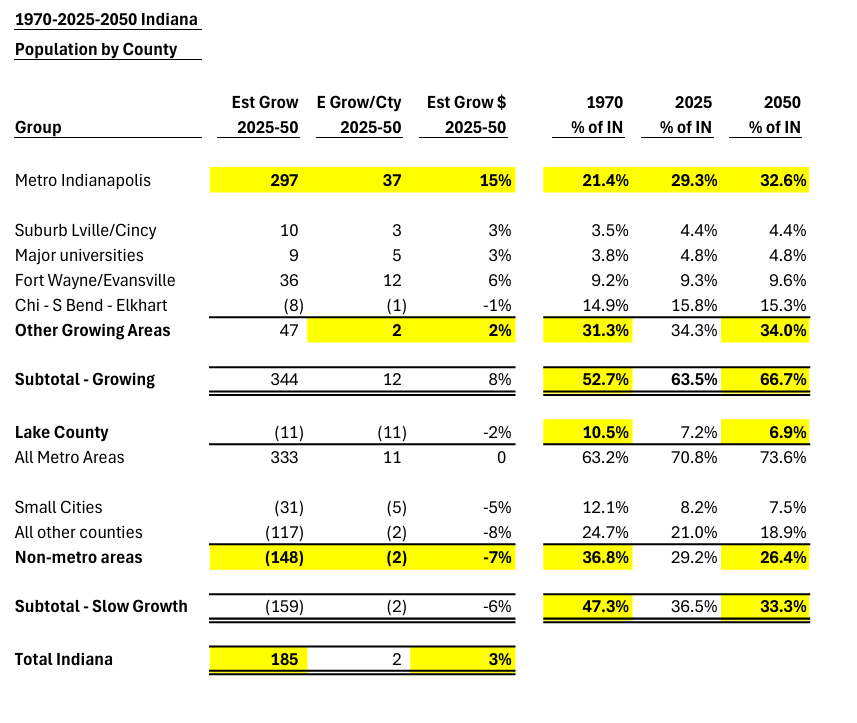
For the next 25 years, metro Indy adds 300,000 people, growing by 15% and a much slower 37,000 people per county compared with the 116,000 people per county in the prior 55 years.
The other 20 historically growing counties add 47,000 people combined by 2050, a small fraction of the 763,000 they added before 2025. The growth rate declines from 43% to 2%. Growth per county drops from 38,000 to just 2,000.
The remaining 64 counties LOSE 159,000 people; 6% of their 2025 populations, 2-3,000 people per county. Sixty (60) of the 64 counties are forecast to lose population across 25 years.
Across the full 80 years, the metro Indy area grows from 21% to 33% of the state population. The Previously growing areas edge up from 31% to 34%. The non-growing counties fall from 47% in 1970 to 37% in 2025 to 33% in 2050.
The 8 metro Indy counties will have the same population and political power as the 64 non-growing counties by 2050. Indiana’s Republican controlled house, senate and governor face a challenging future as its rural base declines further and the urban (blue, purple and red) area grows.
Hamilton County moved up to a tie for 14th place among the country’s 3,100 counties with 62% of its adults holding bachelor’s degrees as of 2023.
Ahead of Hamilton County are 8 Washington, DC area counties, New York County (Manhattan), 19,000 person Los Alamos County, NM, 17,000 person Pitkin, CO (Aspen), 26,000 person San Miguel County, CO (Telluride), and 329,000 person Denver suburb Boulder County.
387,000 person Hamilton County is tied with 272,000 person Williamson County, TN south of Nashville and 153,000 person Orange County, NC west of Raleigh-Durham.
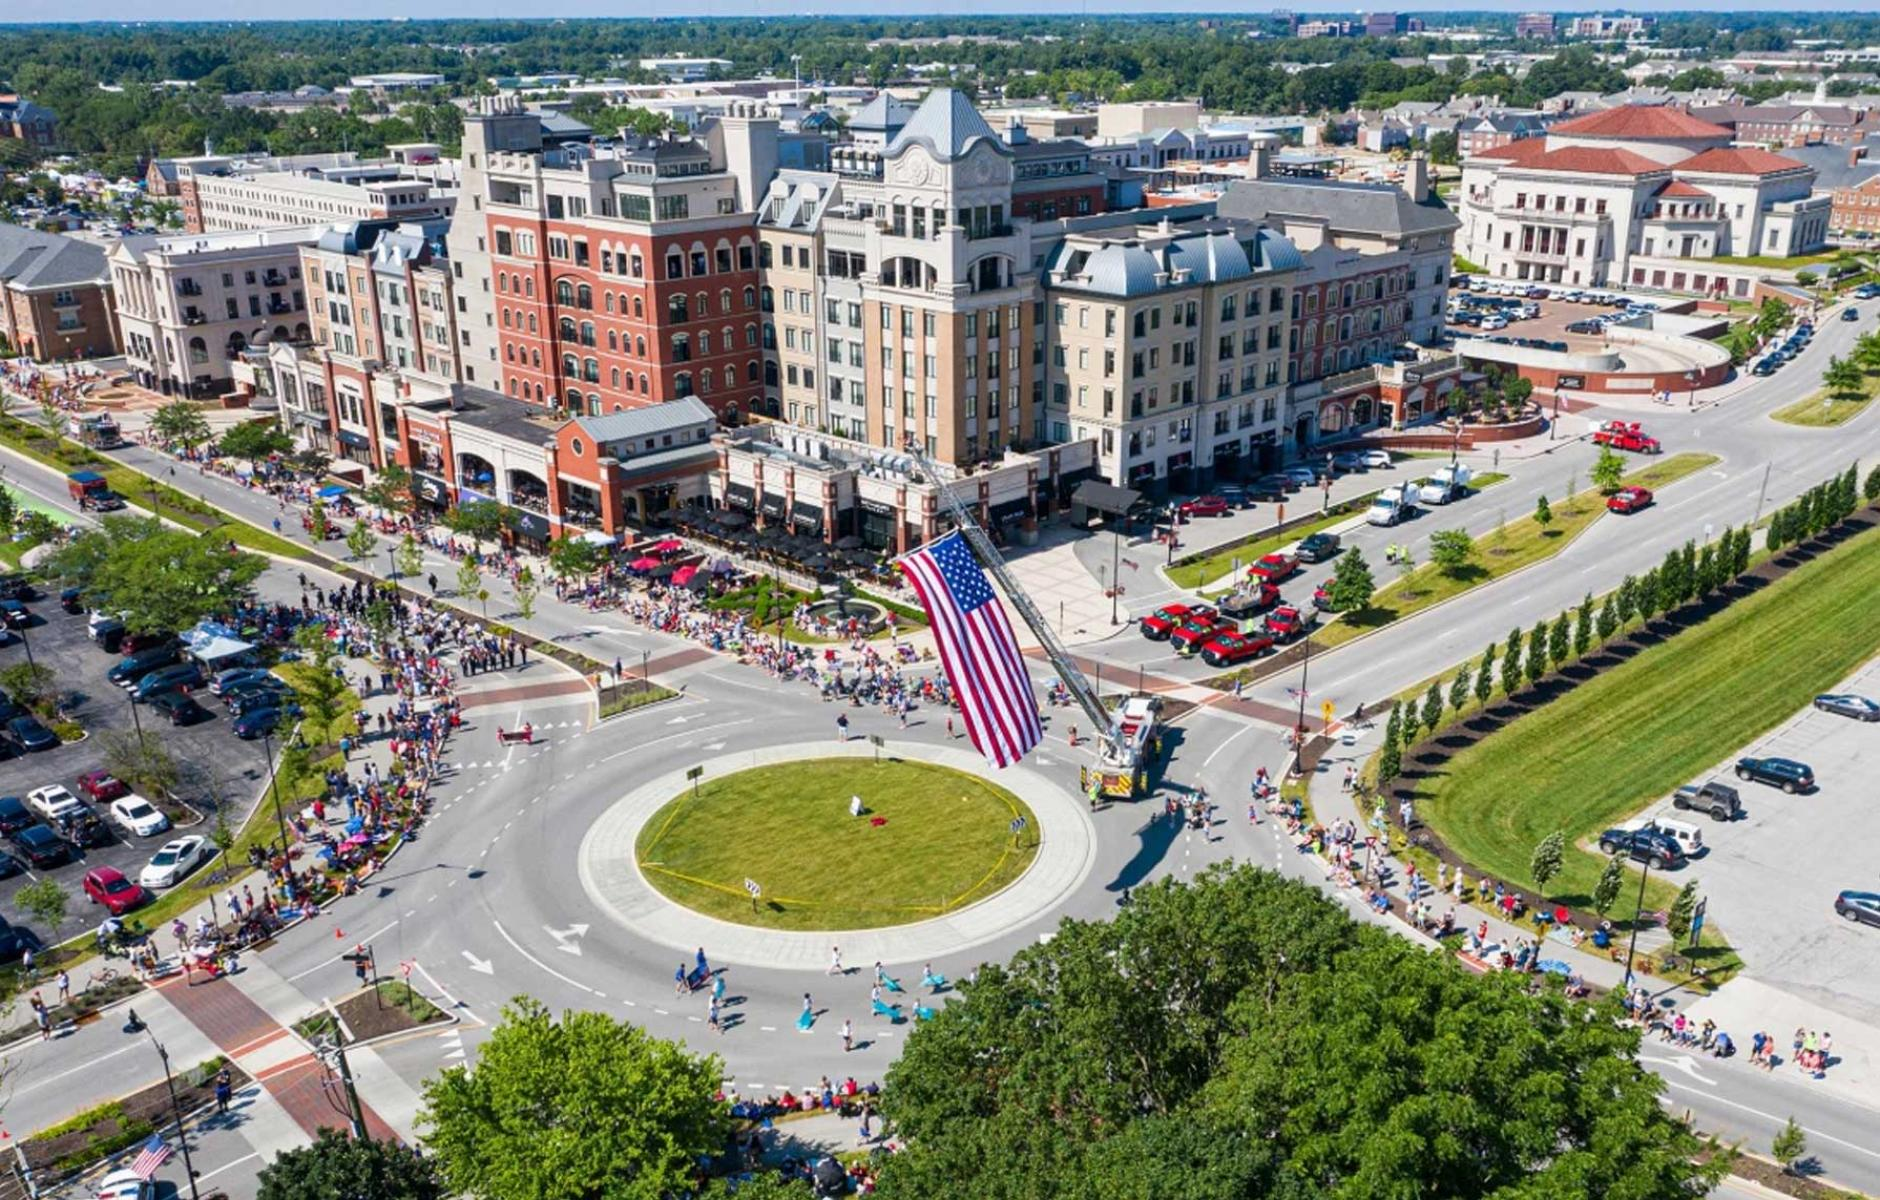
Carmel, Indiana is a 46 square mile city of 105,000 people a dozen miles north of downtown Indianapolis.
As 28-year mayor Jim Brainerd once quipped, “We don’t have mountains, valleys or an ocean, but neither does Paris”. How could an Indiana city create such a natural reputation for success?
Carmel is a suburb of Indianapolis, so it has benefitted from suburban growth since the 1950’s.
Indianapolis, like Columbus, Nashville, and Minneapolis, has been a heartland growth winner.
Indiana is a low cost of living location, benefitting from being the “Crossroads of America”.
Indiana is a low tax and low government services state, with expectations that government needs are best addressed at the lowest possible level.
Indianapolis has no natural geographical constraints to growth or limits that raise the cost of living. The Northwest Territory’s 6×6 mile townships expand in all directions.
Most metro areas have a preferred direction for wealth and growth. Indianapolis chose to develop straight north along Meridian Street across the Marion County border into Carmel by the 1950’s.
This branding and “first mover” advantage is common among America’s 50 large metro areas. Carmel benefitted from competitors in NW Zionsville limiting development to preserve the small village character, NE Geist having limited lakefront property and NNE Fishers limited main highway access.
While Indiana today is considered a deeply red state, historically it was more purple, with heavy manufacturing/worker counties balanced by rural/farming counties. Indianapolis was a local government innovator, creating county wide Unigov in 1970 to combine the city and county, preserving Republican dominance. Indianapolis has elected centrist mayors for 6 decades: Lugar, Hudnut, Goldsmith, Peterson, Ballard and Hogsett.
Jim Brainerd served as mayor from 1996-2024 as a centrist/practical Republican in the Governor Daniels mode, focusing on local economic issues and needs, without being distracted by national wedge issues.
Carmel understood the power of zoning and used this to adopt overlay zones to guide denser and higher quality development in the Meridian corridor, Range Line Road, Arts & Design District and Midtown areas. Politicians understood that Carmel was a valuable place for developers and set limits to ensure that the community would also benefit from growth.
Mayor Brainerd used the powers of the Indiana strong-mayor system to create tax increment finance (TIF) districts to capture the future property tax values of areas to allow for leveraged government investments in infrastructure.
Mayor Brainerd and the city council also allowed the city to borrow at advantageous interest rates to finance other investments to promote the city’s growth.
Like many governments, Carmel offered tax incentives to attract corporate developments.
Mayor Brainerd found that roundabouts were a local, traffic, aesthetic, environmental, safety, time, and cost winner. He prodded the city the install 150 roundabouts.
Mayor Brainerd incorporated a small investment into the arts and not-for-profits into the annual budgeting cycle. Local citizens applauded.
Mayor Brainerd chose to invest in community art, statues downtown and in the roundabouts. Again, the community applauded.
Journalistic histories emphasize the role of Mayor Brainerd in “transforming” the sleepy suburb into a new urbanist “edge city” and nationally recognized place to live. Mayor Brainerd deserves credit as a visionary and catalytic leader who delivered the goods for 3 decades. Yet the Carmel story begins before him and continues today. It relies upon political, government, community and volunteer leaders who believed that Carmel could deliver the highest possible quality of life for its residents and neighbors. I point to a few representative leaders who deserve credit.
Carmel has invested resources in making it a safe city. School safety officers requiring a separately approved levy. Formal quality standards for police and fire departments. County level emergency preparedness investments.
Carmel public schools are consistently rated among the best in Indiana. Critics say this reflects the wealthy socioeconomic status of the community. “The proof is in the pudding”.
Indiana schools are mainly funded through a statewide formula. Indiana property taxes are capped as a percentage of value. Carmel residents have chosen since 2010 to approve property tax levies to exceed the formula and the standard maximums. Recent state tax, budget and formula changes are driving new requests.
Carmel library has moved twice, expanded its main location and added a branch location. Carmel library has been nationally ranked for its activity, circulation, programs and financial investments.
Carmel aspires to be a diverse community. It has been a primary corporate transfer and health care professional destination, welcoming non-Hoosiers and preparing residents and students for national and global roles.
Carmel has more economic diversity than some expect, with many middle-class and young adult neighborhoods south of 116th Street and within the boundaries of Keystone Parkway and Meridian/US 31.
Density is good. Commercial property tax base is good. Employers are good. These 3 statements seem trivial and obvious, but many “professional class” suburbs reject them, wishing to live in an idyllic rural paradise. Carmel has always embraced manufacturing, offices, retail, and apartments.
The Meridian Corridor overlay district promoted dense development and prevented strip malls. The Range Line Road overlay district required dense and multi-use development. The early overall zoning plan encouraged economic development in the central 8 square miles of the city, within the 46 square mile footprint.
Carmel employed TIF districts and public borrowing to attract investors to its central city developments.
It employed the usual tax abatement tools to encourage major corporations to locate within Carmel.
By decade, Carmel’s population grew from 1950 to 2026 in thousands as 2, 10, 20, 33, 43, 65, 83, 99, 105. 4 decades of 10,000 population growth followed by 4 decades of 15,000 population growth. Growth may slam shut in 2030-2035. Growth provides advantages to utilities, realtors, developers, construction firms, media, and governments.
Lacking mountains or oceans, the community has developed events for every month of the year to celebrate. Many events were created, grown and managed by small groups of individuals with background support from the city government.
Carmel has leveraged its existing natural neighborhoods to develop a sense of place. Real estate developers have built traditional 50-300 home subdevelopments and filled in spaces. The city focused on the central city neighborhoods to define the “arts & design district” and midtown. The parks district has built and enhanced regional and neighborhood assets.
Carmel began with advantages as a growing suburb north of Indianapolis’s historic Meridian-Kessler neighborhood. Political leaders made wise decisions for several decades. Carmel’s measures of success have gained national recognition. However, the character of the community and quality of life is driven by the personal responsibility that citizens take for themselves and their neighbors as symbolized by the moms who built the first park and the dads who started the youth athletics programs.
Finland is a tiny country. 5.6 million people in a world of 8.3 billion people. One of every 1,500 people lives in Finland. About the size of metro Philadelphia or metro Atlanta. Smaller than 72 cities. Less than Miami, Singapore, Dallas or Toronto. Just 1/5th the size of Jakarta, Dhaka, Tokyo, Delhi or Shanghai!!!!
An unusual language, distantly related to Hungarian and more closely connected with Estonian.
Yet, it clearly “punches above its weight”. 5 Nobel prize winners. Retaining its independence in 1940 against a vastly superior Russian army. 480 Olympic medals. Perennial global ice hockey competitor. Paavo Nurmi, the flying Finn. 2006 Eurovision song winner. Northern lights. Reindeer.
Finland experienced massive outmigration through time. 500,000 to the US and Canada. 650,000 Finnish descendants in the US today. 140,000 to Russia. 500,000 to Sweden.
Balmy Helsinki’s average daily high is 30 in December/January/February and 69 in June/July/August.
Today we incredibly look to Finland as the “happiest” country in the world with the “best” school system! This does not compute!
The SISU attitude is considered a national treasure. Extraordinary perseverance, an action mindset, latent power, resilience, community, spiritual force, the good life. In essence, an indomitable collective will to survive and thrive despite many threats.
Rose Colored Glasses; Man Bites Dog; If it Bleeds it Leads.
Politicians, journalists and influencers of all stripes emphasize the bad, the emotional and the unusual. This burdens us and our society. Allegedly, “it’s bad now, and it was MUCH better in the past”. This eternal NOSTALGIA is a big problem for our society today, leading many people to turn to populists, idealists, authoritarians and charlatans for salvation.
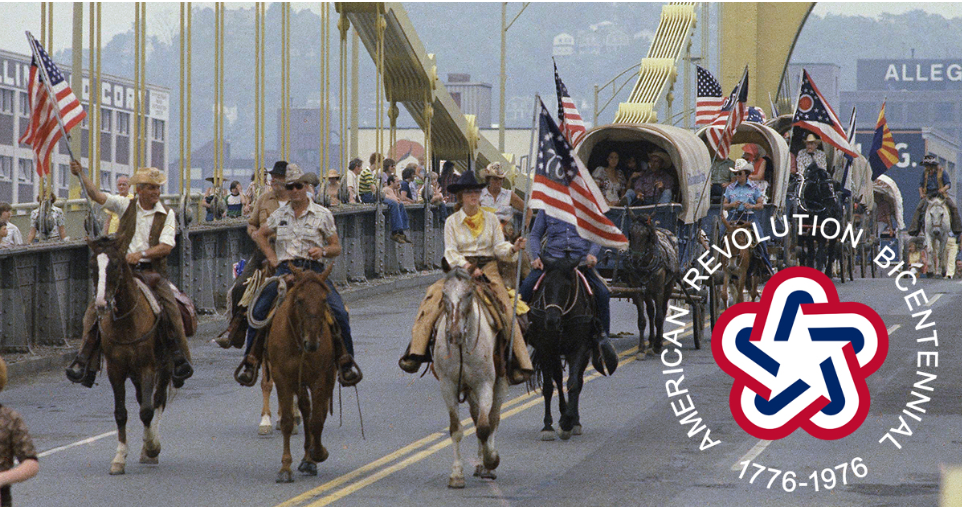
I will outline how much better the United States of America is TODAY than it was in the mid-1970’s. I graduated from high school with the class of 1974. I watched the emotionally mixed American bicentennial celebrations in 1976. I remember Jimmy Carter’s 1979 “malaise” speech in which he said that we, the people, needed to face our challenges directly, especially at a moral level. He was briefly cheered but then criticized for being too negative and pessimistic; an uninspiring leader!
Modern life in the USA is immeasurably better than it was in the 1970’s. It is certainly not perfect. The country has not achieved all that it could have or should have in the last half century. It still faces large global and moral challenges and wonders where it can possibly find the leadership, consensus and engagement to resolve them.
The sheer magnitude of changes in daily life across 50 years is difficult to describe but I hope that my outline will collectively communicate the great scale of improvements we have experienced and the resulting hope and expectation that the next 50 years will deliver the same kinds of positive growth. When we consider the last 50, 100 or 150 years of American life, we should be very optimistic.
Global Threats and Opportunities
The Cold War ended in 1989, relieving the pressure of 4 decades of imminent nuclear destruction. This was a miracle. No war. No revolution. No territories seized. No leaders executed. A quiet end to the threat. The US managed the threat of nuclear terrorism. West Germany embraced East Germany. The European Union welcomed new members. The global economy thrived.
The US established relations with China in 1979, beginning the country’s path to economic prosperity, trade and global influence. The growing trade between China and the world has acted to reduce the threat of conflicts while reducing the cost of goods for all.
The US welcomed the growth of Japan plus the “four tigers” of Hong Kong, Singapore, South Korea, Taiwan, as Asian nations embraced the “Western consensus” of mixed market capitalism, global trade and liberal democracy.
European nations also left behind histories of authoritarian governments or too much socialism to embrace the “Western consensus” and thicken ties through the European Union. Francis Fukuyama prematurely declared “the end of history” but the attractiveness of these successful choices was clear.
The US joined international efforts to reduce tariffs and increase trade leading to a doubling of imports and exports as a share of GDP.
The US adopted a less internationalist position after 9/11/2001, declaring a war on terror, defining the axis of evil, revoking treaty commitments, justifying preemptive war and invading Iraq without UN support. Even with this change, the US largely avoided major military conflicts and losses.
Total immigration to the US grew during this period from 2.3% to 2.9% of the population per decade. Many immigrant groups successfully joined American society.
The US welcomed foreign students to its universities. International tourists increased from 15 to 75 million per year.
The US attempted to resolve the Middle East conflicts with some success, avoiding large scale wars.
The US participated in talks to define and address the threat and impact of global warming. It has taken steps to reduce US carbon emissions.
Politics
Presidents Ford and Carter helped to rebuild confidence in the government after Vietnam and Watergate.
Ronald Reagan established “Conservatism” as a broad political philosophy for the Republican party.
Bill Clinton repositioned Democrats more to the center on economics with his “third way” approach.
Both parties increasingly used wedge issues and either/or choices to polarize parties and choices; although the share of independent voters has grown from 30 to 45%, with the rest evenly split between the two dominant parties.
Perot, Buchannon, Palin and Trump provided social and economic populists with a choice.
The country increasingly accepted racial minorities, women, gays, religious minorities, and immigrants; but the conflict between traditional and modern views was politicized as some could not tolerate the changes and others sought to embed the changes as universal human and legal rights accompanied by social pressures to comply with the dominant “tolerant” view.
Federal government employment was reduced from 5 to 4 million in 50 years, while the population grew by 50%. After Reagan, “government” solutions were inherently suspect. Even Bill Clinton declared “the era of big government” is over.
Total federal, state and local government activities grew a little faster than the economy, with the ratio of tax receipts to GDP inching up from 29% to 32%. The ongoing pressure to “cut spending, taxes and regulations” could not defeat the pressures to address social, political and economic issues and interests.
The top marginal income tax rate was reduced from 70% in 1982 and has remained just under 40% since 1987. Neither party has proposed widespread tax increases.
The Affordable Care Act was enacted in 2010, helping to bring the share of Americans without health insurance down from 20% in 1975 to 8% today.
The US safety net/welfare system has remained intact during this period driving the supplemental poverty rate down from 20% to 15%, while the official poverty rate has declined by just 1%. The share of the elderly (65+) in poverty has fallen from 16% to 8%.
The Economy
Real dollar GDP is 4 times larger at $24 trillion.
US real per capita GDP has remained the highest of all major countries for a century. Continued leadership reflects a dynamically successful economy.
Real per capita GDP has increased by 250% to $70,000.
US fiscal and monetary policy has repeatedly been effective in taming the business cycle and recovering from shocks like the housing crisis and the pandemic.
Industrial production, including energy, is up by 250%.
The number of business establishments has doubled to 8.6M, providing ownership and employment opportunities in a more specialized, globally traded world.
The number of franchise businesses has grown from 375,000 to 800,000+, employing more than 10 million people.
The rate of new business formation and success increased throughout the period, with a new boost after the pandemic.
Businesses responded to the 1970’s “Japanese invasion” and became strategically more focused, measured more effectively, focused on cost reduction, invested in R&D, and applied information technology and process improvement tools. Foreign and domestic competition led businesses to be more cost effective, improve product quality and offer products better tailored to diverse customer wants and needs.
Firms experimented with factory robots by 1975. They now use 380,000 robots, adding 10% more annually.
Auto production in the US has increased from 8 to 10 million units per year.
Farms produce twice as much using 20% less land and 40% less labor.
Businesses adapted to the world of greater international trade by growing or shrinking facilities, markets, products and product lines. They adapted to the new power of consumers and retailers and reduced power of manufacturers. They divested units and rejected the conglomerate model. They rejected vertical integration, learning to outsource all functions where they did not have a competitive advantage.
Firms embraced more effective banking, equity and bond markets to fund their activities. They tapped global sources and private equity. They learned by use financial leverage to increase net earnings and acquire other less dynamic competitors.
Firms changed organizational structures to have fewer layers, less positional power, more staff experts and the ability to use cross-functional (matrix) approaches to core operations, projects and joint ventures.
Education
Preschool/Kindergarten enrollment up from 5 to 9 million. Nearly all part-time in 1975 and mostly full-time in 2025.
High school graduation rate is up from 75% to 85%.
Intelligence test scores have increased by more than 10 points.
Share of young adults who have earned college degrees has doubled from 20% to 40%.
Share of adults with college degrees has more than tripled from 12% to 38%.
Share of young women with a college degree is up from 17% to 45%; shares for men up from 27% to 37%.
Share of degrees in STEM disciplines has grown from 11% to 19%.
Number of college students studying abroad is up by 5 times.
Law school first-year enrollment remains at 40,000, while the population has grown by 50%.
US holds 18 of top 30 global university spots.
The number of annually earned doctorates has doubled.
US accounts for 50% of Nobel prize winners, up from 40% in 1975.
Transportation
22% of new cars are electric. Self-driving cars are widely deployed.
Fuel milage has doubled from 13 to 27 miles per gallon.
New car defects have dropped by two-thirds.
Air travel miles are up by 5 times.
FedEx 2-pound overnight service was introduced in 1975 for $75. Service is widespread today at $55.
Same day and next day delivery services are available today, making Amazon.com, grocery and restaurant deliveries common. Catalog mail order lead times were 6-8 weeks in 1975.
Energy
The US faced energy crises in 1973 and 1979 that disrupted businesses, emptied filling stations and led to recessions.
The US imported 35% of its petroleum products in the 1970’s. It is a net exporter today.
Energy intensity, the ratio of energy used to GDP, has fallen by 60% since the 1970’s.
LED bulbs last 10 times longer. Lithium-ion batteries last 4 times longer.
Wind power is 10% of electricity generation. Solar is 10% of electricity generation. Solar is the lowest cost source today, accounting for two-thirds of new generating capacity added.
Coal production is the same today as in 1975, down 50% from its 2007 peak. It is declining rapidly.
Environment
Toxic air pollution measures are lower by 65-90%.
The world resolved the threat to the ozone layer.
Percentage of US homes in communities with treated wastewater has increased from 50% to 80%.
State parks acreage has doubled. Federal parks acreage has tripled. Land trust additions are equal to the state parks area.
Total US forest land area has increased from 750 to 800 million acres, while the US population has grown by 50%.
Nesting pairs of American bald eagles have grown 100-fold, from 700 to 70,000.
US (1976) and global (2014) birth rates are half of historical levels, reducing environmental demands.
US is on track to reach 50% reduction in greenhouse gas emissions by 2030.
Health
Life expectancy has increased from 73 to 78 years.
Infant mortality rate has dropped by two-thirds.
Smallpox has been eradicated. Polio remains eliminated. Other diseases close to zero.
Smoking rate is two-thirds lower, down from 37% to 12% of adults.
Death rates down: Strokes 67%. Cancer 25%. Flu/pneumonia 67%. Heart disease 50%+. Liver disease 25%.
US governments, medical industry, businesses and people responded to the Covid-19 pandemic resulting in a death rate that was half of the 1917 Spanish flu. Novel vaccine development and flexible delivery resources limited the death toll.
Abortion rates have fallen by 50% since 1980.
Medical research continues to develop new science and solutions. Cloning and human genome mapping.
In vitro fertilization births have grown from 0 to 100,000 per year.
Modern anti-depression drugs (SSRI-Prozac) are much safer and more effective than their predecessors.
Kidney dialysis extends lives for 550,000 today versus 25,000 in 1975.
Americans have 40 million MRI scans done on 13,000 machines, up from zero.
Laser eyer surgery has grown from an experimental procedure to 800,000 annually.
50,000 organs are transplanted each year, up from just a few experiments.
Safety
Property crime rate is down by more than 50%. Violent crime rate is one-third lower.
Both the workplace fatality and injury rates are down by two-thirds.
Traffic fatalities per driven mile are three-fourths lower.
Fire incidents have been cut in half while the population grew by half.
Emergency medical services have grown from 2% to 90% of counties; employing 300,000 people, 50,000 ambulances and 1,300 helicopters.
Consumer
Firms have offered consumers much wider options for products in all industries. A typical Walmart Supercenter has 125,000 different SKU’s.
We enjoy year-round availability of most fruits and vegetables today rather than shopping by season.
Clothing and durable goods prices have been cut by half.
The average automobile is 13 years old versus 6, reflecting massive quality improvements.
Car buyers can choose from 15 major manufacturers instead of just 4.
Appliances in more homes: Washing machines (70-85%), dryers (45-82%), dish washers (28-54%), microwave ovens (4-95%). Refrigerators are 25% larger, half price and 75% more energy efficient.
Median new home square footage has increased by half, from 1,500 to 2,200 square feet.
Mortgage loan rates have declined from 8-14% to 4-7%. Real rates are just 2% today.
Total debt service payments (home, car, credit card, student loan) as a percentage of disposable income have declined from 11% to 10%.
Air-conditioned homes have grown from a hot 55% to a cool 95%.
Away from home food spending has more than doubled from 28% to 59% of total food spending.
Household consumption is up from 87% to 92% of disposable income. Savings is down from 13% to 8%.
Leisure
Many television program options. Top 4 network share down from 90% to 30%. Recording and streaming options exist today.
Cable or satellite TV access has grown from 14% to 100%.
The number of feature films released each year has bloomed from 100 to 700.
Music singles are effectively free today. They cost $7.50 each in current dollars in 1975. The transistor radio has been replaced with portable, wearable devices served by playlists, suggestions and feeds.
Real consumer electronics prices have declined by 80-95%. A 21-25 inch color console was $2-3,000 in 1975 in current dollars. A 50-inch tv is available for $500 today.
A 1982 IBM PC cost $10,000 in current dollars. For $2-3,000 today you get 1,000 times the processor speed, 10,000 times the memory and 100,000 times the storage space.
Video rentals boomed in the 1980’s and 1990’s growing into a digital $100 billion industry.
The $5 billion pinball machine sector evolved into the $50 billion handheld and online gaming industry.
Virtual reality equipment is increasingly popular.
Passports are held by half of US citizens, up from 5% in 1975.
Following deregulation, the real price of air travel per mile has glided down by 40-60%.
Hotel room capacity has doubled from 2.4 to 5.3 million.
Pet food consumption has tripled.
American wine production has increased from 250 to 700 million gallons, along with quality.
American brewery count has increased from 150 to 7,000, along with quality.
Wealth
Mutual funds, index funds and 401K’s offer investing to everyone. Percentage of stockholders has grown from 12% to 60%.
The number of retirement plan participants has grown by 250%.
Real dollar retirement plan assets have grown thirty-fold, from $1.6 to $48 trillion.
Homeownership rate increased from 64% to peak of 69% before falling back to 66%.
Family wealth more than doubled for those in the 1st-25th, 26th-50th, and 51st-90th percentiles between 1989 and 2022. Summary data for 1975 to 1989 is not readily available. Real home prices increased by 20% and the real dollar S&P 500 increased by 75% during this period, overall.
Labor
Compounded labor productivity has increased by 150%, more than 2% per year!
Manufacturing, administrative and farm jobs were reduced by 20% of the total during these 50 years. They were replaced by STEM/analysis, management and health care jobs.
Prime age labor force participation increased from 74% to 84%.
Typical unemployment rate declined from 6.5% to 5%.
Share of self-employed workers increased from 9% to 11%.
According to the Gallup Organization, the share of “engaged” workers has increased greatly in the last 20 years.
Real median family income increased by 40% from 1984 to 2024.
There are dozens of expert calculations of real incomes, adjusted for taxes, government benefits, charity, fringe benefits, hours, etc. Most show that 1975-1990 was flat and that 2000-20 showed modest increases.
Society
The US continues to lead the world in charitable giving as a percentage of income, double the nearest country, Canada.
US migration and population growth in the “Sunbelt” impacted local and national economies, politics and society. Texas (13-31M), California (21-39M) and Florida (8-23M) showed the greatest growth and national influence.
Share of adults cohabiting has increased from 1% to 13%.
Teen pregnancy rate has been cut in half.
The share of married couples has declined from 83% to 67% of households.
Parents now invest 20 hours per week caring for children, up from 12 hours in 1975.
Same sex marriage was legalized by the US Supreme Court in 2015.
Female labor force participation rate has increased from 46% to 57%.
The female to male wage discount has been reduced from 35% to 10%.
The number of congresswomen increased from 19 to 155 (7X).
Women today have access to credit and credit cards in their own names.
Black unemployment declined from 15% to 7%, with the excess above whites falling from 7% to 2%.
Black poverty rate has declined from 30% to 18%.
The Black to White income ratio has improved from 60% to 67%.
The share of interracial marriages has increased from less than 1% to 10%.
Percentage of Americans moving per year has declined from 20% to 12%. Interstate moves have declined from 3% to 2%.
Robert Putnam’s “Bowling Alone” shows a 40% decrease in social participation during this time.
Awareness, tolerance and support for “differences” is higher by an order of magnitude: races, nationality, immigration status, physical or mental disability, gender identity, mental health, autism, obesity, and personality.
Hispanic Americans have increased from 6% to 20% of the population.
The percentage of non-Christians, including religiously unaffiliated, has increased from 12% to 35% of the population.
The share of 40-year-olds never married has increased from 6% to 25%.
Computers
Personal computer software and phone apps provide tools for email, calendars, word processing and spreadsheets to everyone today.
Personal computers are in 95% of homes versus 0% in 1975.
More than 90% of jobs today require computer skills.
Home internet access is 92%.
Digital cameras, music, videos, sound and storage make everything portable.
Voice controlled devices and instant language translation.
Today’s 10-day weather forecasts are as reliable as next day forecasts in 1975.
Google search and artificial intelligence provide access to all of man’s writings and promise thought, itself.
Communications
Internet structure and web browser provide access to everything and everyone.
Smartphones integrate computing and communications. 90% ownership rate. Provides photo, filming and navigating capabilities.
Mobile/cellular phone networks and wifi routers offer universal access to the internet and phones.
Social media networks combine the input of many to build and use networks.
Internet allows for open-source software and information creation.
Video conferencing and internet enabled phone/video calls are common.
Voice mail, answering machines, caller ID and 911 were invented.
Digital books have grown to 25% market share.
Annual first class mail per person increased from 240 to a peak of 360 in 2000 before falling to 130 today.
Daily newspaper subscriptions have plunged from 60 to 20 million.
Share of homes with landlines has fallen from 90% to 30%.
A 3-minute long distance call in 1975 cost $8.70 in current dollars. An international Skye call today is 77 cents.
Summary
The world is a better, richer and safer place. Politics has evolved. The economy is 4 times larger. Businesses and education are more effective. Energy is cheaper. Transportation is better. The environment is much better. Health is much better. Safety is much better. The consumer is king. Leisure options and quality can’t even be compared with 1975. Wealth is up. Incomes are up. Society is digesting many large changes. The computer and communications revolutions have delivered miracles and promise more.
We face social, political and environmental challenges. We have more resources than ever before. Based on American history we should be very confident about solving our challenges.
1880 – Community organizations of many kinds are created to manage immigrants, urbanization, industrialization, growth, mobility, diversity, poverty and public health.
1936 – Self-help books, seminars, programs and counseling blossom, providing an individual, transactional, psychological, positive alternative to religion.
The movement from one Church to many Christian denominations to “A Secular Age” is the largest change. The growth of the US from a small colony to a world power and then to an economic, military and cultural superpower is of equal magnitude. Migration westward, northward, inward and to the cities has reshaped American culture. Individualism has grown to become the dominant cultural perspective. The role of laws and social norms in shaping personal behavior has dropped.
Americans have been extraordinarily mobile, joiners, religious, productive, creative, patriotic, pragmatic, skeptical and independent. The country has succeeded as a multi-cultural nation and been a successful exporter of its culture around the world.
We have lost control of our political system and confidence in our institutions. I offer some root cause reasons for this situation in a series of posts. Second post in the series.
Real, inflation adjusted, gross domestic product (GDP) is up 4 and 1/2 times since WWII when the American economy was the savior of Western Civilization and about to invest in the recovery of Europe and Japan. In this long-term perspective, growth is very constant. Critics can point to the capture of a greater share by the wealthy. Optimists can point to the radical improvement in quality not captured by GDP, increased consumer choices available and a larger share of retirees in the population.
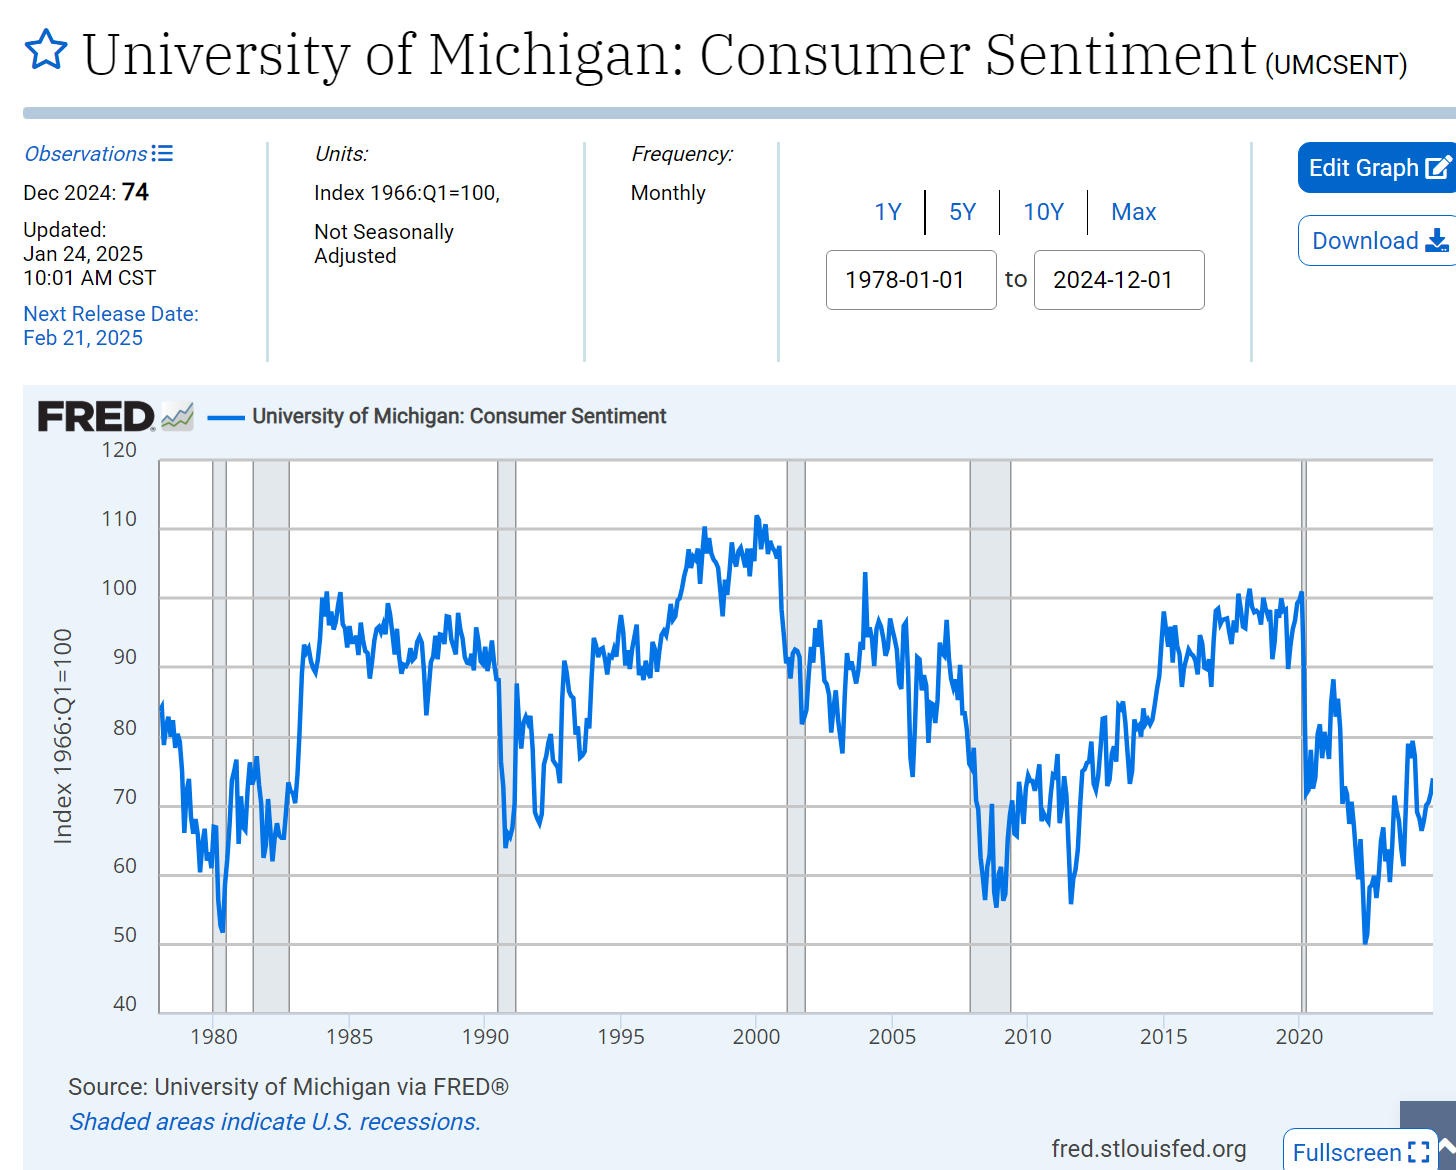
Economic Satisfaction Stagnates
Consumer confidence rises with the economy and declines with recessions and polarized politics, but it has no upward trend to match real incomes!
Unlimited Wants, Limited Satisfactions
Economists assume that people have unlimited wants. Most research and common-sense experience show that this is true.
Post-war economists have persistently claimed that Americans “now” have everything they need materially to be happy, but they have been persistently wrong.
Once we have an idea in mind, we tend to consume information that confirms the idea and avoid or deny challenges. Positive, constructive people will be optimists. Others will be pessimists and follow the bad news media.
When we do try to rationally assess our current situation, we compare it with something obvious. It’s usually something prominent, recent, large, and shiny. We compare today with our best ever experience or situation. We reset our expectations to compare with something prominent in our experience. We don’t plot graphs of our real annual earnings, wealth and leisure. Our expectations are anchored in our best experiences. Current expectations tend to move back to a neutral evaluation.
Humans want more. We are rarely satisfied. That means we are easily distracted in the modern world by marketers, influencers, journalists, bloggers and politicians. Human nature has not changed. Our true economic condition has improved with little impact. Our access to information, education, knowledge and wisdom has increased with minor impact. The ability of communicators to influence our perceptions of the world has greatly increased and we have generally not improved our defenses. “We have much, much work to do today” – Mr. Thoburn Dunlap, 1970, Fairport Harbor, Ohio high school teacher.