| Measure | 2.5 Years | Recent 1 Yr | Trend |
|---|---|---|---|
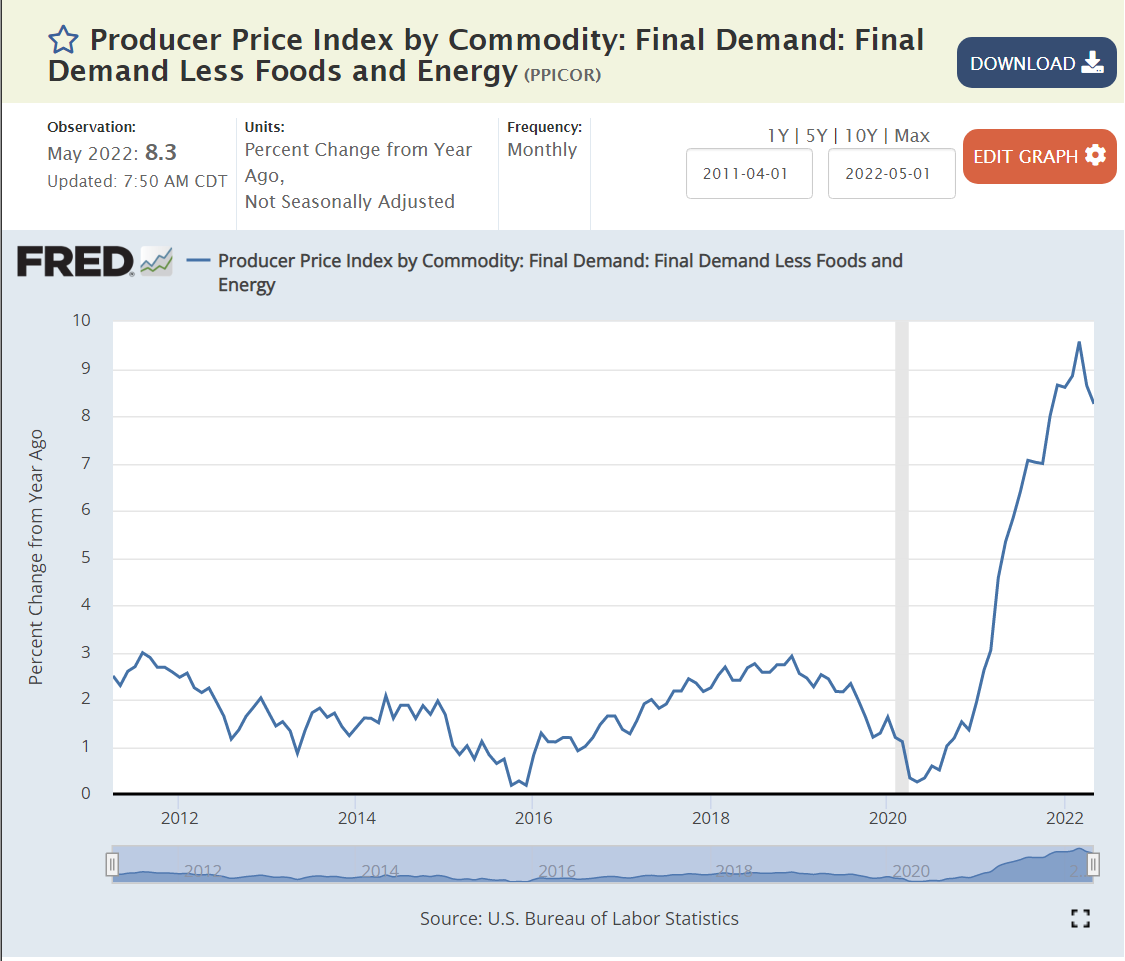
| PPI Minus food, energy, trade | 11% | 7% | Peaked |
| Total Final Demand | 16% | 11% | Peaked |
| All Commodities | 37% !! | 20% ! | Flat |
| Energy | 56% !!! | 45% !! | Flat |
| Foods | 23% ! | 13% | Down |
| Other Goods | 14% | 8% | Peaked |
| Other Services | 6% | 3% | Down |
| Transport and WH | 24% ! | 20% ! | Peak? |
| Whlse and Retail Trade | 22% ! | 14% | Down |
For each measure of produce prices, I’ve provided a 5- or 10-year framework of annual inflation AND a 5 year view of prices indexed to Jan, 2020 before the pandemic began. We did have 2% inflation before the pandemic.

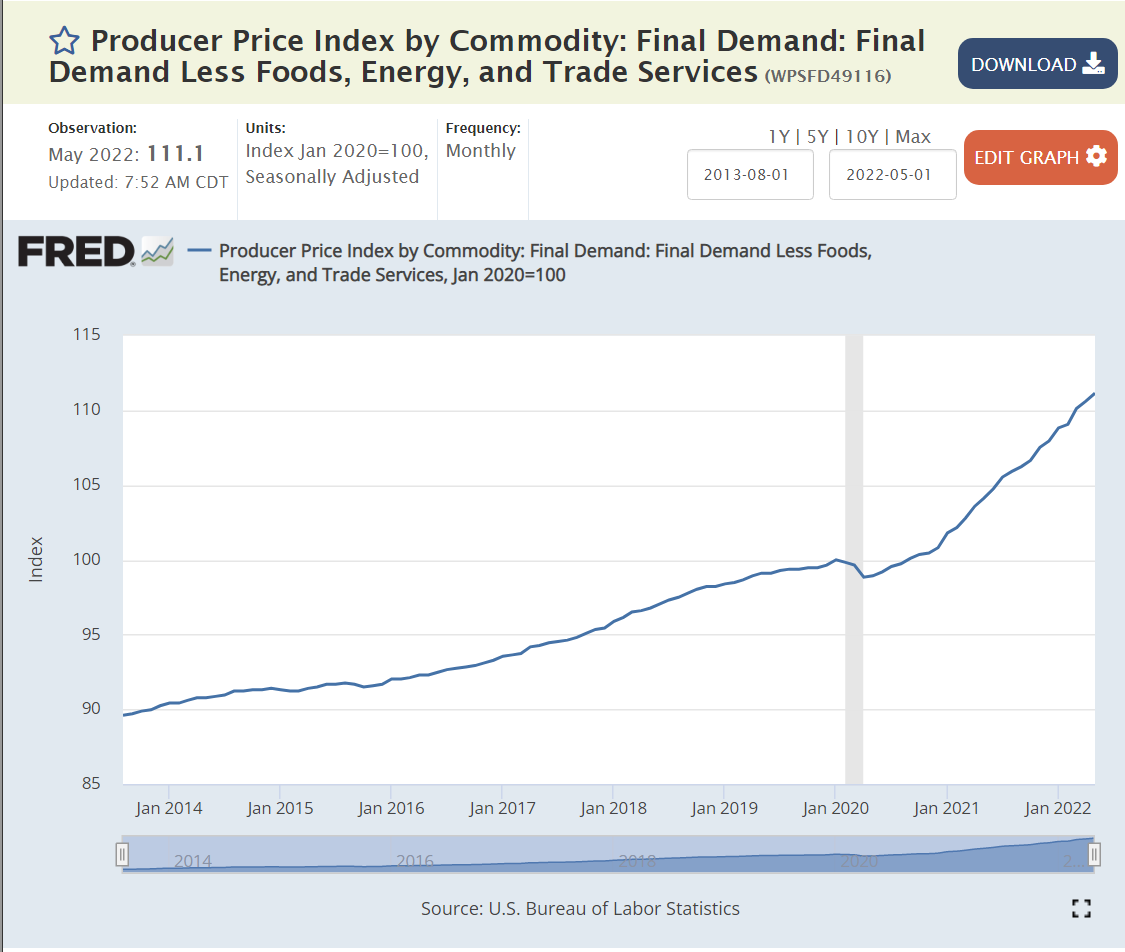
This traditional measure of ongoing inflation pressures peaked at 7% annual rate in 4Q, 2021. In total, just 12% in 2+ years.

Grand total PPI reached 10% annual inflation by the end of 2021 and has remained at that level. This provides pressure for CPI to be higher than 7% for a few more months.

Commodities pressure has been strong only recently, so the total PPI is just 3% higher than the measure excluding the volatile components.


Annual commodity inflation rocketed from 0% in Dec, 2021 to 20% by Jun, 2022 as the global economy was recovering from the pandemic and the extraordinary increase in durable goods demand was registered in supply chain purchasing decisions. Commodities are historically most volatile, but this increase in demand and prices was historic. Note this is way before the Ukraine invasion.

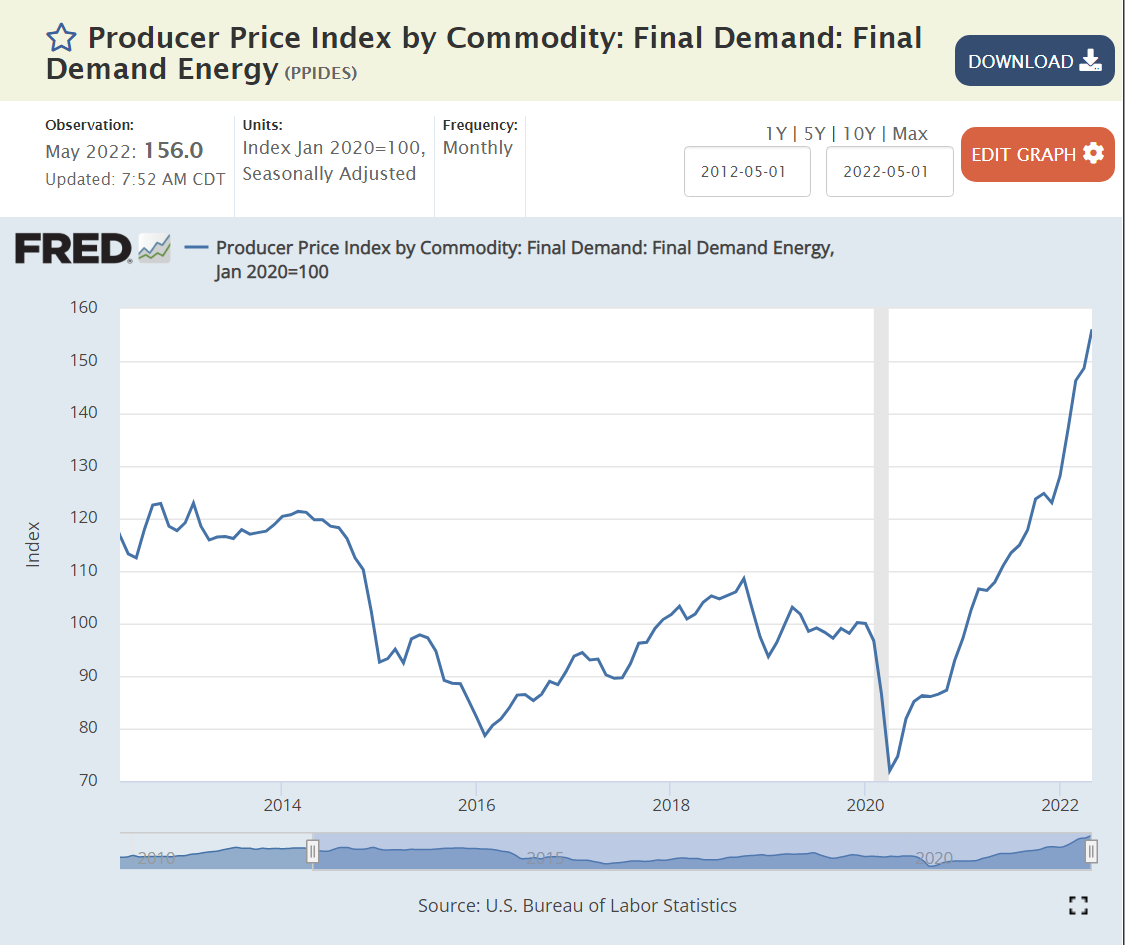
Energy prices were below the pre-pandemic level as late as Jan, 2021 (-3%). They increased exponentially to 50% higher by Apr, 2021. Energy prices have continued to increase at 35-40% annual rates as increased demand, mothballed assets and the Ukraine invasion effects combined to change the global markets. This is one measure where continued very high inflation is possible.


Food prices were a little slower to accelerate. Zero increase at Dec, 2020. 4% annual inflation at May, 2021. 13% inflation at Aug, 2021. Again, this is pre-Ukraine. The 13% ish inflation rate has continued, supported by Ukraine issues. Historically, food prices do not remain elevated for long periods.

Another subtotal, excluding 2 more volatile sectors shows 8-9% inflation peaking.
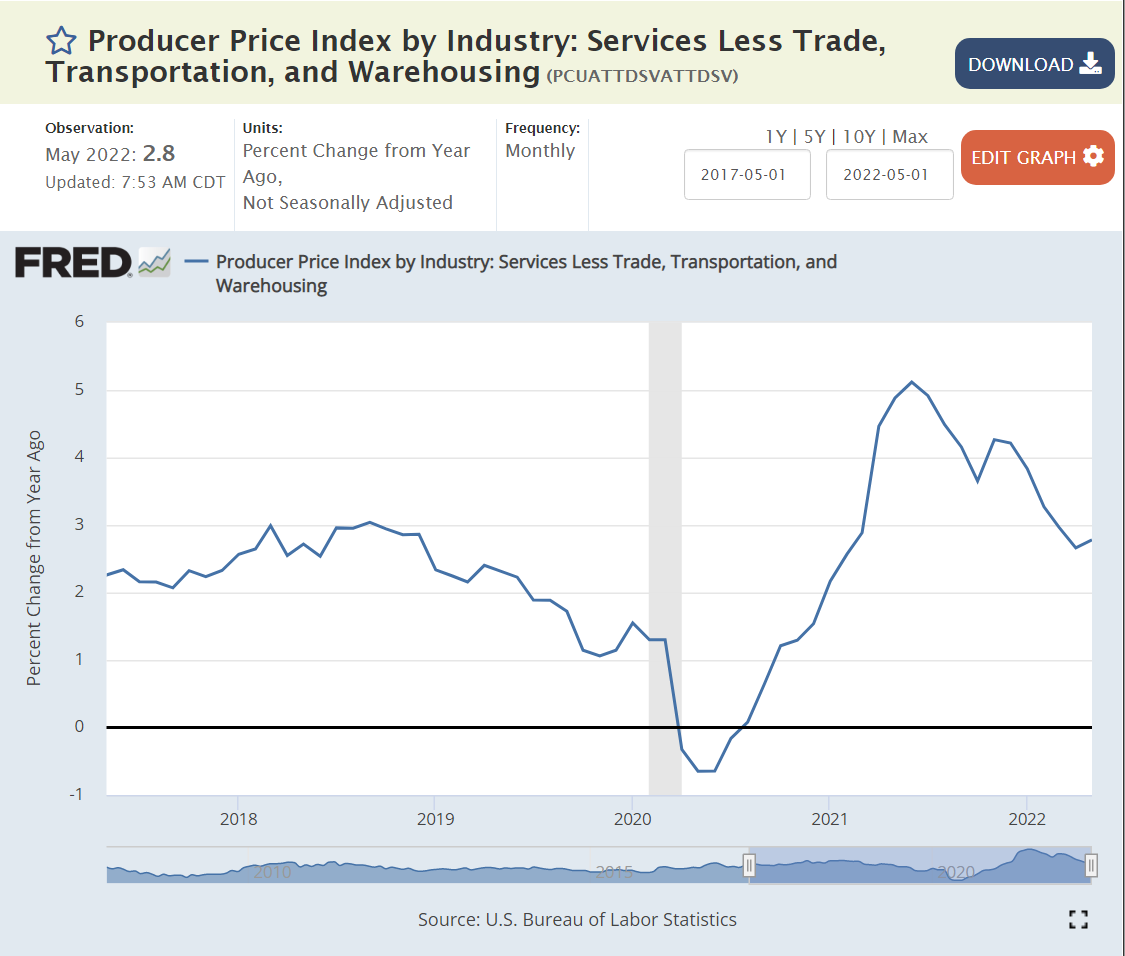
Business services inflation has remained tame, supporting the notion that cost-push inflation due to wage increases is not yet a major threat.


Transport and warehouse prices were also slow to “take off”, remaining below pre-pandemic level through Feb, 2021. Energy prices drive the transportation sector, so these prices also increased. The 20% annual increase seems to have peaked.


Wholesale and retail trade also lagged a bit, still at the historical average 2.5% inflation rate as of Mar, 2021. But, inflation grew to 10% by Aug, 2021 and a peak of 18% in Mar, 2022. The annual rate of inflation has receded to 15%, but that still offers some risks to the CPI for the next 6 months.
https://www.bls.gov/news.release/ppi.nr0.htm
Summary
Six of the nine measures have peaked or are declining. The other three remain at worrying levels without clear signs of retreat. The “core” PPI inflation measure at 7% is not accelerating, so CPI should be able to decline in the second half of 2022. On the other hand, commodities inflation, mostly driven by energy inflation, remains very high without evidence of a meaningful decline in the near-term. Historically, energy and commodity prices fall back after a sharp increase. The general weakening in the global economy also points to a somewhat softer market for energy and commodities.
There is no evidence yet of labor-based cost-push inflation or accelerating/spiraling/self-reinforcing inflation.
“Price gauging” claims are always in the eye of the beholder/customer/politician. When I see relatively low historical price increases, followed by sharp increases, I imagine that business leaders are taking advantage of the situation to drive price increases that were impossible to propose and make stick during the less dynamic past. These can be spotlighted during a period of high inflation, but appear to be more reasonable across the whole business cycle. The food and energy price changes look similar to historical levels of volatility so are less easily questioned.
Big picture, IMHO, this looks like a global commodities “squeeze” due to the faster than expected recovery from the pandemic, especially the 50% growth in demand for durable goods as in-person services were less attractive and available. Loose fiscal and monetary policy in the US and other nations may have been a significant driver of the faster than expected global recovery, but this does not look like a classic case of excessive fiscal and monetary stimulus.
In hindsight, the slow response of the US Federal Reserve Board to the very rapid change in price levels from Jan, 2021 to Jun, 2021 looks like malpractice. Market prices quickly adapted to the current and expected disconnect between supply and demand.
Producer and consumer price increases are likely to remain in the 7-8% range during the 3rd quarter of 2022, but should begin to drift back to the 5-6% range in the 4th quarter of 2022, and still lower in 2023, especially if the Fed increases interest rates by the expected 3-3.5% and businesses slow their inventory, hiring, project and capital spending decisions accordingly.