
Indiana population projections to 2060
Introduction: Location Matters
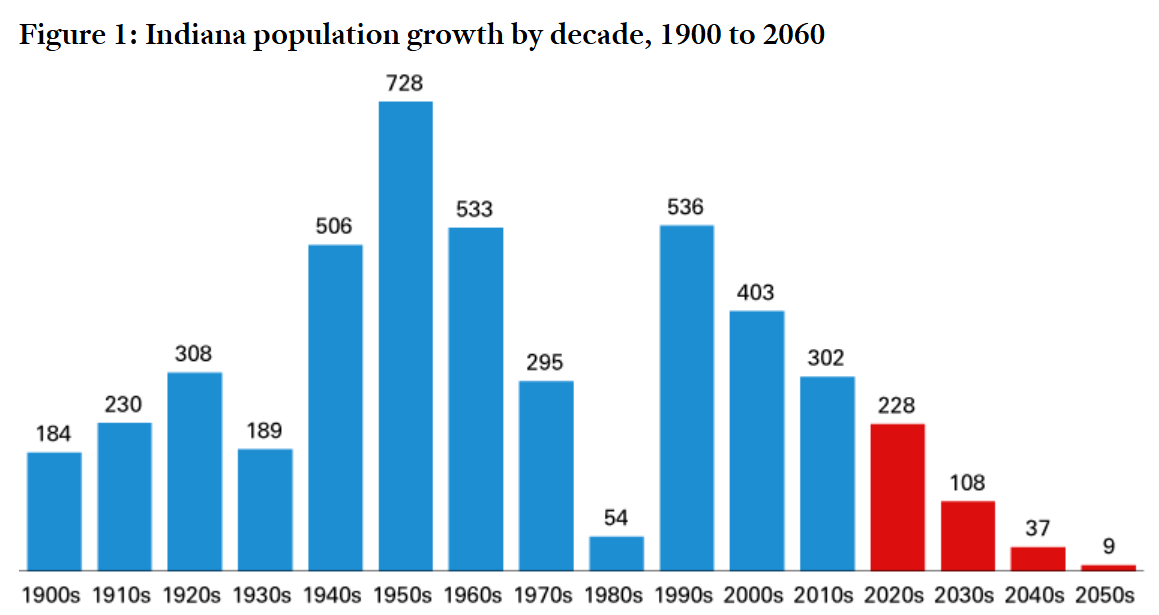
After the two dismal decades of the 1970’s and 1980’s, Indiana recovered with respectable growth for the next 30 years. Based on demographic trends, that growth will be done by the end of the current decade.
Slow-growth drives “win-lose” politics in most times and places.
In the last 55 years, about one-third of Indiana counties registered growth and two-thirds did not. In the next 25 years, only 20 counties are forecast to grow. 16 of are part of the 28 in areas that showed growth from 1970-2025. The remaining 4 (Bartholomew, Adams, Daviess and Wells) belong to the group of 64 that saw losses or slow growth across 55 years. In general, the growing areas will show small growth, Metro Indy will grow decently and the rest will decline. Let’s look at the data in chart form.
Data

Analysis
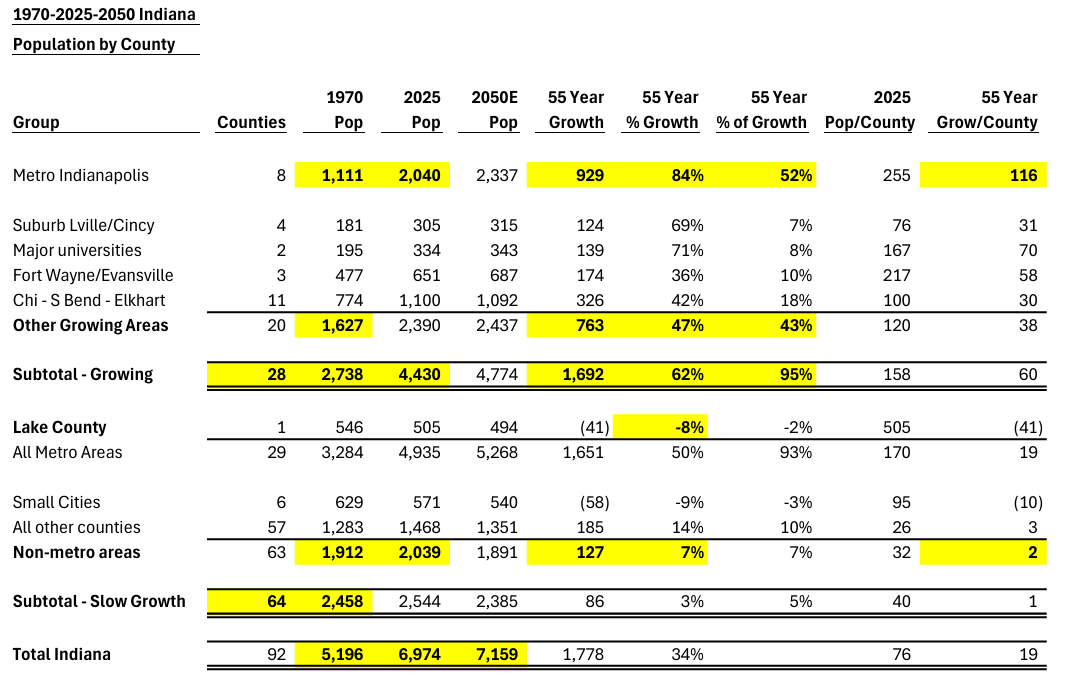
Indiana grew by 1.8 million people between 1970 and 2025, from 5.2M to 7.0M; a gain of 34%.
The 8 counties in Metro Indianapolis accounted for slightly more than half of the total growth.
20 other counties grew, adding 763,000 people. They included Fort Wayne, Evansville, suburban Louisville, suburban Cincinnati, Monroe (IU), Tippecanoe (Purdue) and 11 counties in the Chicagoland “region”, excluding Lake County while including South Bend, Elkhart and Plymouth. Combined, these 28 counties added 1.7M people, while the other 64 counties combined added less than 100,000 people!
The growing counties added 60,000 people per county. They grew by 62%.
The non-growing counties added 1,000 people per county. They grew by 3%.
The contrast is stark and surely drives political views.
In 2025, the 8 metro Indy counties averaged 255,000 people each. The 57 rural counties averaged 26,000; just one-tenth the size.
Lake County (Gary) is set aside as a special case. Part of the Chicago region, but losing a significant 41,000 people; so, grouped with the non-growing counties.
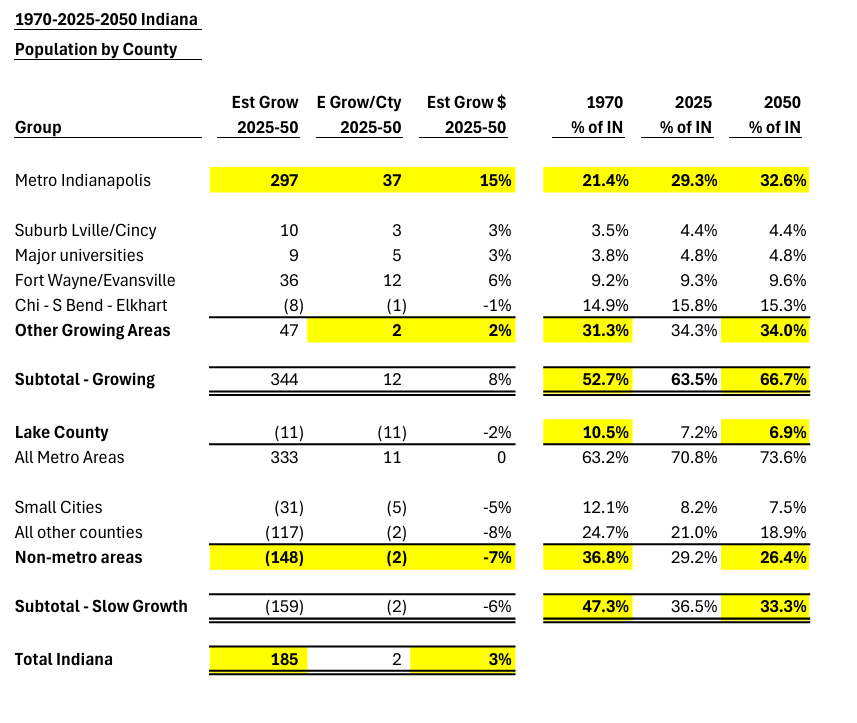
For the next 25 years, metro Indy adds 300,000 people, growing by 15% and a much slower 37,000 people per county compared with the 116,000 people per county in the prior 55 years.
The other 20 historically growing counties add 47,000 people combined by 2050, a small fraction of the 763,000 they added before 2025. The growth rate declines from 43% to 2%. Growth per county drops from 38,000 to just 2,000.
The remaining 64 counties LOSE 159,000 people; 6% of their 2025 populations, 2-3,000 people per county. Sixty (60) of the 64 counties are forecast to lose population across 25 years.
Across the full 80 years, the metro Indy area grows from 21% to 33% of the state population. The Previously growing areas edge up from 31% to 34%. The non-growing counties fall from 47% in 1970 to 37% in 2025 to 33% in 2050.
The 8 metro Indy counties will have the same population and political power as the 64 non-growing counties by 2050. Indiana’s Republican controlled house, senate and governor face a challenging future as its rural base declines further and the urban (blue, purple and red) area grows.
County Census Counts: STATS Indiana
Population Projections Data Output: STATS Indiana
Indiana population projections to 2060
Indiana State and Local Politics, Demographics and Economics (Index) – Good News

