Our Hamilton County: Peer Counties

In 1970, Hamilton County was home to just 55,000 people. It has grown 6-fold since then to more than 330,000. One percent of the nation’s 3,143 counties have experienced similar growth in this 50-year period. These 32 counties combined have grown more than 5-fold from 2.2M (1.1% of US) in 1970 to 11.8M (3.6% of US) in 2020.

8 of the counties are Sunbelt retirement areas. 4 are smaller urban areas. 20 are suburban/exurban counties within larger metropolitan areas.

Each county remains fast growing, issuing an average of 5,000 building permits in 2022 versus an average of 500 per county nationally. Hamilton County’s 5,800 permits is above average.

As a group the counties average 16% of residents aged 65+, ranging from 11% to 25-29% in retirement counties. Hamilton County’s 14% makes it a little younger than the national average of 17%.

The percentage of adults working averages 66% versus 64% for the US as a whole, ranging from 48-54% in retirement communities up to 74%. Hamilton County’s 71% ties for second place.

Median household income at $85,000 for this group is 13% higher than the national average. Hamilton County’s $115,000 is sixth highest. 5 of the retirement counties average less than $70,000. Loudon County records a stunning $170,000.

Poverty rates are the mirror image, at 9% for the group versus 12% nationally. Rates range from 3-16%. Four retirement areas have poverty rates above the national average. Hamilton County’s 4% is tied for second lowest.

The group records 38% of adults with college degrees versus 34% for the nation. 7 retirement counties and Henry County south of Atlanta report 28% or less. Hamilton County’s 61% is second to Loudon County’s 64%.

Average home values are $345,000 for this subset, a solid 22% higher than the $282,000 national average. 10 counties reported prices below the national average, 5 in retirement areas, 4 in suburban counties and Bentonville, AR. 4 suburban counties listed their median home prices above $600K: DC, Sacramento, Nashville and Denver. Hamilton County’s $351,000 was average for the high growth group.

The group averaged 68% non-Hispanic White versus 59% for the nation as a whole. 4 counties had more minorities than non-Hispanic Whites: Ocala, FL, Henry/Atlanta, Prince William/DC and Brazoria/Houston. St. Charles County in the St. Louis Metro area had the highest non-Hispanic White share at 85%. Hamilton County’s 81% was 6th highest.

These 32 counties averaged 10% foreign born, much below the 14% national average. St. Charles County recorded only 3% foreign born. 5 counties reported 20% or higher foreign born: Forsyth/Atlanta, Ocala and Naples, FL, and Loudon and Prince William/DC. Hamilton County’s 9% is a little below the group average.

Summary

Hamilton County is one of 32 counties that have recorded tremendous growth across 50 years. It is relatively young and less diverse than most. It has higher incomes and average housing costs compared with its peers.

Our Hamilton County: Job Growth Is Even Faster than Population Growth

https://www.indystar.com/picture-gallery/news/local/hamilton-county/2023/02/28/inside-republic-airways-new-aviation-campus-carmel/11282362002/

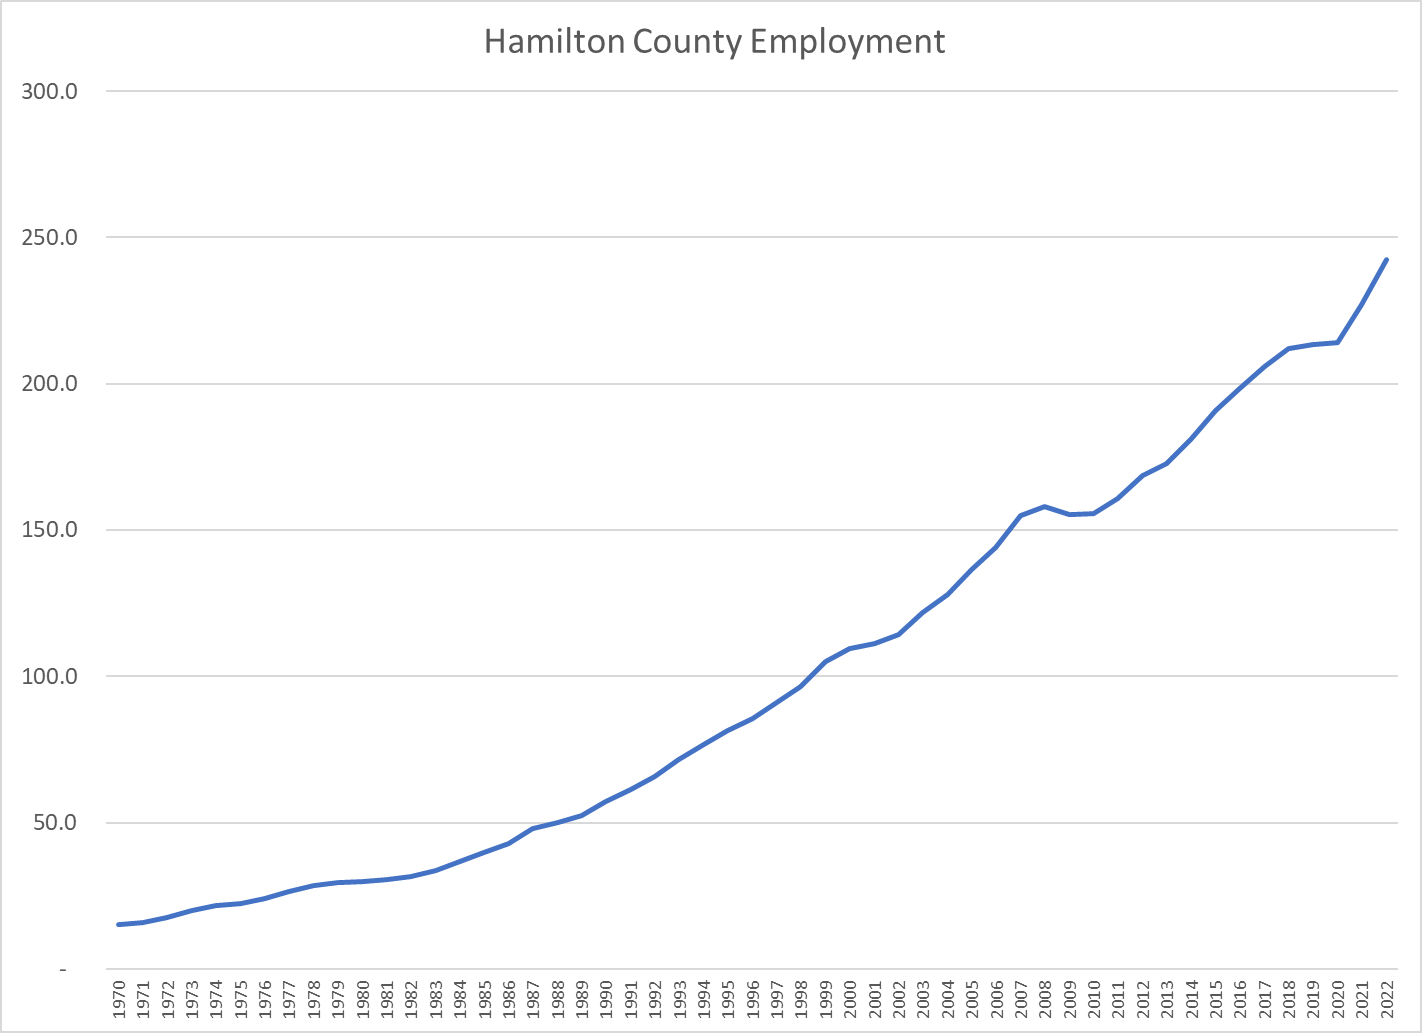
Hamilton County’s employment has grown 16-fold since 1970 from 15,000 to 243,000. This is a 52-year compounded 5.5% growth rate. You aren’t likely to find that growth rate in your stock or mutual fund portfolio!

This growth started from a low base of 1,500 new jobs per year and accelerated to 5,000 new jobs per year by 2000. Hamilton County has maintained this growth rate for 2 decades with some extra results recently!

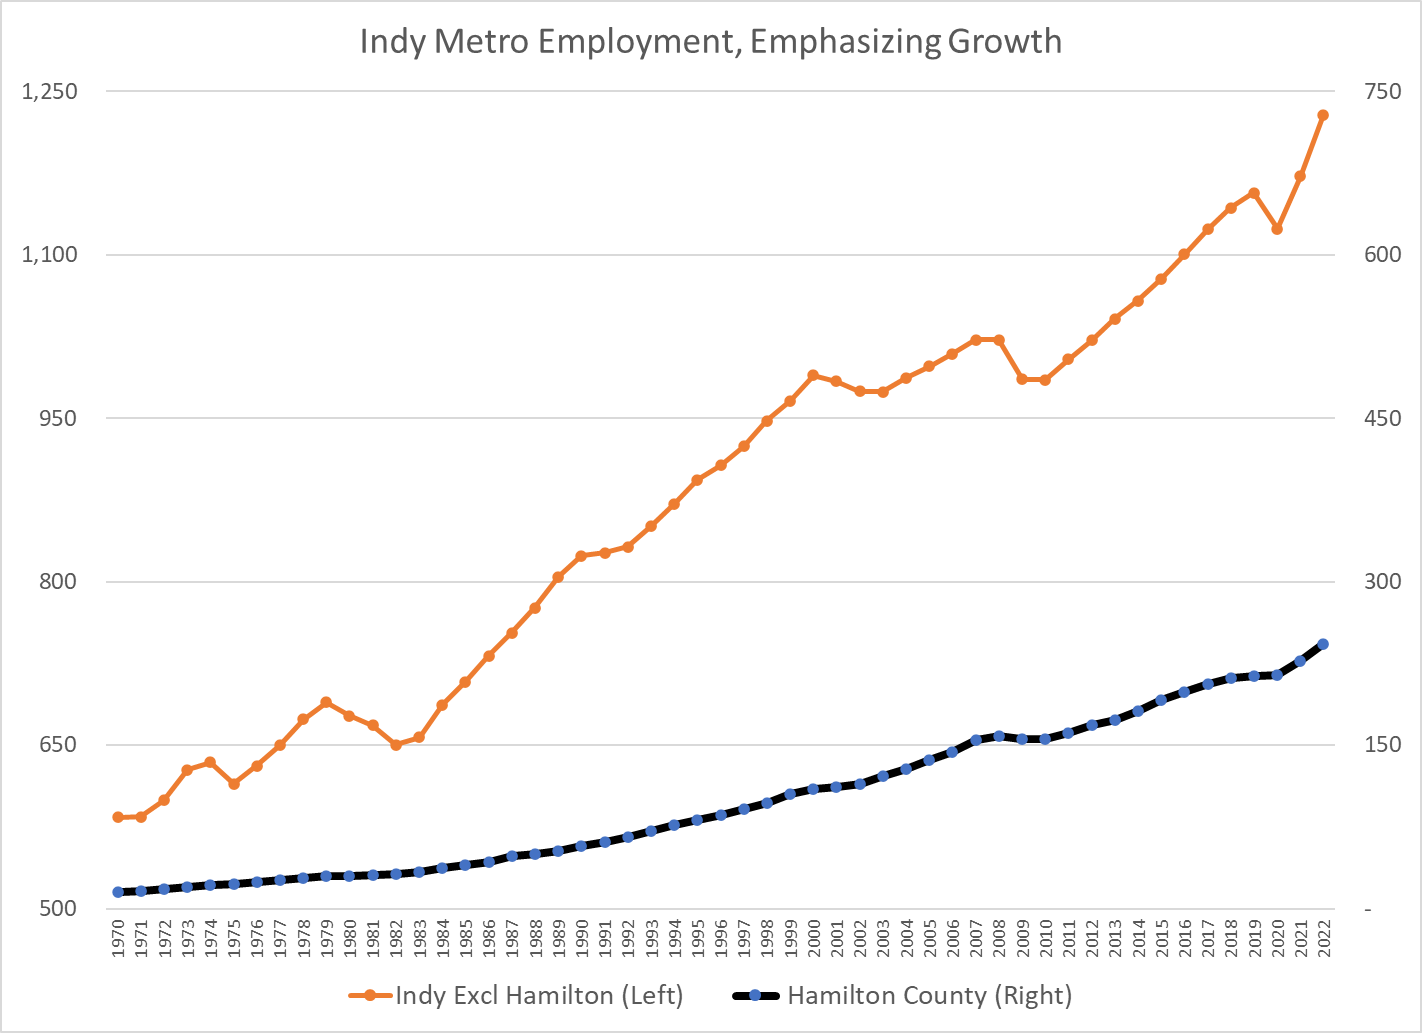
Hamilton County’s population doubled from 1970 to 1990. Metro Indy, excluding Hamilton County, grew by the same 50,000 people. In the next 30 years, Hamilton County added more than 250,000 people and the rest of metro Indy added a very solid 475,000 people (almost 2X). Hamilton County benefits from the Midwest leading growth of metro Indy.

Hamilton County employment growth has been a little faster than population growth.

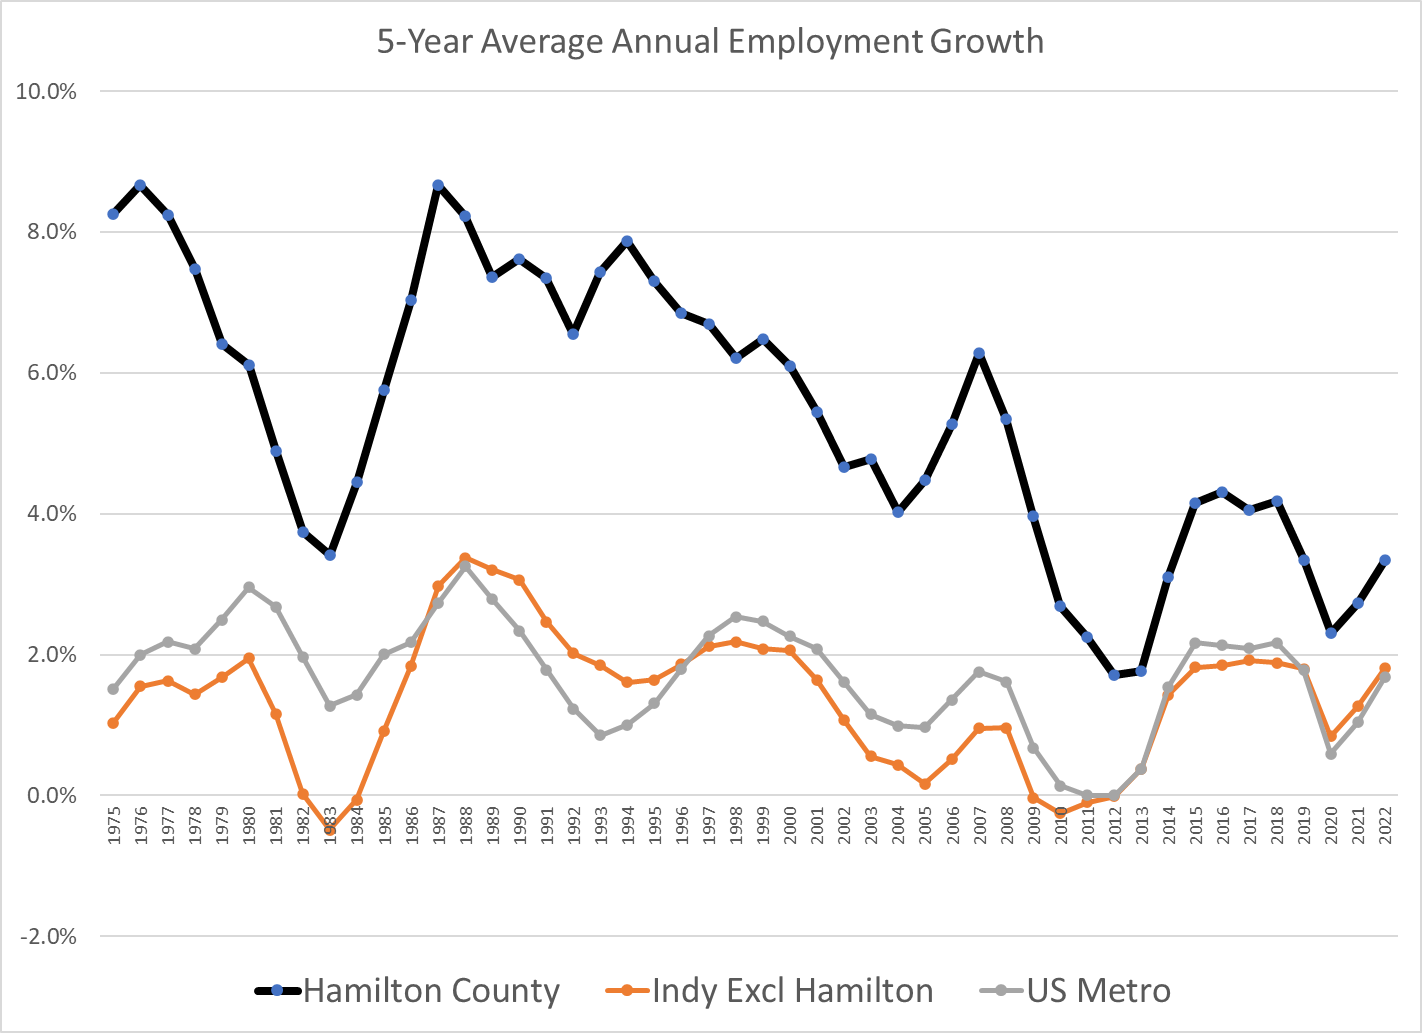
Metro US population has grown by 1% annually and employment has grown by 1.6% annually. The Indy metro area has grown at similar rates. Hamilton County has grown 3-4 times faster.

As Hamilton County has grown, its annual growth rate has declined from 7% to 4%, still far above the 1.5-2% baseline growth rate.

Hamilton County has grown from 1/3,000 US people and 1/5,000 US employees to 1/800 citizens and workers. (4-6X growth).

Metro Indianapolis has been a solid job creator. Hamilton County has grown alongside the metro area.

Hamilton County was a “bedroom suburb” in its early days but reached the national level of jobs to population by 1992 and tracked the national average thereafter.

Good News: Metro Indy is a Midwest Jobs Leader, 1990-22

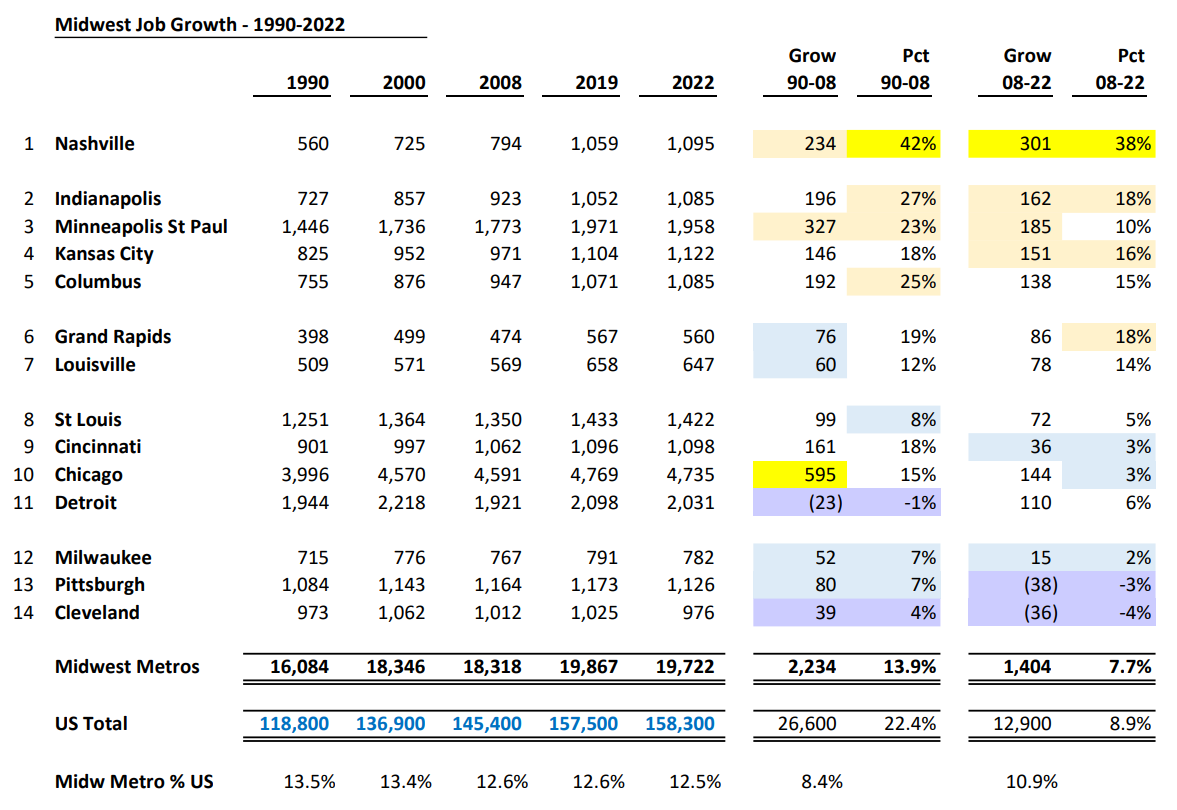
Between 1990 and 2008 US jobs grew by 22% but trailed in Midwest metro areas, increasing by only 14%. US jobs have grown by 9% since the Great Recession, with the Midwest trailing slightly at 8%. Metro Indianapolis has been a percentage growth leader in both periods, at 27% and 18%. Columbus and Kansas City show similar figures. Minneapolis has higher actual jobs added but slightly lower percentage growth on its twice as large base.

Chicago has added more total jobs, but its 18% growth is far behind Indy’s 49% and most of its growth took place back in the 1990’s. Nashville is typically grouped with the Southeastern states but if it was included in the Midwest, it would be the clear winner, nearly doubling its job base in 3 decades.

Personal Value Creation and Capture

http://awakeningcenter.blogspot.com/2017/08/one-word-plastics.html

Join a Growth Industry

This 1967 lesson in “The Graduate” remains relevant today. A rising tide lifts all boats.

Live a Great Life

Establish your priorities for life. What is negotiable or non-negotiable? How much is incremental income, wealth and financial security worth to you and your family?

Invest

The opportunity to own your own firm is greater today than ever before. Entrepreneurship is a high risk/high reward option. It requires a financial investment. Internet partners are ready to provide most support services. Licensing and franchising provide other options. Niche products and services have a global market.

Trade-offs

How many hours? Physical risks? Work the firm’s top priority every minute? Firm risks – seasonality, stability, leverage, industry risk, start-up. Serve as a representative for a group? Grey ethics, whatever it takes? Consultant, gig worker, cross-team, project member.

Profession

Degree(s), time, cost, intern, resident, trainee, junior, dues, investment, licensed, certified, valued, next best option for firms, international outsourcing, AI outsourcing.

Talent

The very best of the best. Creative, sports, intellectual, selling, persuading, appearance, arts, counselling, investing. Ability to leverage business wins. Ability to monetize output broadly.

Managing

Managing the conflicts between people and tasks. Great managers are well compensated for buffering between these contrasting forces. Adequate managers “get by” or are demoted in competitive industries.

Analysis

STEM skills applied are highly valued today. Specialized “analyst” skills. Technocracy. Problem-solving in unstructured situations. Choosing the right tool to structure the situation so that a decision is clear. Analysis applied to large value deals, decisions, contracts and acquisitions. Strategic choices, competitive advantage, sustainable moats, value extraction.

Sales

Customers have choices. They value quality, speed, flexibility, features, price, ease of doing business, risk reduction and personal relationships (QSFVIP). Great salespeople are well compensated for connecting a firm’s value proposition to customers in a sticky fashion. They play the game in 3 dimensions: firm, customer and salesperson. Commissioned sales and agent models. New business acquisition.

Influence/Politics

Communications skills. Relationship skills. Influence skills. Negotiating skills. Political relationships applied – internally and externally.

“Rent” from Specific Skills, Knowledge, or Relations

Industry, firm, profession, language, international, expert, technical, customer, regulator, supplier, or consultant knowledge, understanding, influence. A combination of skills required for a role. Holding a position in the firm.

Responsibility

Raise your hand. Manager. Project manager. Project member. Value added leader for new products, customer markets, structures and processes. Line manager in a measurable success role. Resource manager for broadly defined suppliers, customers or staff resources. Second level or higher management role responsible for results largely beyond your control.

Leadership

A mythical beast. Charisma. IQ. Confidence. Elite education and experience. Progressive successful role. General management ability to lead multiple functions, teams, divisions, geographies, product lines without being an expert. Social status and ease.

Summary

We live in a complex world of many firms, products and services competing for the attention of consumers. Firms employ people to make sales and profits. Firms employ people who they believe provide them with the greatest “marginal product of labor”, the greatest value added. Firms pay as little as they can. Their interest is to employ labor for less than their marginal value added and capture the difference. Set your moral limits. Work on your own. Determine the best path to be a value-added resource. Pick an industry. Pick a profession. Exploit your own extreme talents, sales, influence, specific knowledge, analysis, responsibility or general management abilities. No one has ALL of these skills. You have some talents. Leverage your talents.
I started writing this article thinking about the ratio of incomes of large firm CEOs to shop floor/outsourced workers. It has risen from 20X to 300X to 2,000X through time. Beginning with “essential workers” as the baseline, somewhere between the effective $10/hour minimum wage, and the $20/hour median income, others earn incomes in the US many times above the median. What incremental value do they provide to their firms or to society? in “order of magnitude” terms, I think that hours and flexibility are worth 50%. Professional, management, analysis, sales, influence and specific knowledge add 100% each, or 250% in combination. “Higher level” responsibility and leadership skills add another 200-300% of added value, reaching a combined 500-600% premium above median incomes (IMHO).

Historian Will Durant emphasized the need for all civilizations to incentivize their most talented individuals to engage in the work that coheres and advances their lives. First, political unity, commitment and loyalty. Second, material progress. Our society must be attractive and deeply engage the top 20%, 10%, 5%, and 1%. Does this require a 5X income advantage? 20X? 200X? 2,000X?

We currently live in a “winner takes all” society that is comfortable with 1,000X discrepancies between the winners and the workers. Is this required to incentivize the “best and the brightest” to work hard to provide incremental value for society? I think not. This is a political choice we have accepted since Reagan. Our society is incredibly productive because it is comprised of productive and highly educated individuals. The political choice of how much the most successful people retain is a separate issue.
Our Hamilton County: Low Unemployment

https://www.misoenergy.org/about/

One of the “control centers” at MISO Energy in Hamilton County.

Hamilton County’s unemployment rate has averaged 3.1% since 1990, a little more than one-half of the nation’s 5.8% average. The Indy metro area has averaged 4.6%. In the last decade, Hamilton County has still averaged 2.0% lower than the national average of 5.3%.

https://fred.stlouisfed.org/series/UNRATE#0

https://fred.stlouisfed.org/series/INHAMI5URN#0

https://fred.stlouisfed.org/series/INDI918URN

Statistical Illiteracy and Logical Fallacy

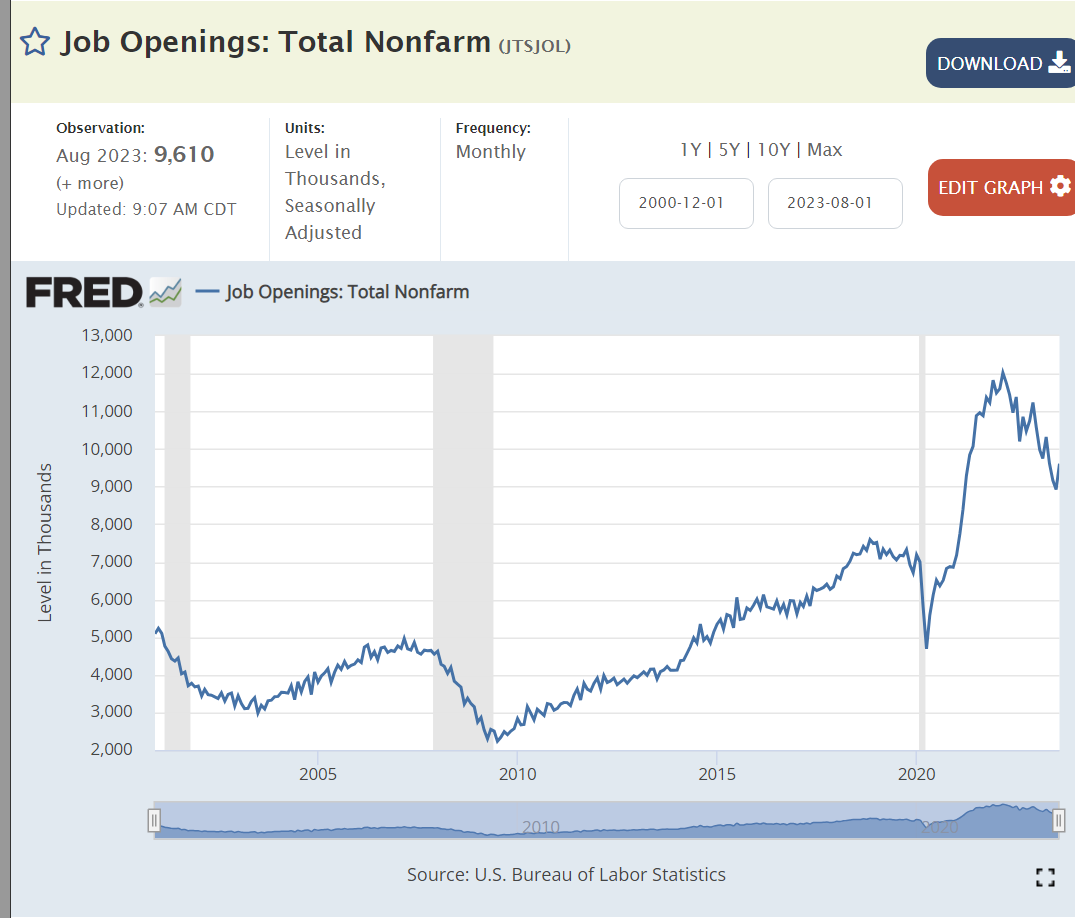
The stock market overreacted today. Job openings increased by 700,000 between July and August. Oh no! The labor market is too strong! Wages will increase! Cost-push inflation will build. The Fed will increase interest rates. We’ll be in recession soon! Boo!

Job openings are clearly falling. From an all-time high of 11.5 million to about 9.5 million in 18 months. With another 18 months of a “cooling” labor market, there will still be an historically high 8 million open positions in February, 2025. The labor market is slowly returning to “normal” after the Pandemic disruption.

This is a solid labor market, not an overheated labor market. Real wages finally grew during 2016-2020, by 7%. They spiked during the pandemic but have been flat for the last 18 months.

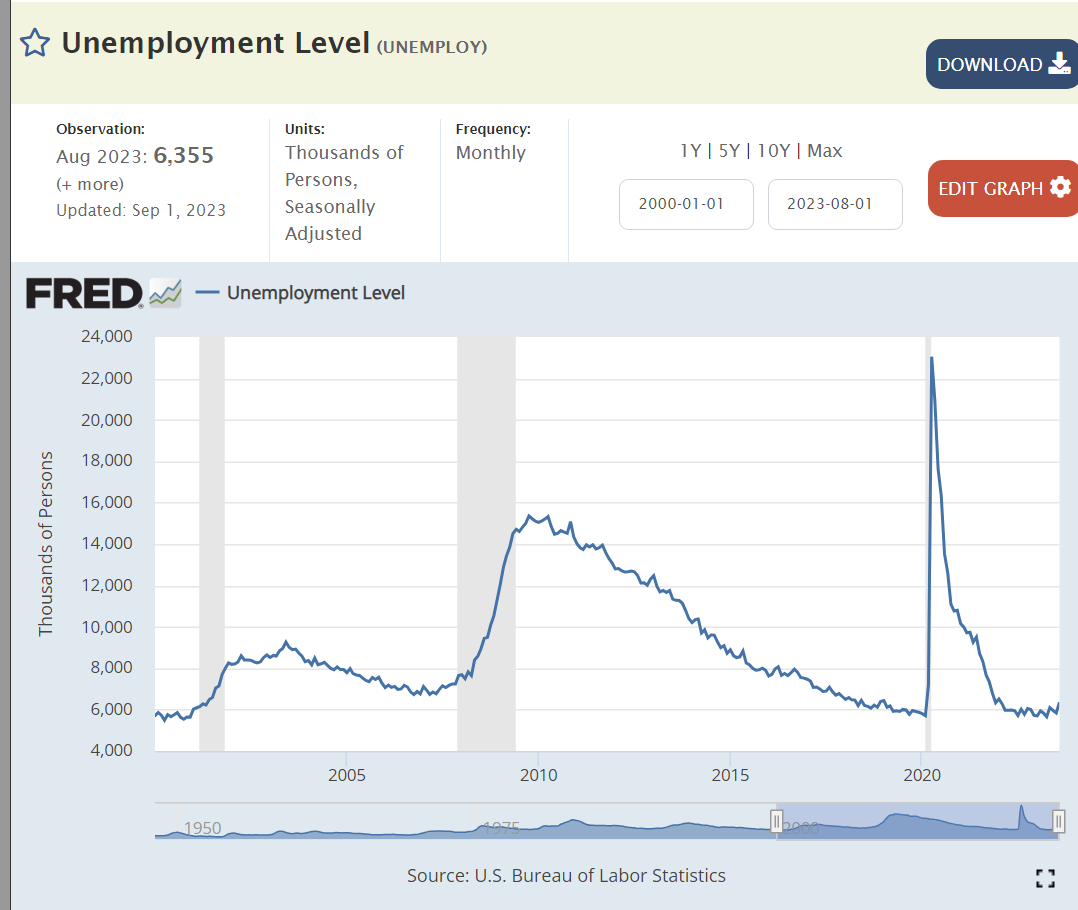
The number of unemployed people remains at 6 million, low by history, but not declining to unsustainable levels. 6 million is better than 8 or 15 or 23 million.

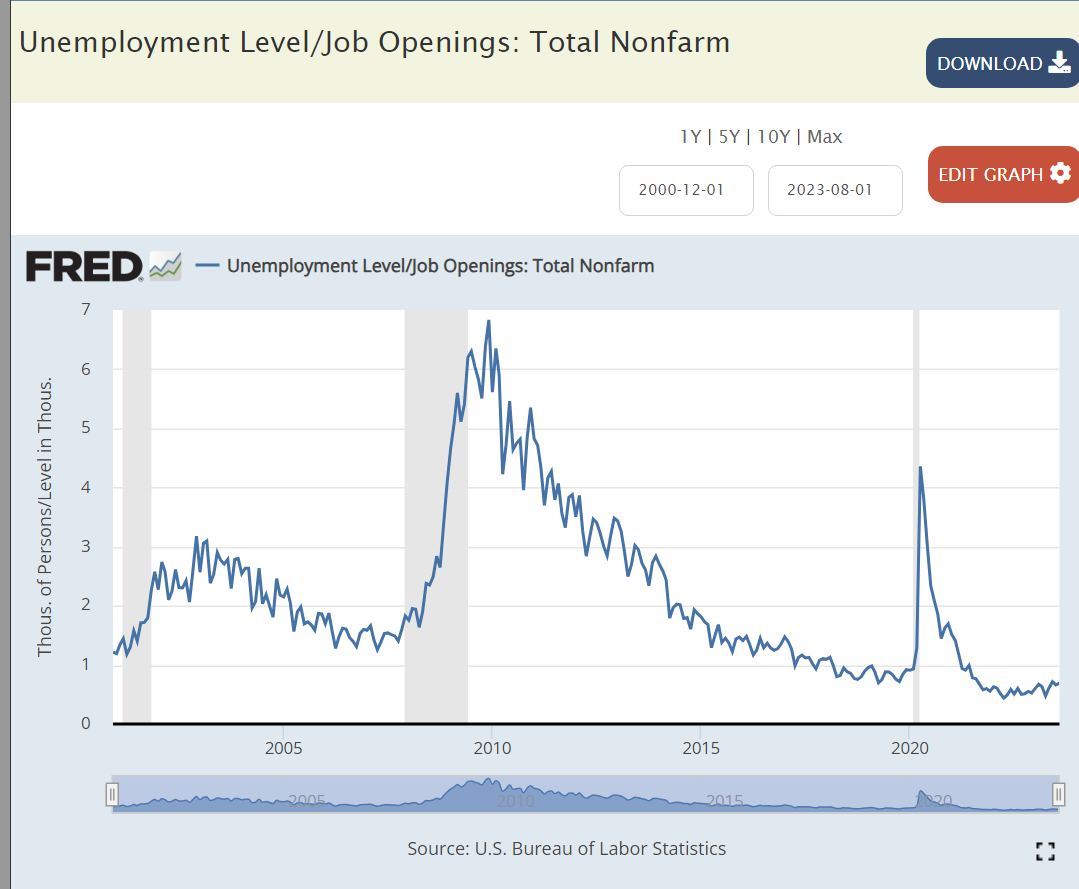
It’s a great time to be a job seeker, 3 jobs for every 2 job seekers. This is an historically positive ratio. It has been maintained for 2 years.

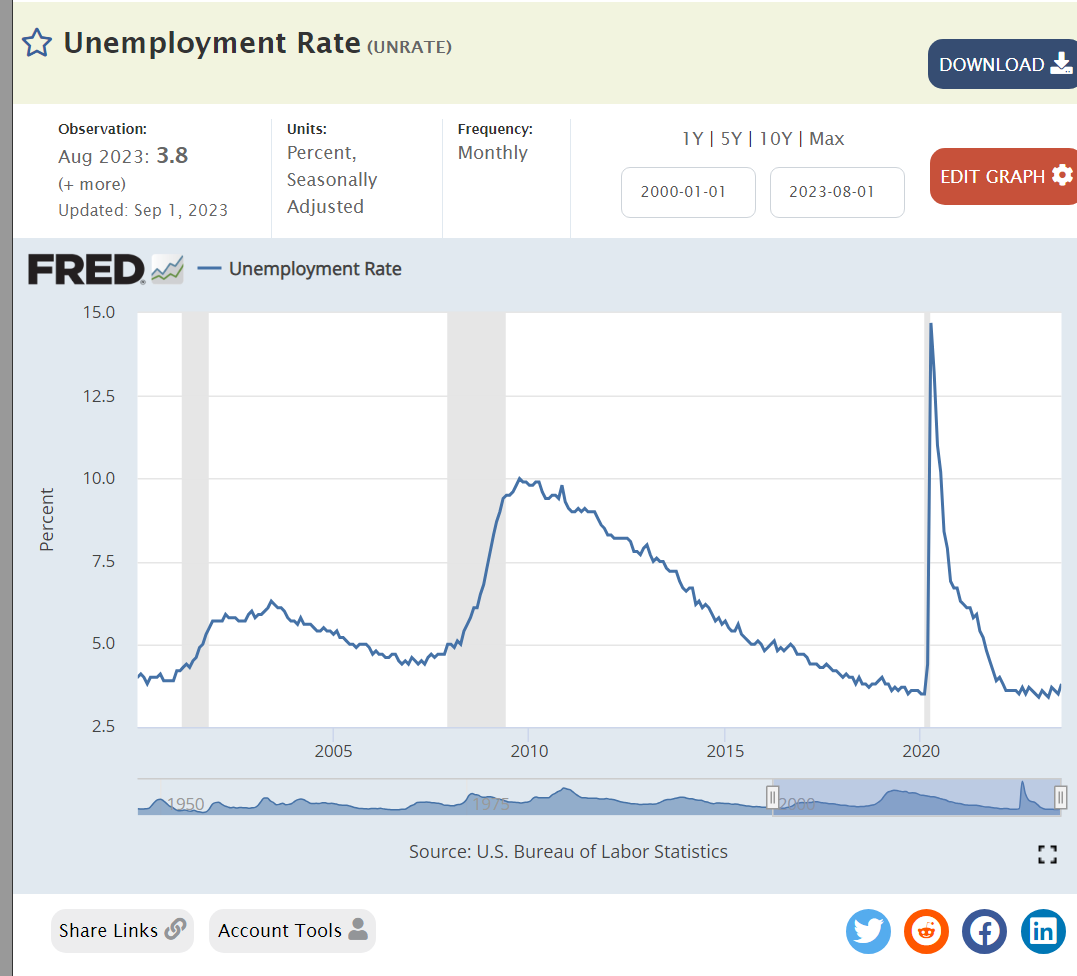
The unemployment rate remains at an historical low of 3.5% but is not falling.

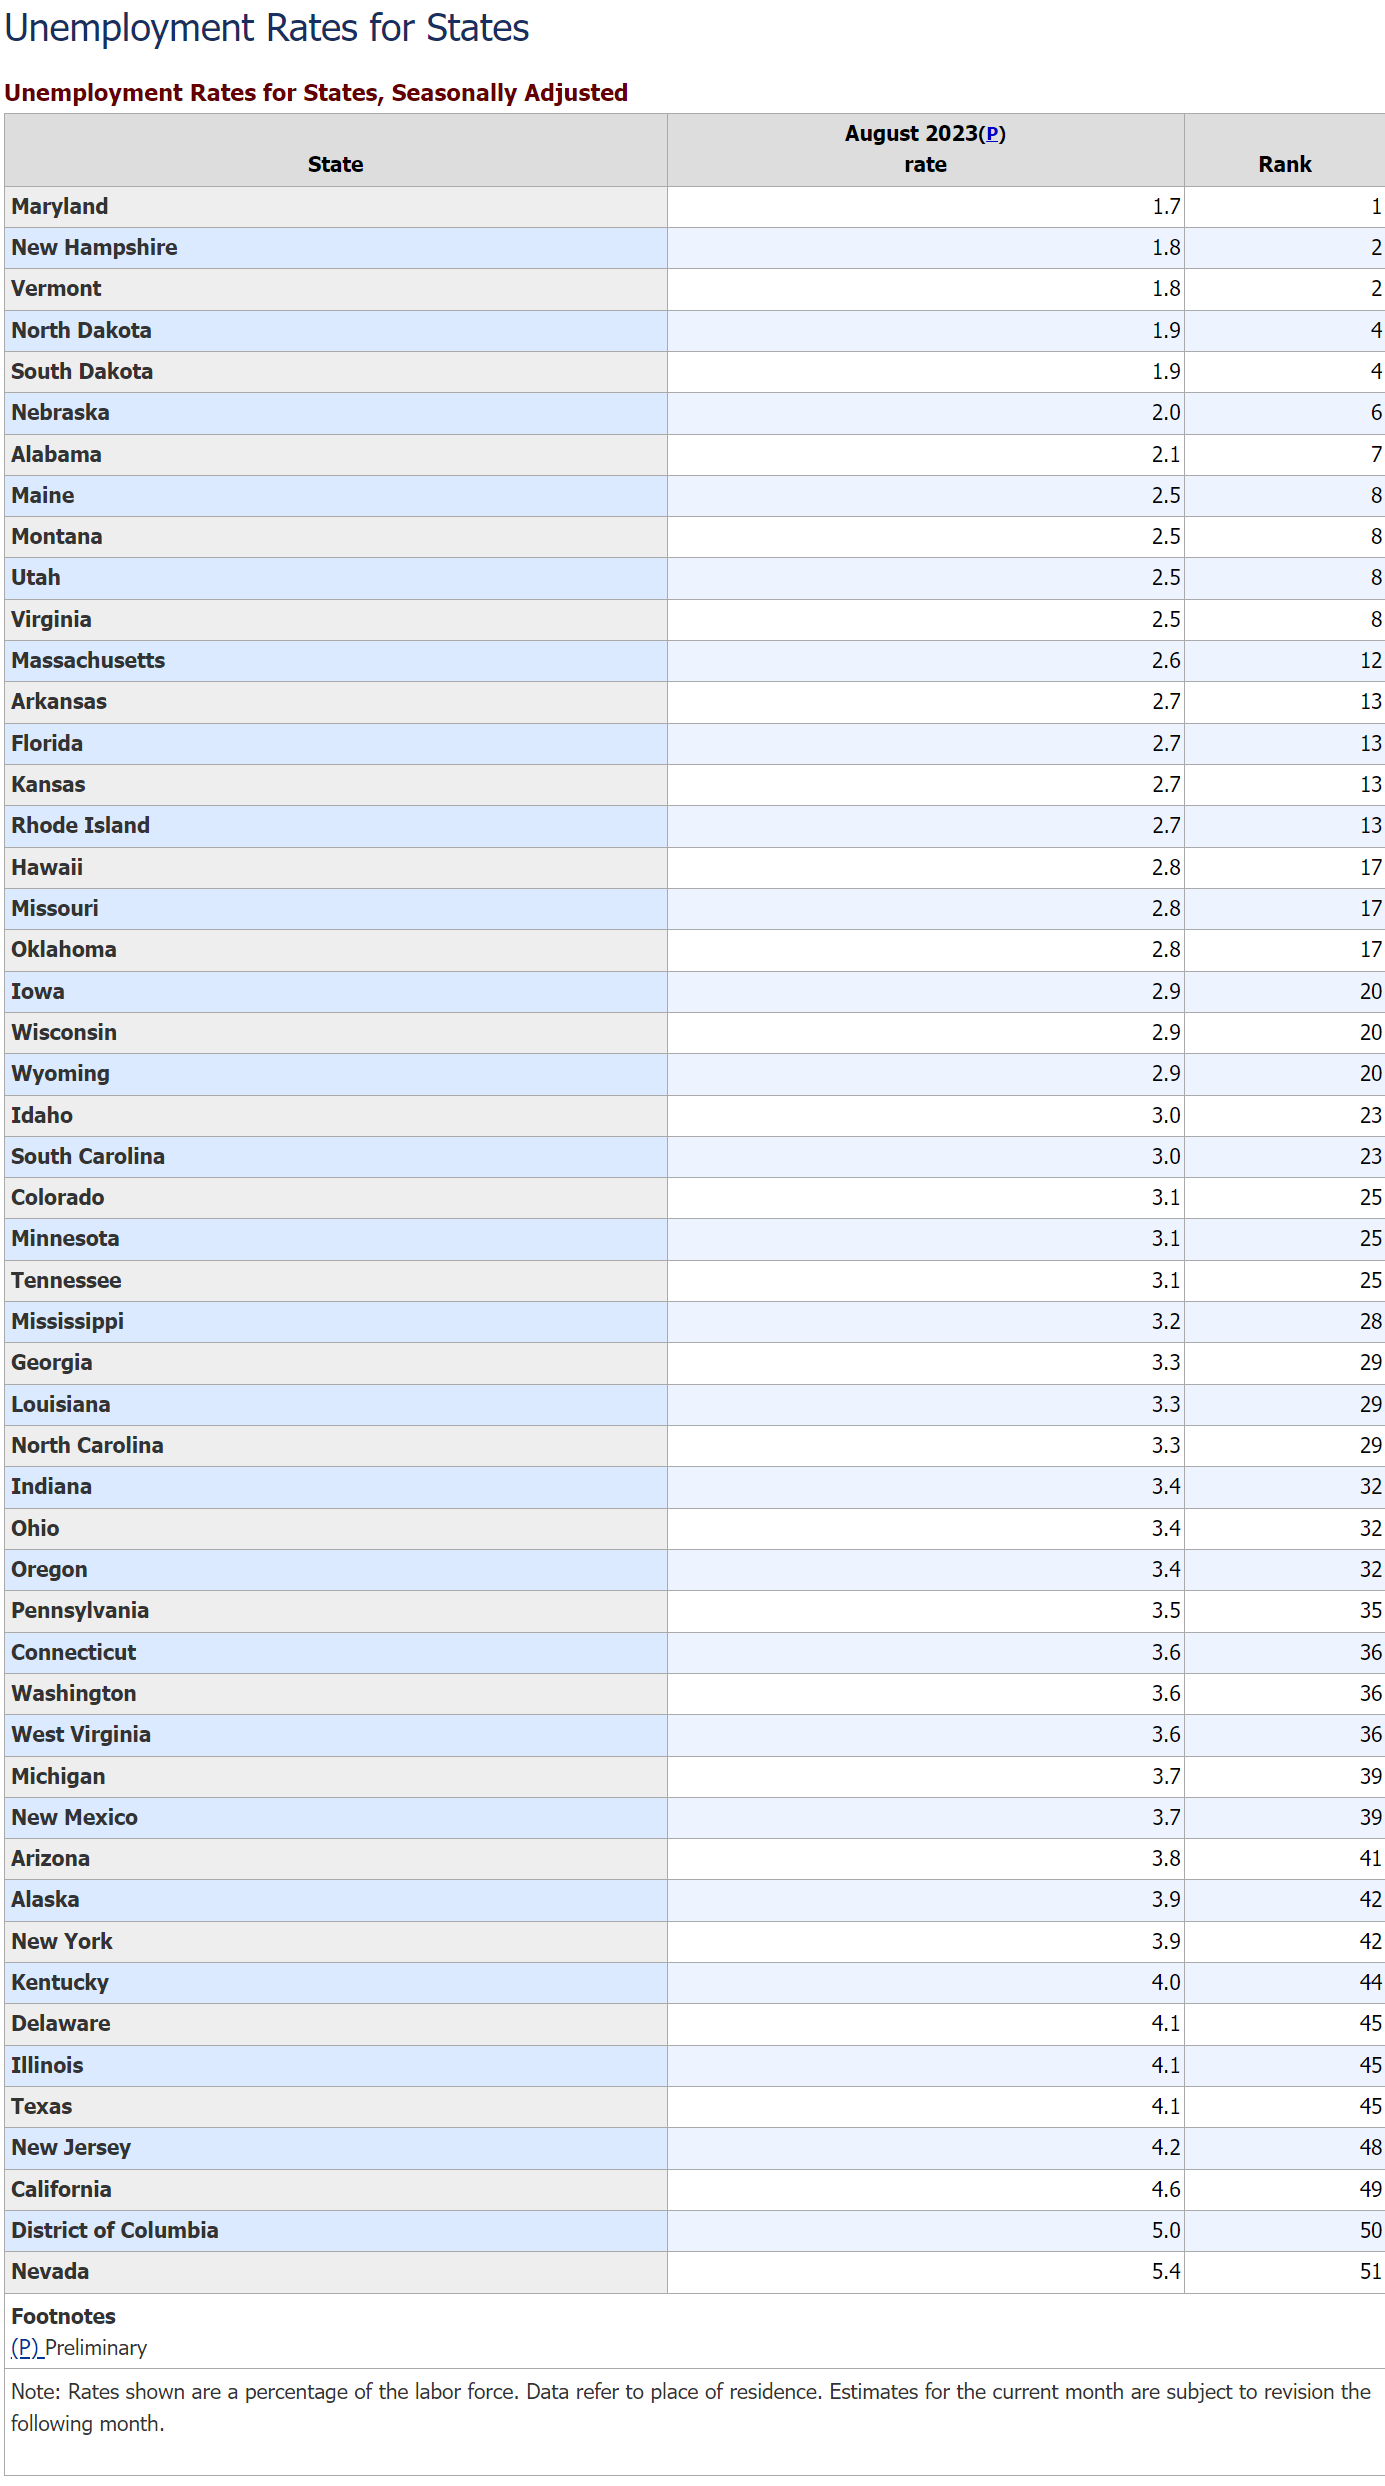
Low unemployment is a widespread phenomenon. 22 states are below 3%. Only California, Nevada and DC are above 4.1%.

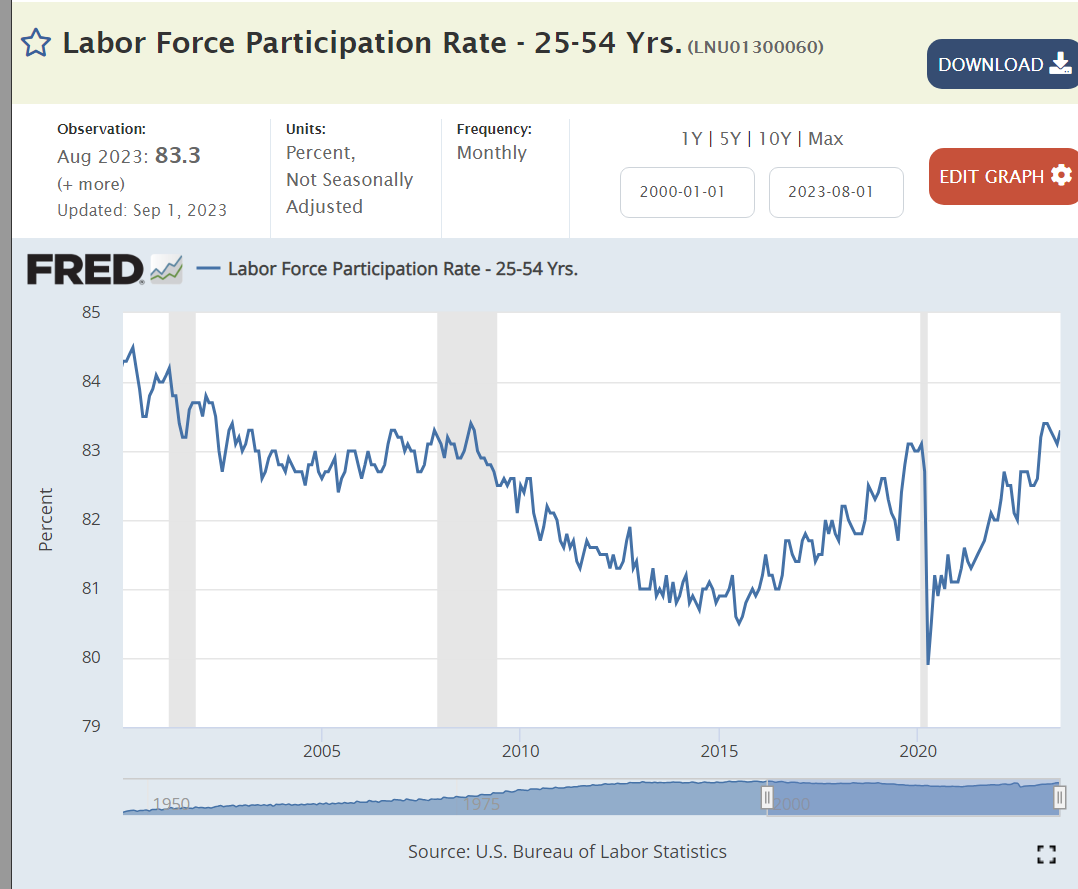
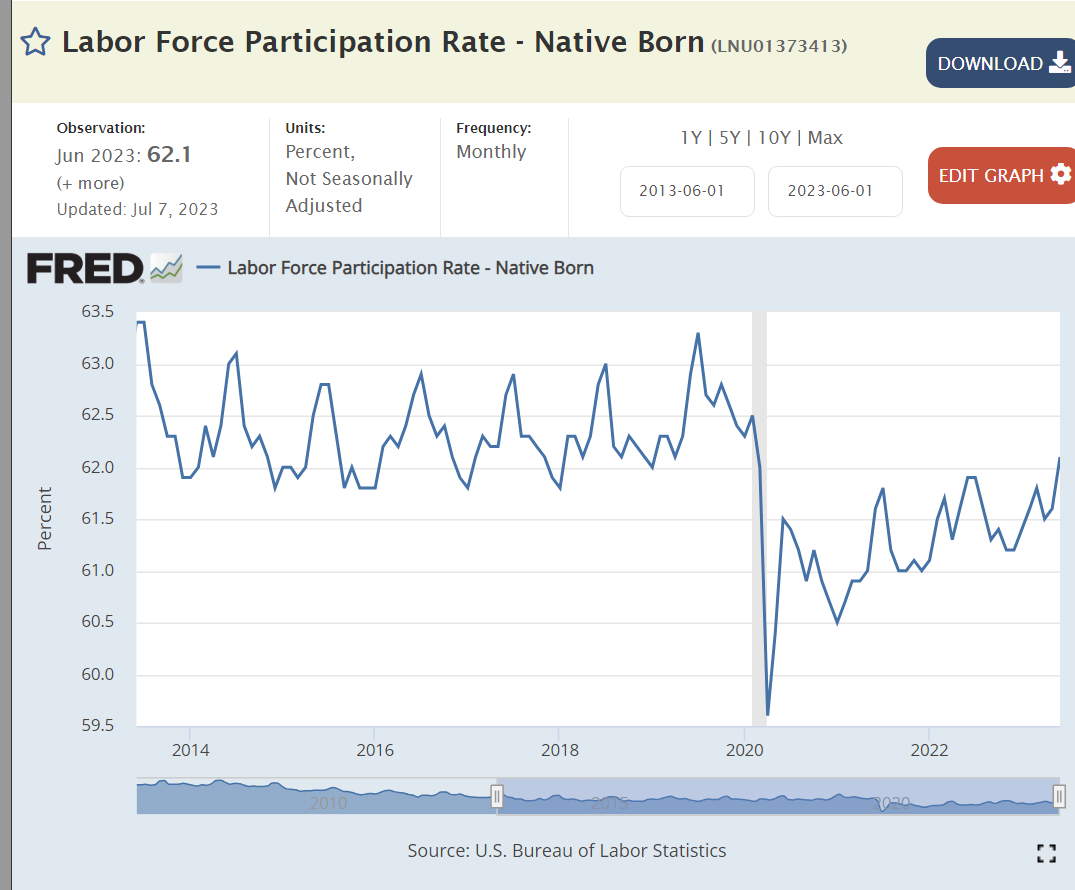
The labor force participation rate is at a 15 year high, with positive hiring and wage conditions attracting greater participation.

The quit rate remains above the pre-pandemic high, indicating that employees still see a positive labor market, but not an exploding market.

Total employment was flat for the first 11 years of the new millennium, parked at 132 million. Job growth accelerated for the next 8- and one-half years, adding a very solid 20 million new jobs. Post-pandemic, the economy has added another 4 million jobs.

Summary

This remains a Goldilocks labor market, neither too weak nor too strong. The Millennium pause, Great Recession and Pandemic have made us gun-shy. We don’t want to claim victory for fear of disturbing the labor market gods. But we are enjoying victory. 156 million employed versus 132 million employed a dozen years ago. An 18% increase.

Mostly Good News Since the 2008 Great Recession

https://content.time.com/time/specials/2007/article/0,28804,1733748_1733756_1735278,00.html

Real, after inflation, Gross Domestic Product is up by one-third, despite the pandemic. That’s 2% annually, despite the Great Recession and the pandemic. The US economy is very solid.

A 21% increase in per capita income during this time. Quite solid and constant growth.

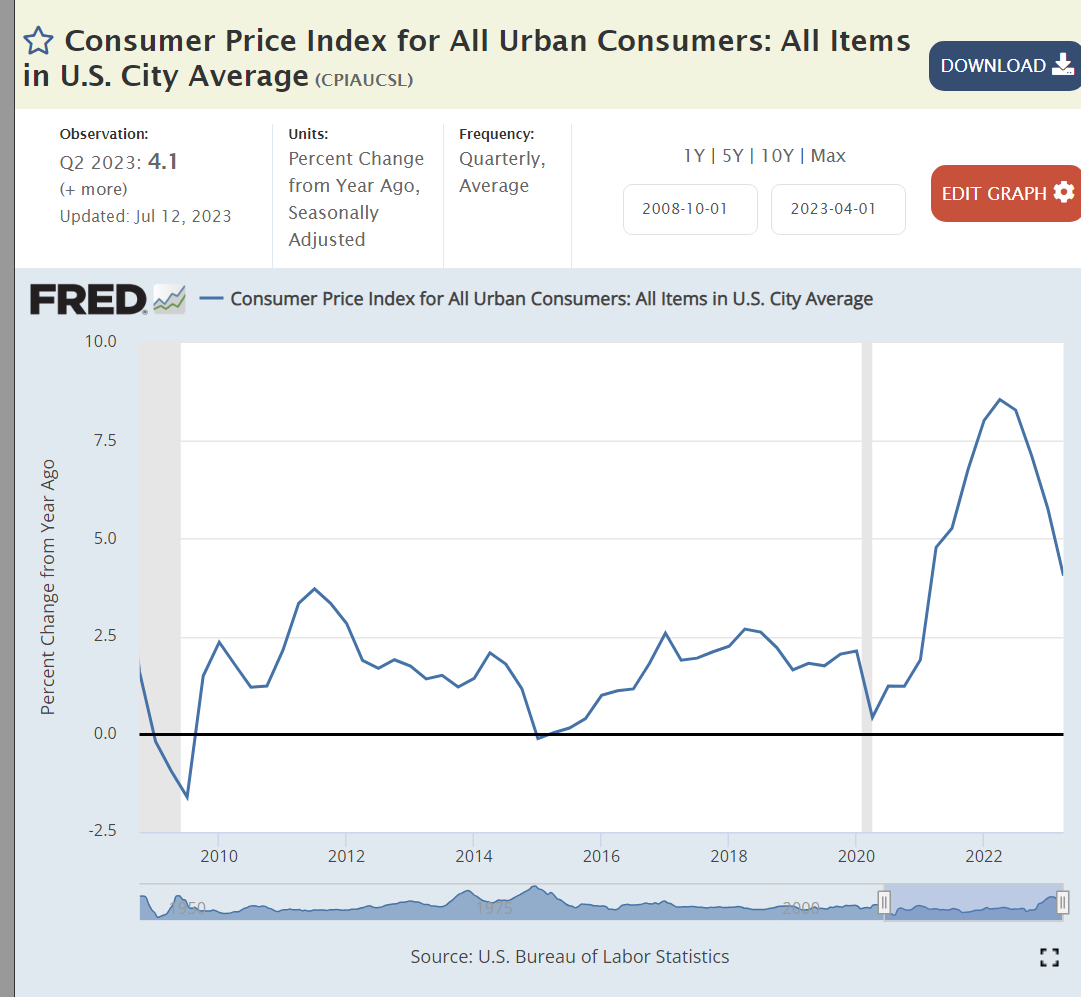
Inflation averaged a bit less than 2% before the pandemic, spiked to 8%, and has since declined to 4%. Experts disagree on whether it will return to 2% soon.

Gas prices are the most obvious component of inflation. They are largely driven by global supply and demand. Prices today are the same as in 2011-14, despite the general inflation increase of more than 20% since then.

Despite the pandemic, US unemployment is at a 50 year low!

Job seekers today encounter 3 times as many job openings.

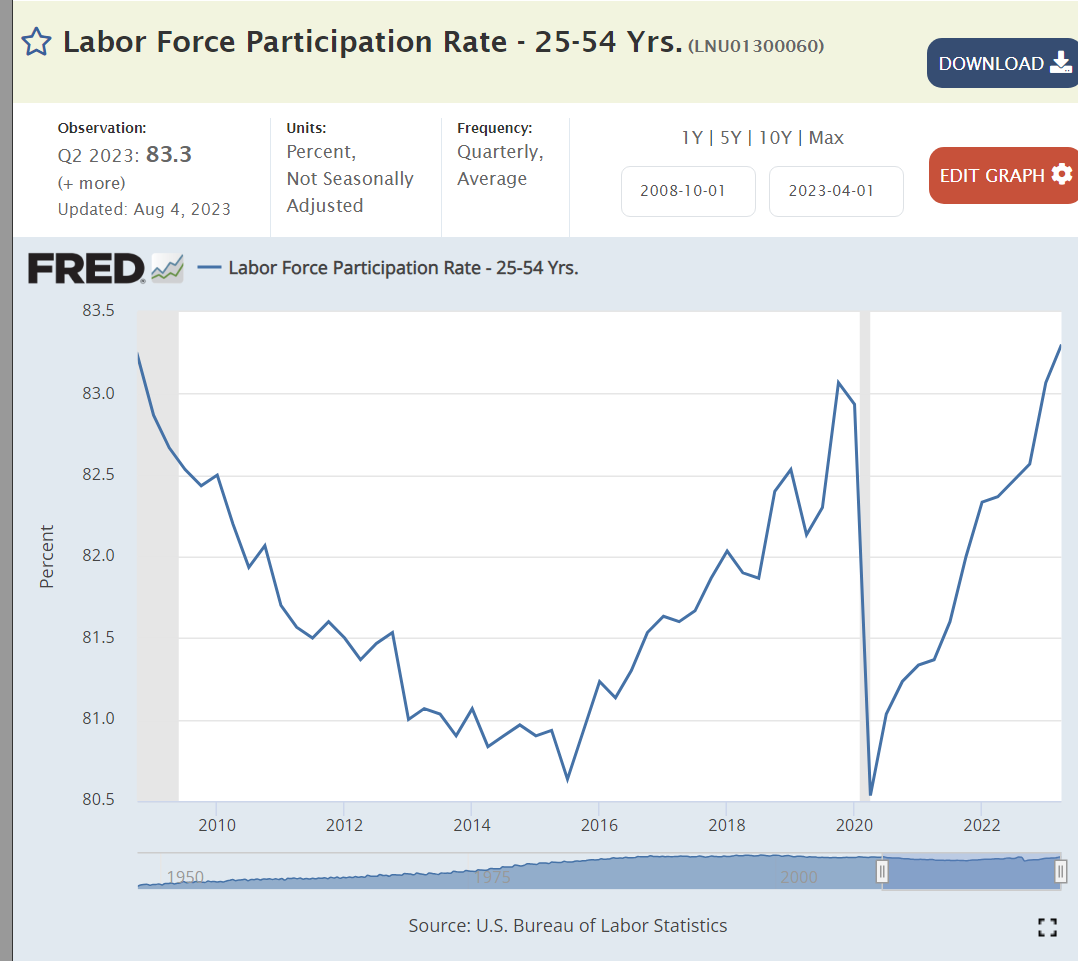
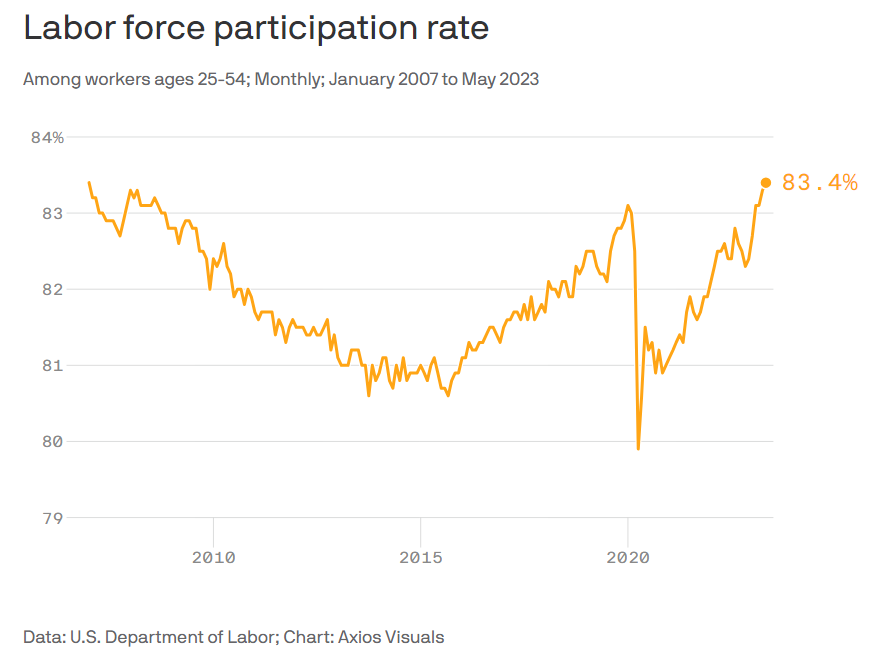
Core age labor force participation has snapped back after the pandemic.

Investment values have doubled.

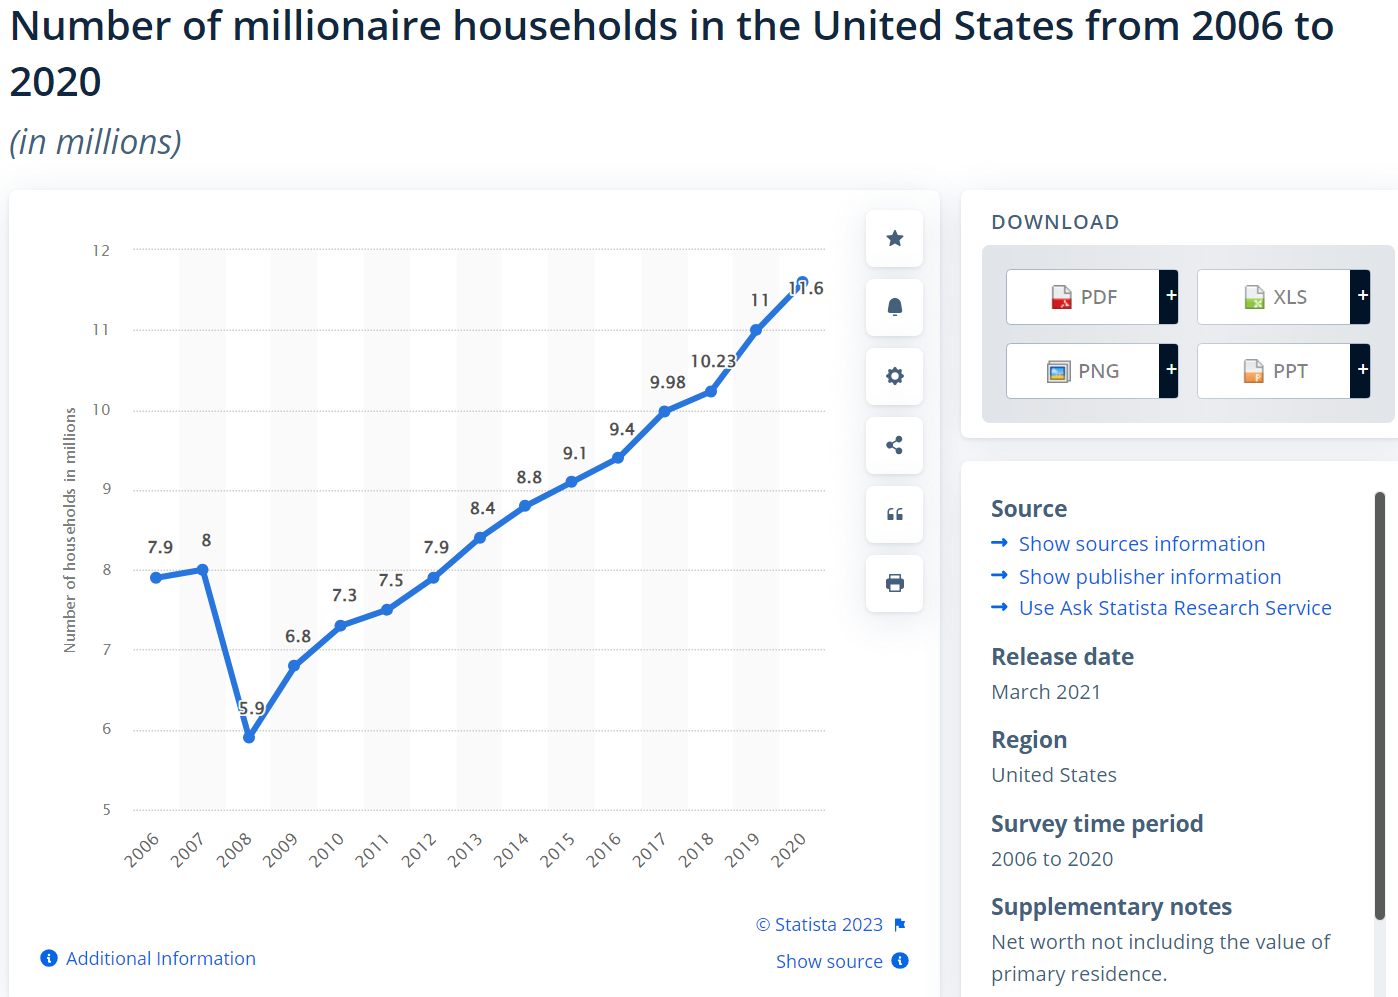
The number of millionaires and billionaires in the US has continued to increase.

Personal savings rates rose from 6% to 9% before the pandemic, shot up and fell back down to just 4% recently.

Housing values have doubled since the Great Recession.

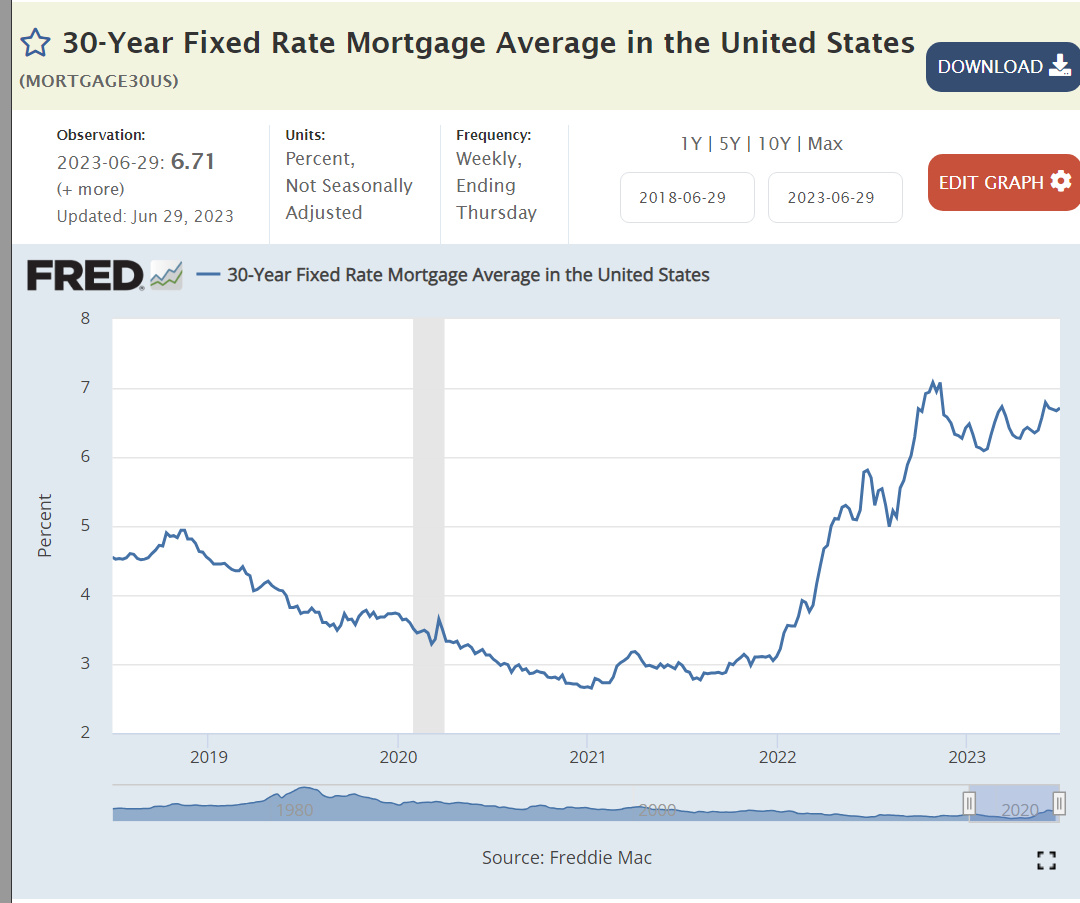
Mortgage rates averaged 4% after the Great Recession, dropped to 3% and then increased to 6%+ as the Federal Reserve raised interest rates.

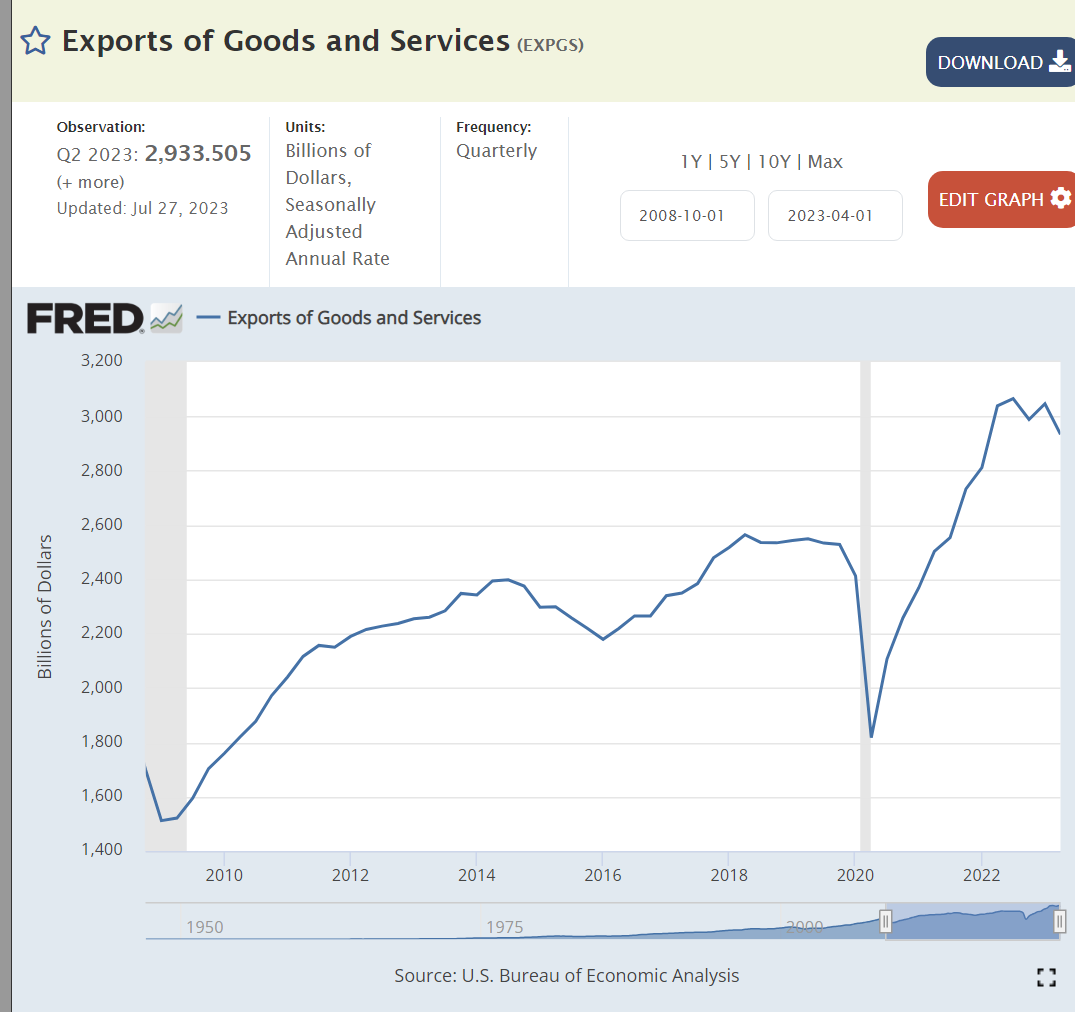
US exports have nearly doubled in 14 years.

Despite the Trump tariffs, which Biden has maintained, imports have also nearly doubled.

Despite historically slower growth rates, higher budget deficits and looser monetary policies, the US dollar is more highly valued today than in 2008.

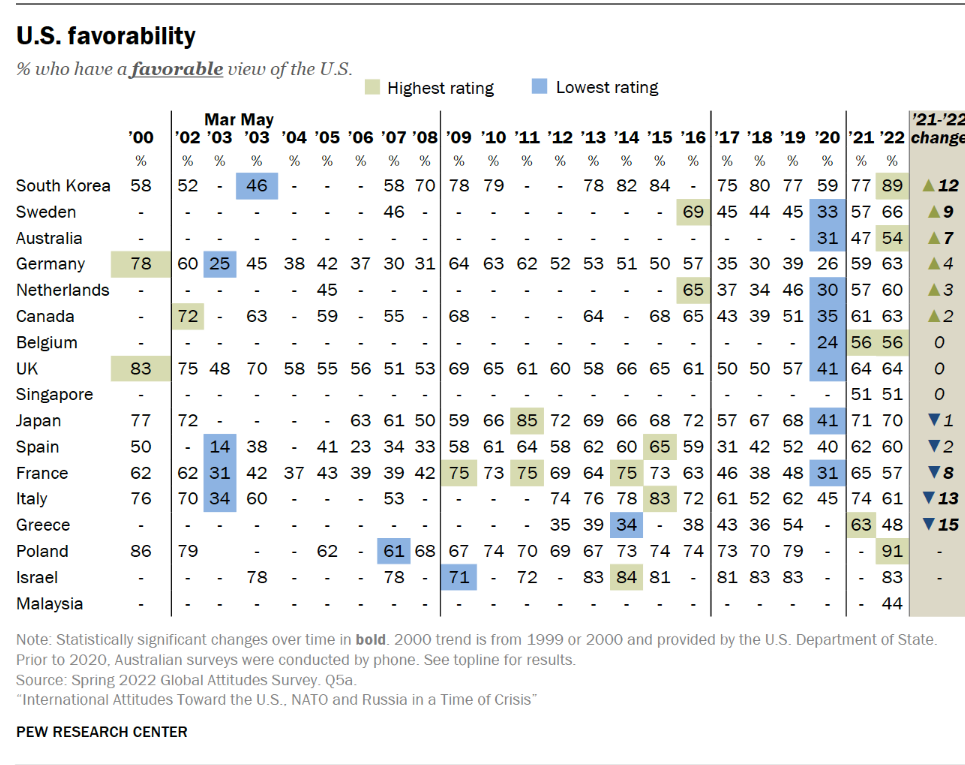
Foreign countries still see the US as a positive ally, despite their concerns during the Trump era.

Obama returned the budget deficit to a “reasonable” 3% by 2016. Trump expanded it to 5% and then 15% as the pandemic struck. Biden drove some recovery to 5% by 2022, but has not driven further reductions.

US coal production is in a long-term decline.

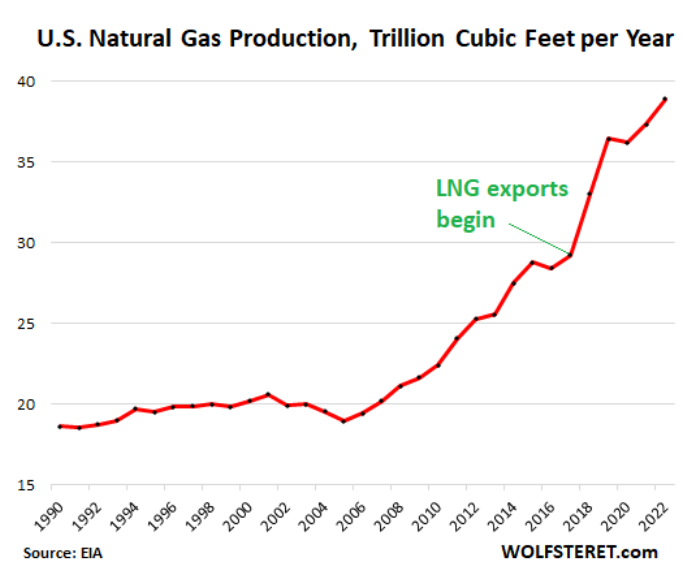
Natural gas production has nearly doubled in 14 years.

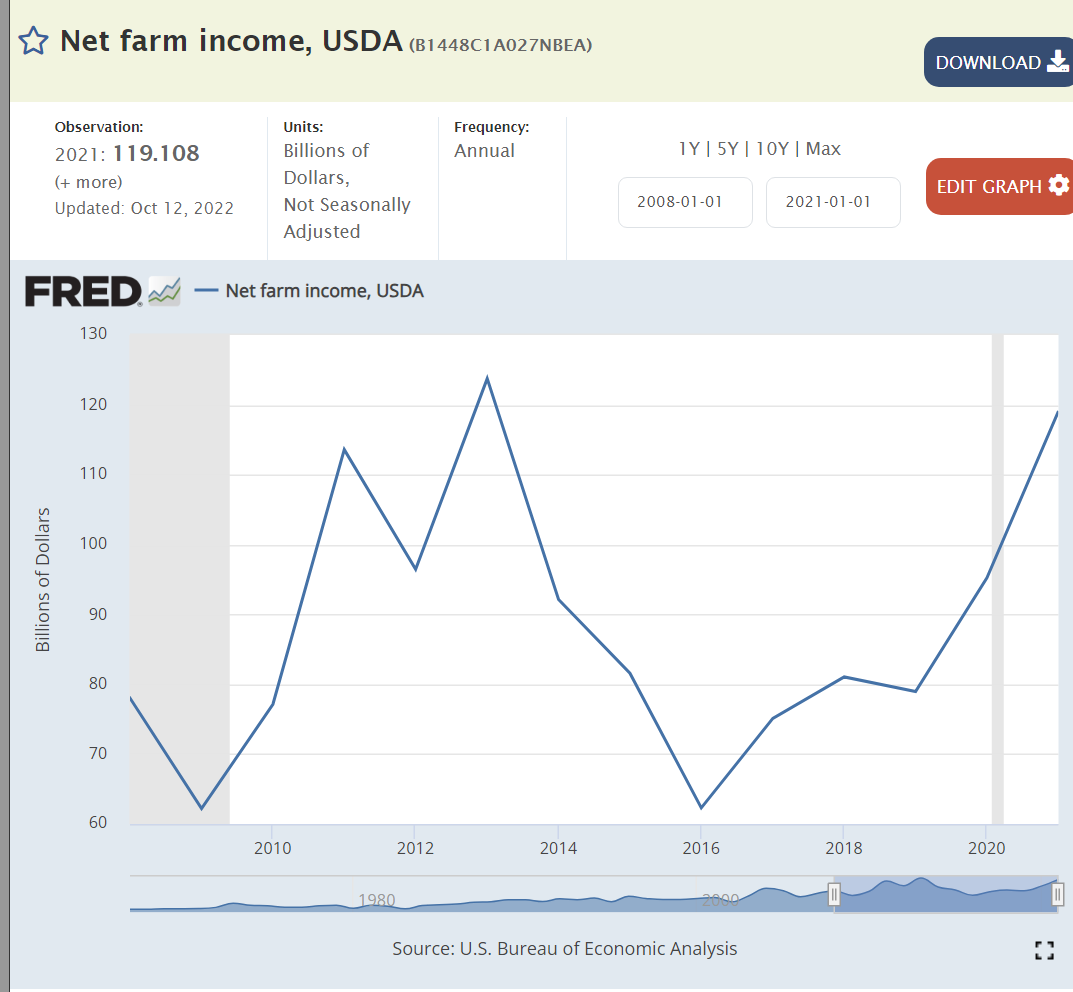
Net farm income has been significantly above the base for 6 of the last 14 years, despite lavish Trump farm subsidies.

Manufacturing employment has continued to rise slowly in the last 14 years against the headwinds of international competition.

It’s difficult to put the pandemic in perspective, but here we see a 2-year reduction in expected lifespans. Opioid deaths and so-called “deaths of despair”, alcohol, drugs, suicide, also play a role.

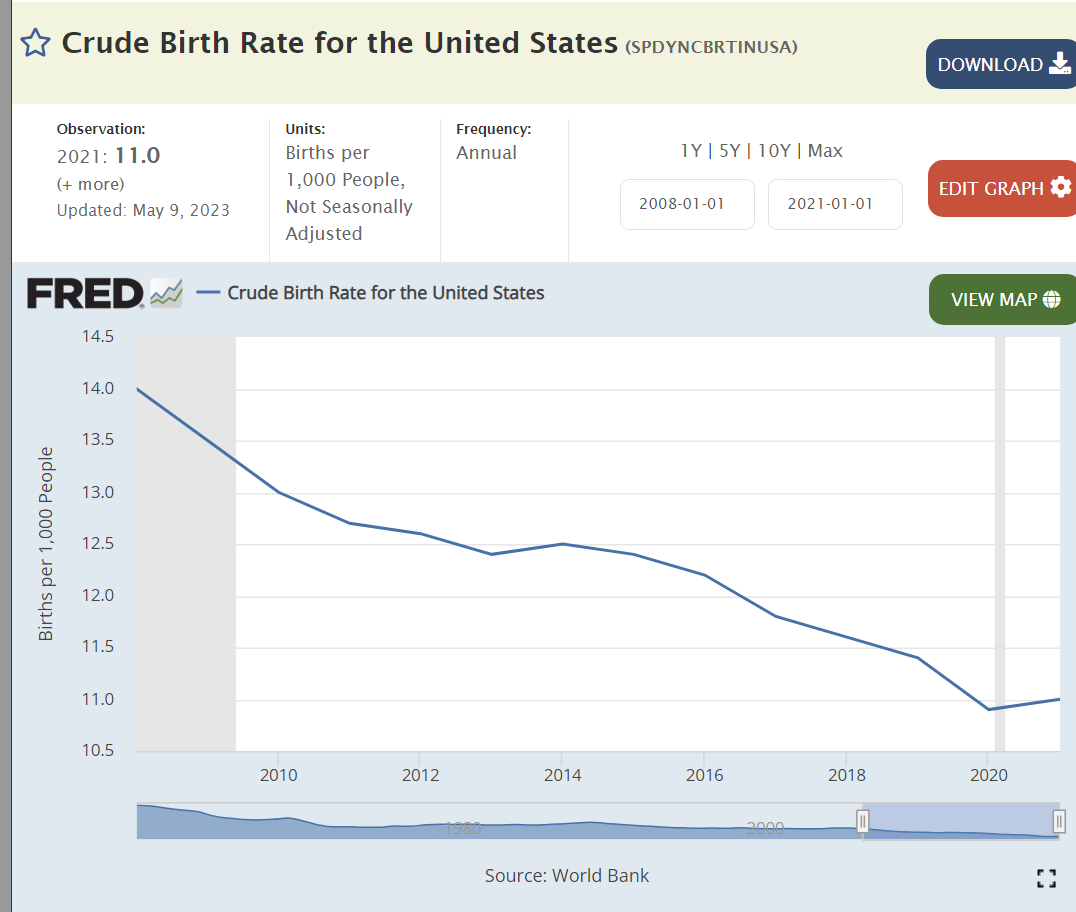
Birth rates continue to drift lower as seen in all regions of the world.

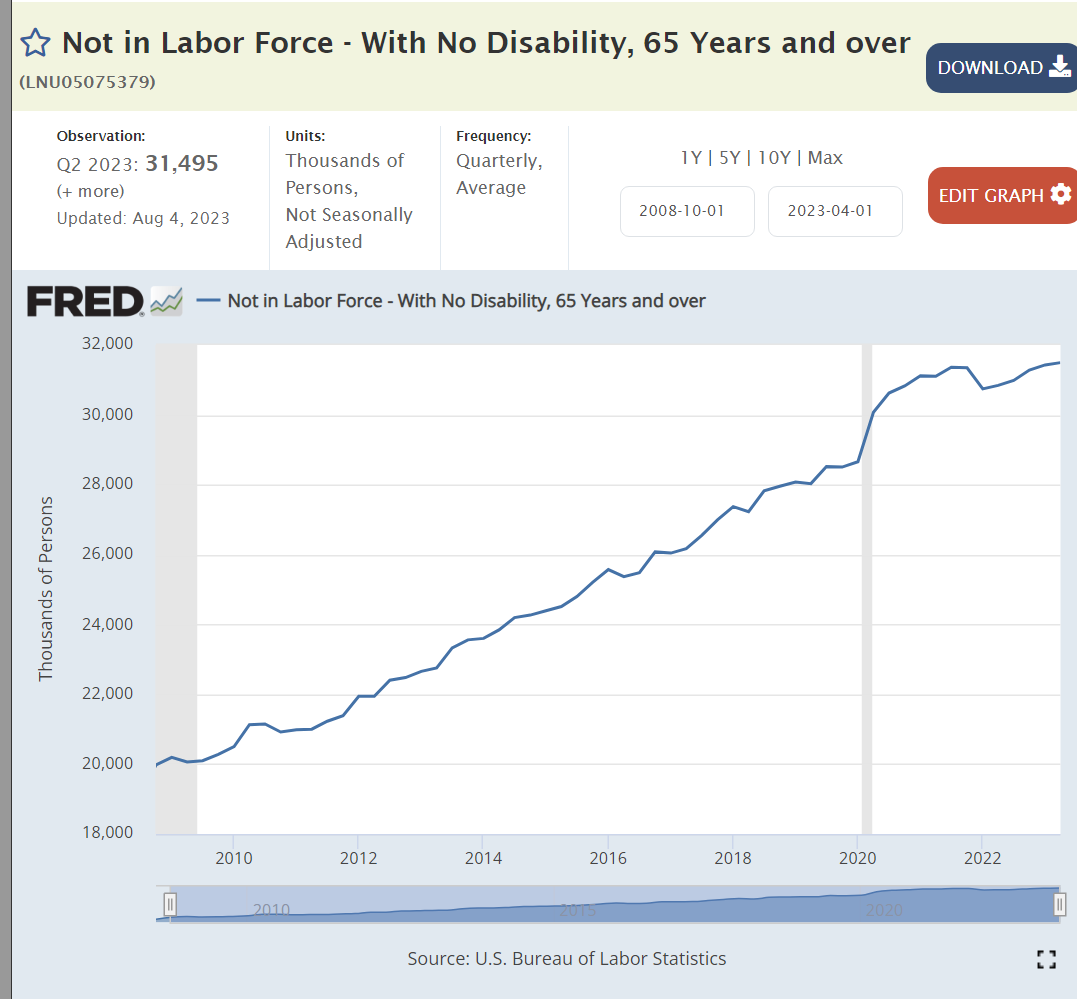
The number of retirees has increased by more than 50%.

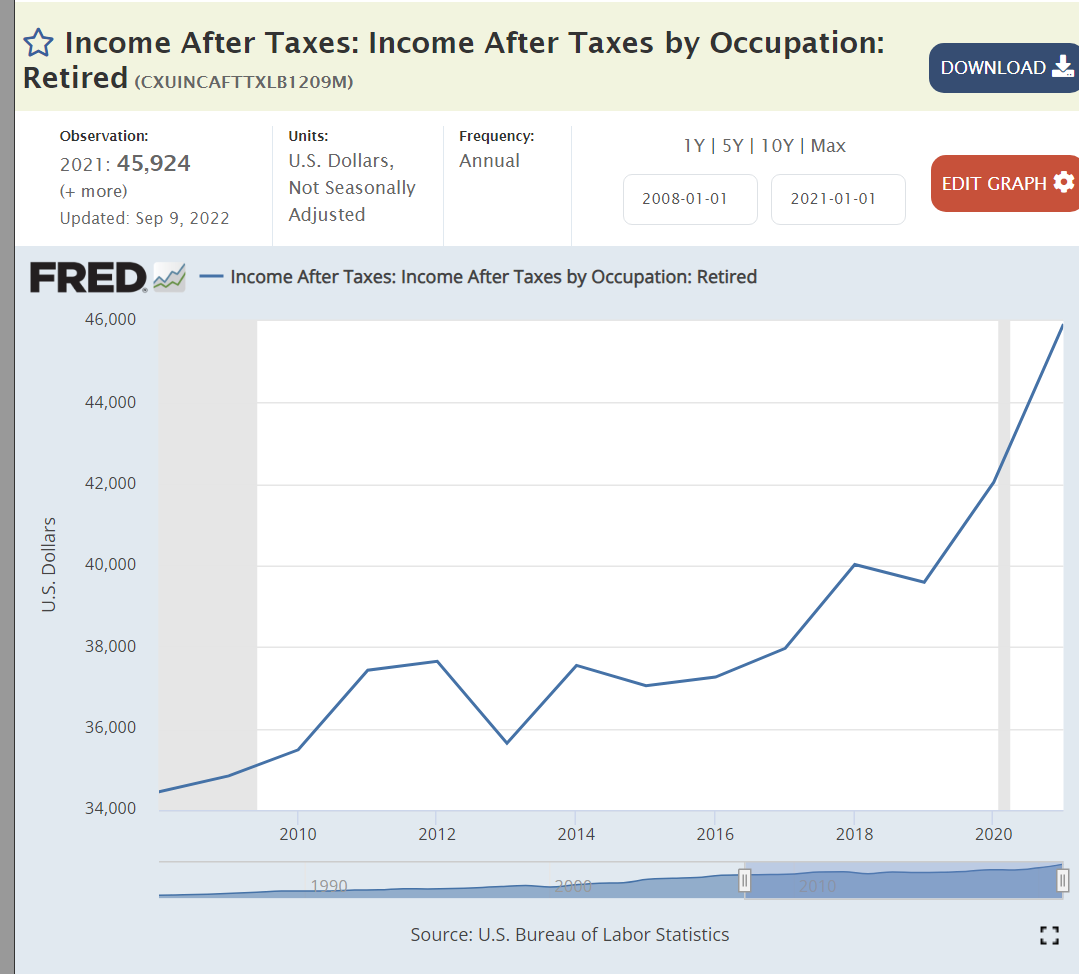
Retiree incomes are up by one-third, matching inflation.

Prospective retirees have doubled their cumulative savings.

The abortion rate has continued to fall in the last 30 years.

Church attendance has dropped from 40% to 30%.

Summary

The US economy recovered slowly after the Great Recession and then very quickly after the pandemic. Real, after inflation, output and per capita output increased. The labor market became very tight. Asset prices (investments and housing) rose for intrinsic and monetary reasons. The US remained a competitive international producer. The federal budget deficit was better at the end of the Obama period but worse for Trump and Biden. The pandemic reduced life expectancy and households had fewer children. Successful retirements grew and will grow. Social trends continue, uninterrupted by political positioning and policies.

Perceptions of the country and the economy are increasingly shaped by partisan political party views. Nonetheless, the US economy continues to grow and thrive.

Good News: Labor Force Participation Recovers from the Pandemic

https://chicago.suntimes.com/2022/6/10/23162642/best-photos-of-the-week-chicago

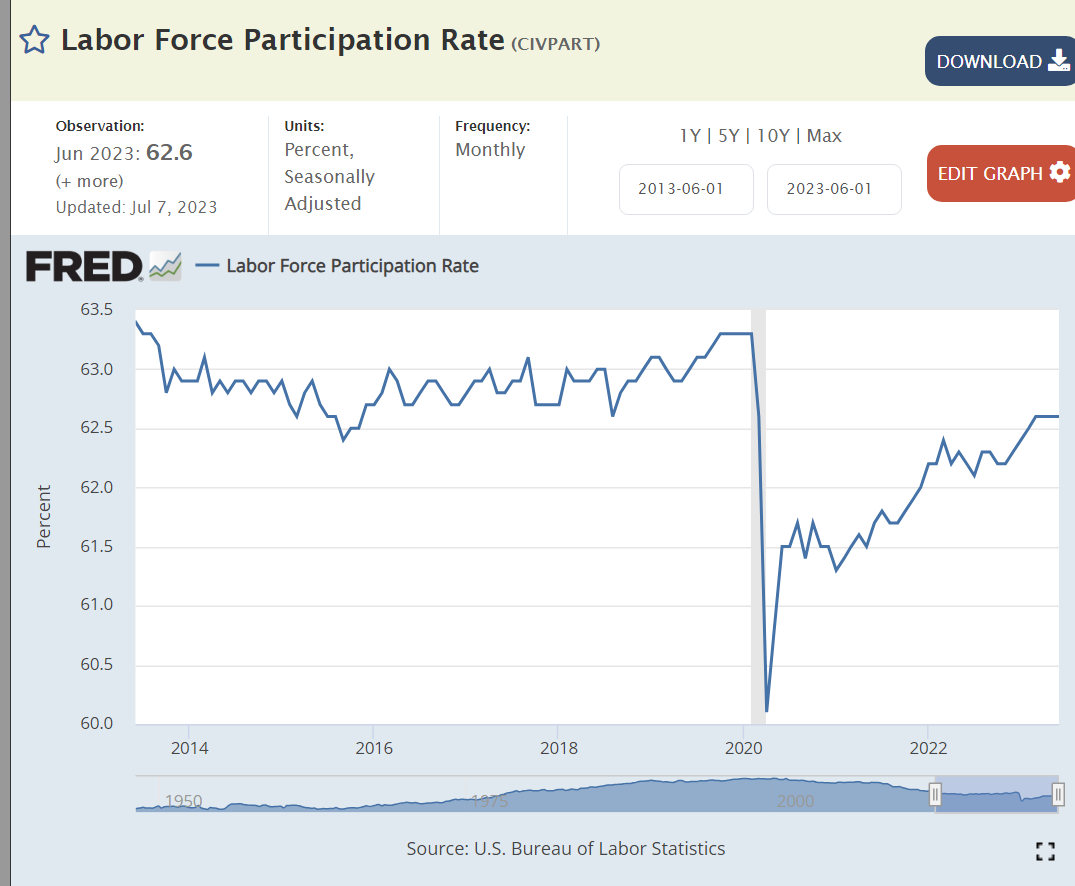
Overall labor force participation rate dropped by 1.5% in the pandemic and has recovered by 1%, still 0.5% below the recent history. However, the prime age category and several market segments no meet or exceed their pre-pandemic levels. Many details to consider.

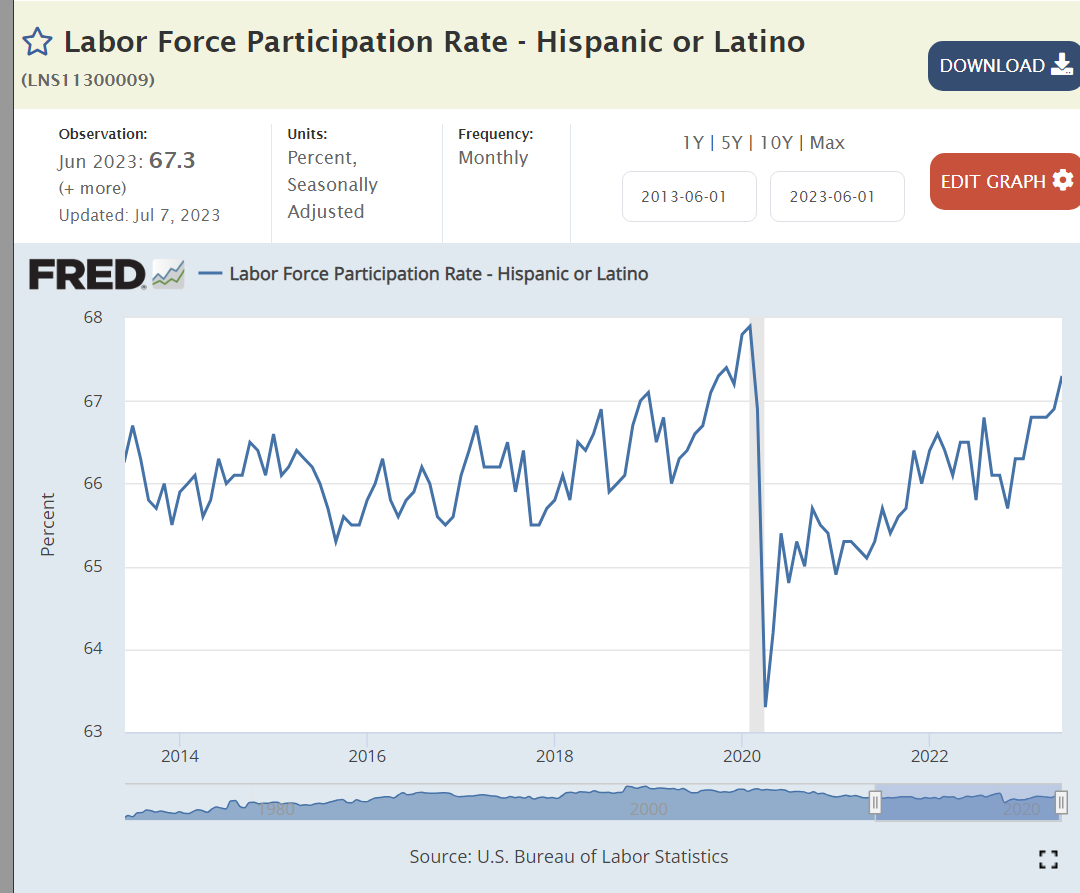
Hispanic participation is now 1% higher than the 2018-19 average before the pandemic.

The Asian participation rate is up 1%.

The Black participation rate is up 0.5%.

The White participation rate dropped by 1.5% and has recovered by half: 0.75% better but 0.75% below history.

The Women’s participation rate has essentially recovered to the 2018-19 average but is a half point lower than the peak levels seen just before the pandemic.

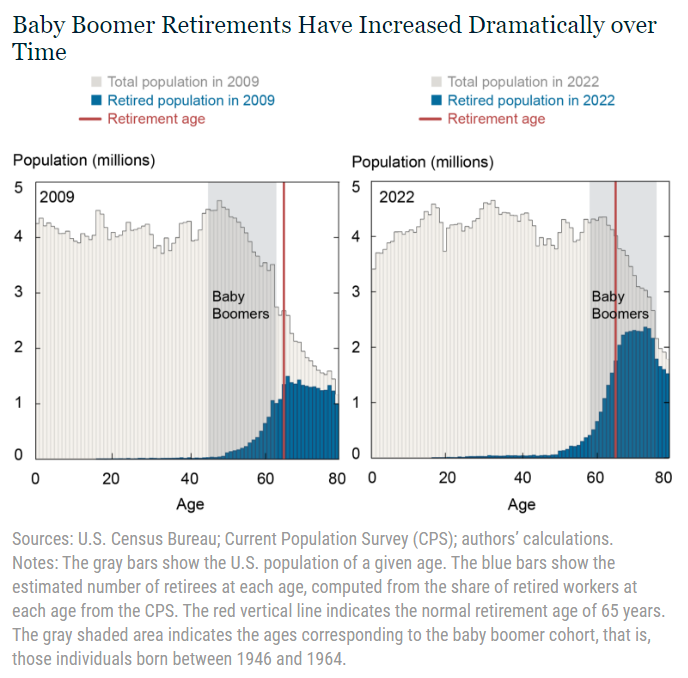
The male participation rate dropped by 1.5% but has only recovered by 0.5%, a major 1% below pre-pandemic times. Part of this is due to the long-term downward trend. Part of this is a “mix variance” driven by the very high number of “baby boomers” moving into normal retirement age or retiring early.

https://www.richmondfed.org/publications/research/econ_focus/2021/q1/district_digest

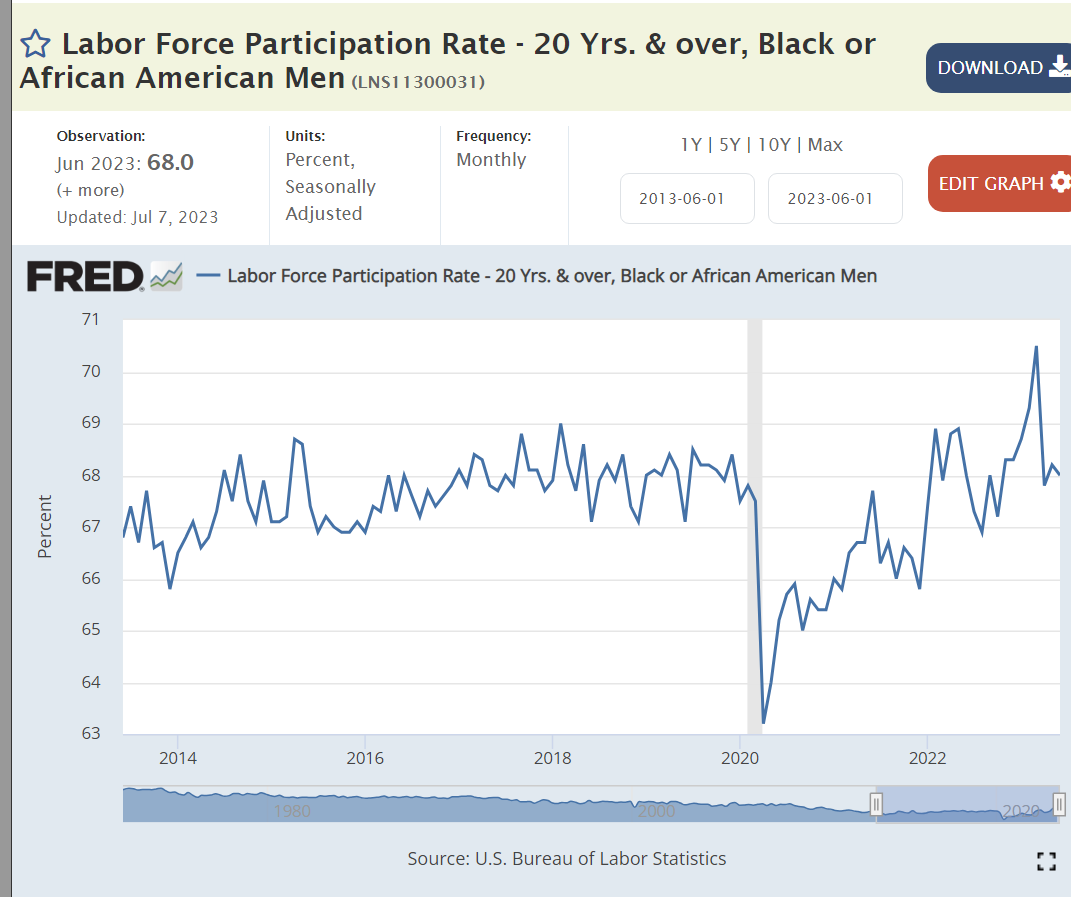
Black men are back to their pre-pandemic participation rate.

Black women are more active labor force participants.

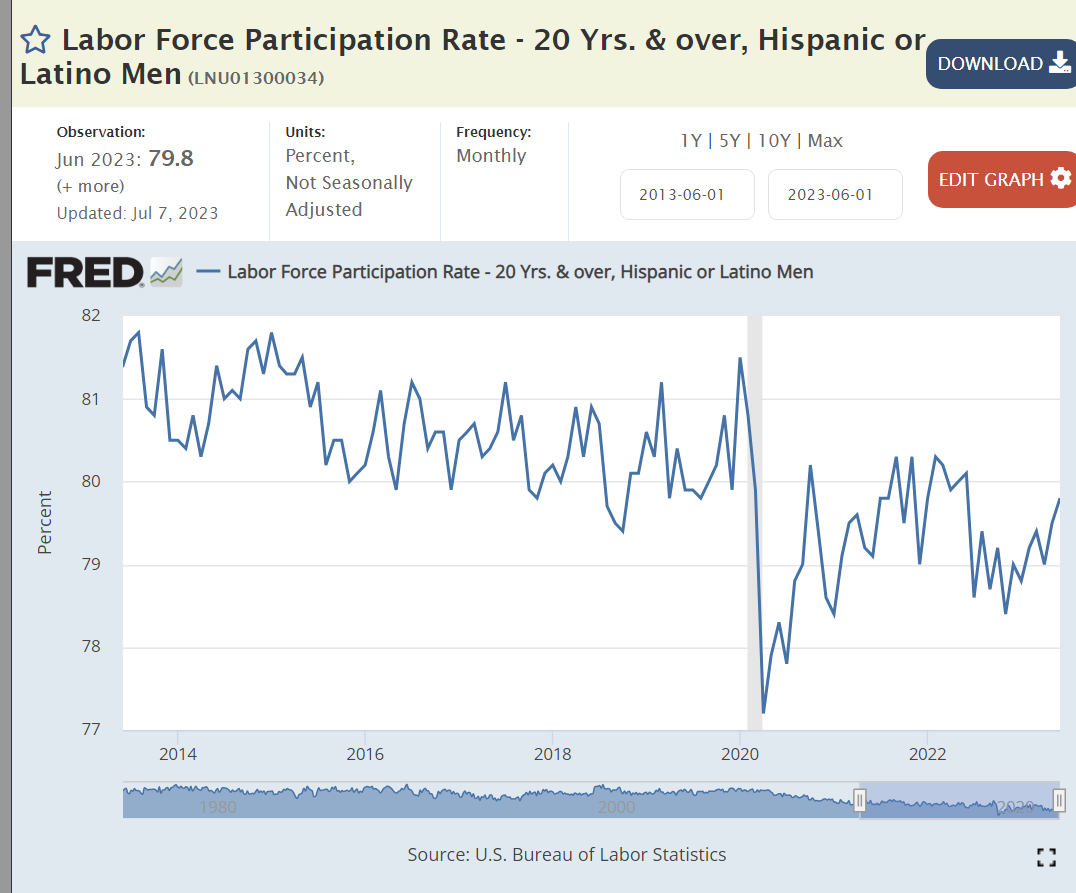
Hispanic men remain 1% below their pre-pandemic labor force participation rate.

Latino women have recovered to their historically high 61% participation ratio.

The White male participation rate dropped by 2% and has not recovered. Again, part is due to the long-run downward trend. Part is the aging of baby boomers into retirement. The remainder appears to be a response to the pandemic experience. “I’m not working unless you make it worth my while.”

White women remain a little below their 2018-19 average and three-quarters of a point behind their pre-pandemic peak level.

Teenage work participation has increased by 1.5% as entry level wages have risen.

College grad age participation rate has mostly recovered but remains 1% below the pre-pandemic high.

The retirement age workforce reduced its participation rate by 1.5% and has stayed there after a brief pseudo-recovery.

https://www.whitehouse.gov/cea/written-materials/2023/04/17/the-labor-supply-rebound-from-the-pandemic/

The prime age work force is now above even the elevated pre-pandemic level and a full one percent above the 2018-19 average. This is very good news, reflecting a strong economy an labor market.

Prime aged men have returned to the workforce.

Prime aged women are the “rock stars”, increasing their participation by 2% from 2019.

Brookings has combined all of the race and age data. Major declines for white men in all 3 age groups and for white women aged 65+. Major improvements for prime age white, black and other women and for prime age black men.

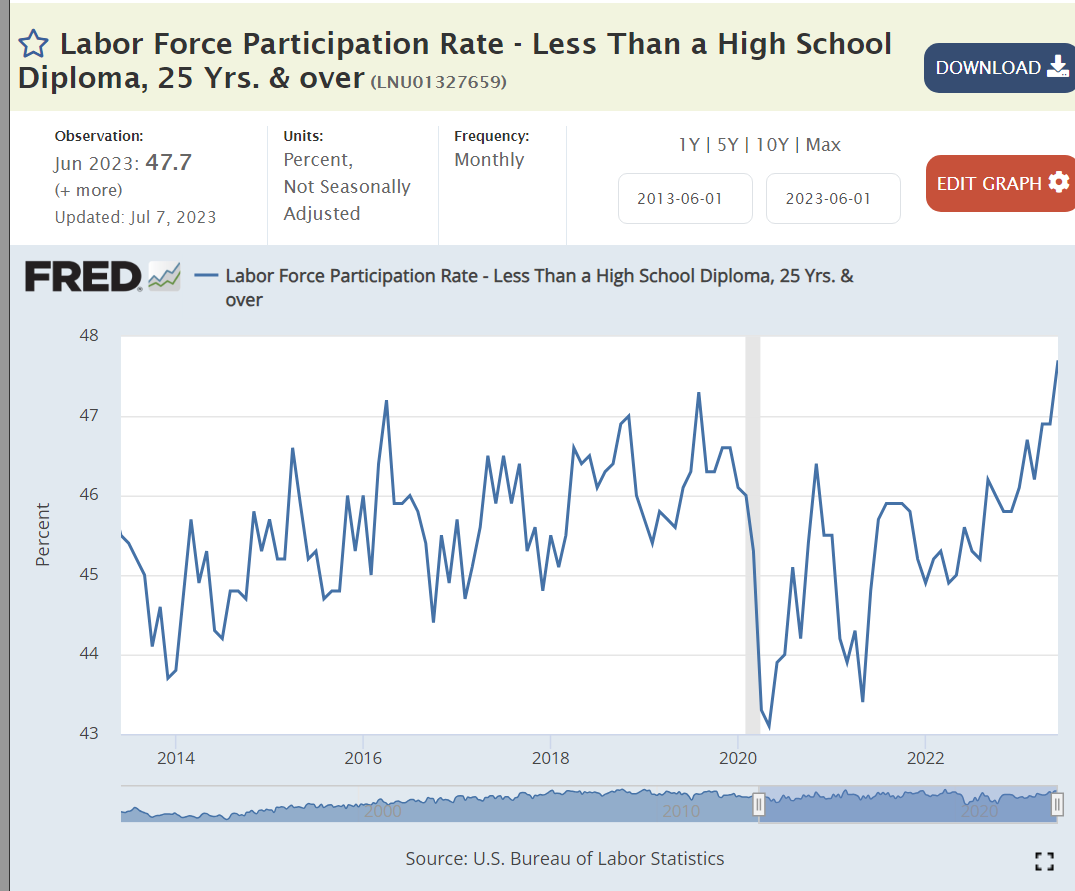
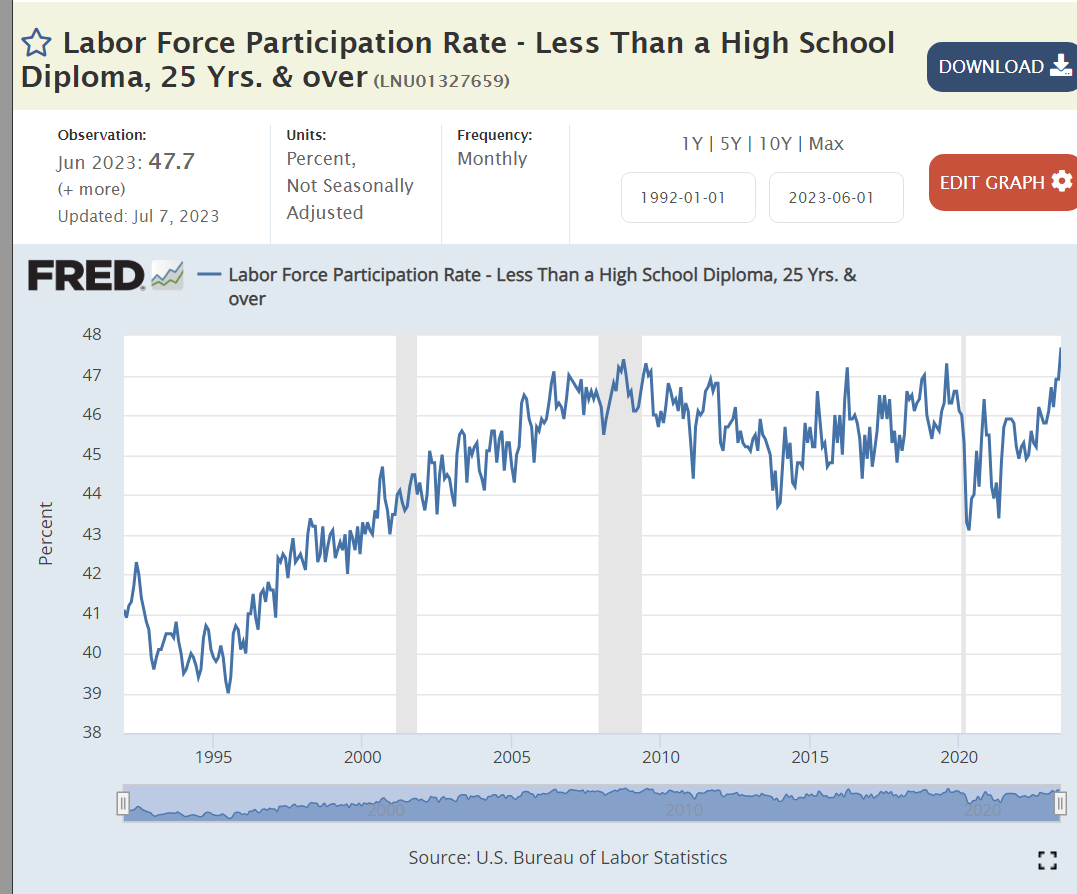
Non- high school graduates have added 1% to their labor force participation as real wages have increased.

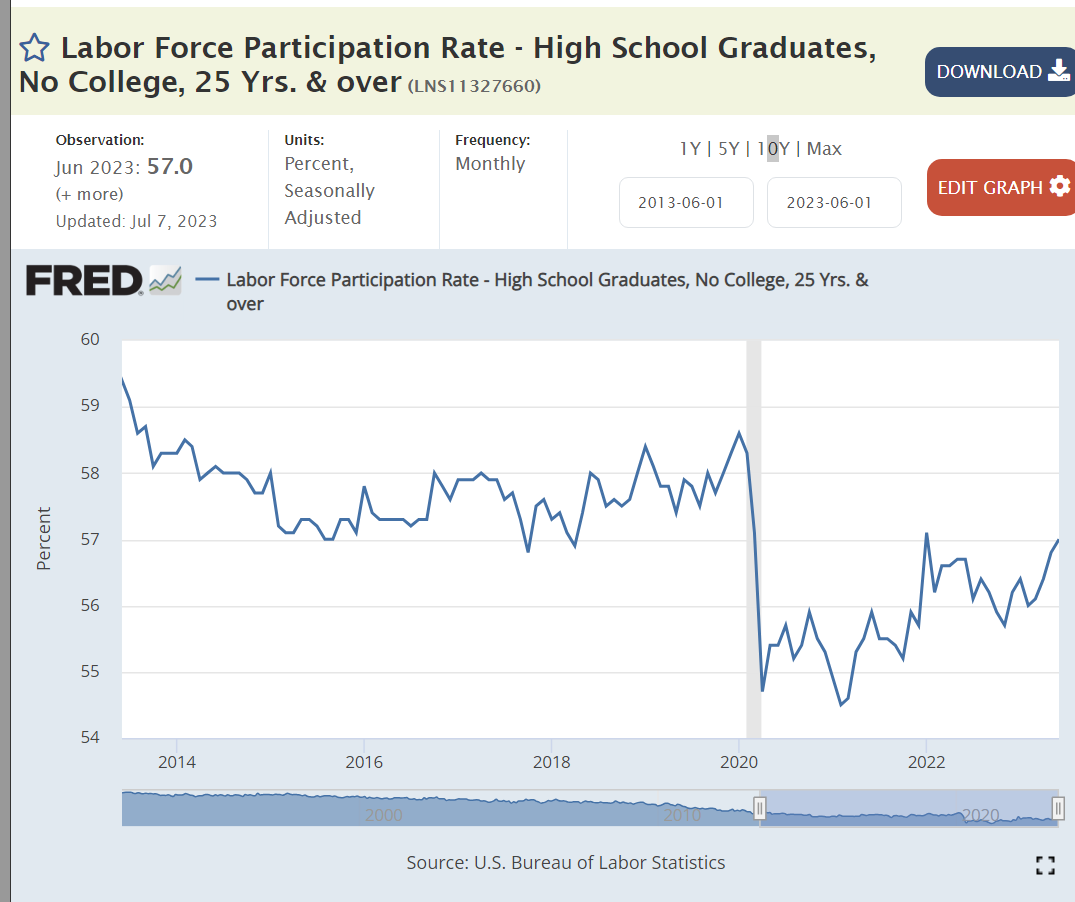
High school graduate participation dropped by three points before recovering by two points.

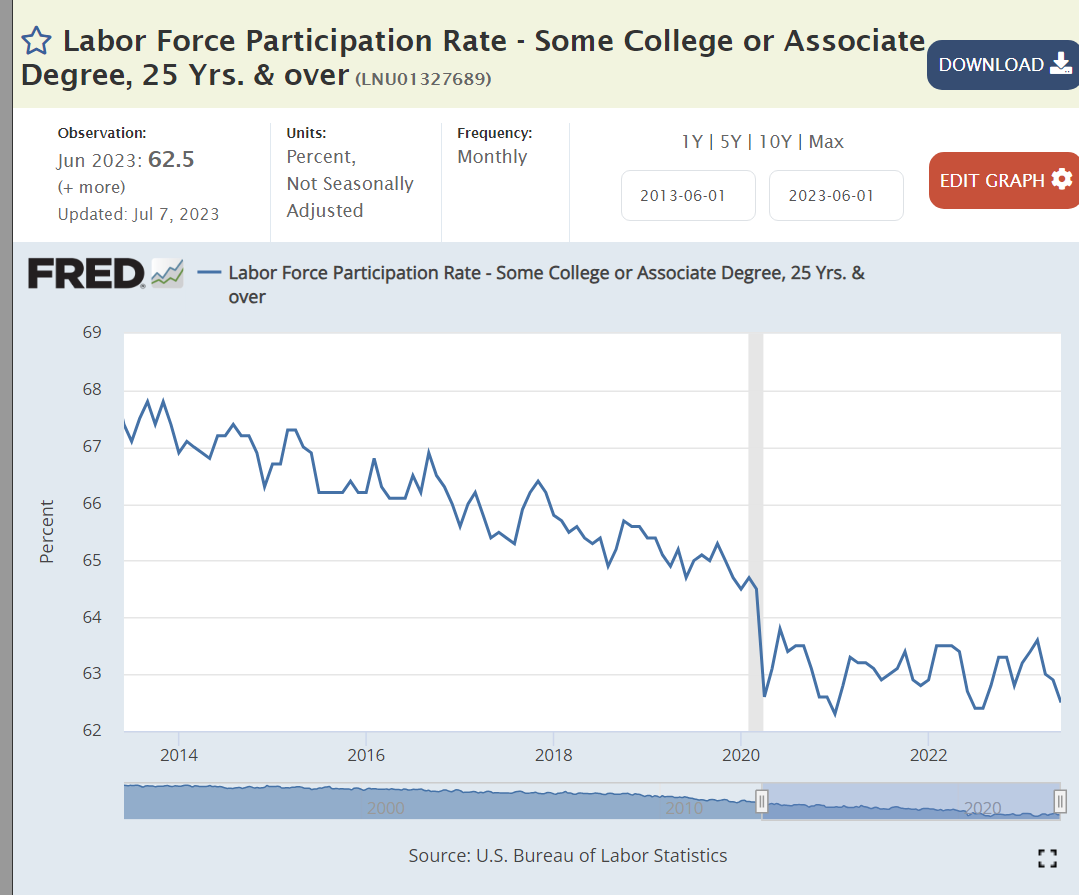
Individuals with some post-high school education, but not a bachelor’s degree, are in the middle range of US educational attainment. Their labor force participation rate had declined by almost 3 points in the 6 years before the pandemic, dropped by another 2 points during the pandemic and has not “recovered”.

Labor force participation by bachelor’s degree holders was stable before the pandemic, then dropped by 2 points and has since recovered by a little more than 1 point, remaining about one-half point below the prior average.

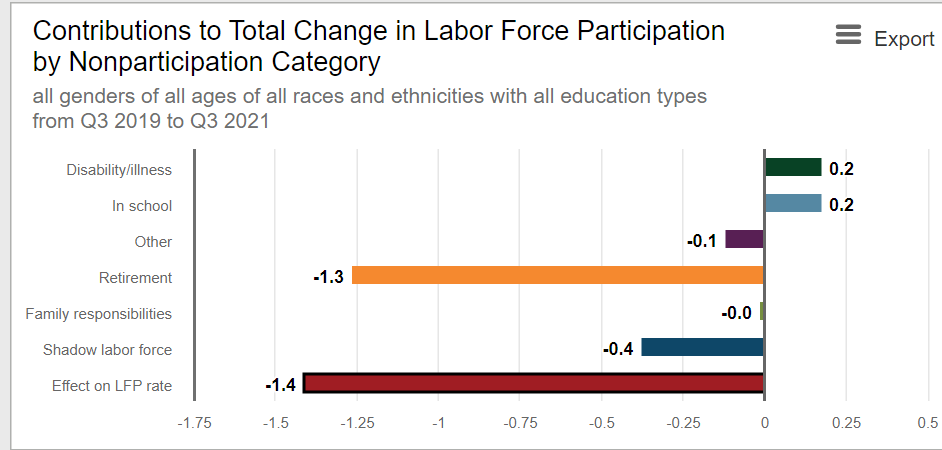
Individuals with a high school degree or higher have displayed drops of 10 points in labor force participation across the last 30 years. Most of this change is due to the “mix variance” of lower participation by an increasingly older and retired population, but some reflects other causes.

https://www.census.gov/library/stories/2021/06/why-did-labor-force-participation-rate-decline-when-economy-was-good.html

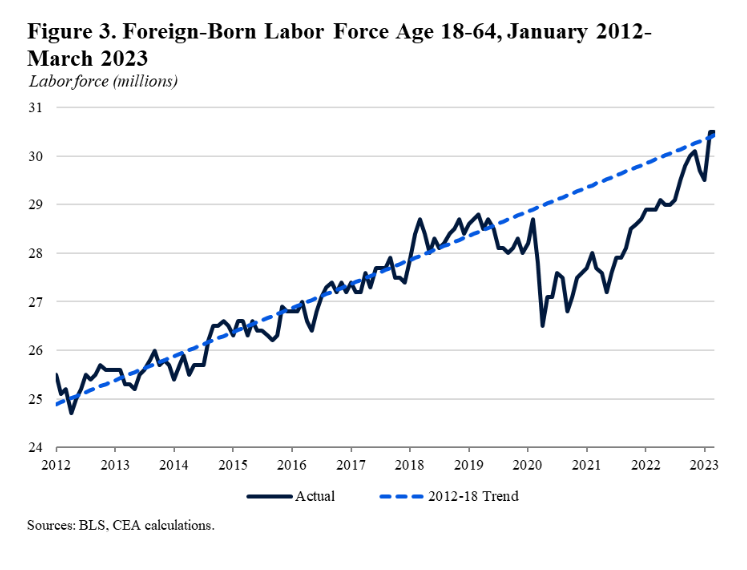
Foreign born members of the US labor force have fully “returned to work” after the pandemic.

https://www.whitehouse.gov/cea/written-materials/2023/04/17/the-labor-supply-rebound-from-the-pandemic/

This participation growth improvement has taken place as the foreign-born population has increased to its trend growth rate.

https://www.ers.usda.gov/topics/rural-economy-population/employment-education/rural-employment-and-unemployment/

https://www.ers.usda.gov/data-products/chart-gallery/gallery/chart-detail/?chartId=103862

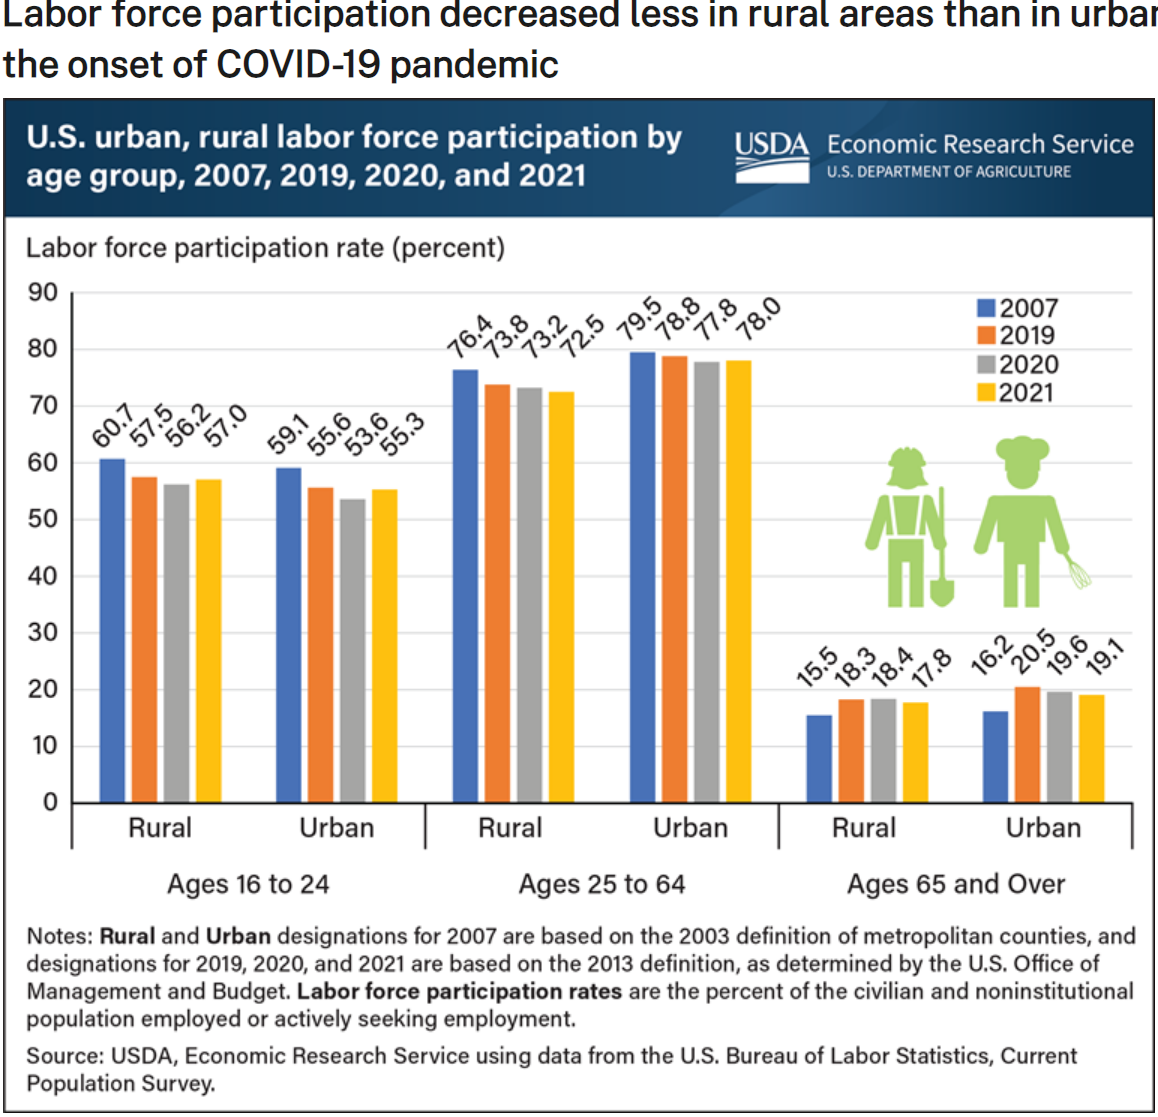
In general, rural labor markets have grown more slowly in the last 15 years and shown greater reductions in labor force participation. Some of the increased labor force participation in the last 2 years may reflect a recovery from these declines.

https://www.bostonfed.org/publications/new-england-economic-conditions/2023/april.aspx

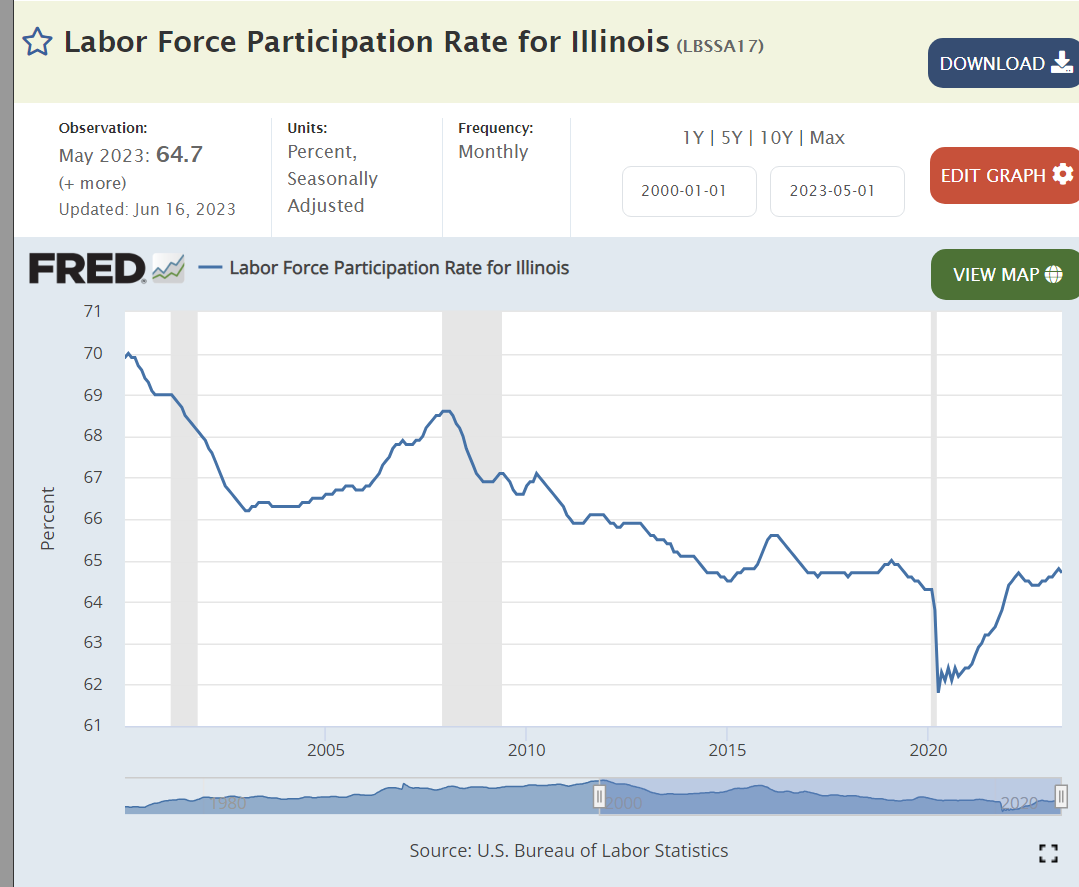
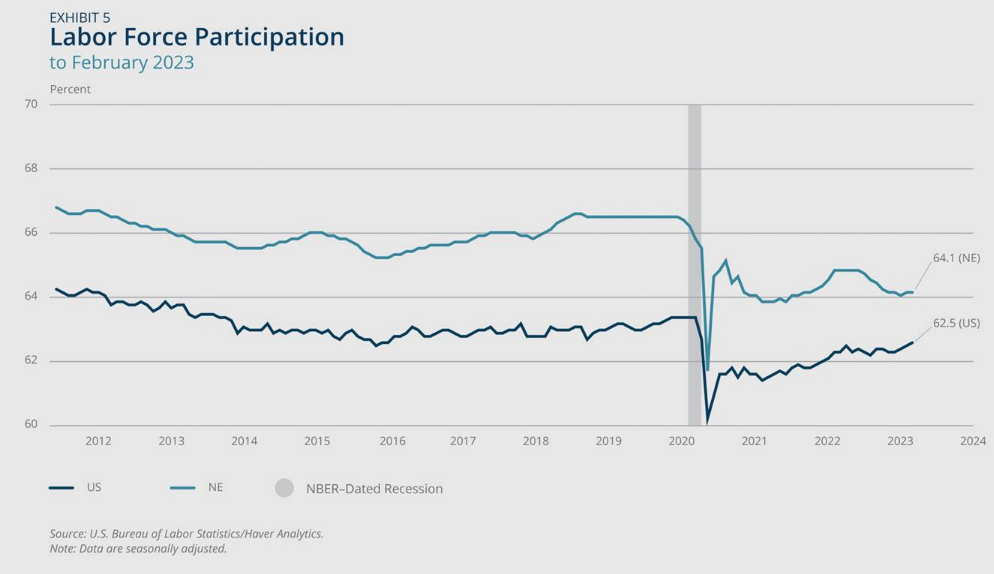
Most states show a similar pattern of labor force participation in the years before the pandemic, declining by 2-4% and afterwards recovering to their pre-pandemic level. California’s recovery has been slower. The New England states had an unusual increase in labor force participation before the pandemic and have not seen a major recovery after the pandemic.

Summary

Several sources decry the decline in the number of workers and the labor force participation rate, noting that it holds back the economic recovery and taints the 3.5% unemployment rate.

https://www.forbes.com/sites/qai/2023/01/25/unemployment-is-low-but-so-is-the-labor-force-participation-rate—whats-going-on-in-the-us-labor-market/?sh=72f0035b244e

https://www.gspublishing.com/content/research/en/reports/2021/11/12/4f72d573-c573-4c4b-8812-1d32ce3b973e.html

https://www.uschamber.com/workforce/understanding-americas-labor-shortage

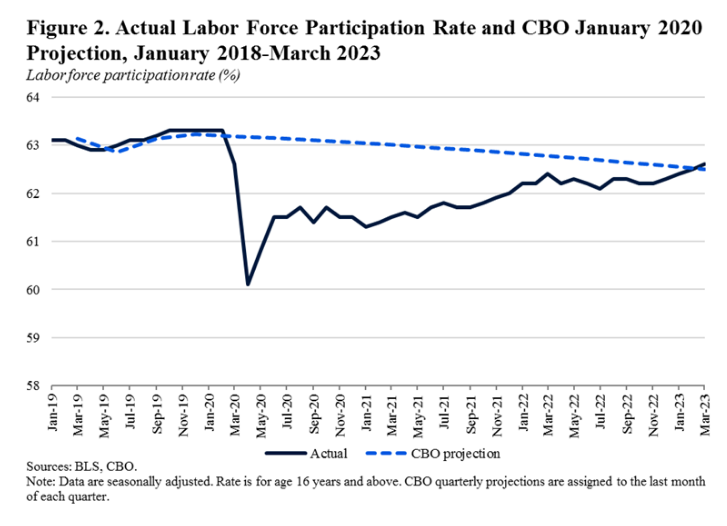
Other sources point to the long-term downward trends in participation as the biggest factor, mostly driven by an aging workforce and recent higher than normal retirement rates. Pre-pandemic forecasts showed a one-half point decline in participation, matching the actual 2023 data. Detailed analysis shows that the age adjusted participation rate is a little higher. The core group, aged 25-54 population, also shows labor force participation recovery to relatively high pre-pandemic levels. So … there are demographic, racial, education, birth country, rural/urban, location and state differences in participation. There are opportunities for higher participation in a strong economy and labor market. However, the recovery from the pandemic is complete, reflecting this strong economy and labor market.

https://www.whitehouse.gov/cea/written-materials/2023/04/17/the-labor-supply-rebound-from-the-pandemic/

https://www.axios.com/2023/06/02/jobs-report-workers-prime-age-labor-force-participation

https://www.atlantafed.org/chcs/labor-force-participation-dynamics

Good News: Exceptionally Low Metro Area Unemployment Rates

The overall US unemployment rate at 3.6% remains at a 50-year low. The metropolitan area rate is a shade lower. I summarized metro area unemployment rates for those which have a city in the top 100 of population. Only 73 metro areas remain, since 27 cities are the second or smaller city in their metro areas. The average metro area unemployment rate for these top 100 areas is 3.4%. The median metro unemployment rate is 3.3%.

Democratic mayors led the main cities in two-thirds of the largest metro areas. Republicans, independents, nonpartisans or split results led in the remaining one-third (24/73).

Democratic mayor lead metro areas have median and average unemployment rates at 3.2%, significantly below the national 3.5-3.6% rate. The Republican+Other metro areas show 3.4% median and 3.9% average unemployment rates, just slightly higher.

The claim that Democrats are “bad” for the economy is not supported by this data.

Republicans and independents/nonpartisans/split mayors lead 8 metro areas with unemployment in the historically unheard of 2% range:

Denver, Colorado Springs, Omaha, Tulsa and Oklahoma City in the prairie states. Miami, Virginia Beach and Honolulu complete the set.

Non-Democratic mayors also lead 8 southwestern cities with higher-than-average unemployment (4%+): Reno, Las Vegas, Laredo, Corpus Christi, Riverside, Stockton, Fresno and Bakersfield.

Only 5 Democratic lead cities, versus 8 Republican/Other cities, had 4%+ unemployment rates in May, 2023: New York and Los Angeles, Houston, El Paso and New Orleans.

31Democratic mayor lead metro areas had strong 3% unemployment. 13 boasted amazing 2% unemployment rates: Boise, Lincoln, Nashville; Madison, Minneapolis-St Paul; Jacksonville, Tampa, Orlando; Richmond, DC, Boston, Baltimore.

Summary

Metro area unemployment is even lower than the 50-year low national average.

Democratic led metro areas have slightly lower unemployment rates.

We have 6 large metro areas with 2.5% or lower unemployment: Lincoln, Madison, Omaha, Boston, Baltimore and Miami.

Our very worst metro areas (of 100) are El Paso, Corpus Christi and Laredo at 4.5% and Las Vegas (5.6%), Stockton (5.9%), Fresno (7.5%) and Bakersfield (8.6%).

The American economy is delivering truly amazing results.

https://www.bls.gov/web/metro/laummtrk.htm

https://ballotpedia.org/List_of_current_mayors_of_the_top_100_cities_in_the_United_States

Are We Heading Towards 2% Inflation?

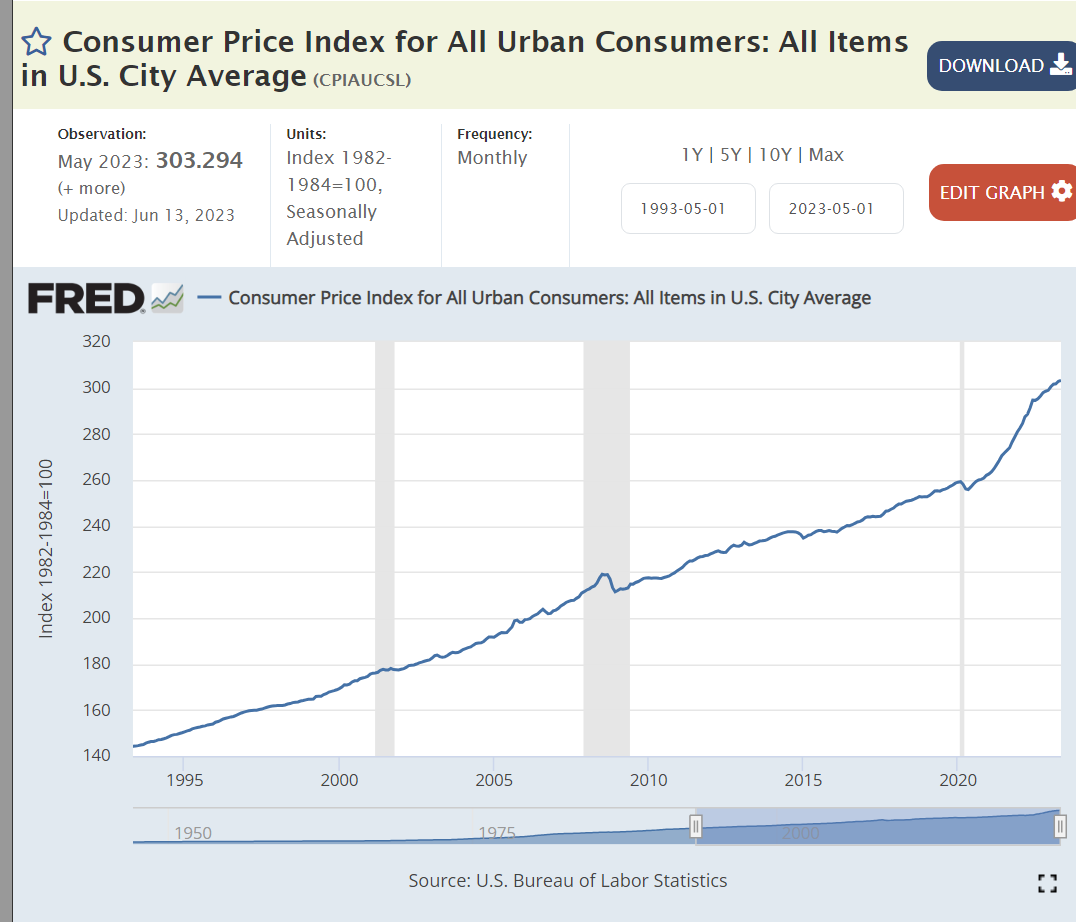
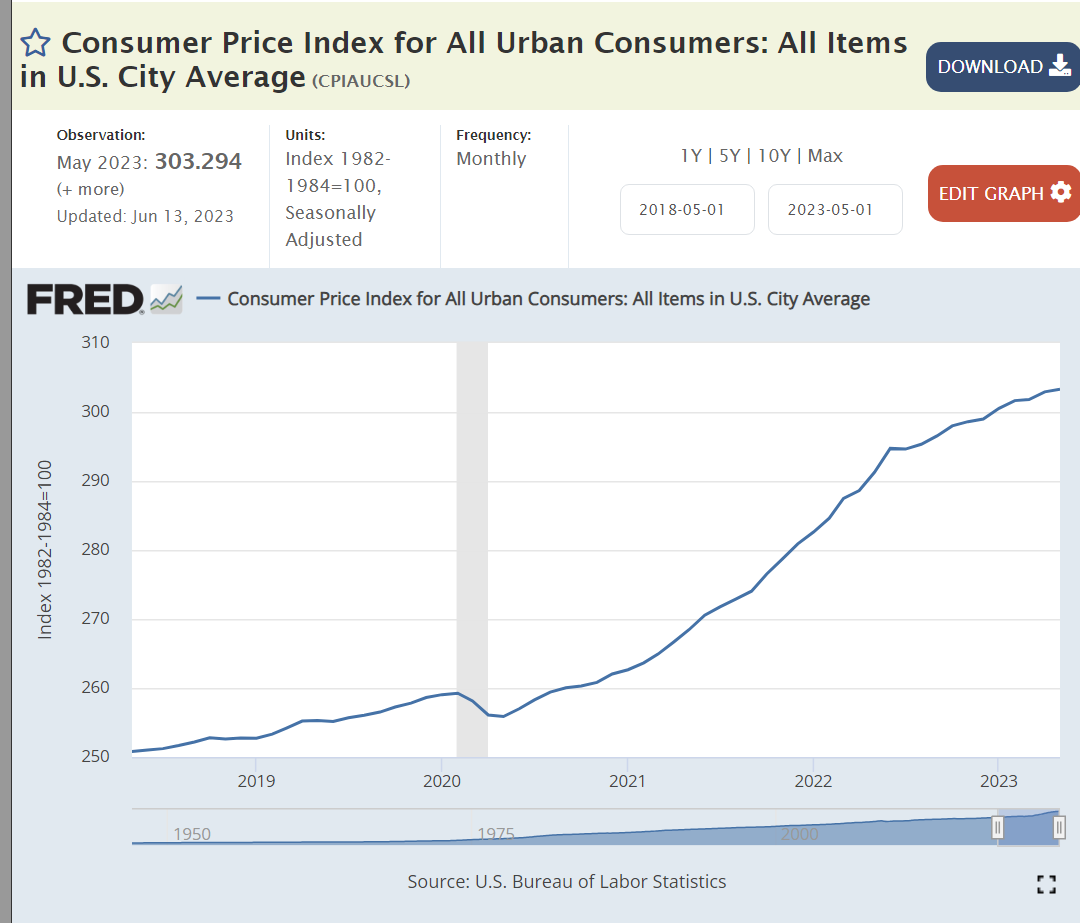
The overall CPI index increased smoothly during the last 30 years until the pandemic. The Great Recession created a small blip up and down. Prices have recently increased by a very large 15% in less than 3 years versus the usual 5% in that time.

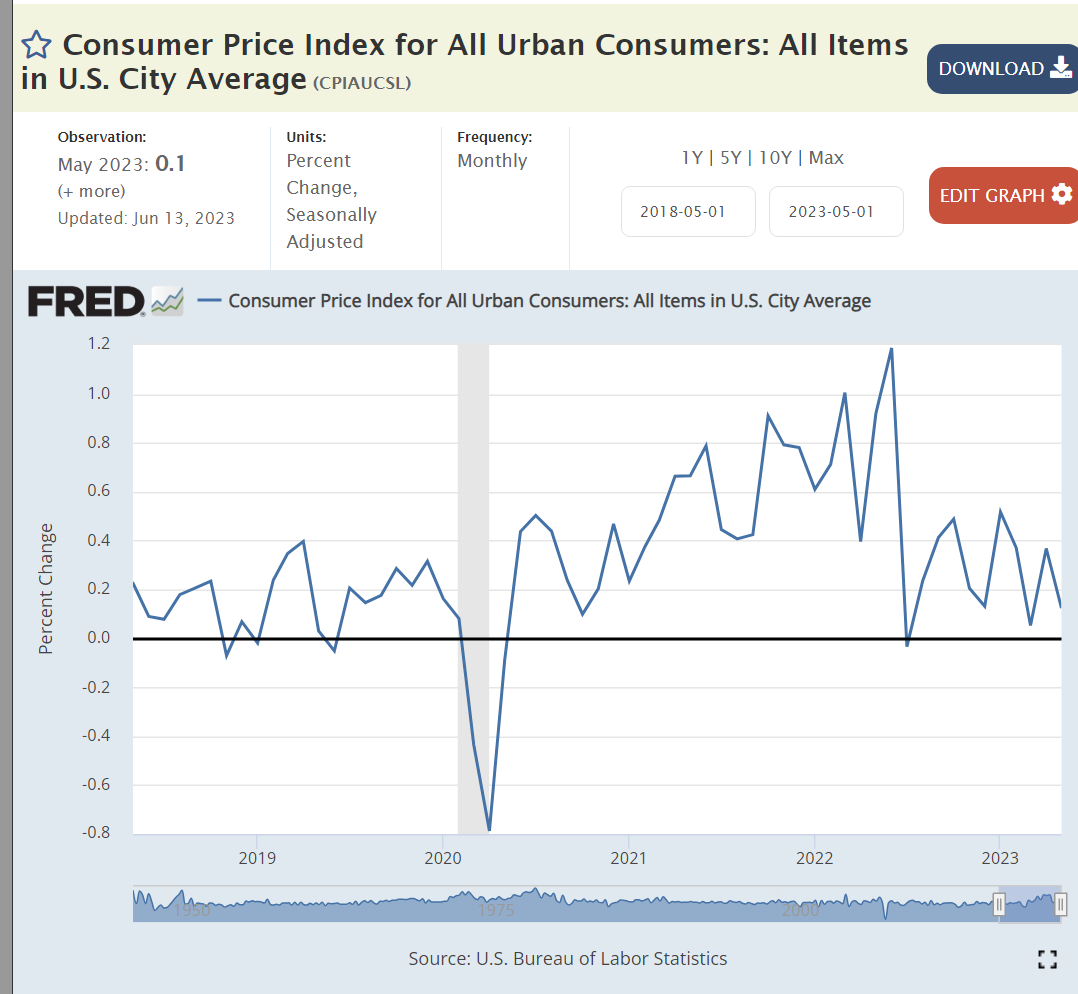
From June, 2020 through September, 2021 annual inflation jumped up to 5%. In the 9 months from October, 2021 through June, 2022, annual inflation spiked up to 10%.! This was mainly driven by durable goods prices as the unexpected rapid recovery from the pandemic encouraged consumers to buy “stuff” since they could not buy services. Since July, 2022 annual inflation is CLEARLY much lower, just 3% to 4% depending on the exact months chosen. Inflation appears to be decelerating as the May, November and May indices are 291, 299 and 303. The last 6 months’ inflation is just two-thirds of the prior 6 months.

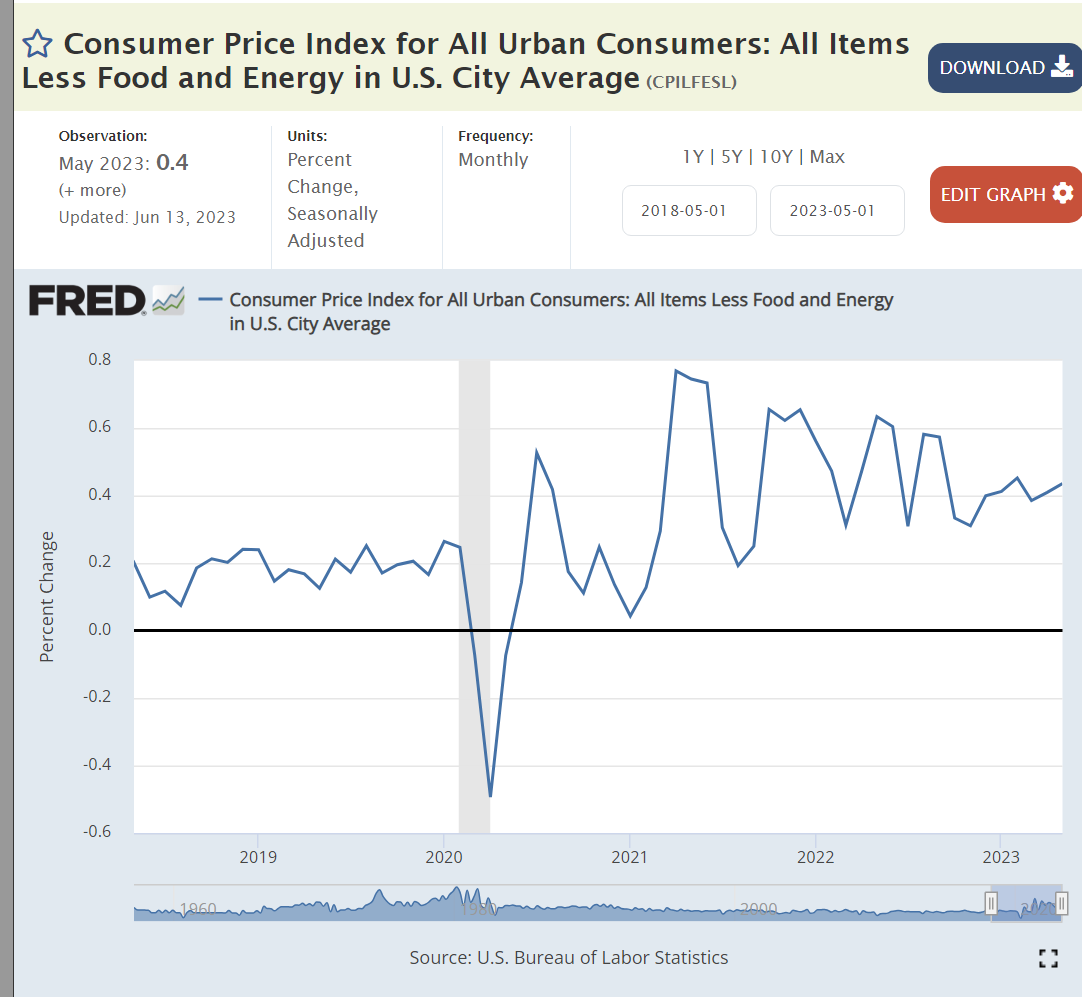
Unfortunately, the core inflation measure, excluding food and energy, remains near 5%.

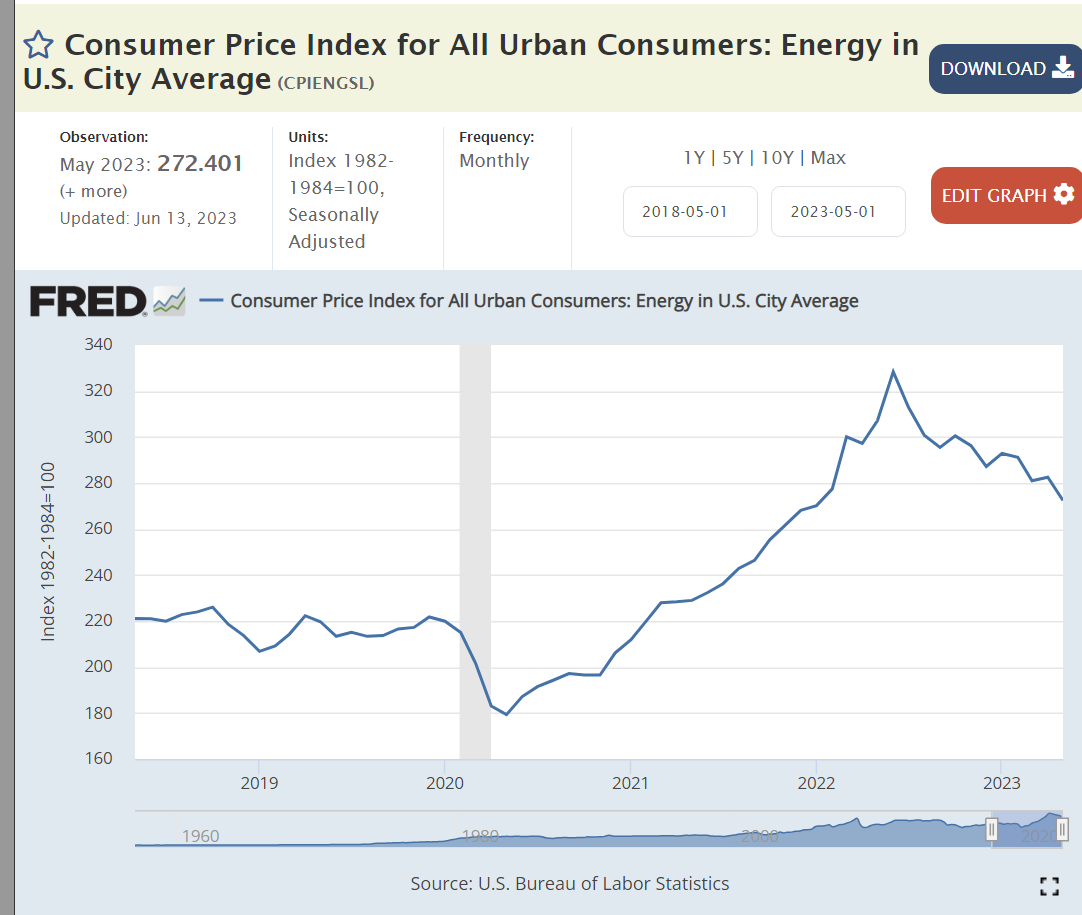
Energy prices have fallen quickly from their peak in June, 2022.

Auto gas prices are volatile, determined by the global oil market. The spike from $2/gallon to $4.50/gallon impacted American consumers. The return to $3.50/gallon is welcome, but prices are still 50% higher than the 2015-20 period.

In 25 years, durable goods prices had dropped by 25% due to globalization. In 2 years, they spiked up by 25% as global manufacturers were unprepared for the rapid recovery in demand. Manufacturers, wholesalers and retailers have NOT given back any of that 25% increase in prices, but durable goods inflation has returned to zero.

Nondurable goods followed a similar pattern with a 19% increase followed by flat prices.

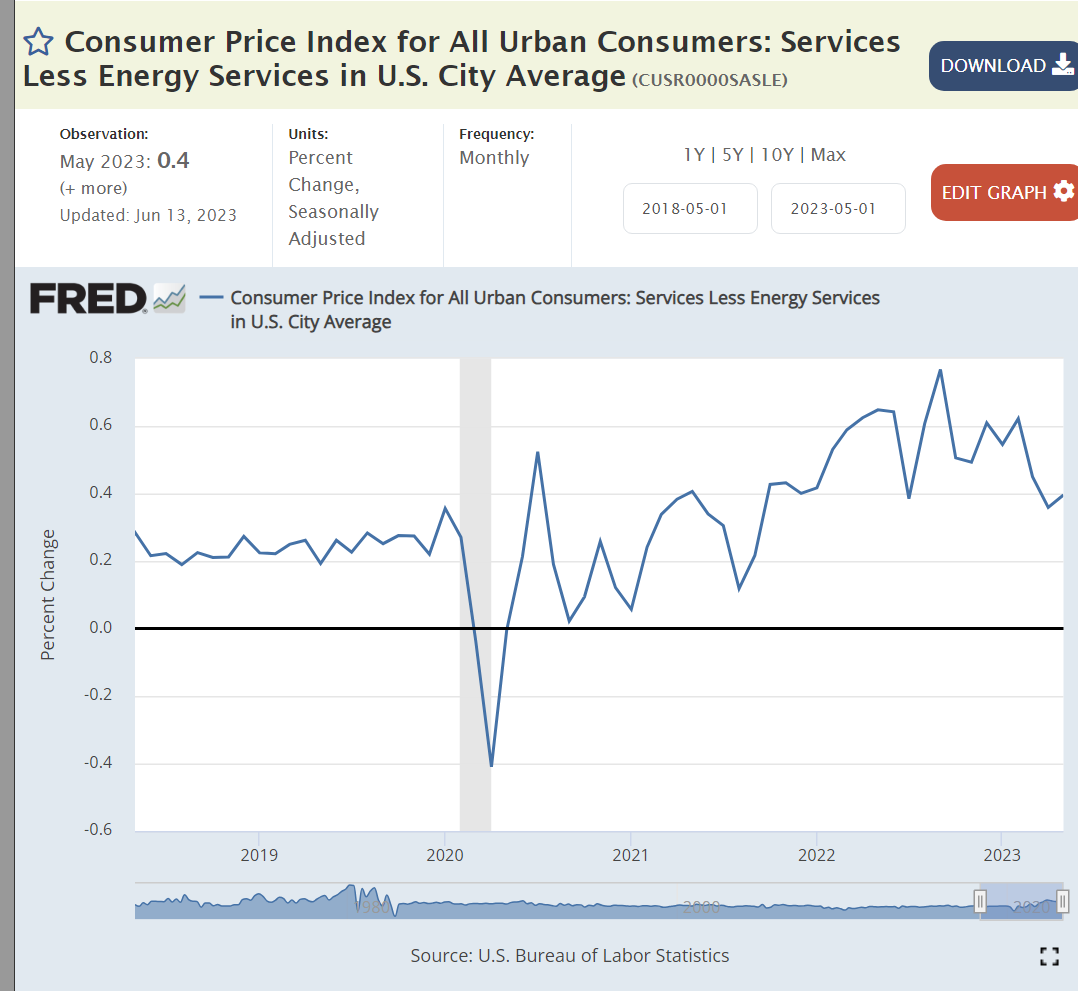
The services sector experienced mild inflation during the first 18 months of the pandemic, but has increased to a 6% annual rate as businesses re-established their business models and labor supplies. This sector has slowed to 5%, but remains the greatest concern for reducing the overall inflation rate.

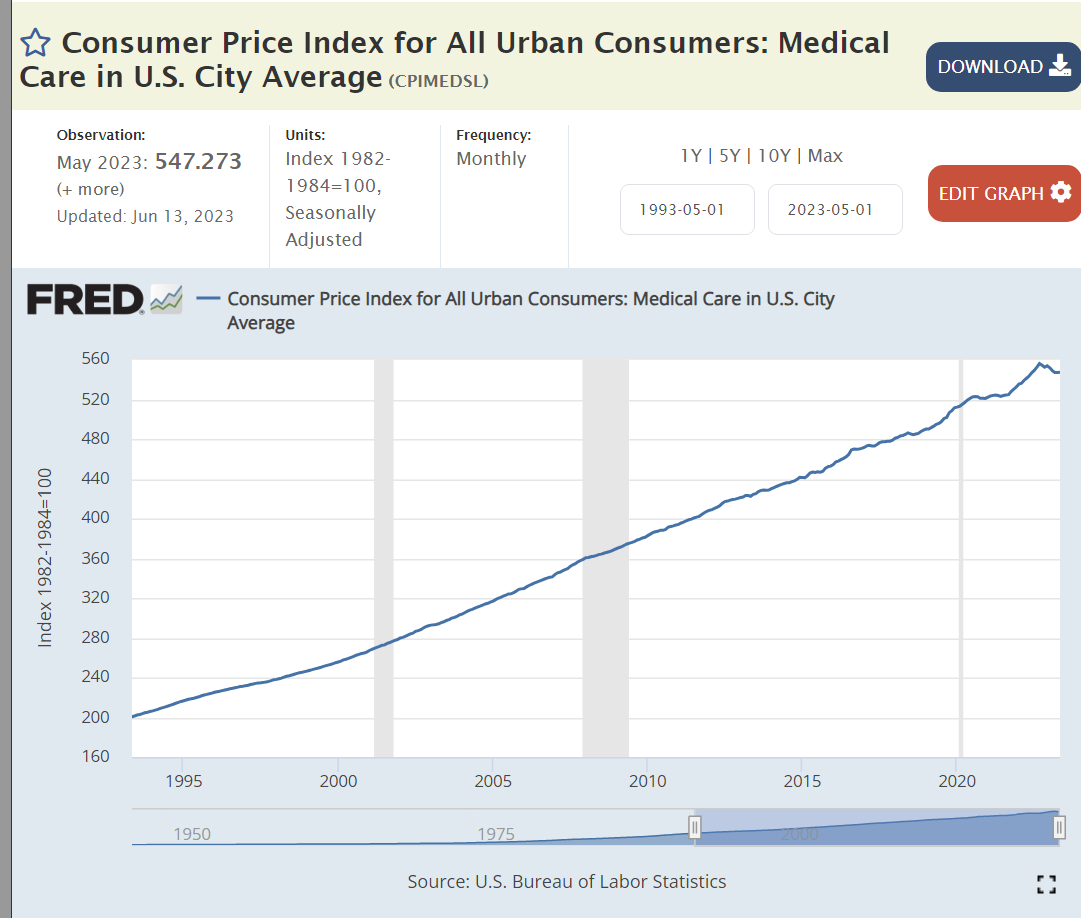
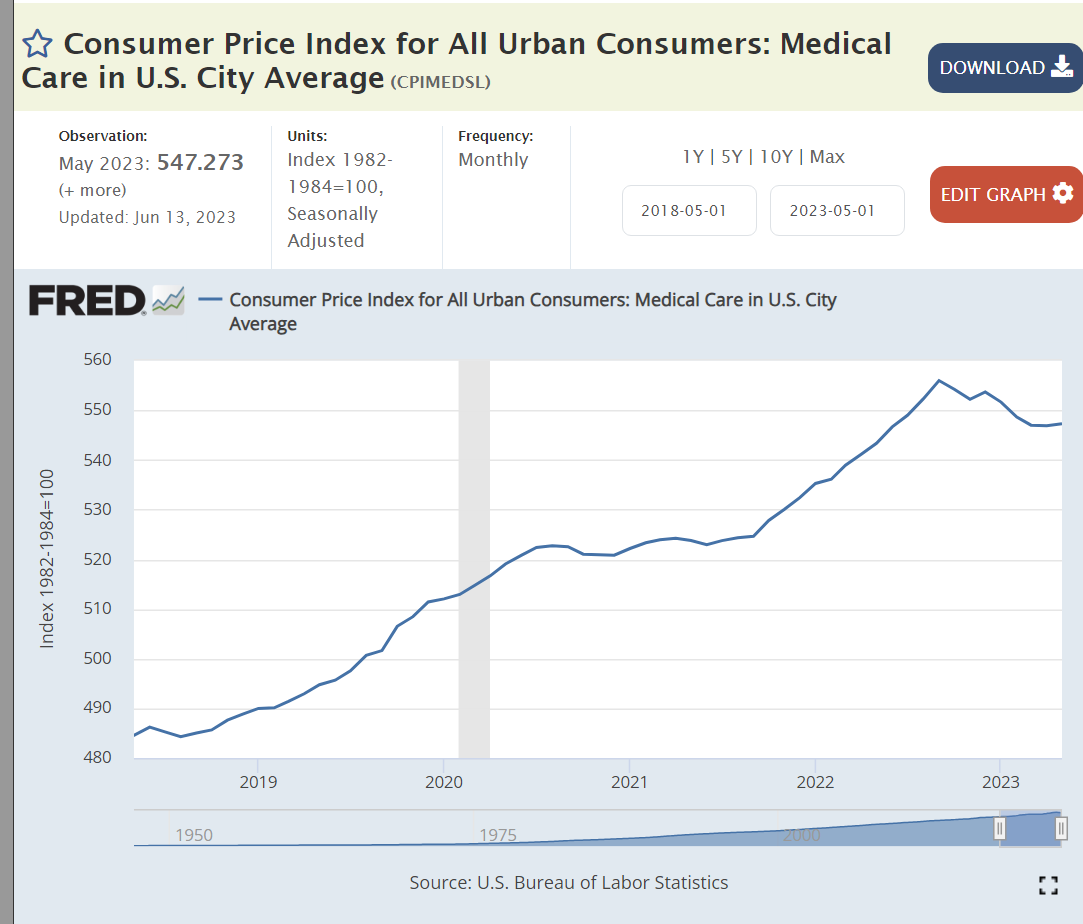
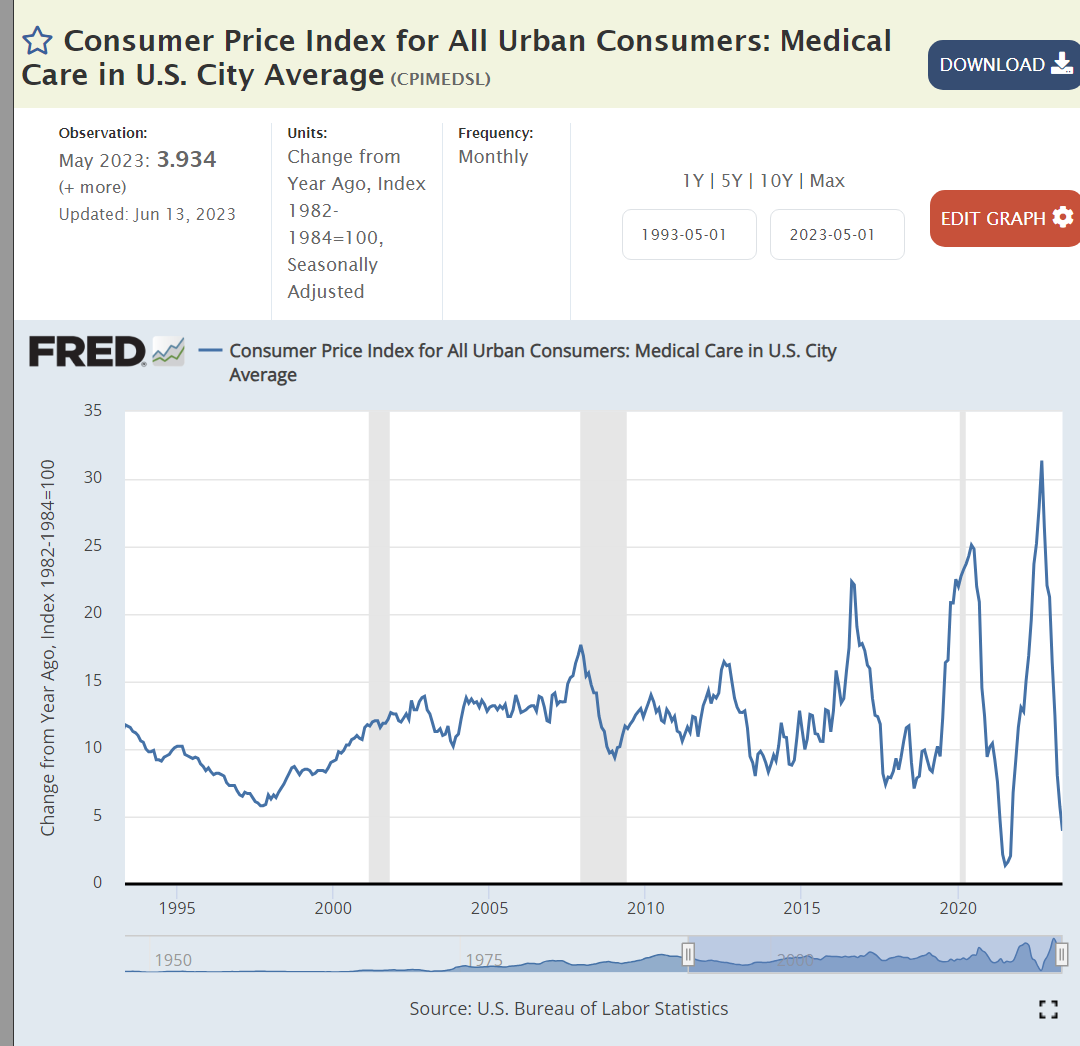
Medical care inflation remains at its 20-year level of 10% or more per year. As medical care has grown significantly as a share of the economy, it’s inflationary disease further infects the economy. Labor shortages play a minor role in this industry. The lack of competition or other incentives for real productivity improvements (Baumol’s disease) drive massive inflation even as US health results such as lifespans decline.

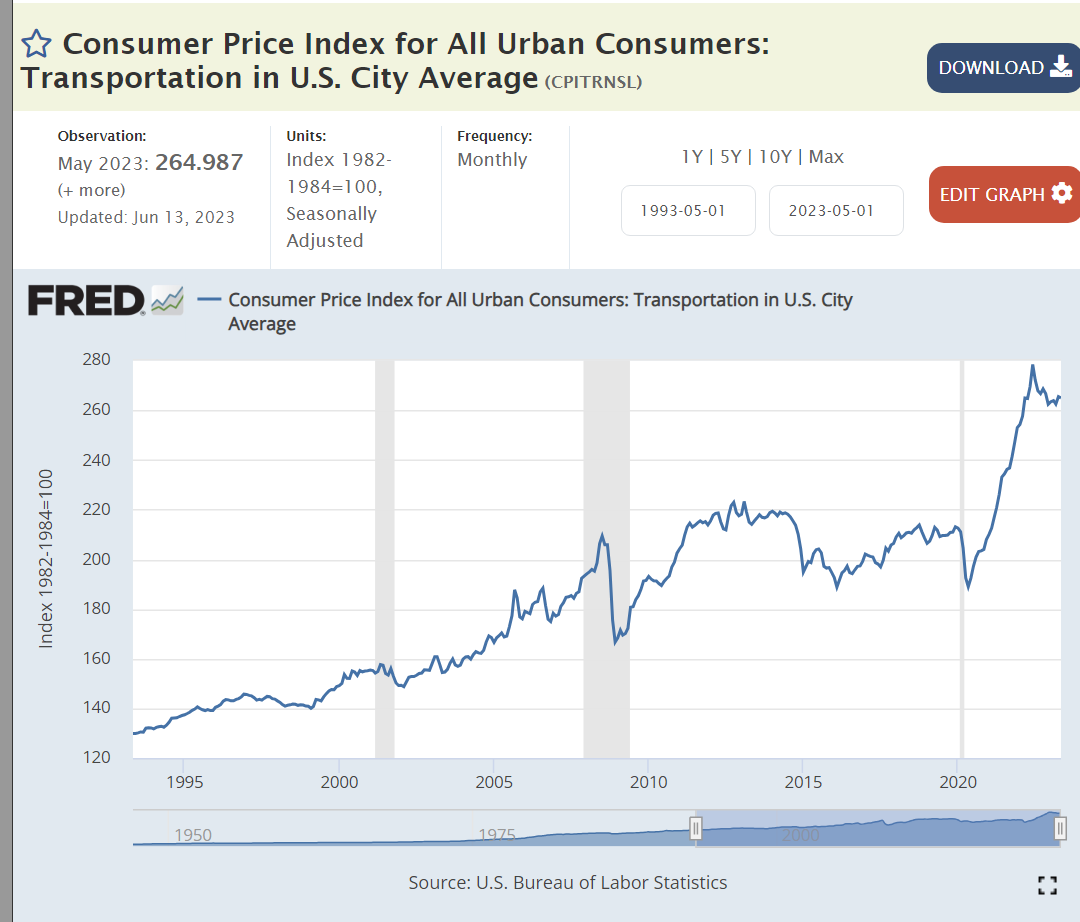
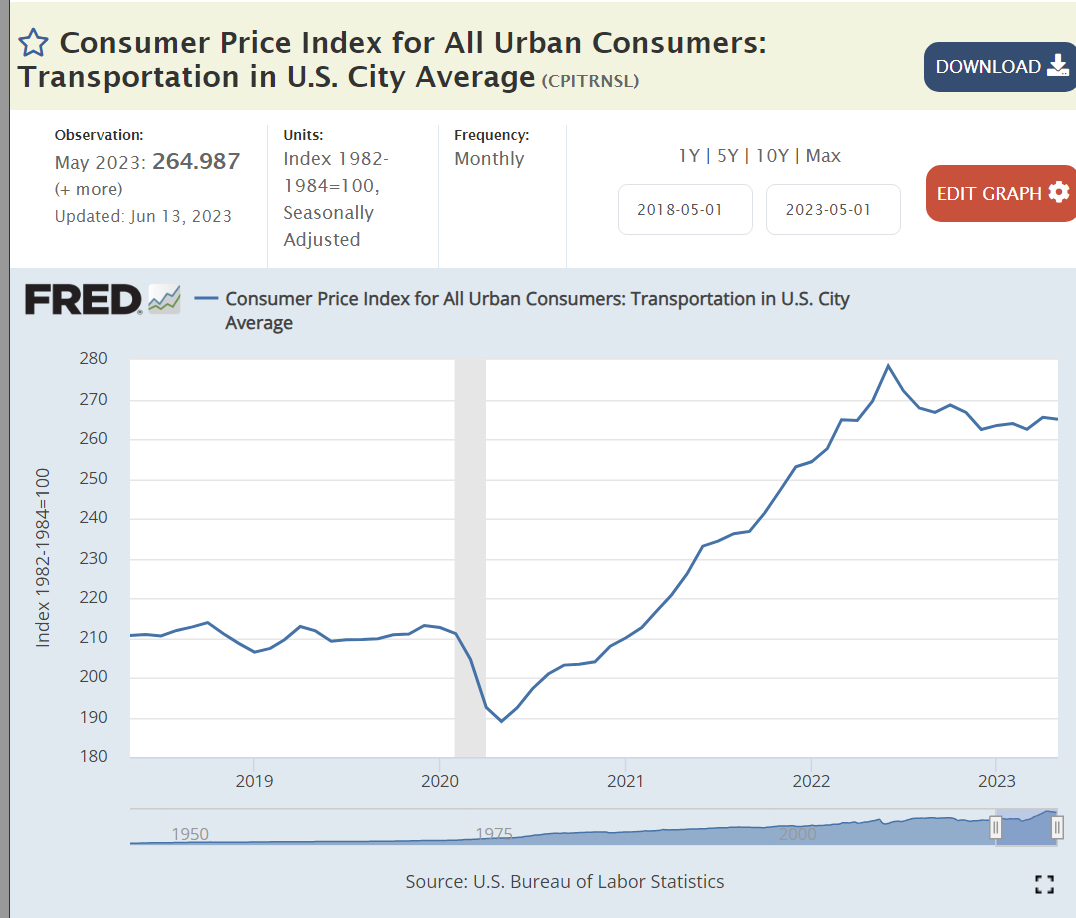
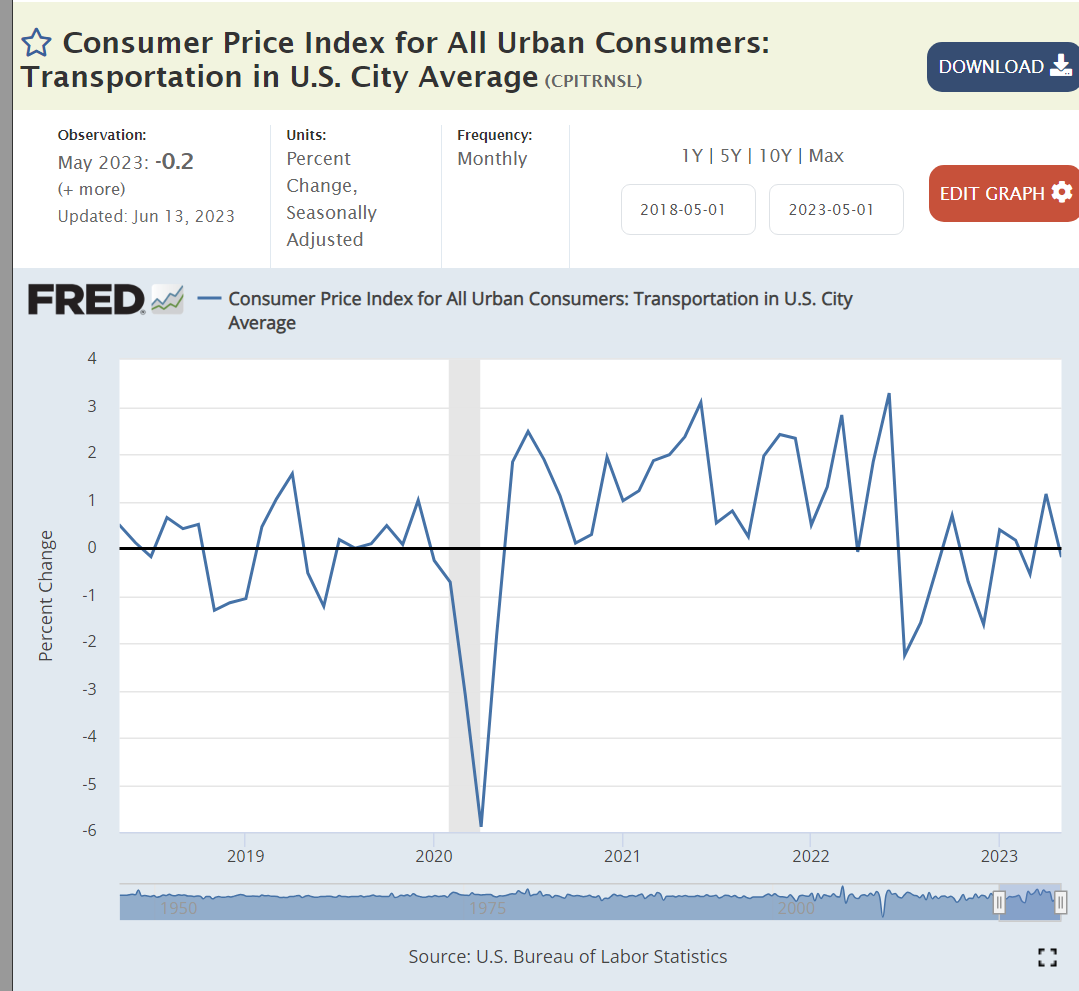
Transportation includes both durable goods and energy prices. A 25% price increase before it flattened off.

The used car and truck market experienced 50% price increases when the new car and truck pipeline was disrupted. Once again, prices have flattened, but not declined significantly to return to the pre-pandemic level.

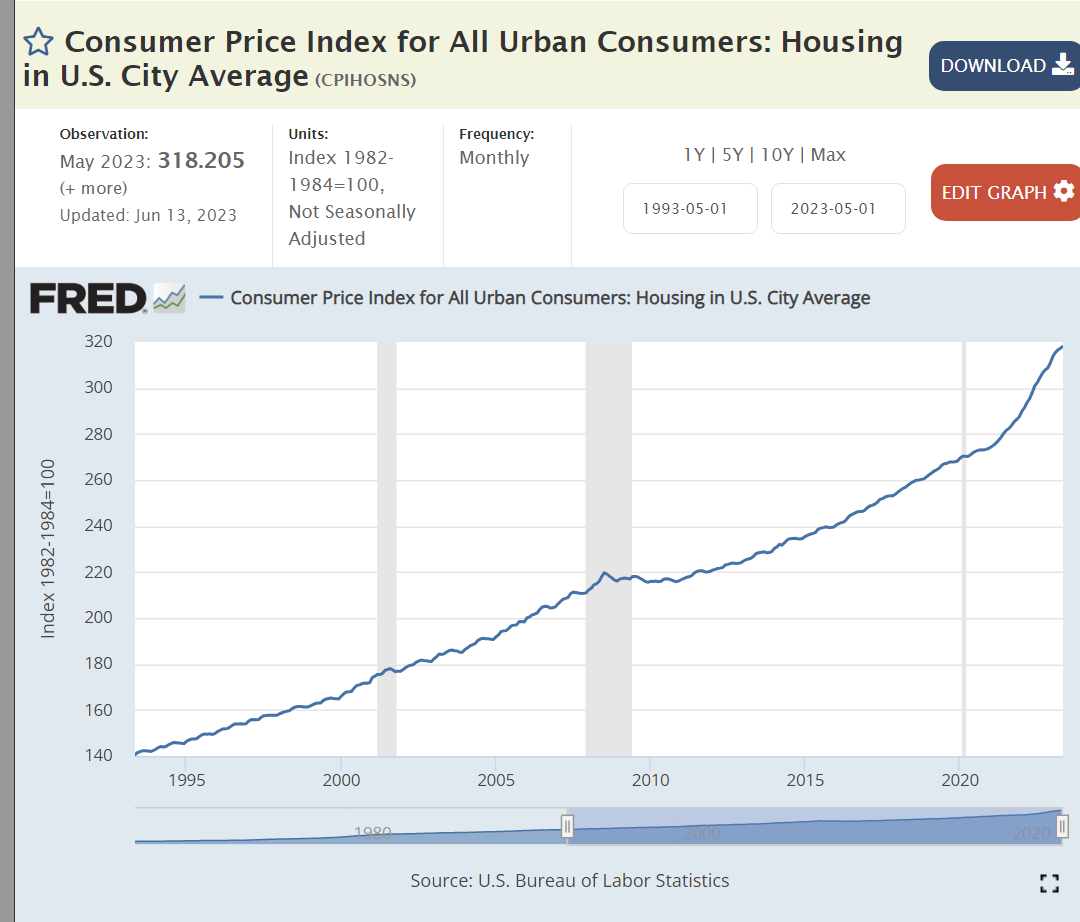
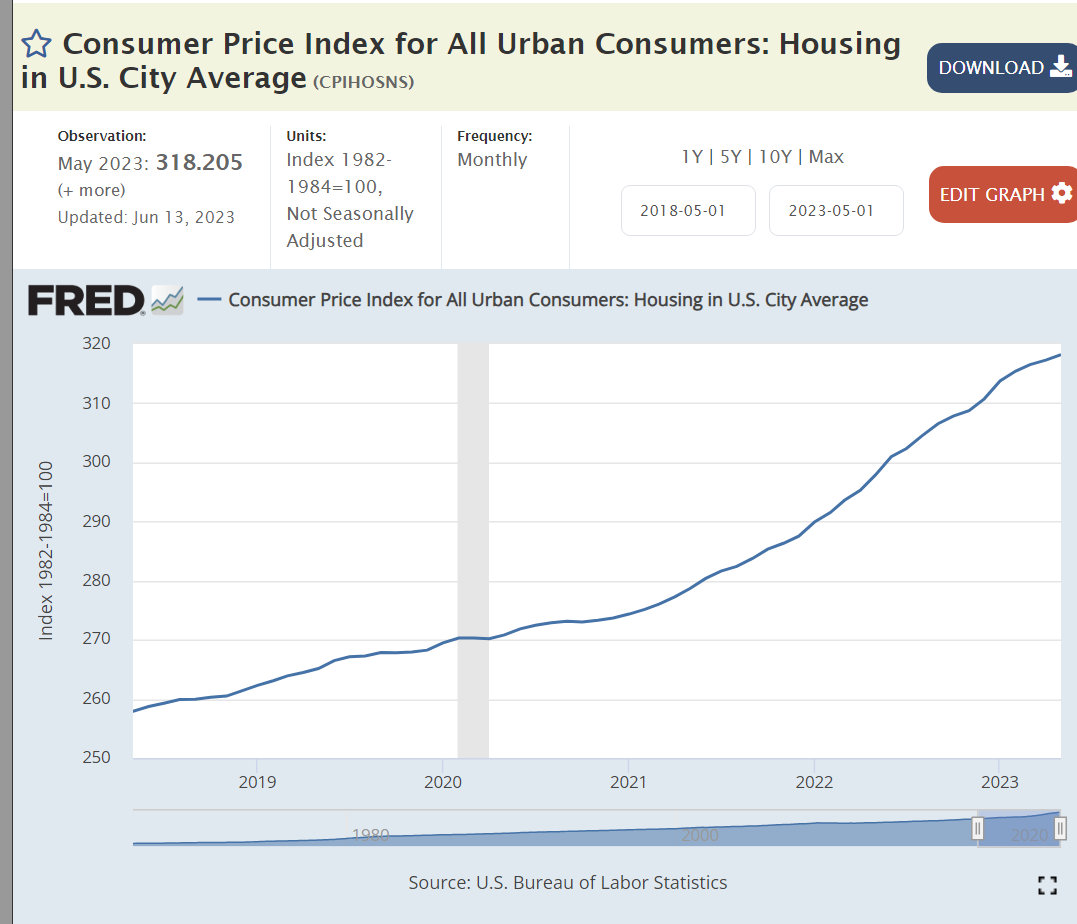
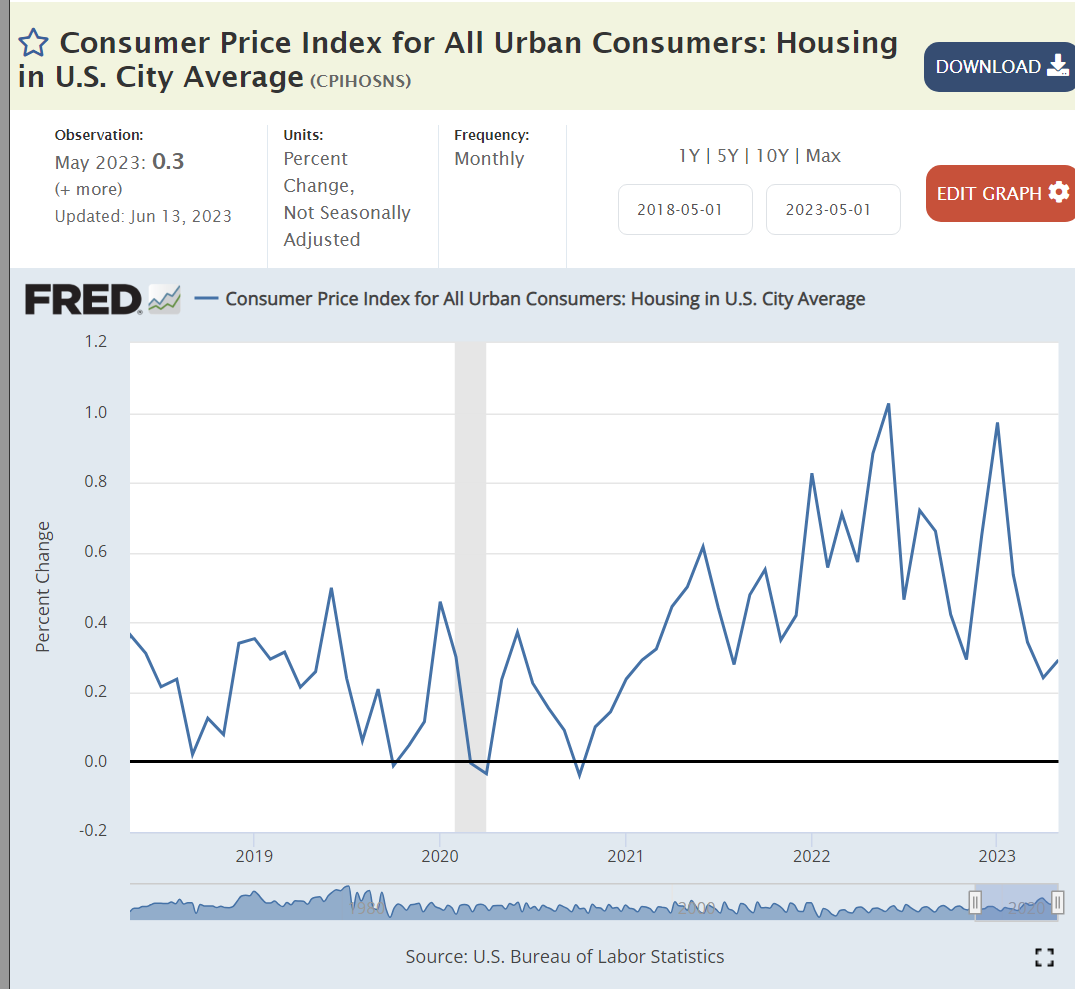
Housing inflation jumped up from 2% to 7% as the pandemic and subsequent Federal Reserve Bank mortgage interest rate increase disrupted the housing construction market. While housing inflation has declined from its peak, the long-term imbalance between supply and demand predicts some future inflation.

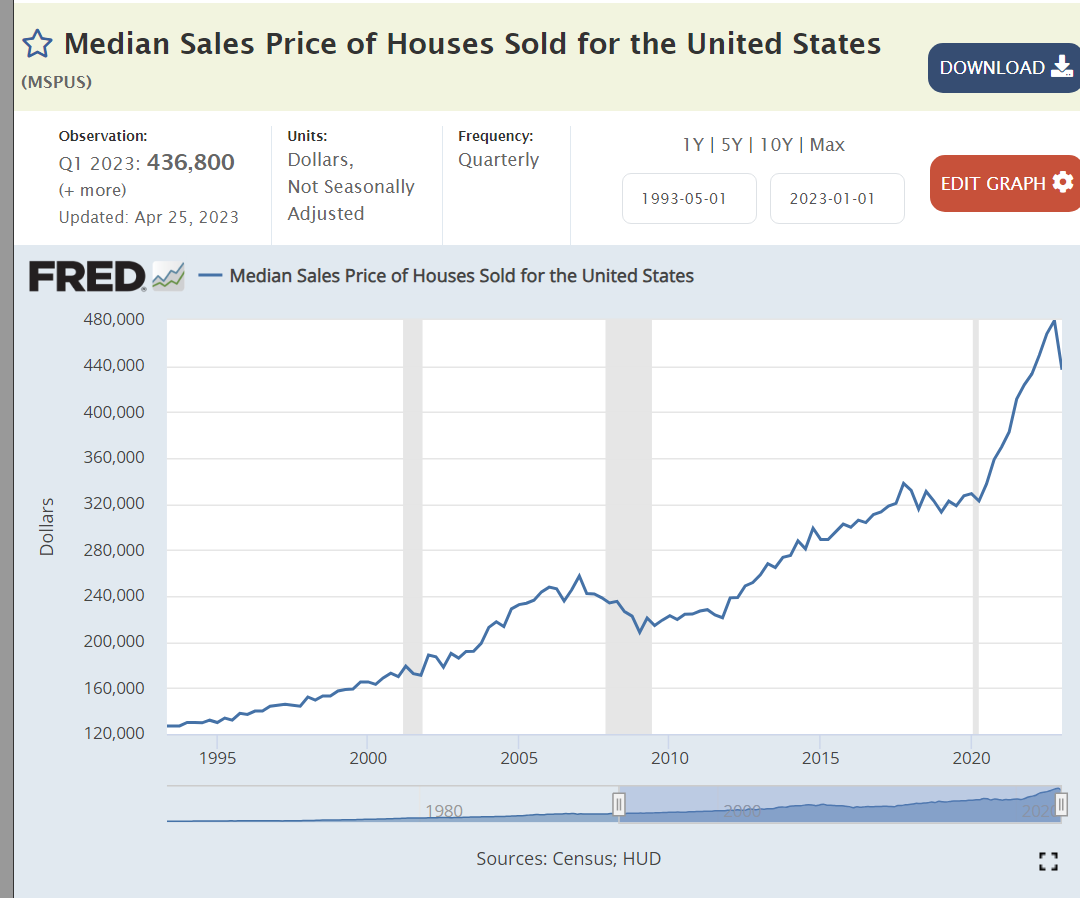
The 40% spike in home values was even higher than that shown for durable and nondurable goods. Flat prices make sense for the next year or two.

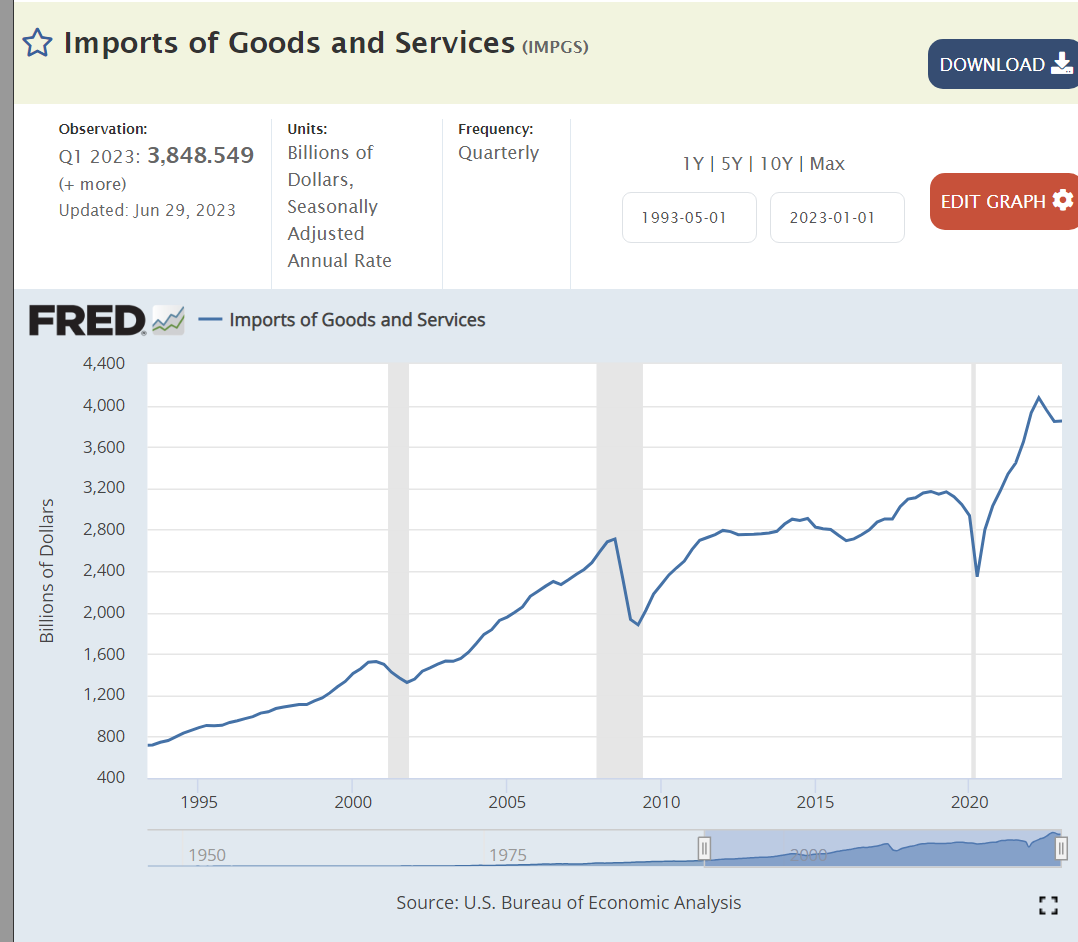
The jump in imports was driven by the increased demand for durable goods.

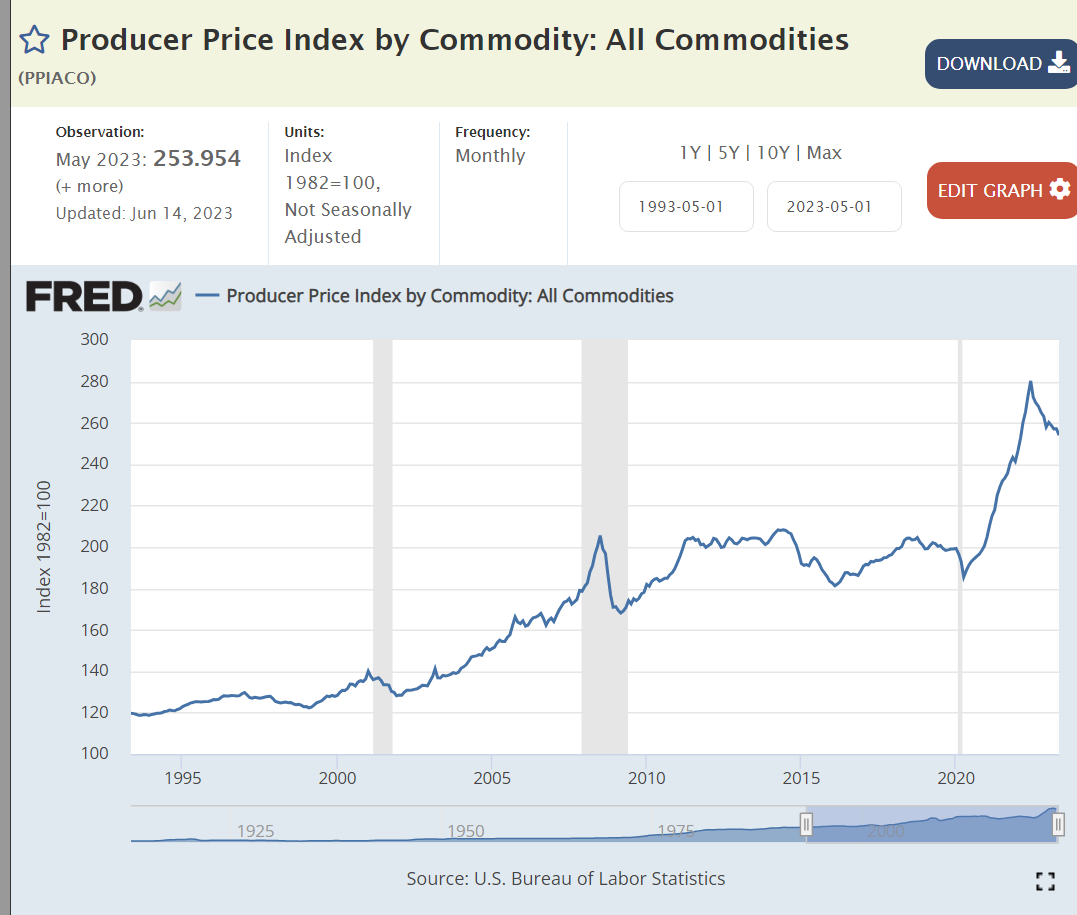
Producer prices were flat for 10 years, then up by 30%. No inflation remains, but some deflation is possible.

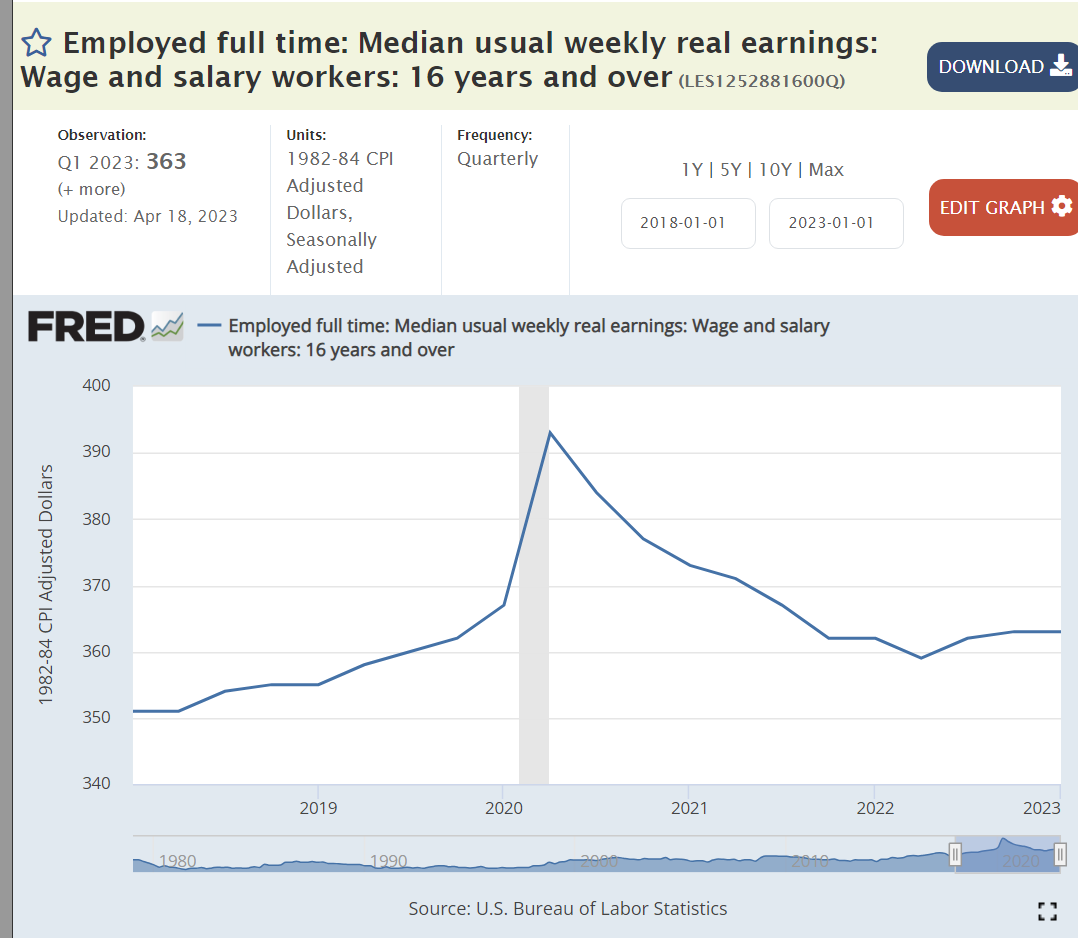
From 2015-20 historically high demand for labor drove a 7% increase in real wages as unemployment reached a 30 year low of 3.5%. For the last 3 years wages have trailed inflation. No wage-price spiral.

https://bipartisanpolicy.org/report/deficit-tracker/

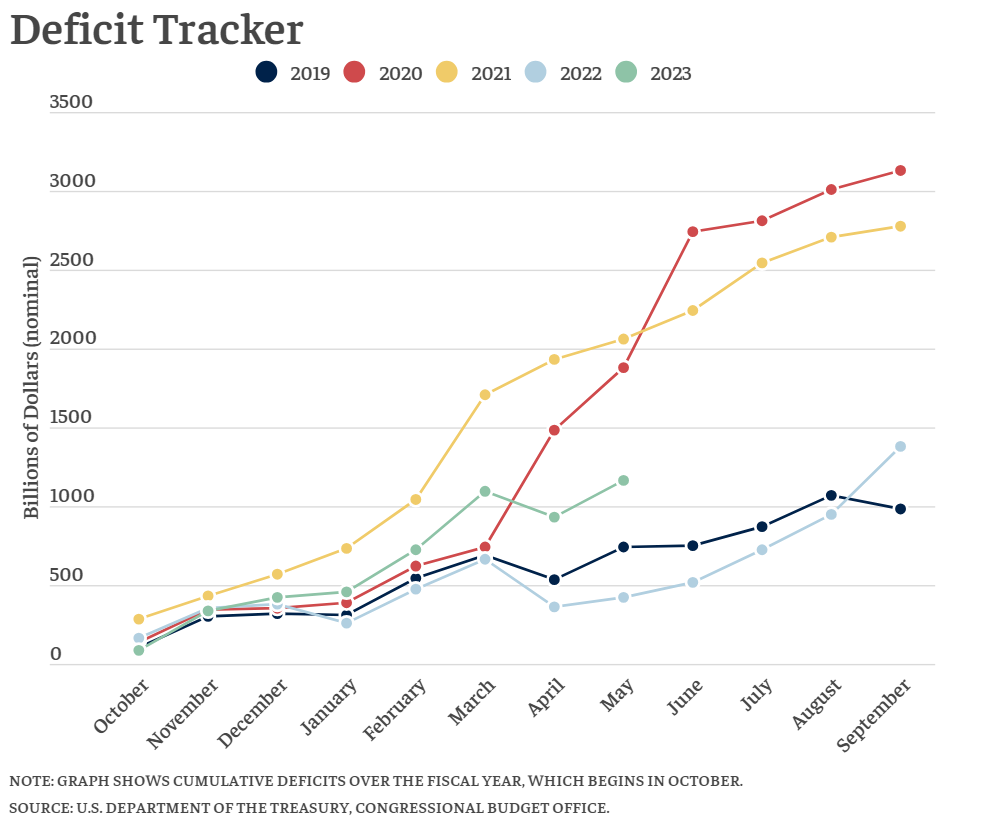
Until February, the federal government budget deficit had returned to the pre-pandemic 2019 pattern. In the last 3 months spending has accelerated, adding to aggregate demand and causing the economy to expand faster, perhaps beyond its limits, supporting greater price inflation.

The government response to the pandemic threat generated much greater savings and subsequent spending/aggregate demand than any recent recession situation. The benefits have now mostly run out. Consumer demand has remained high but will likely decline.

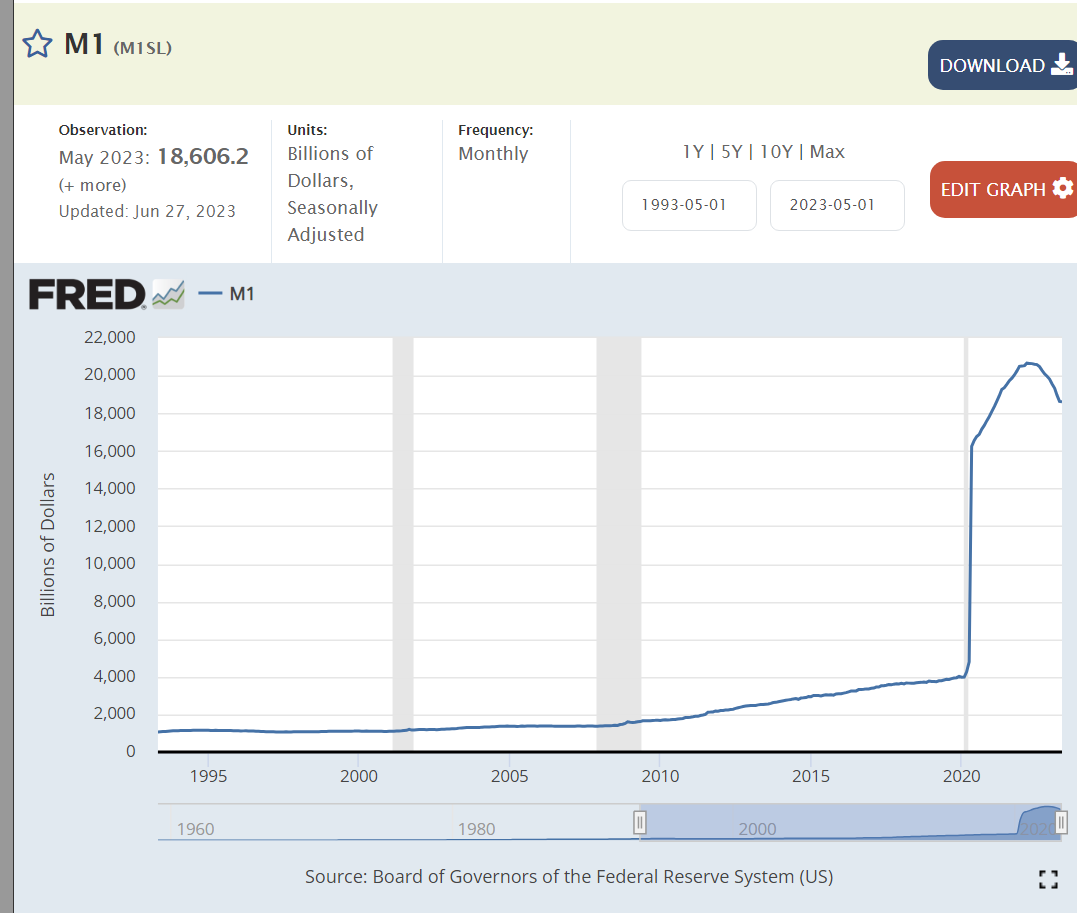
The unprecedented expansion of the money supply by the Federal Reserve Bank in 2020 is difficult to explain or analyze. The Fed responded to the clear risk of a banking system collapse by providing “loose money” access to all entities. This monetary expansion did not result in immediate consumer inflation, but it did help to inflate asset prices: investments and housing. The Fed has begun to reduce its holdings of assets as it tries to increase interest rates.

The Fed has more than doubled interest rates. This has slowed down the housing, stock and acquisition markets.

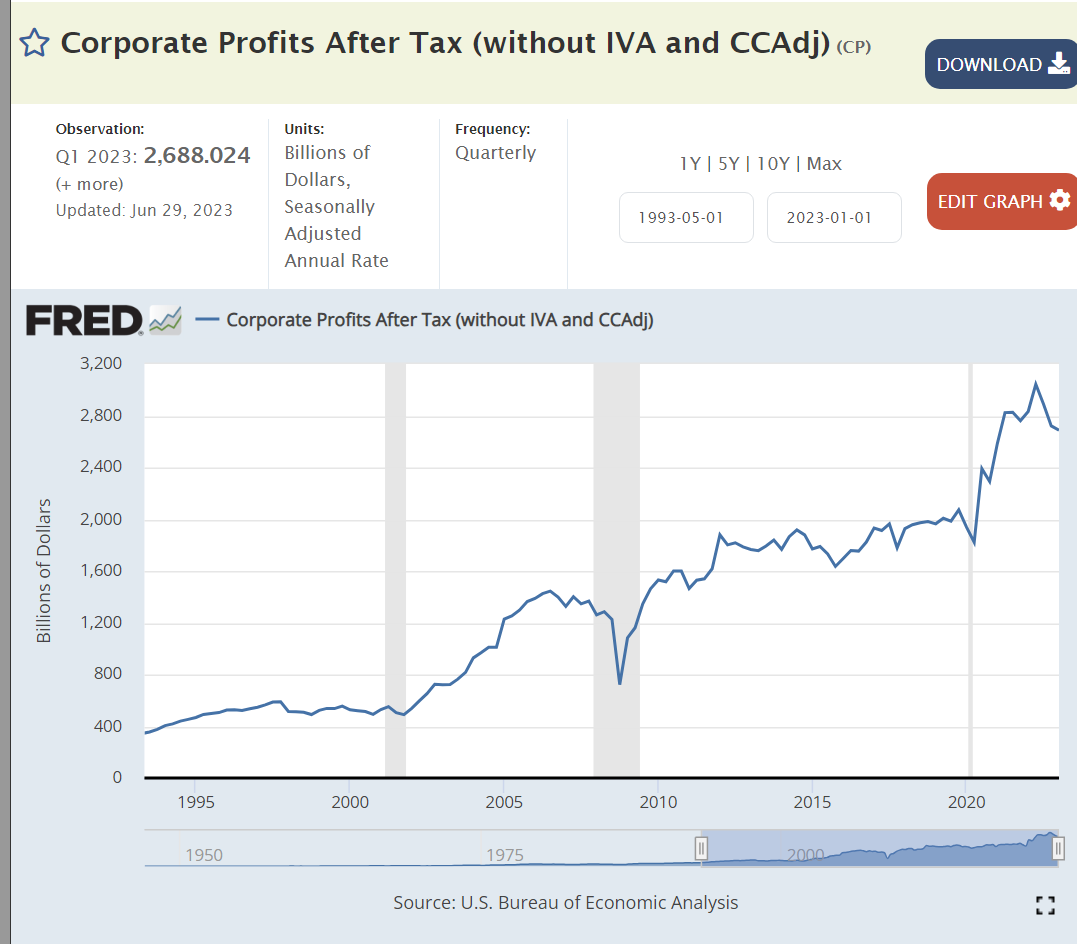
Corporate profits tripled from $500 billion in 2000 to $1.5 trillion in 2007. Profits slowly grew up to $2.0 trillion by 2019. Profits spiked by another 40% in response to the pandemic opportunities.

The drivers and components of inflation mostly point towards lower inflation in 2023 and 2024. The Fed is going to increase interest rates again this year which will reduce housing starts and corporate capital and inventory investments. The economy has so far resisted the higher interest rates, but the cumulative impact of tighter credit and lower savings will eventually offset the optimism of a historically positive labor market.

Summary

The pandemic caused producers to initially reduce their productive capacities. The unexpected rapid recovery of demand prompted by loose monetary and fiscal policies caused demand to greatly exceed supply. Inflation peaked at 7% and then began to drift back down. Corporations took advantage of the disruption to sharply increase prices, which have now flattened but not declined. Excessive fiscal policy (budget deficits) and high consumer spending driven by extremely tight labor markets driven by historically high corporate profits have maintained aggregate demand and prices.

There is a “tipping point” situation in this economy. The Fed is increasing interest rates. This is slowing consumer borrowing and housing demand in the face of demographic factors that normally promote new household formation and the economic benefits that typically accompany this investment. Consumers are using their pandemic driven savings to consume but are now running out of savings. The stock market very quickly recovered from the pandemic, but then declined and has since partially recovered based on a narrow set of AI based tech companies. The banking and credit sector is at risk, with several high-profile bankruptcies, but no clear evidence of a panic. Corporations are earning record profits, benefitting from prior low-cost debt, but struggling to hire employees. Overall, I think that prices will fall back to the 2% level by the middle of 2024.