Various global university rankings use different measures and methodologies. US universities lead the way in all major rankings, averaging 18 of the top 30 spots, good for 60% of all world leaders.
Few of us will consider attending these institutions, but they do educate many of our college professors, they educate many of our national business leaders and their research is used in most fields of endeavor.
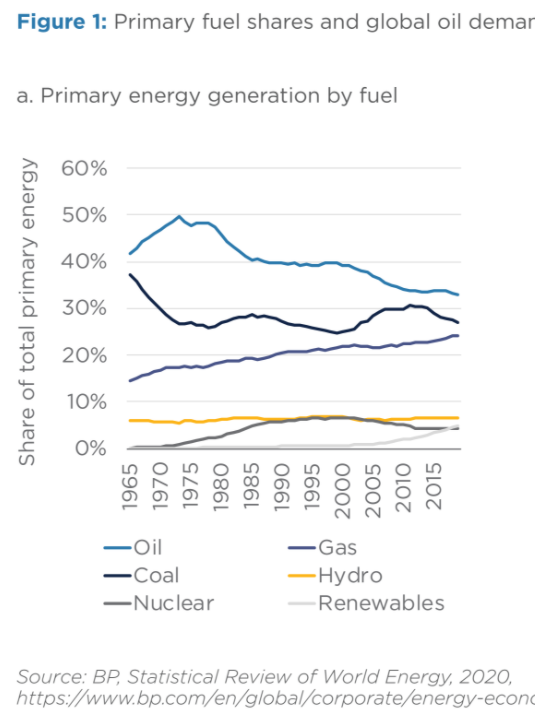
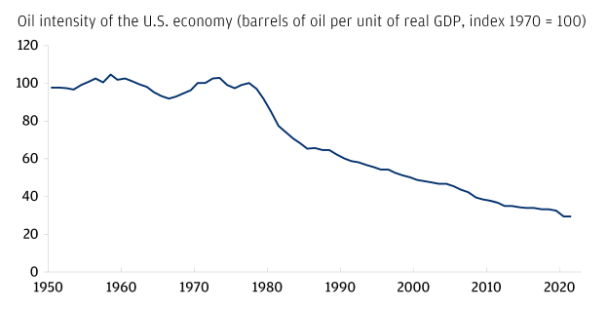
Energy intensity is down as the service economy becomes a greater share of GDP, energy efficiency improves for consumer and industrial uses, electricity power grows with its inherently higher efficiency, and renewable energy grows as a source of power.
Finally, individual country risks still matter: Russia, Iran, Venezuela and Saudi Arabia.
Summary
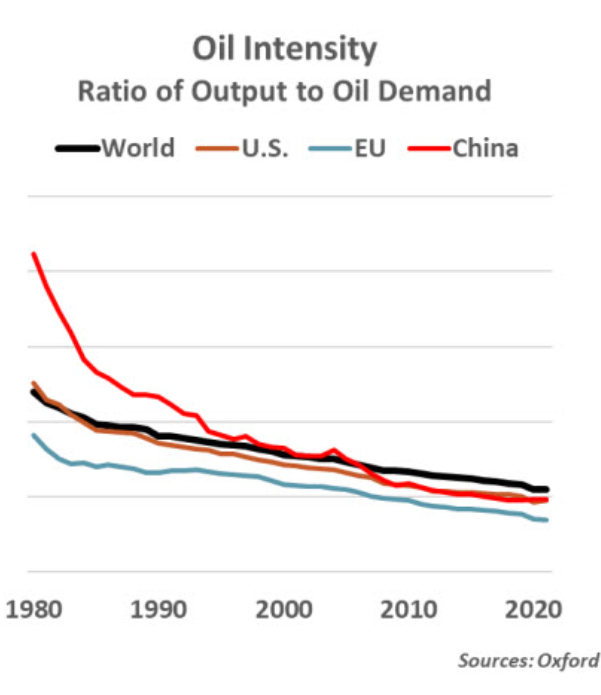
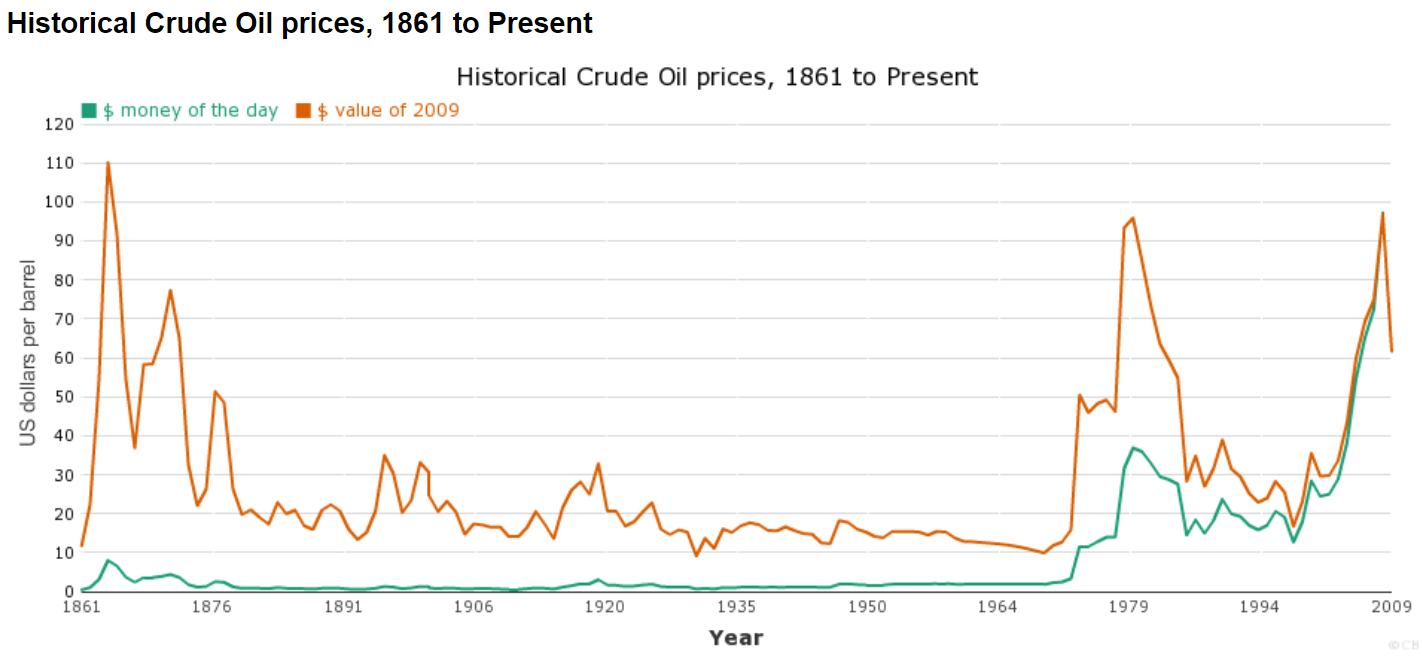
The Oil Shocks of the 1970’s were due to a drastic shift in the pricing power of the OPEC countries following 30 years of greatly accelerated global demand for oil while it was priced attractively. Demand and supply have both grown in the last 50 years. The role of oil in the global and US economies (compared with real output/GDP) has dropped by more than one-half. Increased oil prices can and will have a significant effect today, but less than one-half of that in the past. Long-run trends indicate that the role of oil as a critical resource will continue to decline, although there remain risks as the world closes coal and nuclear power plants and makes the investments required for a renewable energy world.
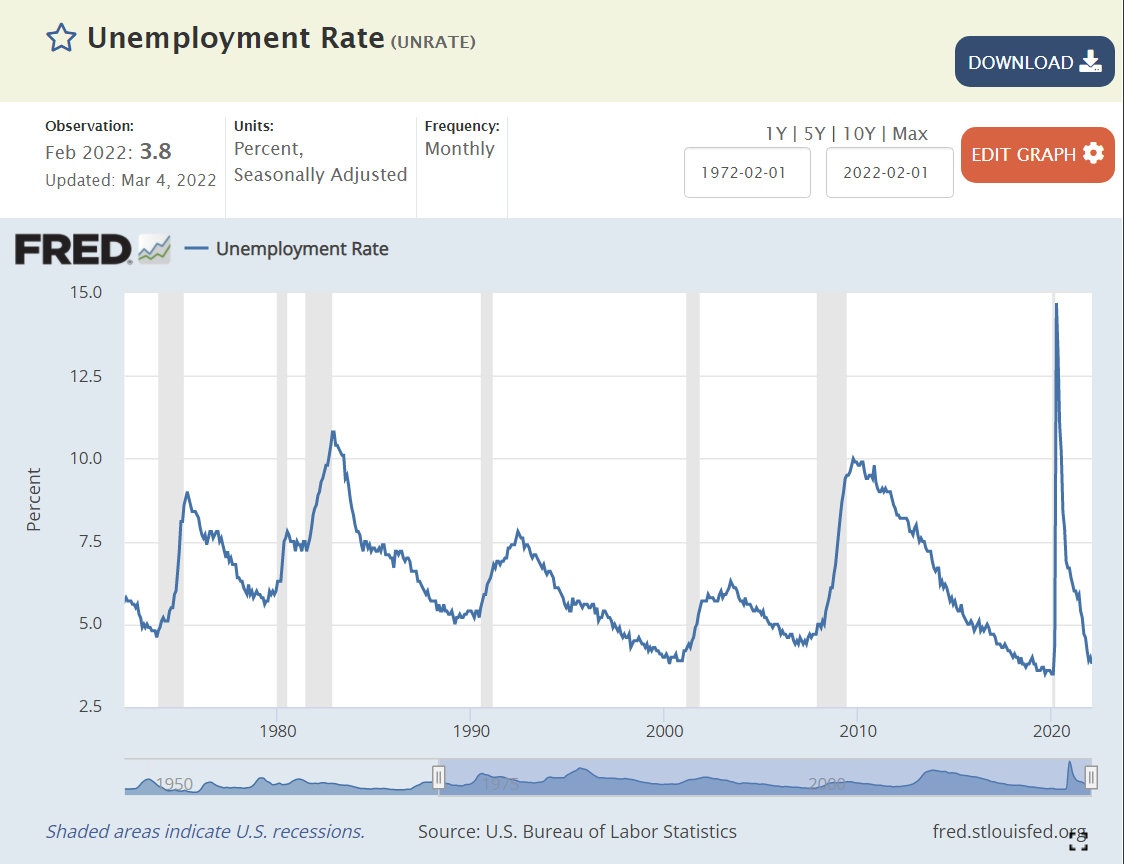
In the last 50 years, the last 600 months, the US unemployment rate has been below the current 3.8% for just 9 months (less than 2% of the time).
This is less than 2 years after the rate hit a modern HIGH of 15%.
9 states set all-time lows this month: Nebraska (2.1%), Vermont (2.1%), Indiana (2.3%), Kansas (2.5%), Montana (2.6%), Oklahoma (2.6%), Arkansas (3.1%), West Virginia (3.9%) and Mississippi (4.5%).
In February, 31 states had material decreases, while 19 had immaterial changes and NO states had material increases.
At the metropolitan area level, 50 areas sported unemployment rates of 3% or less, far below historical results.
11 areas were at crazy low 2.3% unemployment rates or lower: Lincoln, NE and Madison, Wi. Logan, Provo and Ogden UT. Elkhart, Columbus, Bloomington, Lafayette, Ft Wayne and Indianapolis, IN.
Typical vehicle age increased by one-quarter, from 9.6 to 12.1 years since 2002.
Typical vehicle age increased by more than one-half from 7.8 years in 1990.
Typical vehicle age more than doubled from just 5.3 years in 1969.
The rate of increase has remained relatively constant, with improved highways, driving, designs, quality and maintenance allowing the average age to increase by 1 year every 7-8 years.
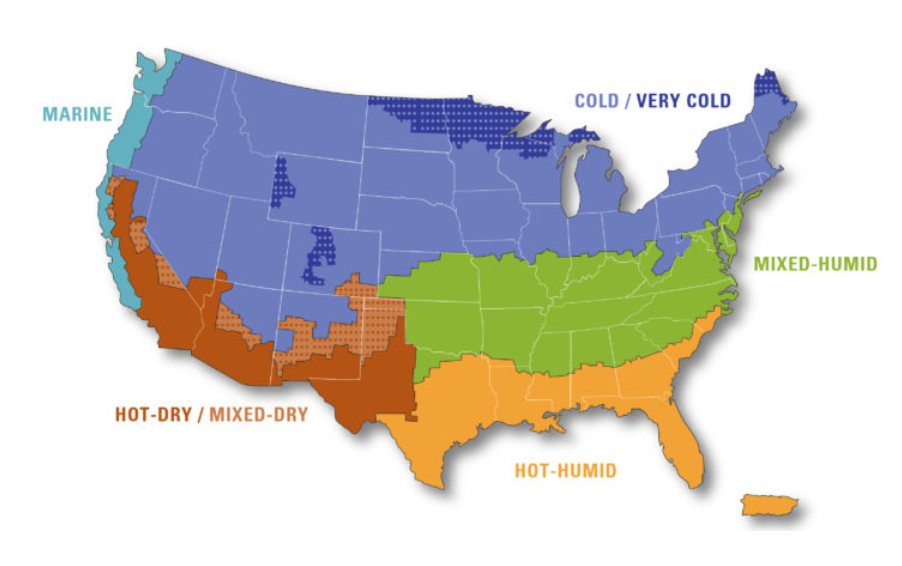
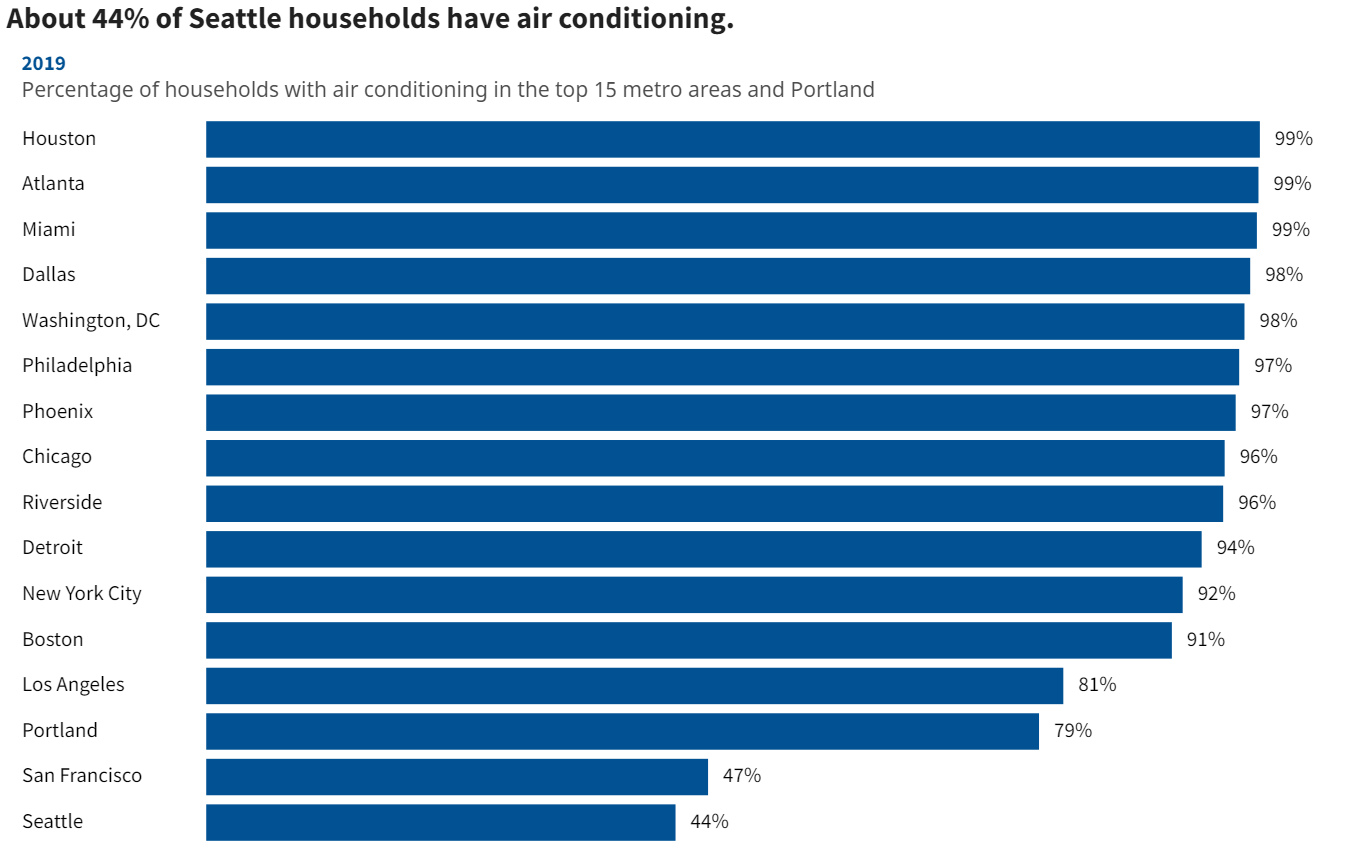
Air conditioning demand varies significantly by region/climate. AC use increased from 75-99% in the South, from 60-90% in the Midwest, from 50-85% in the northeast and from 40-60% in the West. AC demand varies based on peak temperatures, the number of days at peak temperature, the number of hours per day at peak temperature and the humidity (felt temperature). San Francisco, Portland and Seattle rarely “require” AC, even though their residents could afford this service.
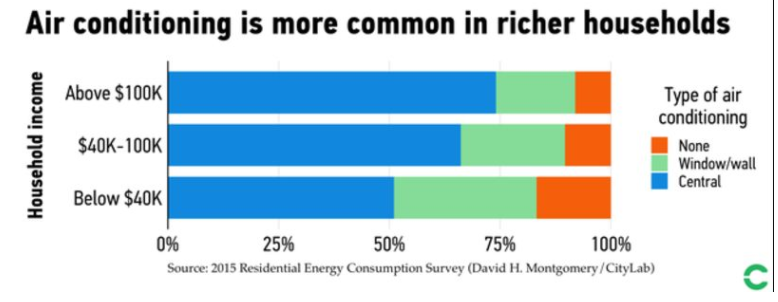
The US, Japan and Korea lead the world in households with air conditioning. China and Saudi Arabia are representative of moderate-income nations with relatively high AC usage. Most other nations, including the wealthier European nations, remain at very low rates of AC adoption (10%). This is a “good news” item for personal comfort, but not so good for energy consumption.