Good News: US and Immigrants

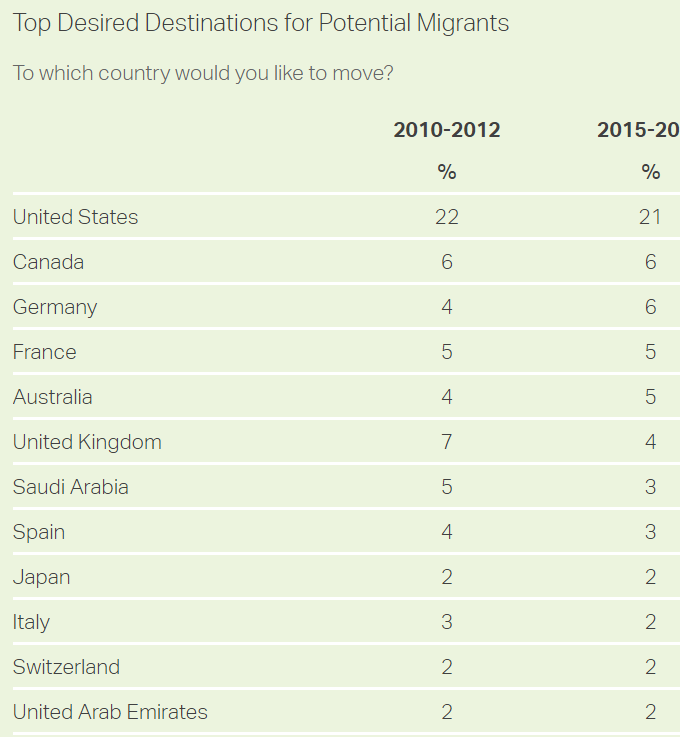
US is top desired destination for immigrants

https://news.gallup.com/poll/245255/750-million-worldwide-migrate.aspx

https://www.weforum.org/agenda/2017/11/these-are-the-countries-migrants-want-to-move-to/

New Zealand is Most Attractive Based on Immigrant Desires Per Destination Population

Best Countries to Migrate to

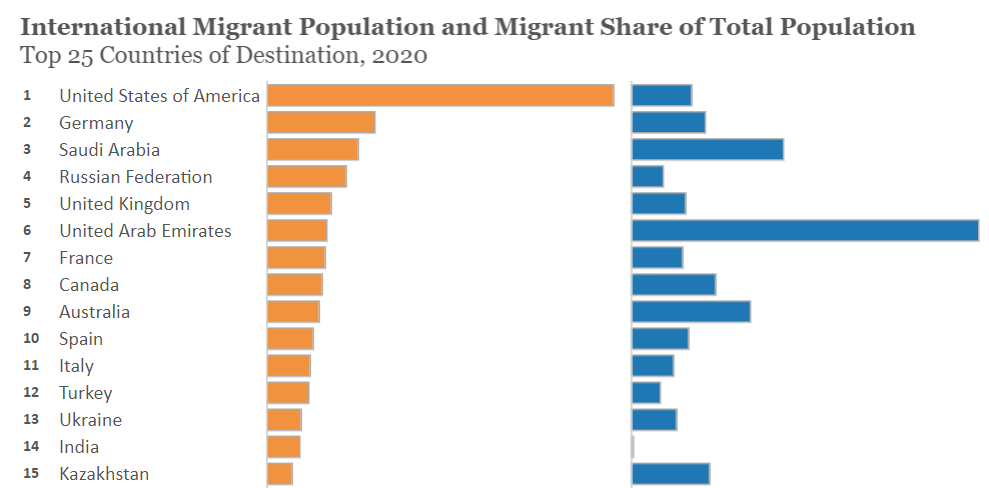
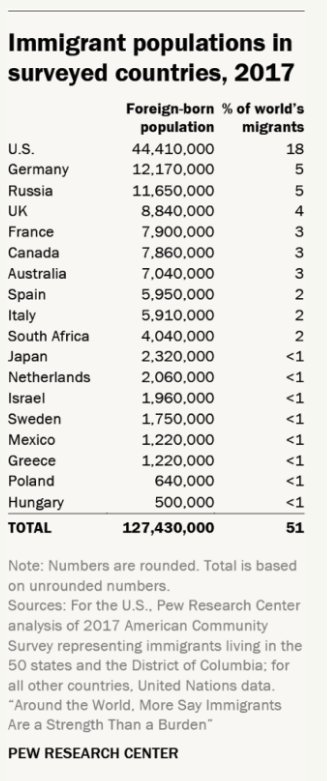
Immigrants “Vote With Their Feet”. 50 Million in US.

https://www.migrationpolicy.org/programs/data-hub/charts/top-25-destinations-international-migrants

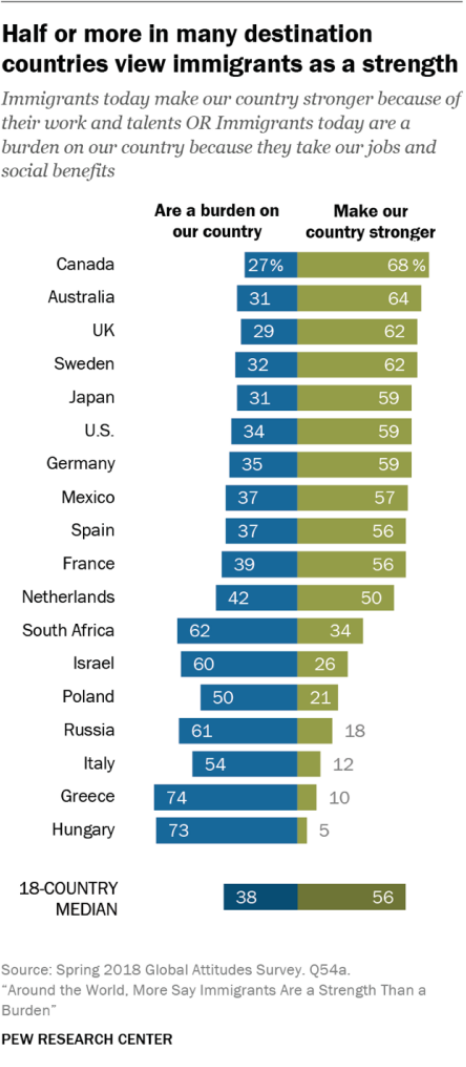
US Remains a Welcoming Country, Overall

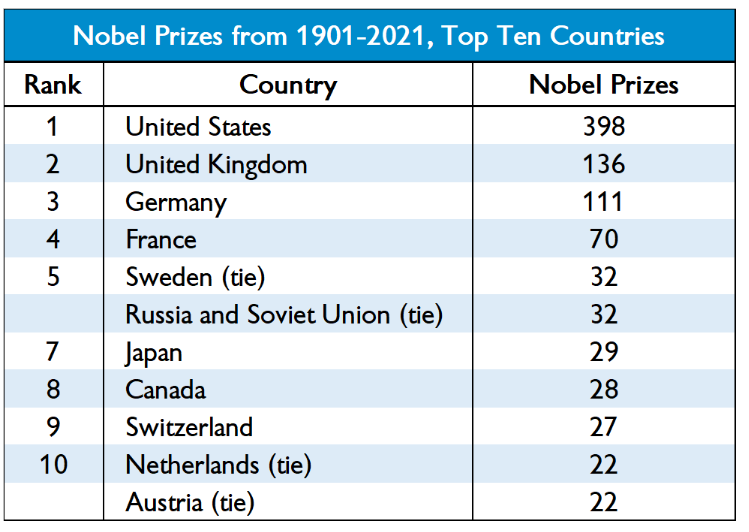
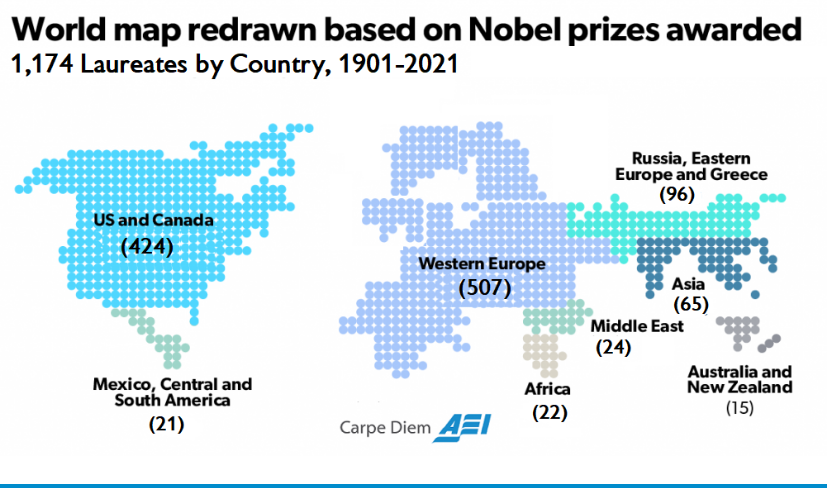
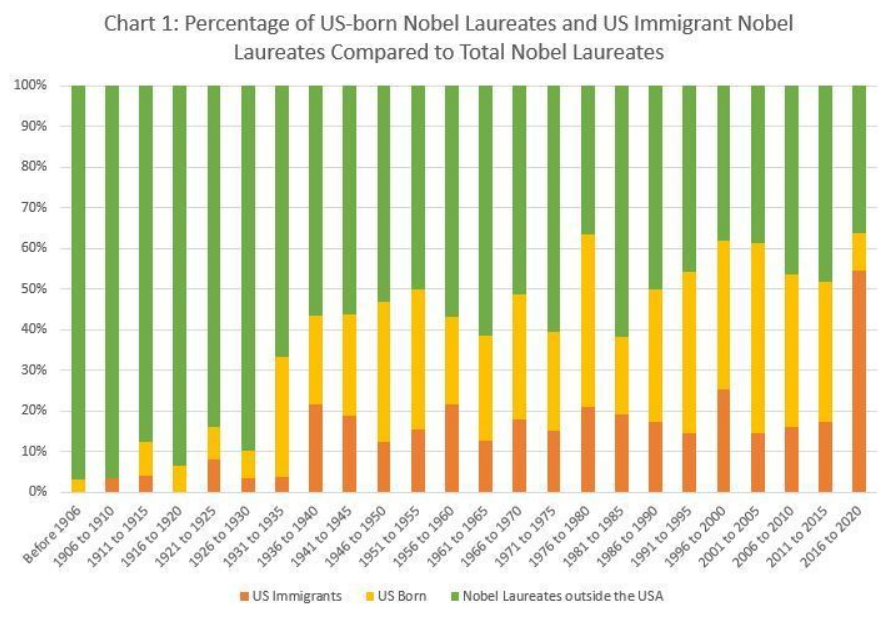
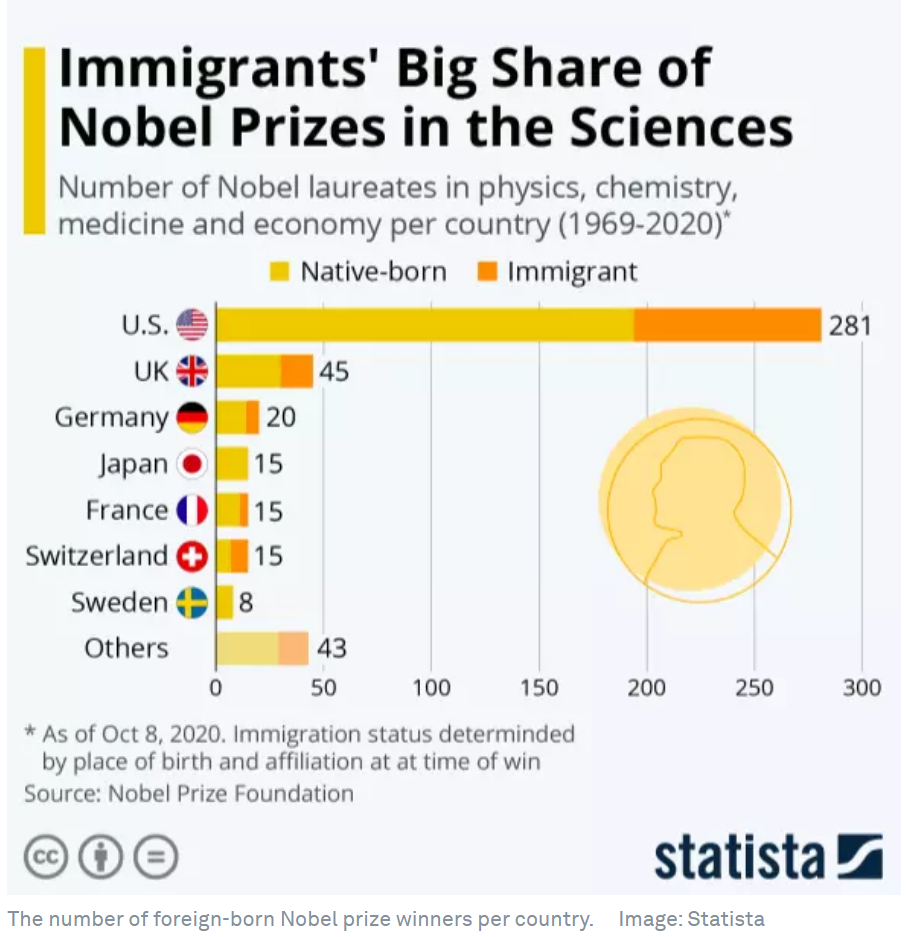
Good News: US Researchers Earn Half of All Nobel Prizes

https://iir.gmu.edu/publications/nobelprize/previous-years

https://d101vc9winf8ln.cloudfront.net/documents/41281/original/Nobel_Prize_Summary_2021.pdf?1634227855

https://www.weforum.org/agenda/2020/10/ex-pats-immigrants-nobel-prizes-laureates-science-chemistry-economics-physics-medicine

https://www.economist.com/graphic-detail/2018/05/10/the-hierarchy-of-countries-winning-nobels-in-the-sciences-is-shifting

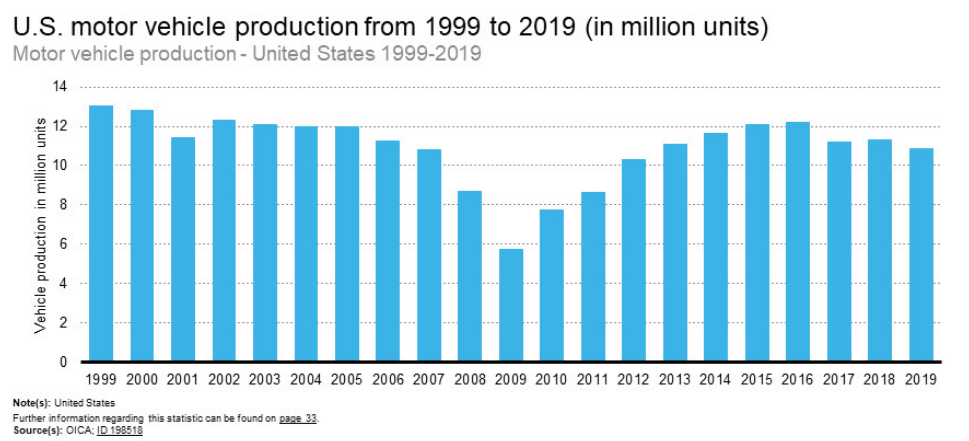
Good News: US (Still) Produces 10 Million Motor Vehicles Annually

https://www.thomasnet.com/articles/top-suppliers/car-manufacturers-in-usa/

https://www.ceicdata.com/en/indicator/united-states/motor-vehicle-production

US production is roughly same size as the EU, a larger developed market.

https://www.acea.auto/figure/eu-passenger-car-production/#:~:text=9.9%20million%20passenger%20cars%20were,during%20the%202010%2D2021%20period.

Japanese corporations produce about one-third of US output in the US. They export 400,000 vehicles from the US. Three-fourths of Japanese brand cars sold in the US are produced in the US. Japanese cars, on average, have more US (domestic) content than so-called American made cars.

https://www.autocarpro.in/feature/america-japanese-car-usa-26972

https://www.cnn.com/2019/06/26/business/japan-american-honda-hnk-intl/index.html

https://www.bizjournals.com/columbus/news/2016/06/01/japans-big-3-automakers-built-more-cars-in-u-s.html

https://www.cnbc.com/2019/05/21/japanese-automakers-tout-all-time-high-us-job-creation-pressure-on-trump.html

https://www.businessinsider.com/all-the-japanese-cars-made-in-the-usa-2017-11#toyota-avalon-toyota-motor-manufacturing-kentucky-georgetown-kentucky-13

https://www.detroitnews.com/story/business/autos/foreign/2019/06/25/american-made-cars-sold-us-japanese/39620085/

https://www.hotcars.com/11-foreign-cars-made-in-the-us-and-12-american-cars-that-arent/

https://www.motortrend.com/features/8-foreign-cars-might-surprised-made-america/

Good News: Living (Much) Longer

https://pubmed.ncbi.nlm.nih.gov/7565998/#:~:text=The%20average%20life%20expectancy%20in,France%2C%20England%2C%20and%20Japan.

https://www.populationpyramid.net/united-states-of-america/1950/

https://www.infoplease.com/us/health-statistics/life-expectancy-age-1850-2011

https://knoema.com/atlas/United-States-of-America/topics/Demographics/Age/Life-expectancy-at-age-80-years

https://www.ssa.gov/history/lifeexpect.html

https://www.ncbi.nlm.nih.gov/pmc/articles/PMC4861644/

https://www.infoplease.com/us/health-statistics/life-expectancy-age-1850-2011

It’s not all “good news”. Recent data indicates that life expectancy varies greatly between US states, counties, cities and census tracts. My hometown’s life expectancy is just 73.6 years, about 5% (3.7 years) less than the national average of 77.3 years. My suburban Indianapolis home for the last 30 years shows an 81.6 year life expectancy, about 5% (4.3 years) higher. That’s an 8 year (10%) difference between two midwestern cities.

https://www.rwjf.org/en/library/interactives/whereyouliveaffectshowlongyoulive.html

Latest Good News

Twice as many passport holders

American eagles recover from extinction threat

More voting in recent elections

Stable US steel production

Less smoking.

Record low unemployment

US universities lead global rankings

US is Energy Self-Sufficient

Flat real gas prices

Less oil/energy intensive economy

Good News: American Eagles Soar Again

Nests With Breeding Pairs Doubled in a Decade

https://www.npr.org/2021/03/25/981272794/once-imperiled-americas-bald-eagle-populations-are-soaring#:~:text=The%20number%20of%20bald%20eagles%20in%20the%20lower%2048%20U.S.,in%20other%20American%20bird%20populations.

https://www.smithsonianmag.com/smart-news/bald-eagle-populations-have-skyrocketed-last-decade-180977342/

Good News: Record Voter Turnout in 2018 and 2020 Elections

https://www.fairvote.org/voter_turnout#measuring_voter_turnout

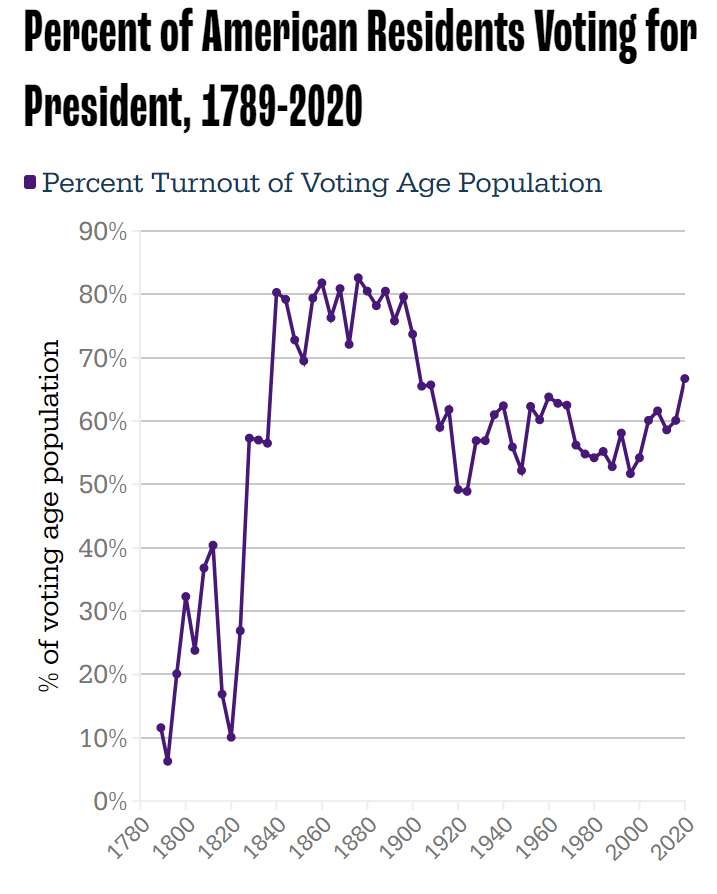
Setting aside turnout ratios, the growth in actual voters has been strong for a century. 40-48M voted in FDR’s elections. Kennedy and Nixon fought over 69M voters. Clinton and Bush, Sr. attracted 105M voters in 1992. But, Biden vs. Trump shattered records with 158M casting ballots.

Midterm Elections: 2018

https://www.fairvote.org/voter_turnout#voter_turnout_101

https://www.census.gov/library/stories/2019/04/behind-2018-united-states-midterm-election-turnout.html

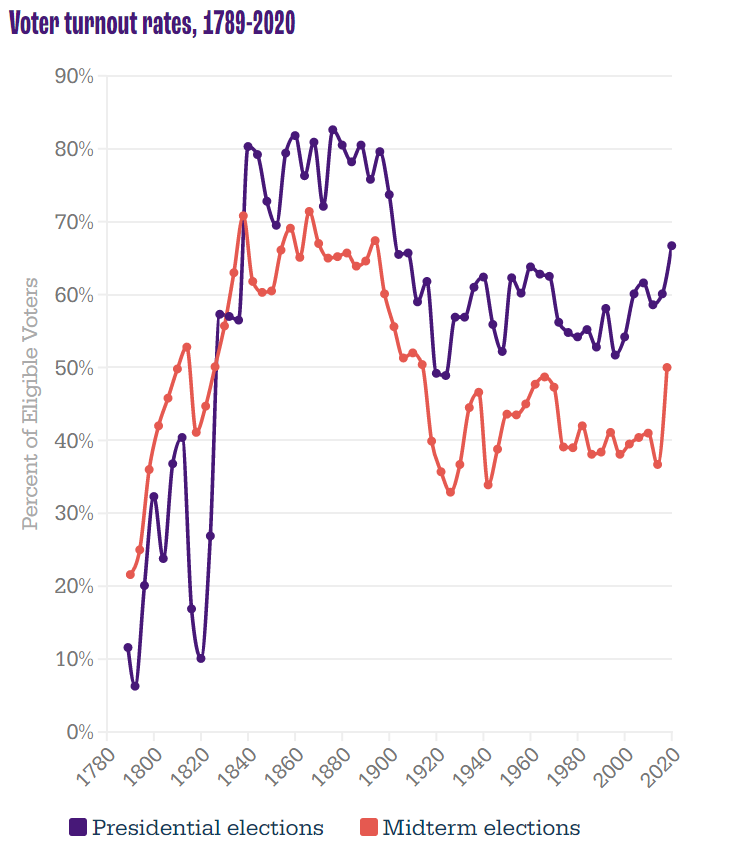
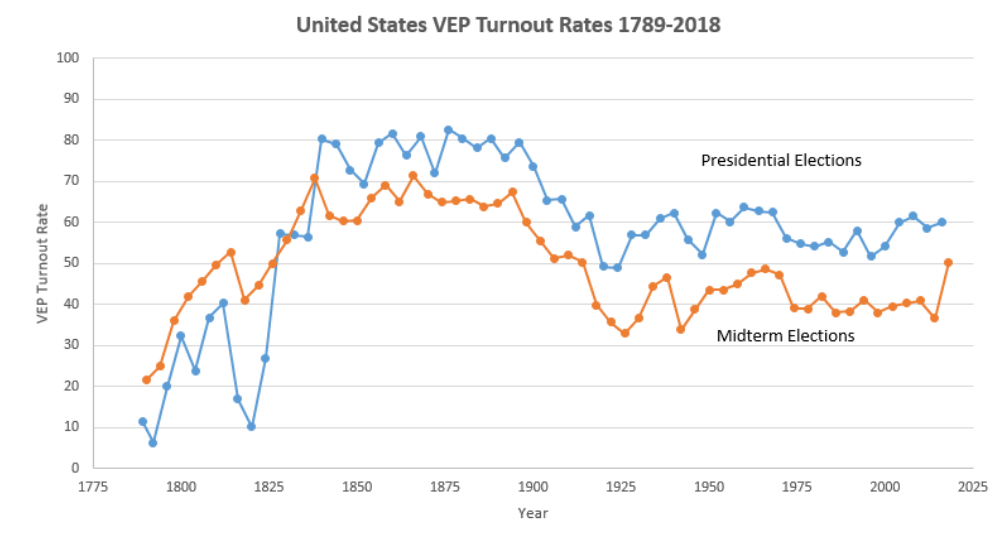
Midterm voting rates (as % of eligible voters) soared at 65% in the 19th century. They dropped to 50% at the start of the 20th century and then down to 45% for most of the 30’s to 60’s. They settled down to 40% thereafter. The 2018 election reached 50%, a full 13% points above the all-time low in 2014.

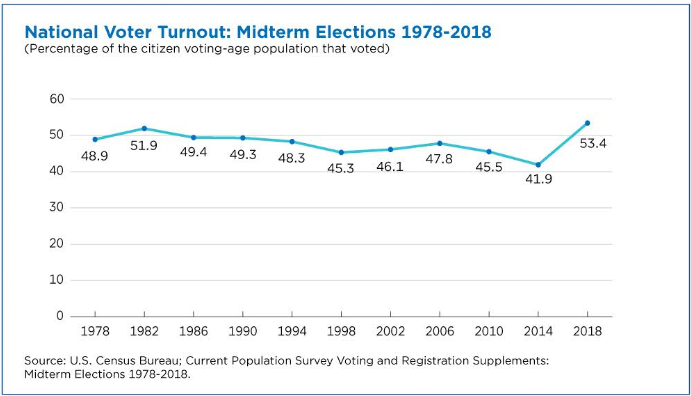
The slightly different measure, percentage of voting age population, shows the same pattern. 49% voting from 1978-94. Just 46% from 1998-2010. Record low of 42% in 2014, followed by an 11%-point climb to 53% in 2018.

https://www.census.gov/library/stories/2019/04/behind-2018-united-states-midterm-election-turnout.html

Younger voters increased their turnout by 14 points (18-44), while older voters increased by a solid 8%. High school or less educated voters increased turnout by 7 points, while college educated voters added 12 points.

Presidential Elections: 2020

https://www.fairvote.org/voter_turnout#measuring_voter_turnout

Long-term presidential and midterm voting (% of eligible voters) follows the same pattern. 80% turnout in the 19th century, dropping to 59% by 1912, then averaging 60% in the 30’s to 60’s. Further decline to just 55% for the 70’s-90’s. Minor increase to 60% in the oughts and teens, followed by 67% in 2020.

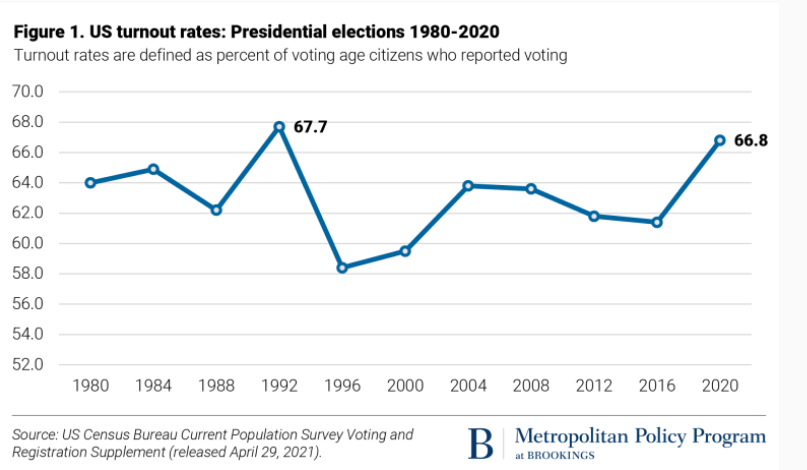
The more recent percent of voting age population shows 64% from 80-88, a one-time spike to 68% in 1992, decline to 59% from 96-200, slight increase to 61% for 04-16, and then a big jump to 67% in 2020.

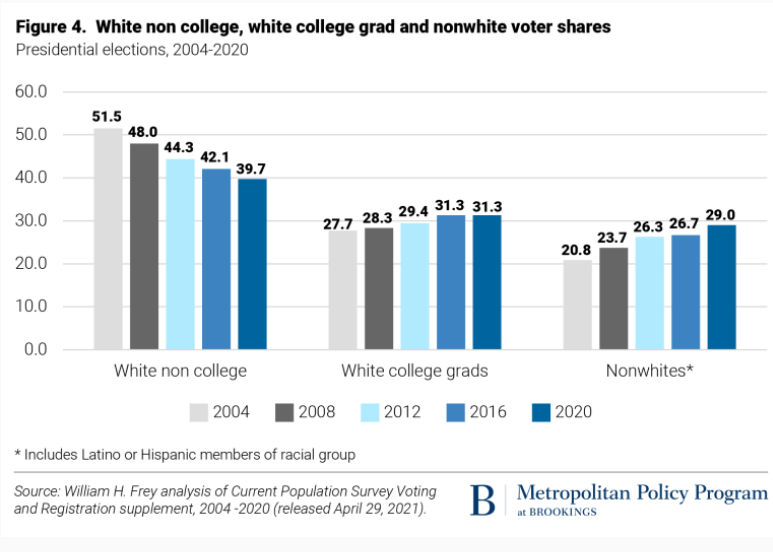
Turnout was up in all categories, but especially among Asian, 18-29 year olds and white non-college educated populations.

Voting by all racial groups of 18-24 year-olds was up significantly.

Other Sources Show The Same Results

http://www.electproject.org/national-1789-present

https://www.nationalaffairs.com/publications/detail/does-high-voter-turnout-help-one-party

The two measures (% of eligible voters and % of population) track closely. The “election project” numbers show VEP at 63% from 1952-68, declining to 58% for 72-00, increasing a little to 61% for 04-16, before spiking to 66% in 2020.

More Details

Income really matters for voter turnout, with rates ranging from one-third to one-half to two-thirds. With increased lower income support for the Republican party, this is less of a partisan issue today.

https://www.theatlantic.com/ideas/archive/2019/08/emerging-republican-majority/595504/

Since 1969, Democrats have argued that demographic trends will overturn Kevin Phillip’s description of the Emerging Republican Majority. This remains a hotly debated topic.

https://www.census.gov/library/stories/2019/04/behind-2018-united-states-midterm-election-turnout.html

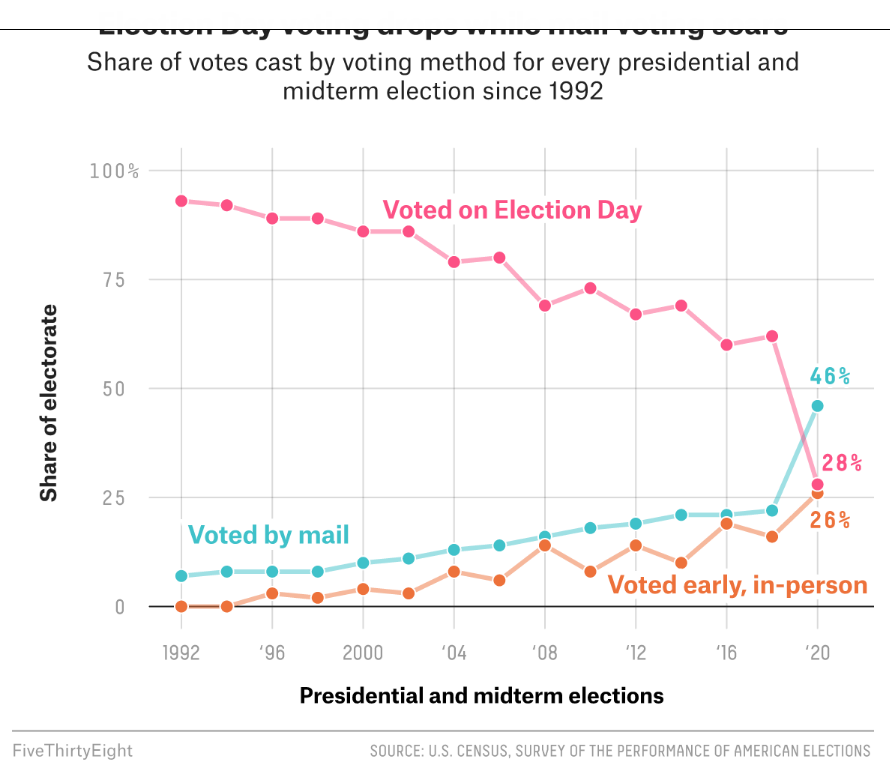
Election day voting decreased in 2018 and 2020 as mail and early, in-person voting increased. Many commentators claim that this change is a large driver of the increased turnout levels.

Good News: US Steel Production Steady Since 1980’s

Unfortunately, this followed a 30%+ decline from the 1970’s.

https://fred.stlouisfed.org/series/IPN3311A2RSQ

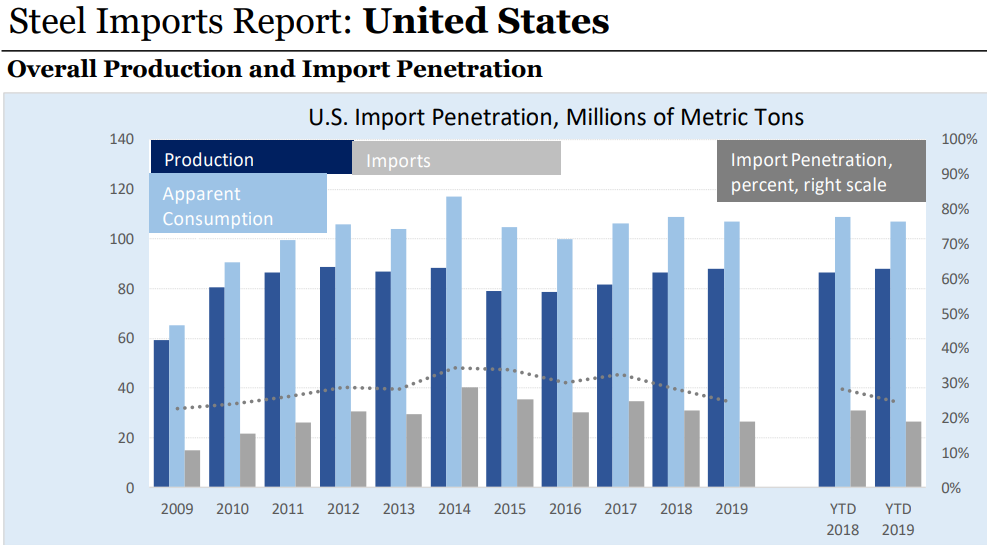
Finished Steel Imports Have 20% Market Share

Imported Steel Share of All Production is 30%

Canada, Mexico and Brazil Account for Half of US Steel Imports

US Steel Employment Has Levelled Off Since 2004

https://fred.stlouisfed.org/series/IPUEN331110W200000000

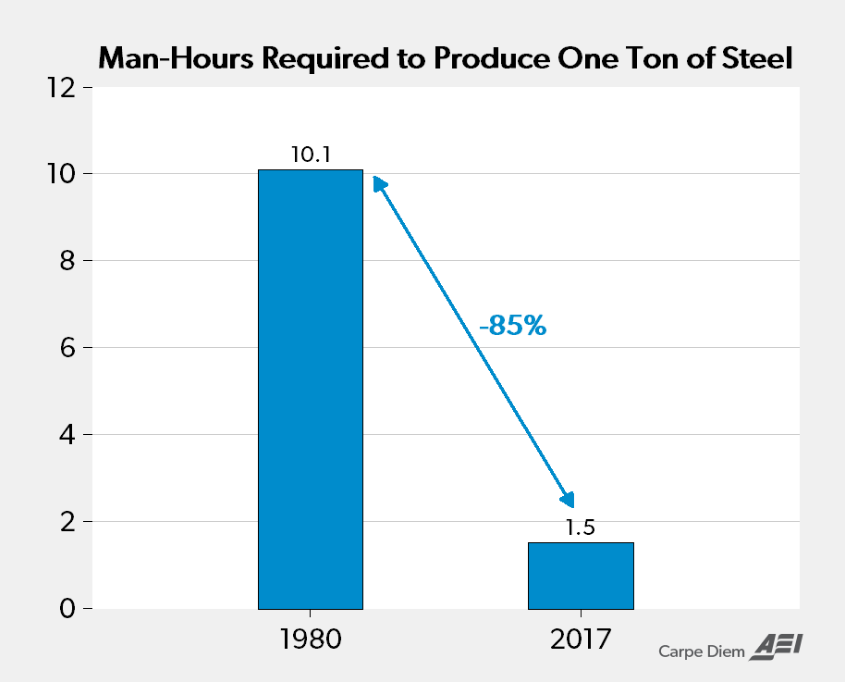
The reduction in employment has been due to improved productivity, not to imports.