
https://www.statista.com/statistics/804430/us-citzens-owning-a-passport/
https://travel.state.gov/content/travel/en/about-us/reports-and-statistics.html


https://www.npr.org/2021/03/25/981272794/once-imperiled-americas-bald-eagle-populations-are-soaring#:~:text=The%20number%20of%20bald%20eagles%20in%20the%20lower%2048%20U.S.,in%20other%20American%20bird%20populations.

https://www.fairvote.org/voter_turnout#measuring_voter_turnout
Setting aside turnout ratios, the growth in actual voters has been strong for a century. 40-48M voted in FDR’s elections. Kennedy and Nixon fought over 69M voters. Clinton and Bush, Sr. attracted 105M voters in 1992. But, Biden vs. Trump shattered records with 158M casting ballots.
https://www.fairvote.org/voter_turnout#voter_turnout_101
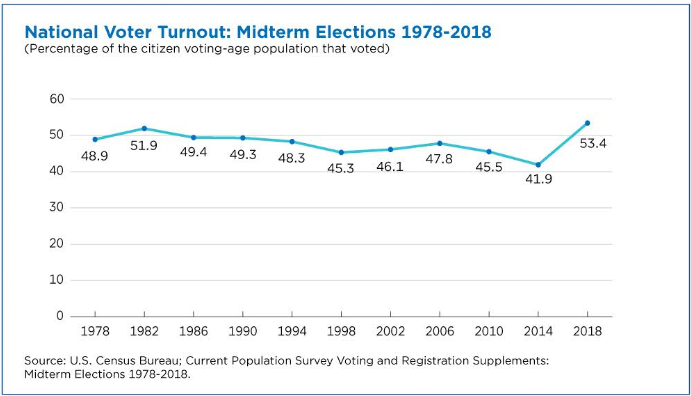
Midterm voting rates (as % of eligible voters) soared at 65% in the 19th century. They dropped to 50% at the start of the 20th century and then down to 45% for most of the 30’s to 60’s. They settled down to 40% thereafter. The 2018 election reached 50%, a full 13% points above the all-time low in 2014.
The slightly different measure, percentage of voting age population, shows the same pattern. 49% voting from 1978-94. Just 46% from 1998-2010. Record low of 42% in 2014, followed by an 11%-point climb to 53% in 2018.


Younger voters increased their turnout by 14 points (18-44), while older voters increased by a solid 8%. High school or less educated voters increased turnout by 7 points, while college educated voters added 12 points.
https://www.fairvote.org/voter_turnout#measuring_voter_turnout
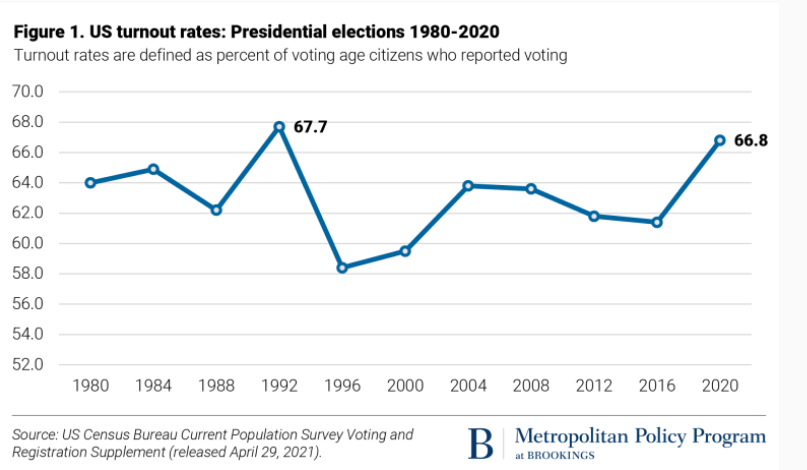
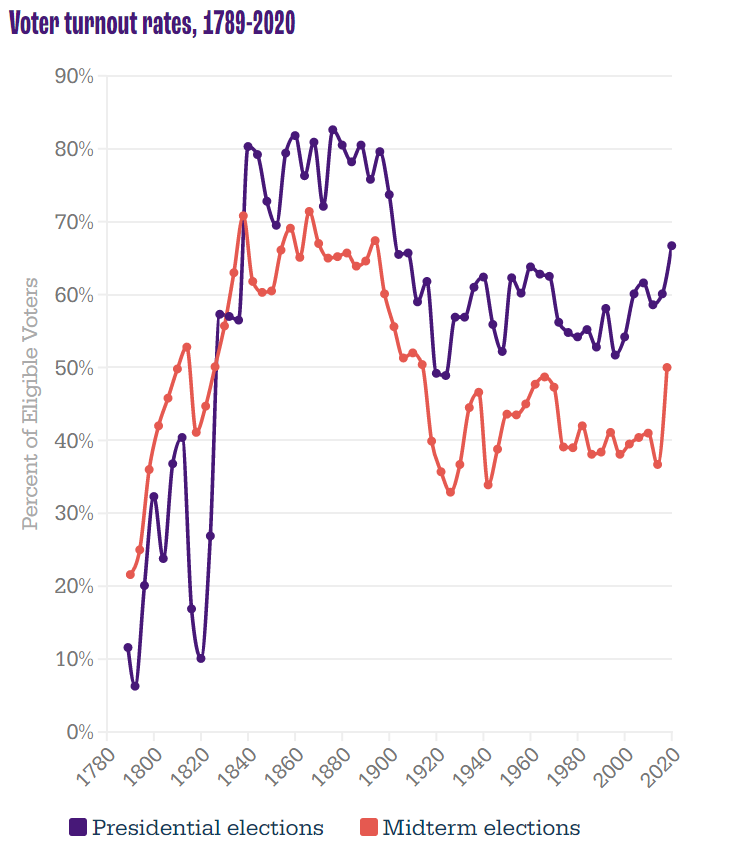
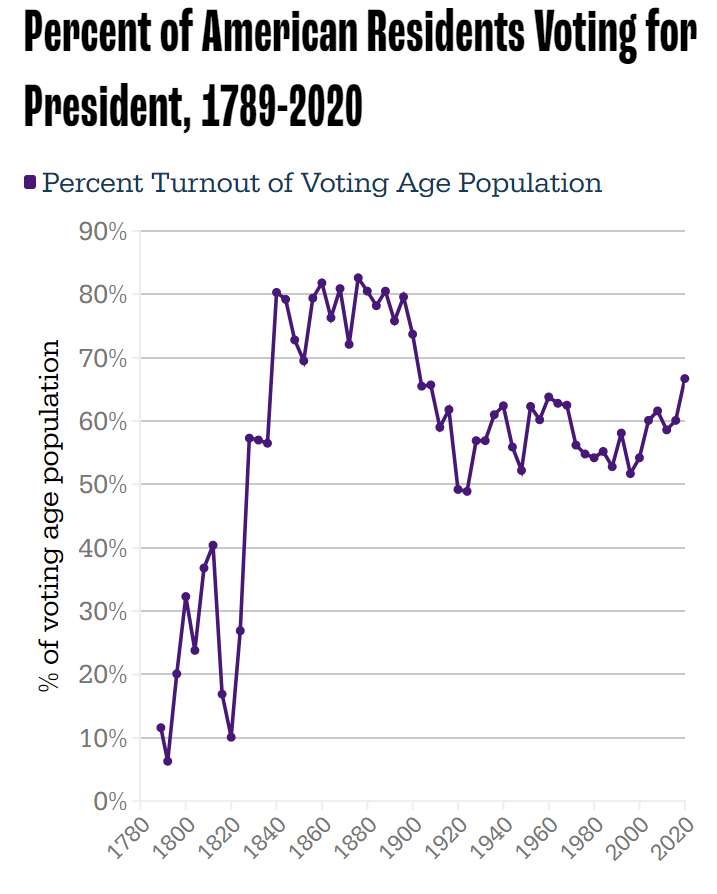
Long-term presidential and midterm voting (% of eligible voters) follows the same pattern. 80% turnout in the 19th century, dropping to 59% by 1912, then averaging 60% in the 30’s to 60’s. Further decline to just 55% for the 70’s-90’s. Minor increase to 60% in the oughts and teens, followed by 67% in 2020.
The more recent percent of voting age population shows 64% from 80-88, a one-time spike to 68% in 1992, decline to 59% from 96-200, slight increase to 61% for 04-16, and then a big jump to 67% in 2020.

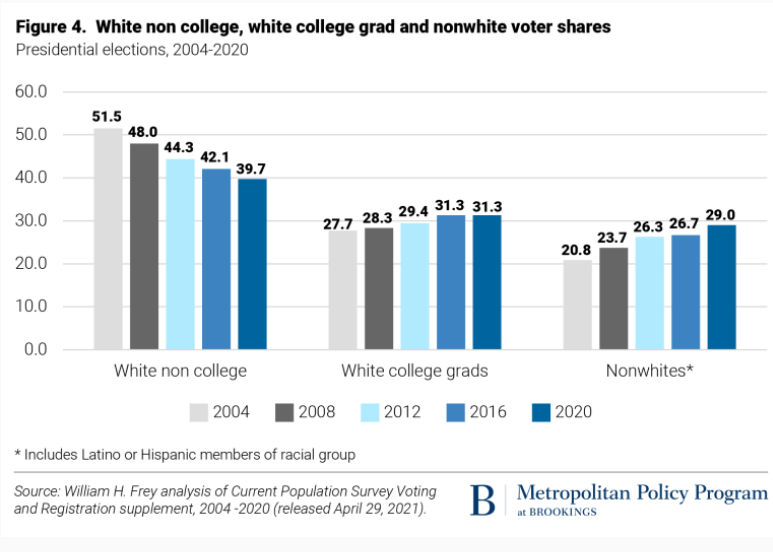
Turnout was up in all categories, but especially among Asian, 18-29 year olds and white non-college educated populations.

Voting by all racial groups of 18-24 year-olds was up significantly.
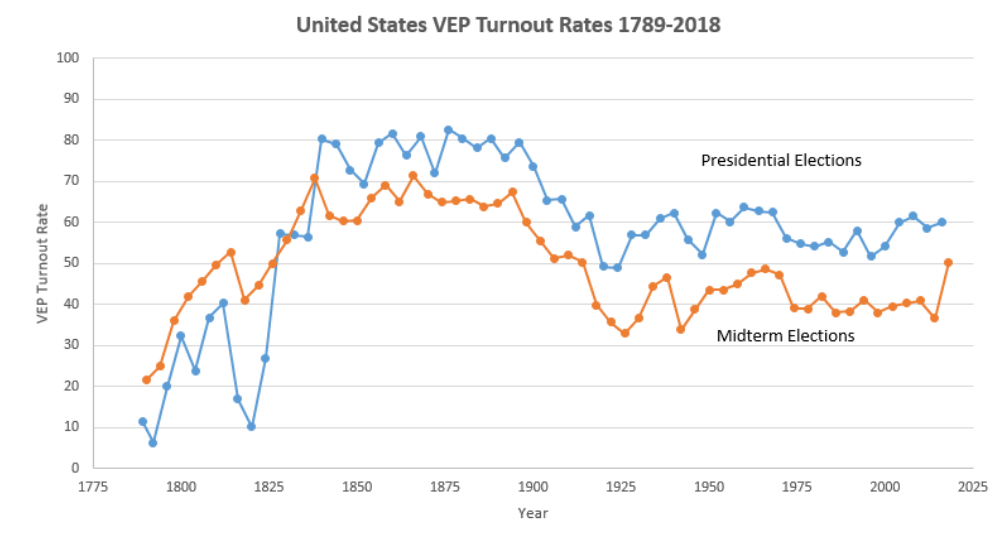
http://www.electproject.org/national-1789-present

https://www.nationalaffairs.com/publications/detail/does-high-voter-turnout-help-one-party
The two measures (% of eligible voters and % of population) track closely. The “election project” numbers show VEP at 63% from 1952-68, declining to 58% for 72-00, increasing a little to 61% for 04-16, before spiking to 66% in 2020.

Income really matters for voter turnout, with rates ranging from one-third to one-half to two-thirds. With increased lower income support for the Republican party, this is less of a partisan issue today.
https://www.theatlantic.com/ideas/archive/2019/08/emerging-republican-majority/595504/
Since 1969, Democrats have argued that demographic trends will overturn Kevin Phillip’s description of the Emerging Republican Majority. This remains a hotly debated topic.

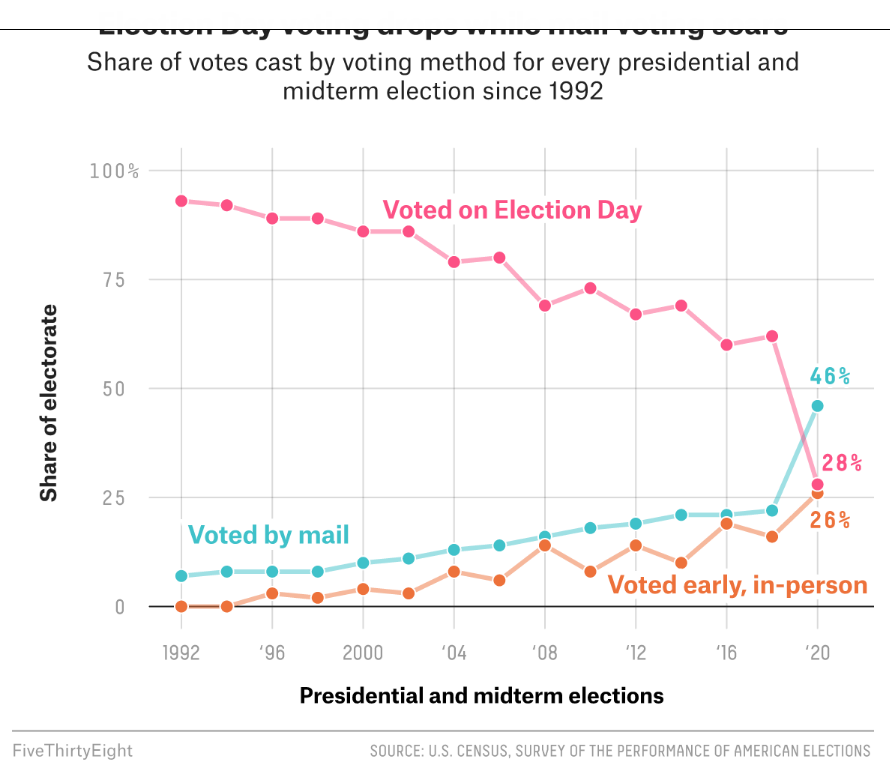
Election day voting decreased in 2018 and 2020 as mail and early, in-person voting increased. Many commentators claim that this change is a large driver of the increased turnout levels.

Unfortunately, this followed a 30%+ decline from the 1970’s.

https://fred.stlouisfed.org/series/IPN3311A2RSQ



https://fred.stlouisfed.org/series/IPUEN331110W200000000
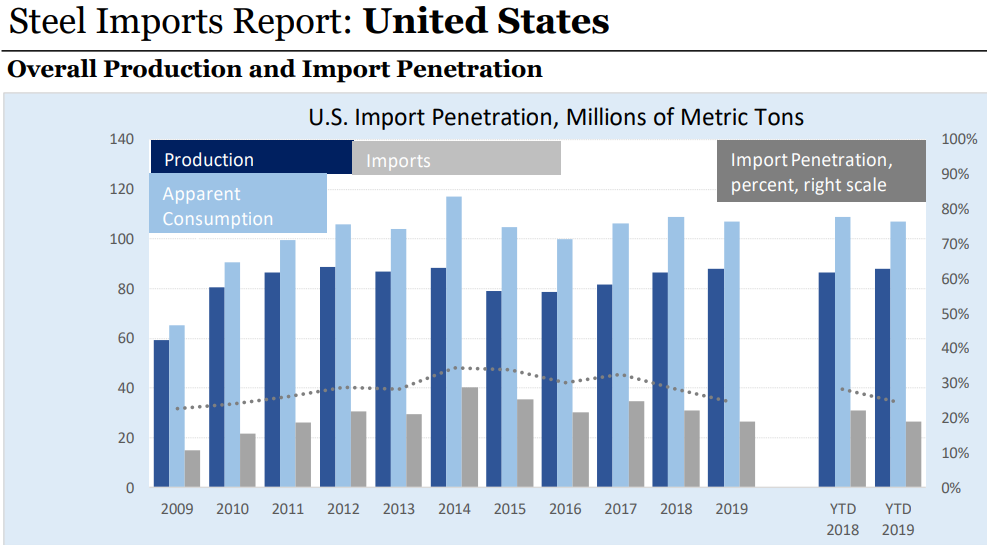
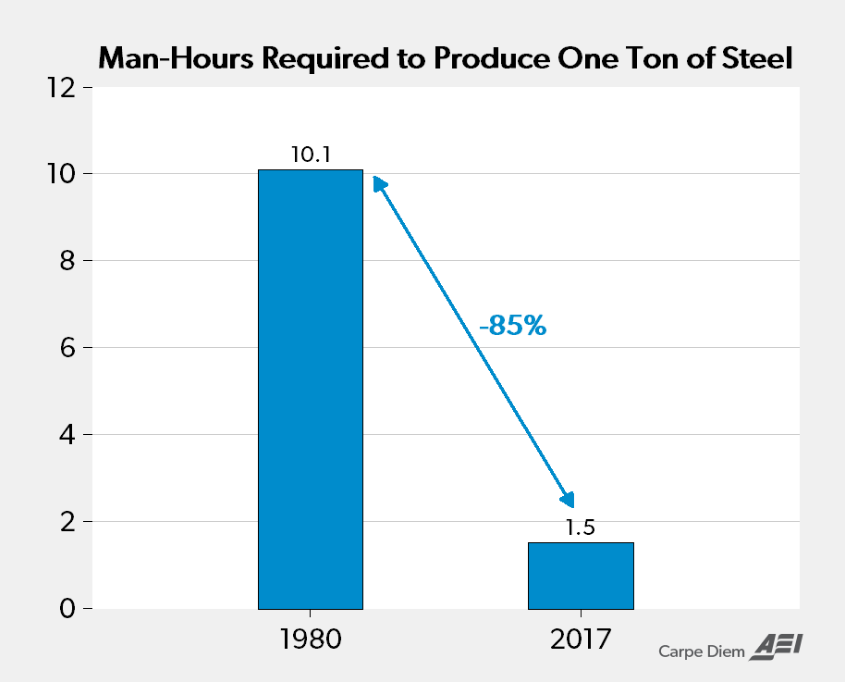
The reduction in employment has been due to improved productivity, not to imports.


https://fred.stlouisfed.org/series/UNRATE

Nebraska, Utah, Indiana, Kansas, Arkansas, Mississippi, Montana, Oklahoma and West Virginia. The Republican leaning states are “winning”. The Bureau of Labor Statistics (BLS) has been reporting state data since 1976, so this is a GREAT result.
https://www.bls.gov/news.release/laus.nr0.htm
27 states reported unemployment rates below the optimistic “full employment” level of 4%. Another 17 were in the 4.0-4.9% range. Just 6 states were burdened with unemployment rates above 5.0%, with New Mexico at 5.6% the highest.
https://www.bls.gov/web/laus/laumstrk.htm
Salt Lake City, Indianapolis, Oklahoma City and Atlanta set new records.
Geographically dispersed Nashville, Tampa, San Jose, Phoenix and Louisville are very close to setting new records.
https://fred.stlouisfed.org/series/SALT649URN
https://fred.stlouisfed.org/series/INDI918URN
https://fred.stlouisfed.org/series/OKLA440URN
https://fred.stlouisfed.org/series/ATLA013URN
As with the states, the distribution of results for the 51 metro areas with 1 million + populations is quite convincing. 8 metro areas are below the “unsustainable” 3.0% gold standard. 29 metro areas are below the 4.0% “full employment” level. 43 metro areas are below 5%. 8 areas exceed 5%. Detroit is second worst at 5.4%. Cleveland is in last place, struggling with 6.4%.
https://www.bls.gov/web/metro/laulrgma.htm
https://fred.stlouisfed.org/series/JTSJOL

https://fred.stlouisfed.org/series/PAYEMS

https://fred.stlouisfed.org/series/CIVPART
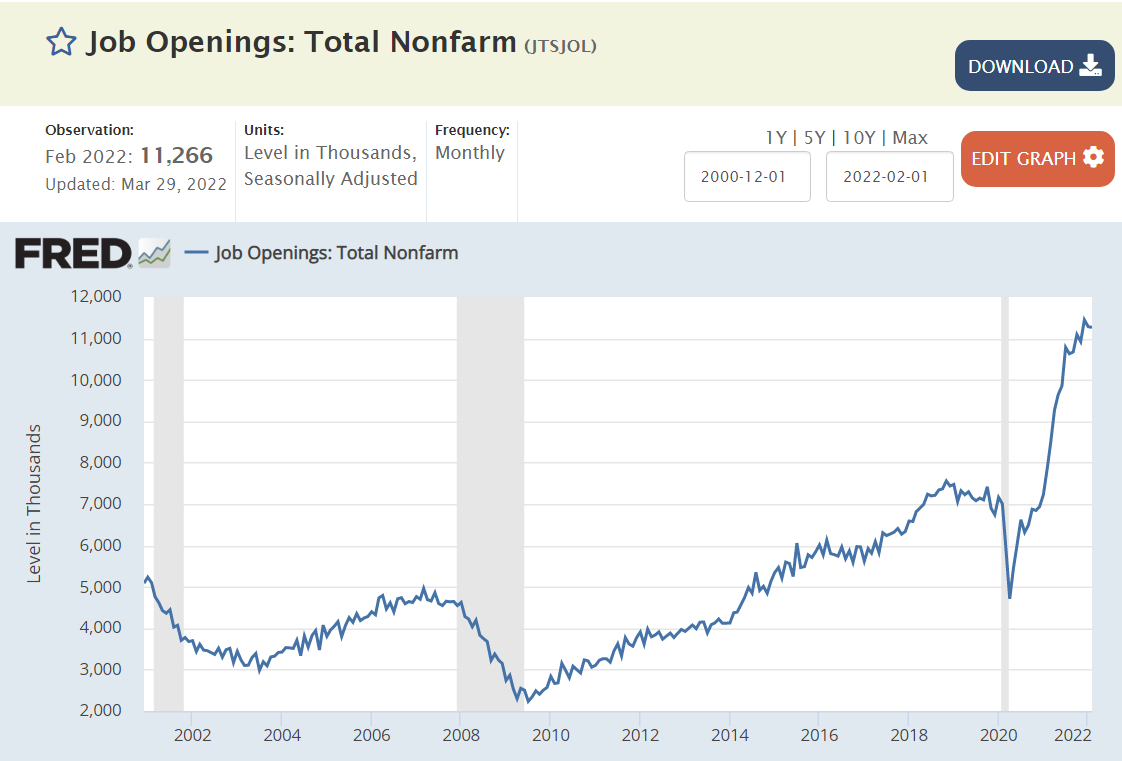
Red states have roughly returned to pre-Covid employment levels. Blue states have lagged by 3.5%. Mixed states have lagged by 2%. This can provide 3 million workers to fill some of the 11 million open jobs.

https://fred.stlouisfed.org/series/CES0500000003
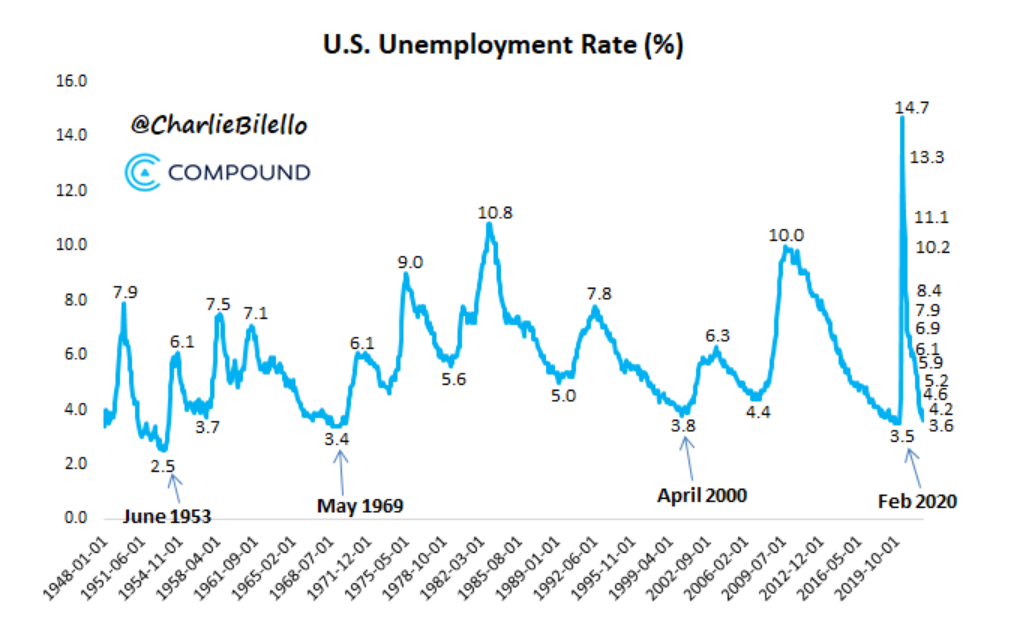
I expect the overall unemployment rate will set a 68-year record in the next 3 months. The February 2020 3.5% and May 1969 3.4% lows will be eclipsed! Unemployment will be at the lowest rate in my lifetime (Jul 1956)! This is despite the many, many issues and risks we have on both the supply and demand sides of the labor market.
IMHO, there are many factors driving this GREAT NEWS. (1) American firms are making record profits based on domestic and global demand, so they are incentivized to hire more workers, even at higher than usual wages. (2) American firms are finding that they can pay higher than historic wages and still generate incremental profits from the incremental workers (see Costco). (3) The definition of “employable” workers is clear, but employers are slowly loosening their irrational requirements (college degrees). (4) Baby Boomers have accumulated unprecedented retirement assets, so they have slowly left the labor force in a “one way” exit. (5) The “informal” labor market has been institutionalized with Uber, gig, contract and temporary worker arrangements. (6) Reduced unemployment benefits have incentivized many (older, less skilled non-unionized) unemployed workers to reduce their “reserve wage” expectations and accept new employment at lower wages than their best historical experience. (7) With less stigma for “laying off” workers, employers are more actively hiring workers to fill all economically justified positions. (8) With lower recent illegal immigration, the “reserve army” of the unemployed is lower. (9) Modern recruiting systems provide employers with so many candidates that they are assured of finding matching workers relatively quickly.
In essence, we have a much more “efficient” labor market than in years past, so the minimum unemployment rate has been reduced from 5% to perhaps as low as 2%. This too, is good news.
President Biden certainly did not drive any of the above structural factors. However, he has not disrupted these forces or pushed fiscal or monetary policy to undo the good news. Sometimes, “leave well enough alone” is all that is required.

Various global university rankings use different measures and methodologies. US universities lead the way in all major rankings, averaging 18 of the top 30 spots, good for 60% of all world leaders.
Few of us will consider attending these institutions, but they do educate many of our college professors, they educate many of our national business leaders and their research is used in most fields of endeavor.
https://www.shanghairanking.com/rankings/arwu/2021
https://www.usnews.com/education/best-global-universities/rankings
https://www.topuniversities.com/university-rankings/world-university-rankings/2022
https://roundranking.com/ranking/world-university-rankings.html#world-2021

The US population increased by 61%, from 205 to 330 million.
Indiana population increased by 30%, from 5.2 to 6.8 million. Indiana added nearly 1.6 million people during these 5 decades. It would have added another 1.6 million if it grew as fast as the US average.
The 8-county area grew from 1.1 to 1.9 million, adding 800,000 people and accounting for one-half of the whole state’s growth during this period. Growth has been consistently strong in each of the last 3 decades, adding 230,000, 220,000 and 220,000. The Indy Metro area has grown from 21% to 28% of the state’s total population.
Porter (CHI) added 84K. Dearborn (CIN) added 20K. Warrick (EVN) added 35K. Harrison (20K), Floyd (23K) and Clark (43K) added to the metro Louisville population. In total, these 6 counties added 226,000 people to their 296,000 base, reaching 523,000 in 2020. They grew from 6% to 8% of the Indiana total.
Monroe (76%) and Tippecanoe Counties (81%) displayed very similar growth rates. Their combined population increased by 153K, from 194K to 348K. Their share of the Indiana total increased from 4% to 5%.
These 18 counties out of Indiana’s 92, accounted for 76% of the population growth, increasing by 1.2M, from 1.6M to 2.8M people! Their share of the state total grew from 31% to 41%!
The 10 counties stretching from St. Joseph (South Bend) to Allen (Ft. Wayne) showed modest, but consistent growth throughout the period. Elkhart was most successful, adding 81,000 people (64%). Ft. Wayne added 101,000 people, but just 36% growth. St. Joseph managed to add 27,000, but just an 11% growth rate. Marshall, Kosciusko, LaGrange, Noble, Whitley, Steuben and DeKalb counties each added at least 10,000 residents.
In total, this section added 326,000 citizens, growing from 860,000 to 1,190,000. It’s share of Indiana’s population shaded up from 16% to 17%.
Population dropped by 62K, from 546K to 484K. Lake County reduced its Indiana population share from 10.5% to 7.2%.
These stand-alone counties each had at least 75,000 citizens in 1970. Together, with 902,000 people they accounted for 17.4% of Indiana’s total. Their population fell by 48,000 to 855,000, representing just 12.4% of the Indiana total in 2020. From best to worst population growth, using their main city for easy identification: Evansville (+13K), LaPorte (+1K), Kokomo (-1K), Terre Haute (-8K), Anderson (-9K), Richmond (-14K), Muncie (-15K) and Marion (-19K).
These counties all started with populations of less than 60,000 in 1970. The average county had 23,000 residents. This increased to 25,000 by 2020. 17 counties actually lost population across 50 years. Another 24 counties added less than 5,000 people. Just 16 counties added 6,000 people or more (including the next 5). Jaspers, Dubois, Jackson and Putnam each added more than 10,000 people. Bartholomew (Columbus) was the outlier, adding 28,000 people, growing by 48%, from 57,000 to 85,000 people.
In total, this group added 167,000 people, growing slowly from 1.283 to 1.449 million. Their share of the state total population dropped from 24.7% to 21.4%.
These 3 slower growing areas represent 66 counties, or 70% of the Indiana total. Their combined population increased by 2% in a half-century, edging up from 2.7 to 2.8 million. Their share of the Indiana total has declined from 53% to 41%, so possible future slow growth will have a relatively lesser impact on the state total.
The Indianapolis area, 6 other suburban counties and the homes of Indiana and Purdue Universities grew nicely at 75%, above the 61% national growth rate. 10 counties in the northern tier and Columbus showed modest growth. Two-thirds of Indiana’s counties grew at close to zero percent across 50 years. The 2000-2010 and 2010-2020 periods showed the same overall results.
Indiana shares these stagnant rural and old tech manufacturing county challenges with its neighboring states.
Cleveland hosted a rock n roll show each week for 7 years, competing with American Bandstand and Soul Train for a national audience. The first summary tape is enjoyable. The Fifth Dimension video is tightly scripted. The dancers for Edwin Starr and Stevie Wonder are iconic for this era. Otis Redding performed on the show just before his tragic plane crash.
https://en.wikipedia.org/wiki/Upbeat_(TV_program)