
The British Invasion had not started. R&B dominated the charts (17). Leading men (10) and women (4) were still featured. A few foreign/novelty hits (4). Blues (2) and folk (4) songs were revived. A few rock (3) and C&W (5) songs. The Beach Boys’ sound was brand new (4).
Why is Inflation 7%?
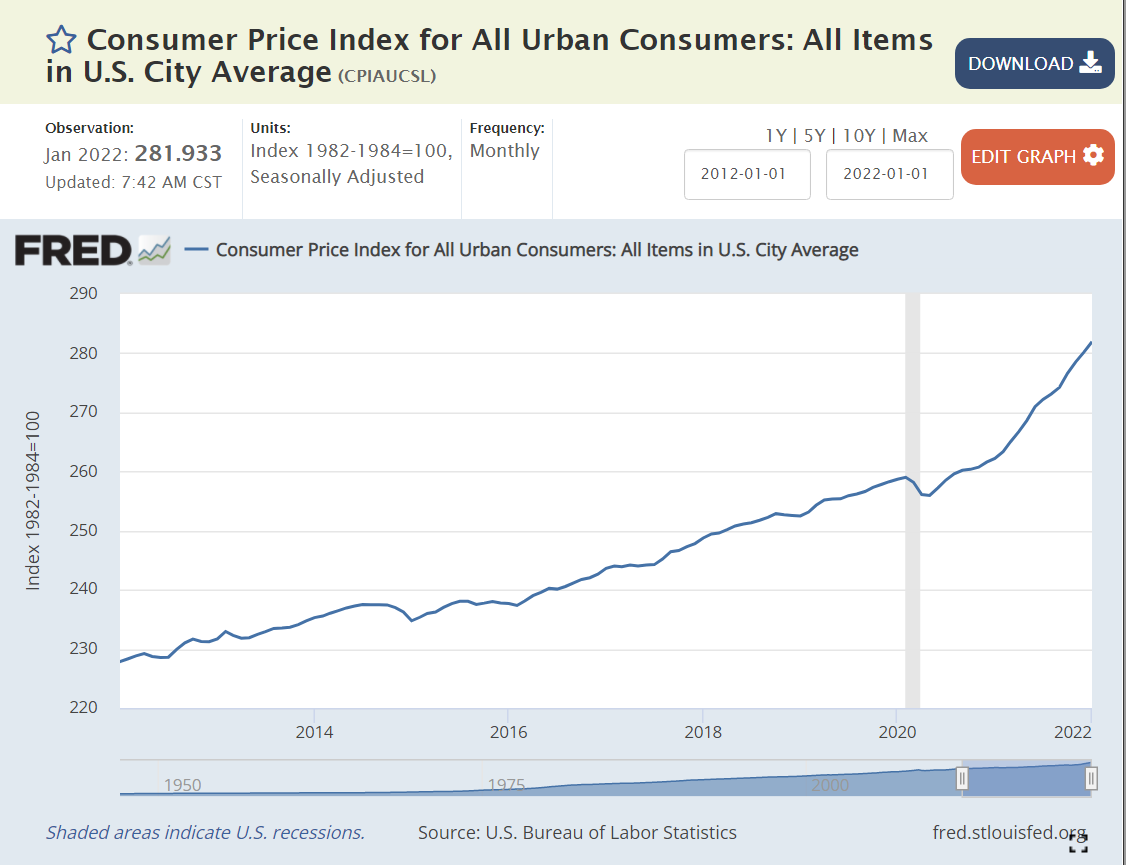
https://fred.stlouisfed.org/series/CPIAUCSL
Easy Monetary Policy
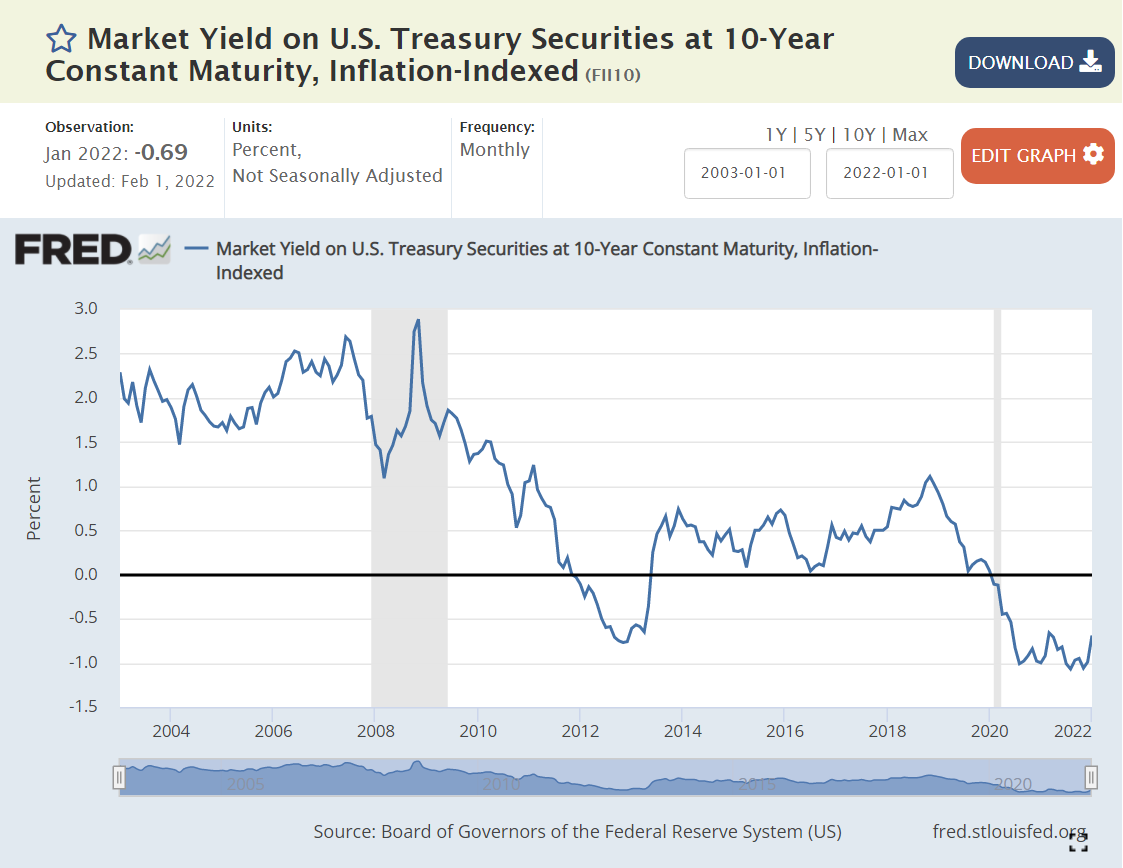
https://fred.stlouisfed.org/series/FII10
The “real” interest rate is the nominal interest rate minus the inflation rate. It reflects the “real” cost of borrowing. Prior to the “Great Recession”, 2% was a typical “real cost” of borrowing money. To entice lenders to lend, borrowers had to pay some “real” amount extra per year, 2%.
The Federal Reserve did what it could to “ease” monetary conditions and lower interest rates to offset the negative impact of the Great Recession in 2008-9.
By the end of 2011, real rates were ZERO or negative. In other words, the Fed went too far. By June, 2013, rates returned to positive territory, but only reached 0.5%, where they remained through the end of 2017, despite president Trump’s complaints that the Fed was constraining the Trump economy. Monetary policies were “easy” for a very long 7-year period.
By May, 2019, real interest rates were back to just 0.5%, having reached a peak of just 1% for 3 months at the end of 2018. With further “easy” money policy, real rates dropped back to ZERO percent by August, 2019. The economy was now 9 years into recovery. Interest rates should have been higher.
The Fed found new ways to “ease” monetary policy as the pandemic struck in 2020. Real interest rates dropped to -1% and stayed there. Monetary policy has been “easy” for more than a decade. Time for inflation. “Too much money chasing too few goods”. “Inflation is always and everywhere a monetary phenomenon”.
Supply Chain Disruption
The recovery has been faster than anyone expected, but most critically, with consumers less eager to buy “in-person” services, they have greatly increased their purchases of goods. The modern US economy relies on imports and modern manufacturers and retailers hold lower inventories to buffer changes.
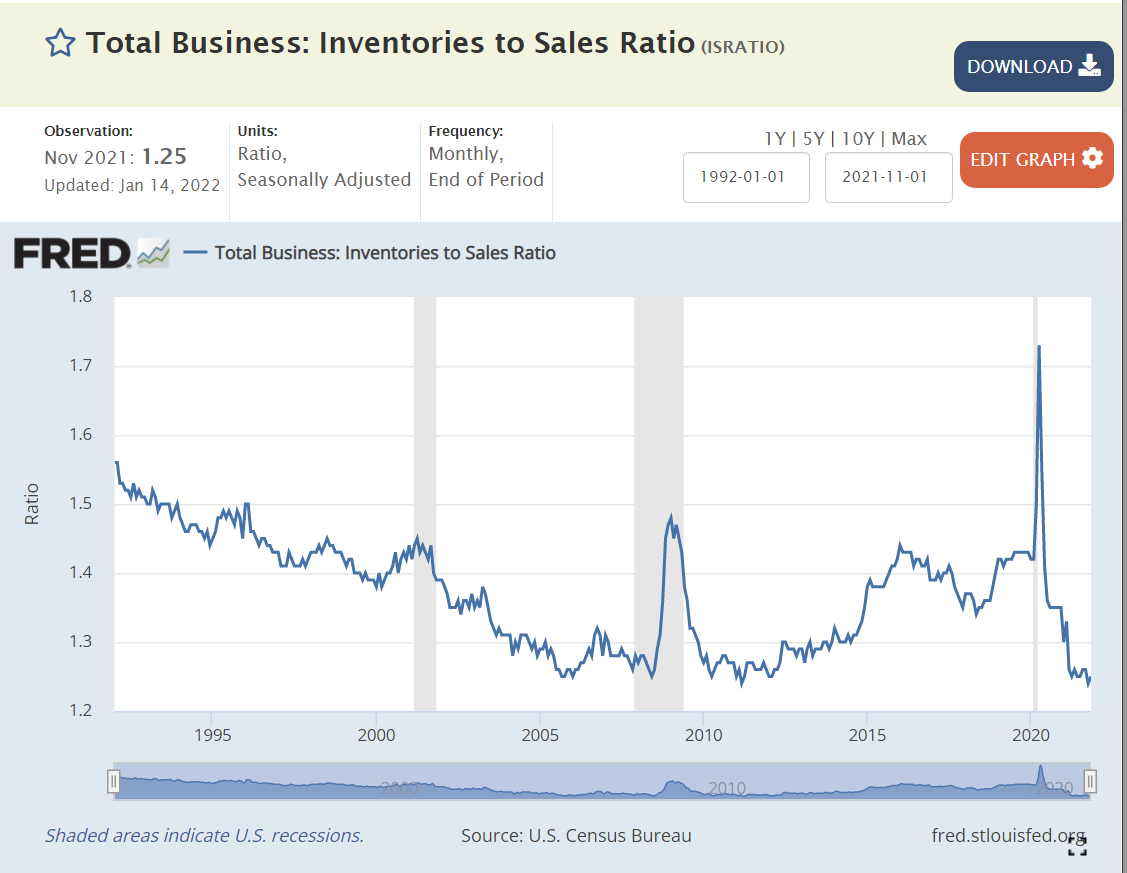
https://fred.stlouisfed.org/series/ISRATIO

https://fred.stlouisfed.org/series/PCEDGC96
Yes, durable goods purchases jumped by 20% in 1 year, from $1.8T to $2.2T. Businesses have simply been unable to adapt to that scale of change.
Easy Fiscal Policy / Large Budget Deficits
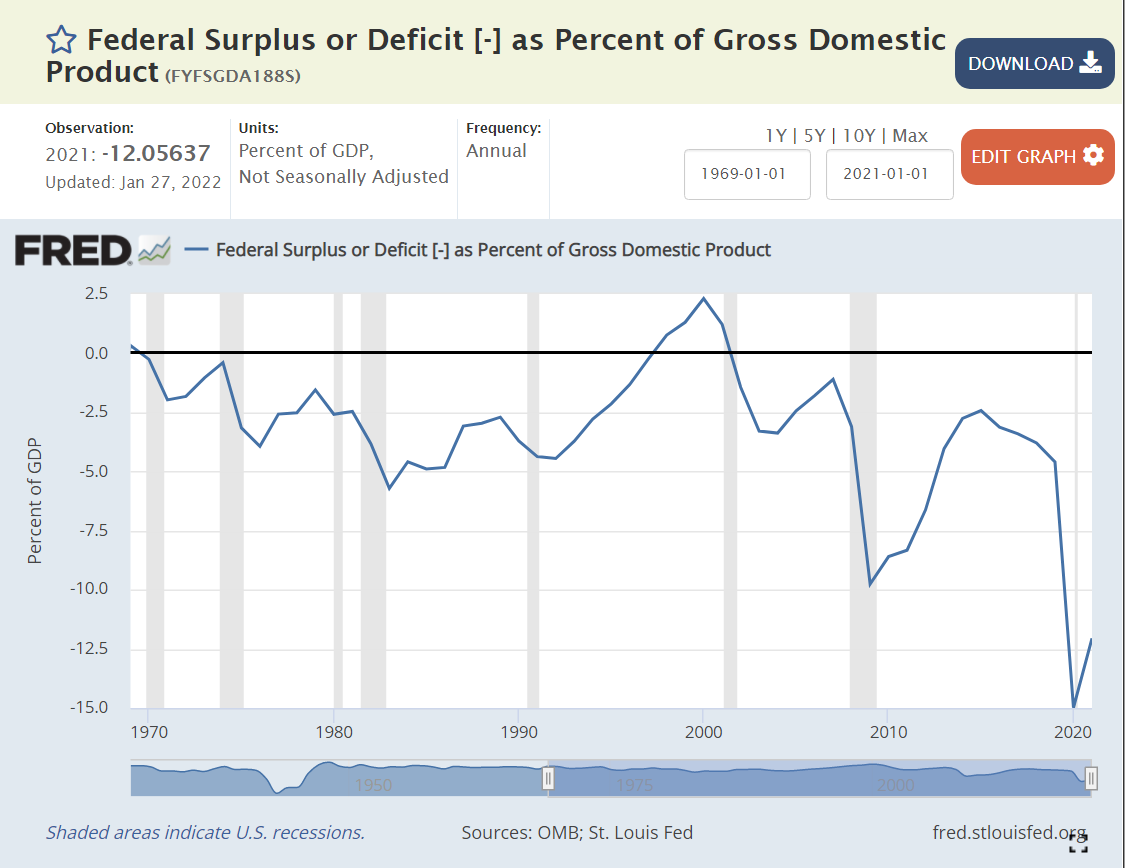

https://fred.stlouisfed.org/series/FYFSGDA188S
Standard macroeconomic theory focuses on aggregate demand versus aggregate supply as the key driver of output, unemployment and inflation. When total demand grows faster than remaining excess capacity of total supply, inflation results. The biggest driver of changes in aggregate demand is the level of government spending (demand) minus government taxation (reduces demand).
Historically, various pressures have kept the federal budget deficit between -3% and +3% of GDP, allowing the government to buffer change in private demand through the business cycle. The large drop from -2.5% to -5% in 1979-82 was a factor that contributed to the last major round of US inflation. A similar decline from -2.5% to -4% in 1989-91 increased inflation, but not on such a large scale. It also served to convince President Clinton and congress to reduce the deficit to ZERO by 1997 and run a surplus for a few years.
The 2001 recession caused a 2.5% decrease in this ratio, from a surplus to a deficit. Bush tax cuts, foreign wars and congressional agreement lead to deeper deficits at 3.3% in 2003-4, before some recovery to -1% in 2007, prior to the Great Recession.
Bush, Obama and congress agreed to spend more to fight the Great Recession, pushing the deficit to a worryingly low -9.8% in 2009. There was no agreement on a second major round of spending, so the deficit improved a bit to -6.6% by 2012 and then to a more reasonable -2.5% in 2014-15. Instead of continuing to improve with the economic recovery, it fell a little, to 3.1% in the last year of the Obama economy.
President Trump’s first order of business was to enact “job creating” tax cuts. Unfortunately, the desired boost to economic growth to fund these tax cuts did not occur. The budget deficit increased from 3.1% to 4.6% of GDP, as the economy reached a record long recovery period of a full decade.
To address the pandemic, congress and Trump agreed to spend money to protect the economy and workers, leading to very large budget deficits of 15% and 12% in 2020 and 2021, respectively. Too much aggregate demand for the level of aggregate supply, so we have major inflation.
Summary
Easy money, easy fiscal policy and a 20% increase in demand for goods leads to major inflation. Like a frog getting boiled as a pot slowly warms up, we became complacent based on the apparently “just right” conditions of the late teens (2012-19). The federal budget deficit needs to get back above -5%, real interest rates need to become positive and consumers need to rebalance to consume more services and less goods. I don’t think we’ll see 7% inflation for 2022, but it looks like 4-5% is a good bet. Hold on.
Politics
Biden deserves a good share of responsibility for the government spending budget deficit, as he was seeking to make it even larger. I give him a “pass” on consumer demand for durable goods since it mostly occurred before he started. I also give him a “pass” for the loose Fed monetary policy which has been going on for a decade or so. He was wise to reappoint the Fed chairman, who I believe will raise interest rates as needed to get the real interest rate back to a proper level. In the meantime, Biden will pay politically for higher inflation, which has a “real” impact on the wallets of voters.
Good News: 30 Topics
US Cars Last Twice as Long
US Libraries Have Adapted to the Digital Age
Air Conditioning is Nearly Universal in the US
US Housing Market Supply and Values are Growing
Unemployment Rates for Younger Works are Lower
More Earned Doctorates
More College Students Study Abroad
Growing US Exports
Hotel Options
Not “Living in a [Strictly] Material World”
Apparel prices
On-line Access
Lower Airfares
Agriculture Productivity Improvement Continues for Centuries
Take Care of Our Pets
Lawyers are Less Influential
More Beer Options!
More Car Choices
More Parks
More Women in Politics
Lower Consumer Debt
Less Air Pollution
Fewer Abortions
Fewer Fires
More Science Degrees
More College Grads
More High School Grads
More Charitable Giving, US is a Leader
Illegal Immigration is Down
Traffic Fatalities are Down
IQ Scores Rise
Good Economic News
Better off, job seekers/job openings.
US GDP/Capita versus Other Countries
Long-term Real US GDP Growth
6 million jobs added in 2021
Great Labor Market
Higher Effective Minimum Wage
Very Low Unemployment
Are You Better Off Economically? Yes!
Labor Productivity
Labor Force Participation
Good News: Apparel Prices

The nominal/actual average price of clothing today in the USA is 3% LOWER than it was 30 years ago, in 1991!!! Meanwhile, the overall consumer price index (CPI), has more than doubled (+106%). So, the price of clothing, relative to overall prices, has dropped by a mind-boggling 53% in the last 3 decades!
This is on top of the 37% real reduction in prices from 1970 to 1991.
From 1960 to 2021, the real reduction in clothing prices is a full 71%. More than two-thirds.
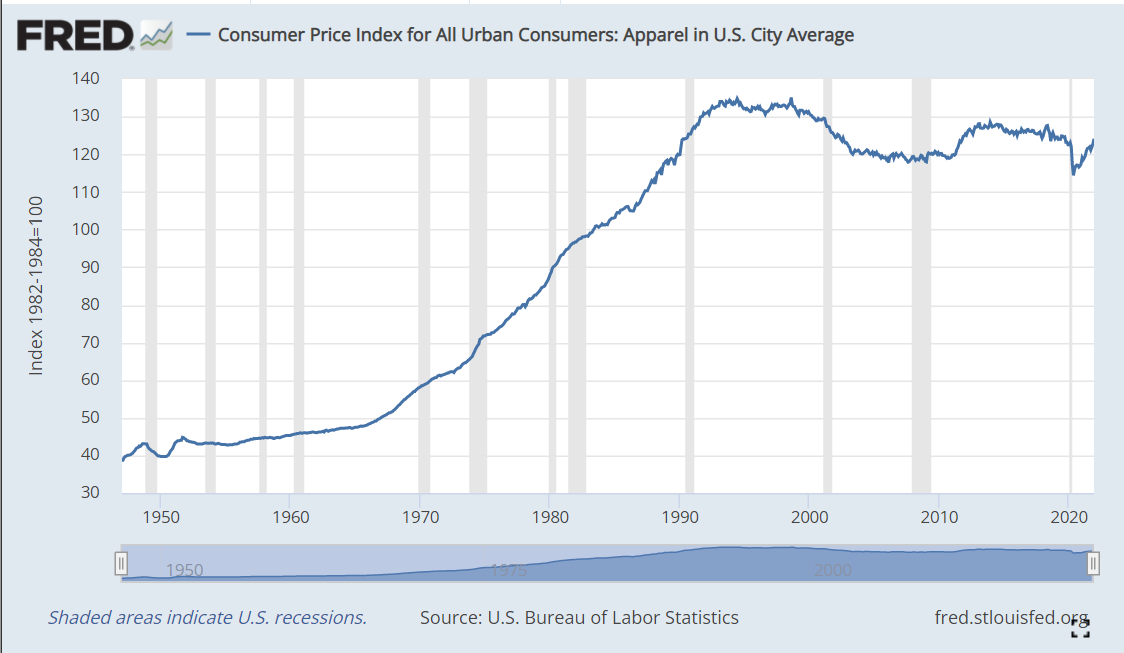
https://fred.stlouisfed.org/series/CPIAPPSL

https://fred.stlouisfed.org/series/CPIAUCSL
This illustrates the benefits of “free trade” to US consumers.
Money / Clothing for nothing …
Good News: Are You Better Off? (2)
Ronald Reagan taunted Jimmy Carter with this question to voters in the 1980 debates. It helped him win.
Twelve years later, James Carville helped Democrats return from the political wilderness in 1992 with his advice to Bill Clinton that “it’s the economy, stupid”.
https://en.wikipedia.org/wiki/It%27s_the_economy,_stupid
Politicians have used various measures, from unemployment to inflation to the “misery index” to jobs created to productivity to the stock market, to promote their success and detract from their opponents.
I want to focus on one measure, the ratio of the number unemployed to the number of job openings, to highlight the strength of the American economy in the last dozen years.
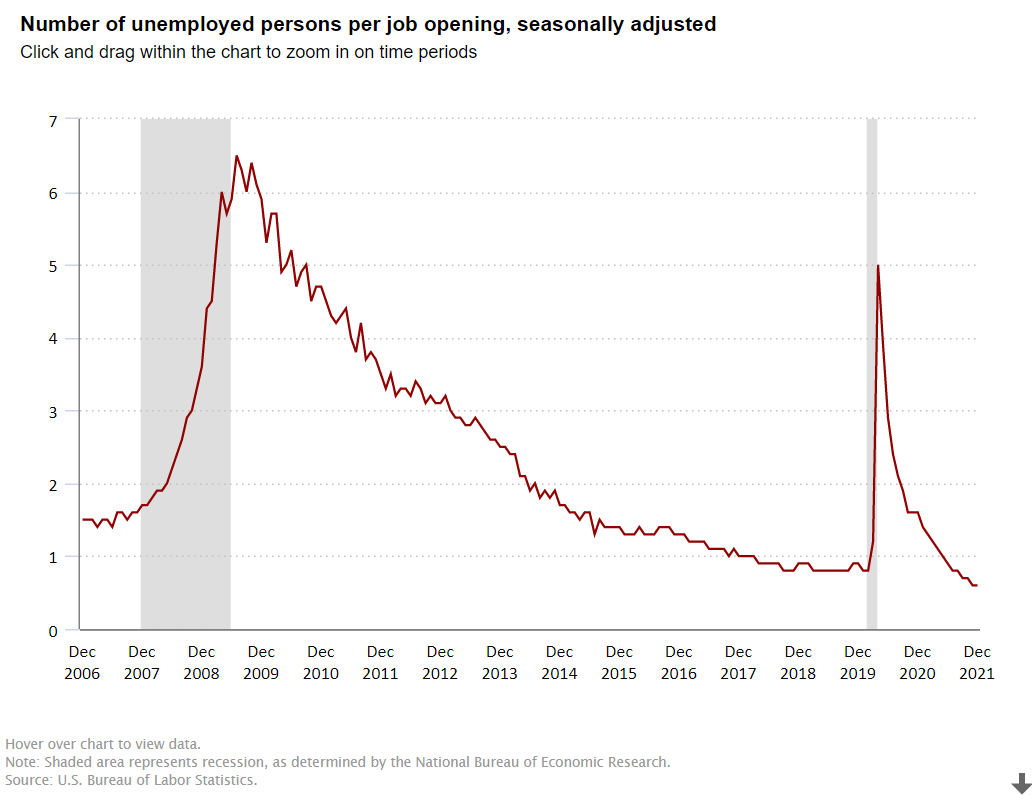
https://www.bls.gov/charts/job-openings-and-labor-turnover/unemp-per-job-opening.htm
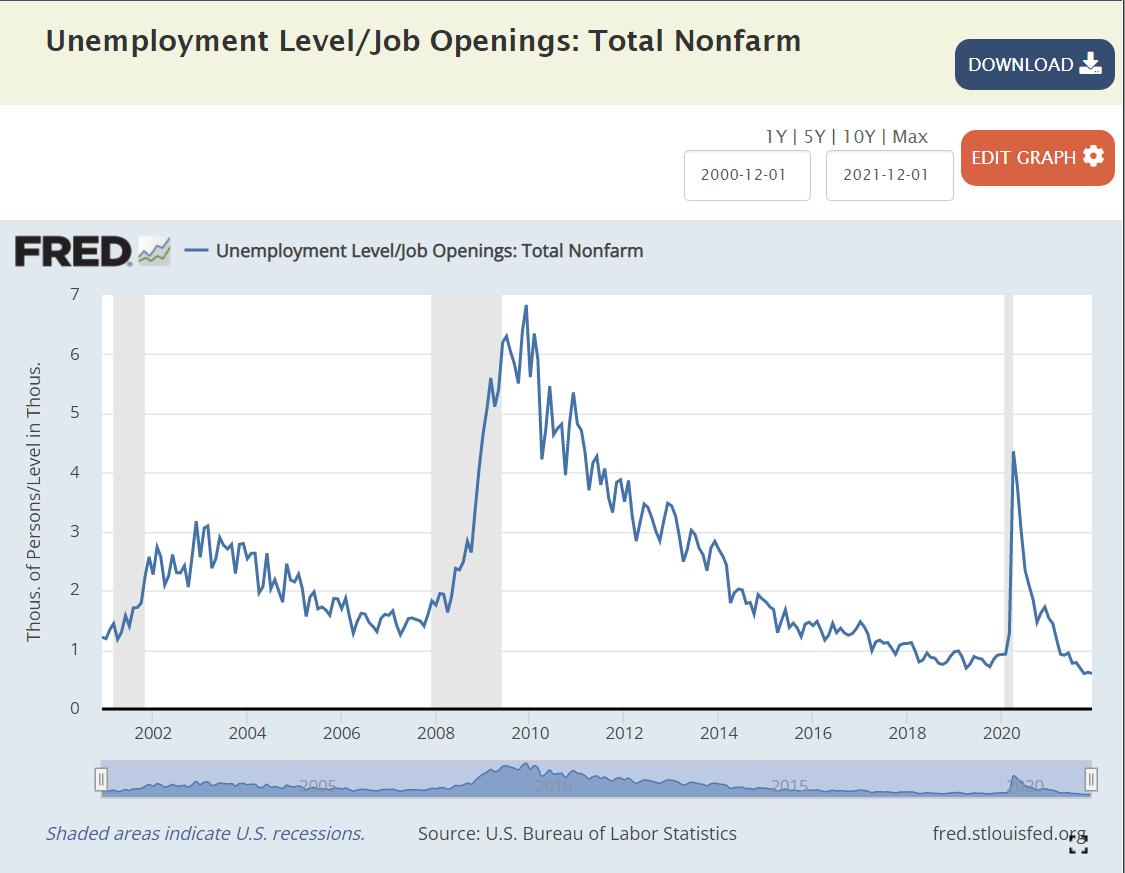
https://fred.stlouisfed.org/graph/?g=p9aA
George W. Bush: Jobless Recovery in the “aughts”
The Bush economy was widely criticized for its “jobless recovery” following the economically healthier Reagan and Clinton presidencies. The presidency started at close to 1 unemployed person per job opening. The recession pushed this up to 2.5x and then 3.0x. In labor market terms, this is a huge difference. At 1:1 or 1.5:1, unemployed workers expect to be re-employed quickly. At 3:1, some may enter the dark days of the “long-term unemployed”. After 3 years, the economy DID recover to 1.5:1, but it was unable to improve further. The “Great Recession” was a brutal job killer, pushing this measure of labor market tightness up four-fold, from 1.5X to more than 6X before its peak in the first half of 2010, as Obama and congress and the federal reserve bank wrestled with the situation.
Obama: Recovery and “New Territory”
Between April, 2010 and April, 2012, the economy cut this ratio in half, from 6x to 3x, a very solid performance. It took 3 years, until April, 2015, to complete the next 50% reduction, from 3x to the historically “very solid” 1.5X. The economy continued its growth for the next 2 years, but at a slower pace, reducing this ratio to 1.3X.
Trump: Even Better
The Trump economy continued to improve for the first 18 months of his term, reducing this ratio from 1.3X to 0.8X by September, 2018. This was a time of record low unemployment and economists recalculating their standard of “full employment”. While the economy continued to grow, the unemployment rate continued to decline and the stock market continued to climb, THIS measure had reached its minimum before the 2018 mid-term elections. It remained steady at the very positive level of 4 job seekers for every 5 jobs (0.8) for the next 17 months, until the pandemic disrupted everything. The ratio quickly shot up to 5X, not as high as the 6X that Obama faced, but very high. It quickly recovered to 1.4X by the end of Trump’s term. This was partly job recovery and partly fewer job seekers, but it was an amazing recovery in historic terms. Recall that 1.5X was “a good as it got” during George W. Bush’s presidency.
Biden: Even Better, Again !
In the first 6 months of the Biden presidency, this ratio dropped from 1.4X back down to the prior record level of 0.8X. Yes, by July, 2021, there were 5 jobs available for every 4 job seekers. This was as low as the ratio had previously fallen, even as the Trump economy piggybacked on the Obama economy and continued its extraordinary run. The ratio continued to fall in the next 6 months to 0.6X, an unheard-of level. 5 jobs for every 3 job seekers. It’s “no wonder” that voluntary job quits are at unprecedented levels. For, perhaps, the first time in American history, “everyone who wants to work, can find a job”. Whether you are right or left, Dem or Rep, this is “good news”. This is “great news”. Wages for the “bottom 20%” are rising in real terms. Income inequality is declining, a bit. The economy seems to be able to digest this new condition. And, the economy is not done growing, innovating, creating businesses, creating jobs, exporting, etc. About 2% of Americans are likely to be attracted back into the workforce in the next year or two, keeping the headline unemployment rate from going much below 4%, but pushing US real GDP growth to 4% in 2022 and close to 4% in 2023.
Summary
The “Great Recession” and the “once in a century pandemic” have been unable to disrupt the ongoing progress of the American economy and labor market. As a nation, IMHO, we have cultural and political challenges, but we “aught” to appreciate the power of the American economy to move forward.
Popular French Music (for US ears)
Not many French language songs or artists have “crossed over” to the US pop charts in the last 80 years. I poked around youtube to find 50 worth a listen. Enjoy!
1956 Hits
Orchestra
Leading Ladies
Leading Men
Crooners
Jazz
Country & Western
R&B
Elvis
Good News: We’re (Almost) All On-line
Cable TV Subscriptions

https://www.economist.com/business/2019/05/09/american-pay-television-is-in-decline

https://en.wikipedia.org/wiki/Cable_television_in_the_United_States
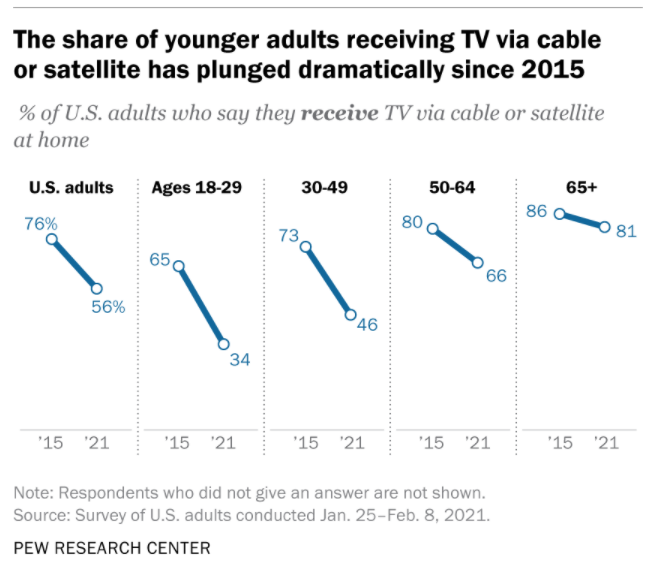
Hey! Quick Summary
Cable TV subscribers and networks grew rapidly through the 1980’s and 1990’s reaching near universal availability. US subscribers plateaued from 2009-2014 at 100 million before rapidly declining to 74million in 2021. As the first graph shows, much of the decline has been a substitution of internet for cable access to media content. This is “good news” because everyone that wants it has access, but a new, better product has started to rapidly displace this 50 year-old technology.
Desktop/Laptop Computers

Ownership of a home desktop or laptop computer also remains near universal, at 77% in 2021. The ownership of tablet computers has risen from 14% in 2012 to a majority of homes (53%) in 2021.
Broadband Internet Access at Home

Broadband internet access has rapidly grown from 1% of homes in 2000 to 58% in 2008 to 77% in 2021. The retired generation (65+) lags behind at 64% connectivity. Black (71%) and Hispanic (65%) homes are below the average. Rural residents are also less connected (72%).
Internet Users

Pew Research also reports that the percentage of individuals that are internet users has nearly doubled from 52% in 2000 to (near universal) 93% in 2021. About three-fourths of older individuals (65+) are “surfing the web”. 97% of others are connected. There is no major difference between racial categories. Rural citizens are little less engaged (90%).
Mobile Phone and Smart Phone Owners
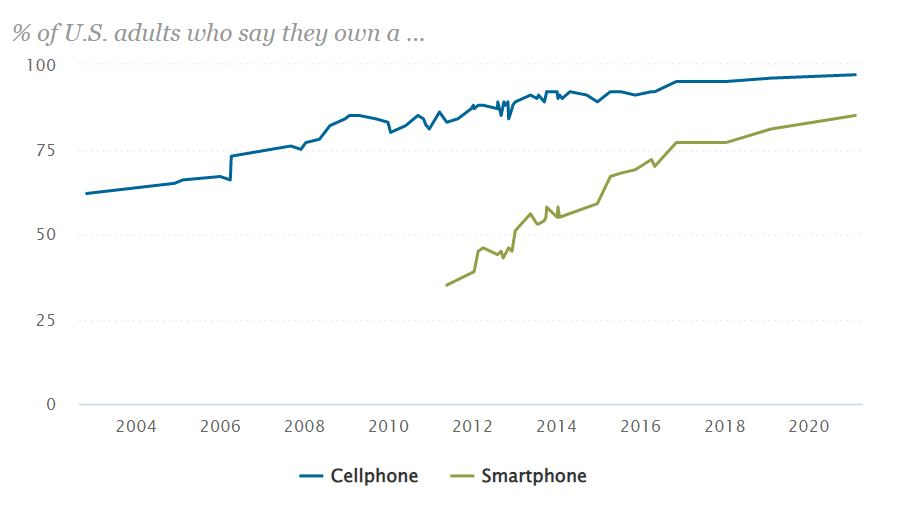
Mobile phone ownership has grown from 62% in 2002 to 97% today. Seniors (65+) have slightly lower ownership rates (92%). Racial groups have the same ownership. Rural residents have slightly lower ownership rates (94%).
Smart phone ownership has grown rapidly from 35% in 2011 to 77% in 2016 to 85% in 2021. Ownership rates vary by age: 18-49 (95%), 50-64 (83%) and 65+ (61%). There is no racial ownership gap. Rural residents have an 80% ownership rate.
Summary
Although we saw news coverage during the pandemic which highlighted the imperfect access to electronic devices and network required for effective on-line learning, the US is approaching a state where nearly everyone has access. Cable TV access is now post-peak. TV network access is increasingly through the internet. Broadband access is the weakest measure at 77% ownership. Cell phone ownership is universal and smart phone ownership will reach that level before the end of the decade.
Postscript: Economic Impact = 10% of GDP
Industry associations, journalists and consultants wrestle with each other to capture and communicate the economic value added by personal computers, smart phones and the internet. In rough terms, about 10% of GDP is due to the direct and indirect value of these technologies that did not exist in any economically material amount in 1980, just 40 years ago. Good news? No, GREAT NEWS.
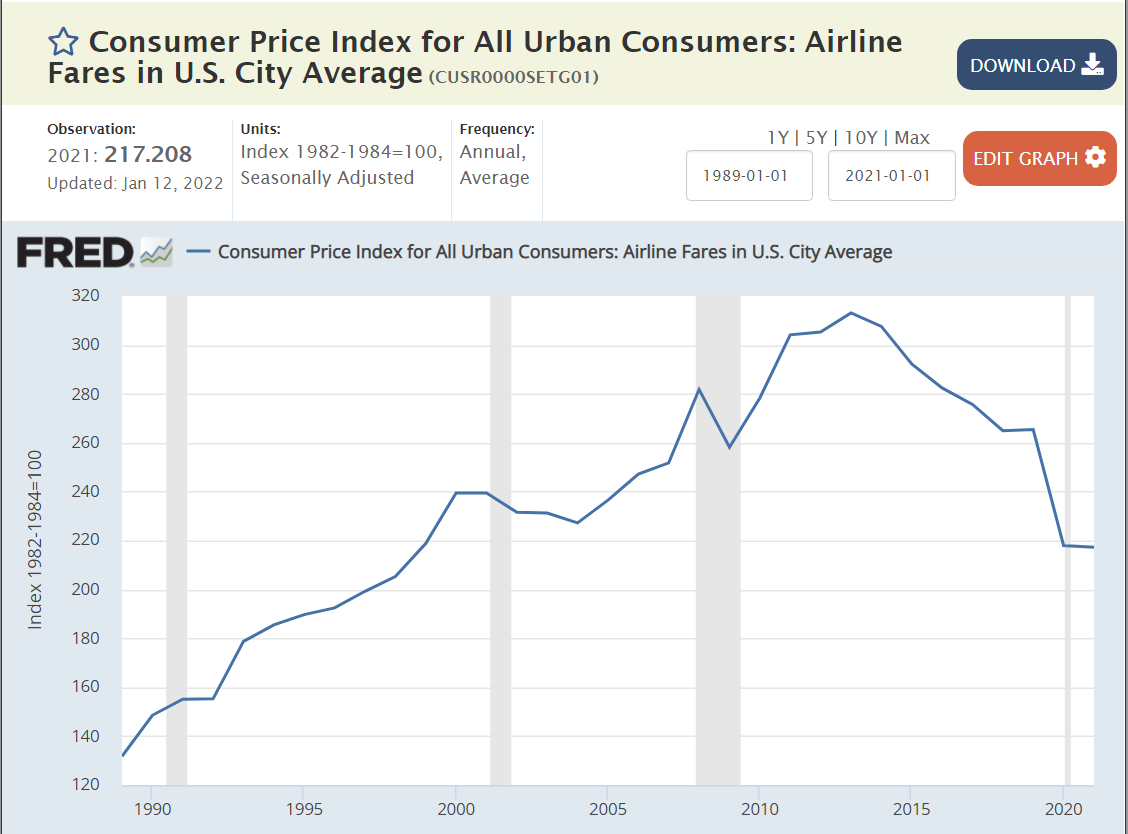
Good News: Real Airfares are 43% Less than in 1995

This article combines data from 4 sources with slightly different data. Airfares were flat at the end of the 20th century, but then dropped by 19% by 2004. They remained flat, in real terms, through 2009. Airlines pushed through 8% higher prices in 2010-11 and maintained real fares at the same level through 2014. After 19 years, real airfares were 14% lower than in 1995.
Fares then dropped year after year through 2019, reaching 26% below the 1995 baseline. They have fallen further in the pandemic years to 43% below the level of 25 years ago.

Bureau of Labor Statistics / CPI
The Bureau of Labor Statistics compiles a consumer price index for air travel as part of the overall CPI. It compiles average prices and tries to adjust for changes in the quality of the product.
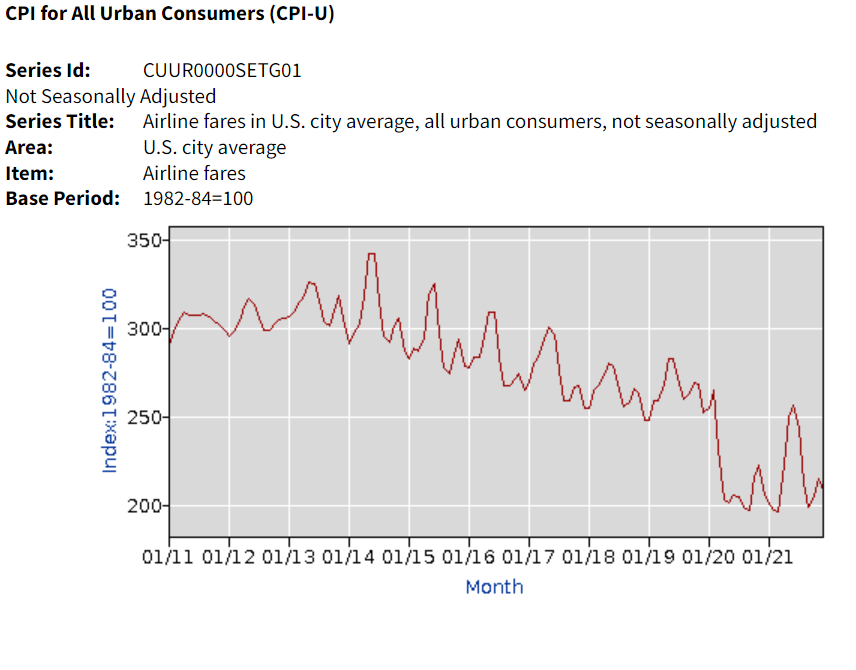
https://data.bls.gov/timeseries/CUUR0000SETG01?output_view=data
https://www.bls.gov/cpi/factsheets/airline-fares.htm
https://www.bts.gov/content/annual-us-domestic-average-itinerary-fare-current-and-constant-dollars

https://fred.stlouisfed.org/series/CPIAUCSL#0
https://fred.stlouisfed.org/series/CUSR0000SETG01#0
Bureau of Transportation Statistics

https://www.bts.gov/newsroom/figure-1-us-average-domestic-annual-fares-1995-2020
BTS graph and 20 more about the airline industry.
https://www.airlines.org/dataset/the-air-travel-value-proposition/
BTS: Revenue Per Passenger Mile
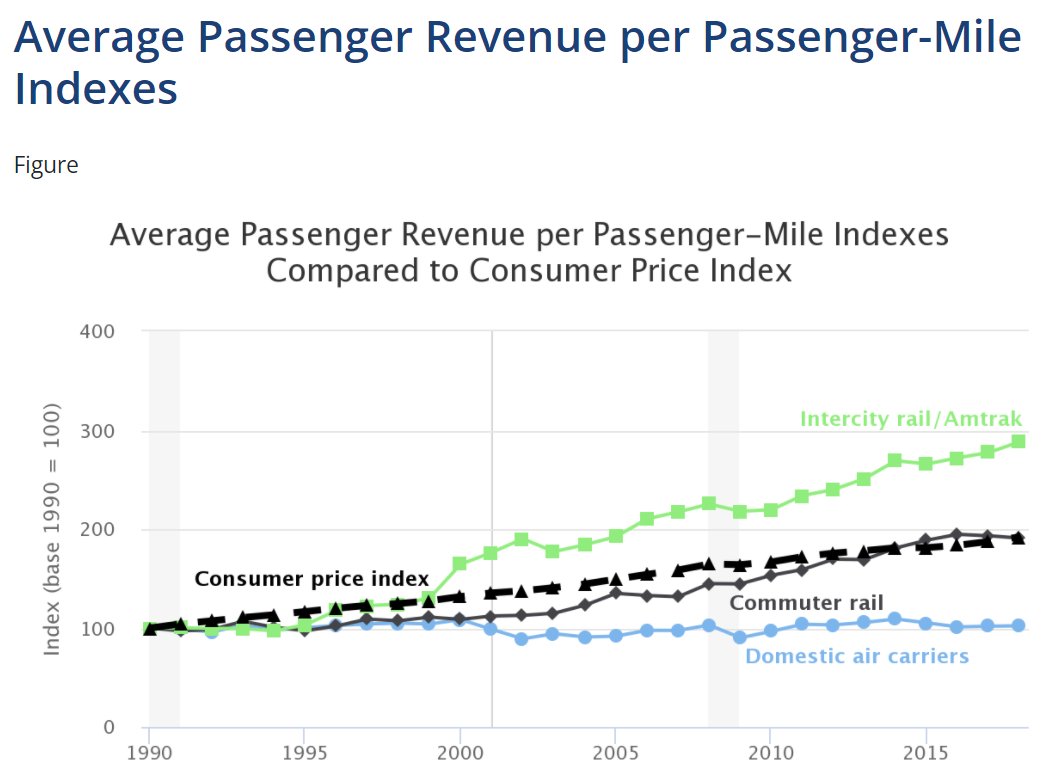
https://www.bts.gov/content/average-passenger-revenue-passenger-mile-indexes
Dept of Transportation: Average RoundTrip Fares
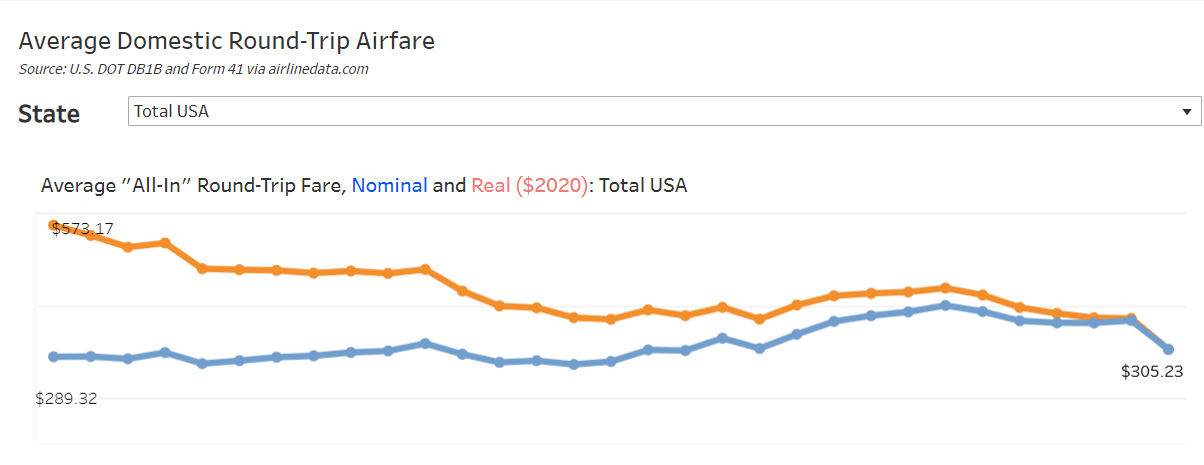
https://www.airlines.org/dataset/annual-round-trip-fares-and-fees-domestic/
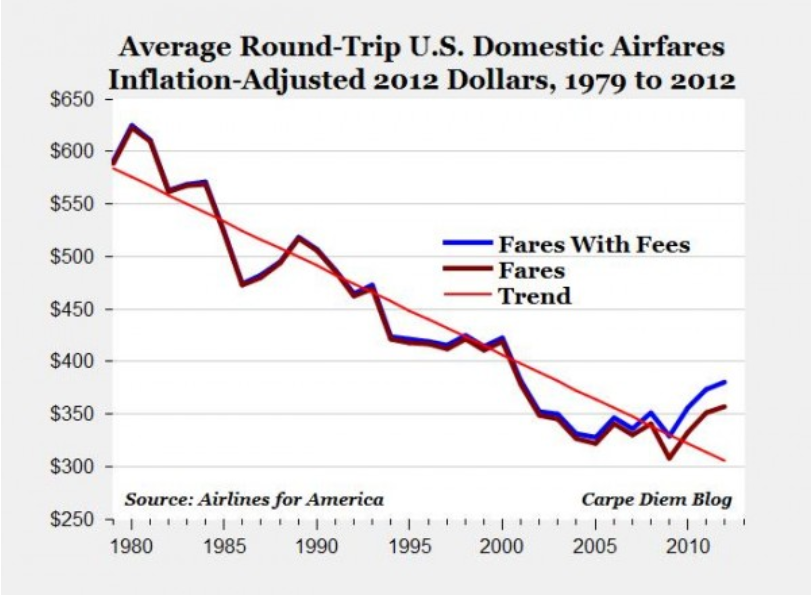
Prior 25-50 Years
Real airfares declined consistently throughout the period, but no data source is fully compatible with the 4 summarized above. It appears that the real cost of flying declined by about one-third between 1979 and 1995 as the airline industry was deregulated.
https://www.travelandleisure.com/airlines-airports/history-of-flight-costs
https://www.travelandleisure.com/airlines-airports/airfare-cost-change
See How the Cost of a Flight Has Changed Since 1963 [Charts]
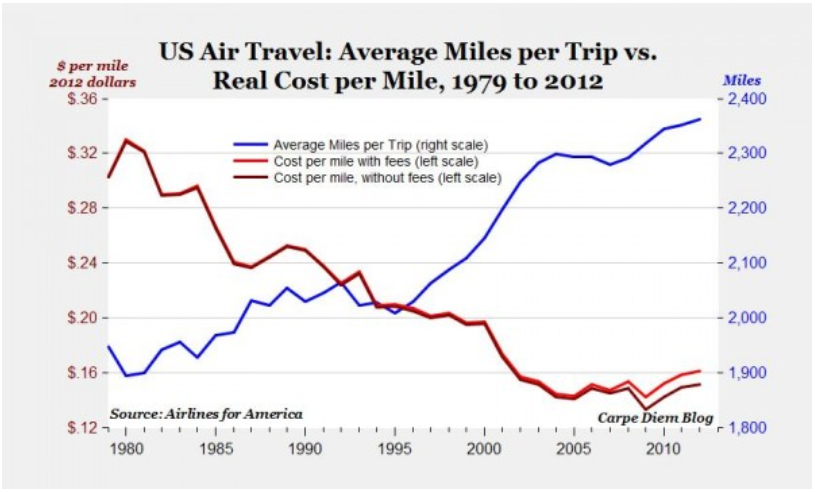
Air Industry Productivity (How’d they do it?)
https://www.econlib.org/library/Enc1/AirlineDeregulation.html
