
Real (inflation adjusted) Gross Domestic Product (GDP), the value of all goods and services produced in the US reached $20.8 trillion in 2020, compared with only $0.7 trillion in 1900. This is a nearly 30-fold growth across 120 years.
| Year | Real $GDP (T) | Added $GDP | Percent |
|---|---|---|---|
| 1900 | 0.7 | ||
| 1910 | 1.0 | 0.3 | 46% |
| 1920 | 1.3 | 0.3 | 21% |
| 1930 | 1.5 | 0.3 | 22% |
| 1940 | 1.8 | 0.3 | 20% |
| 1950 | 2.7 | 0.8 | 45% |
| 1960 | 3.7 | 1.1 | 41% |
| 1970 | 5.6 | 1.9 | 50% |
| 1980 | 7.8 | 2.1 | 38% |
| 1990 | 10.6 | 2.9 | 37% |
| 2000 | 14.9 | 4.3 | 40% |
| 2010 | 17.6 | 2.7 | 18% |
| 2020 | 20.8 | 3.2 | 18% |
It’s difficult to “digest” 20.8 trillion dollars. But, it is true that the US economy in 2020 was ten (10) times as large as it was in 1952, well into the post-war economic boom period. The population had more than doubled and the productivity of the economy had increased more than three-fold across this period.
The economy is 3 times as large as it was in 1975, when it was entering a challenging period of stagflation, foreign competition, high interest rates, energy shortages, environmental concerns and divided politics.
The economy is twice as large (in real terms) as it was in 1990.
The economy grew by an average of 42% per decade from 1940 through 2000. The last two decades have grown by 18% each, similar to the growth from 1910 through 1940.
However, the amount of growth, measured in real dollars, has continued at a very strong pace. The economy averaged growth of $2.8 trillion per decade from 1970 through 2020. That is roughly the size of the whole economy in 1950! The latest decade recorded a $3.2 trillion increase, larger than the output of the whole economy in 1950, and the second largest growth ever.


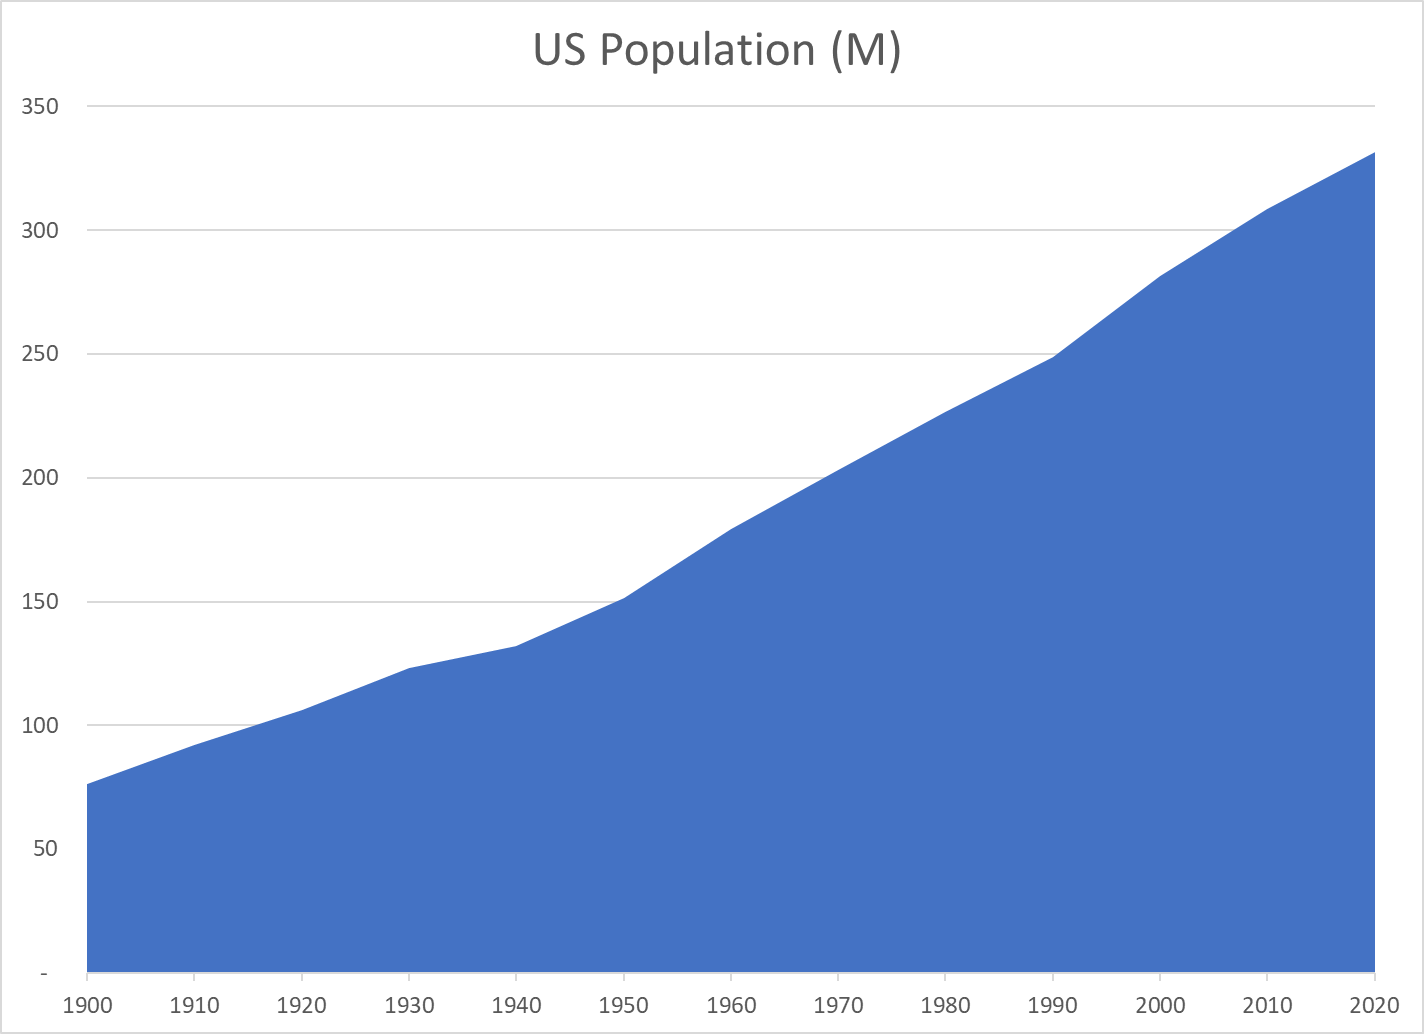
US Population
| Year | Population (M) | Added (M) | Percent |
|---|---|---|---|
| 1900 | 76 | ||
| 1910 | 92 | 16 | 21% |
| 1920 | 106 | 14 | 15% |
| 1930 | 123 | 17 | 16% |
| 1940 | 132 | 9 | 7% |
| 1950 | 151 | 19 | 14% |
| 1960 | 179 | 28 | 19% |
| 1970 | 203 | 24 | 13% |
| 1980 | 227 | 23 | 12% |
| 1990 | 249 | 22 | 10% |
| 2000 | 281 | 33 | 13% |
| 2010 | 309 | 27 | 10% |
| 2020 | 331 | 23 | 7% |
The US population has increased by 4.3 times since 1900, from 76 to 331 million people.
The population doubled from 1900 to 1950 and then doubled again since 1955.
The US added an average of 25 million new residents per decade from 1940 to 2020 (12%).
In the last 30 years, the US has added 85 million residents; the same number as its total population in 1905!
Despite many challenges in the last century, the US population has grown consistently and significantly.

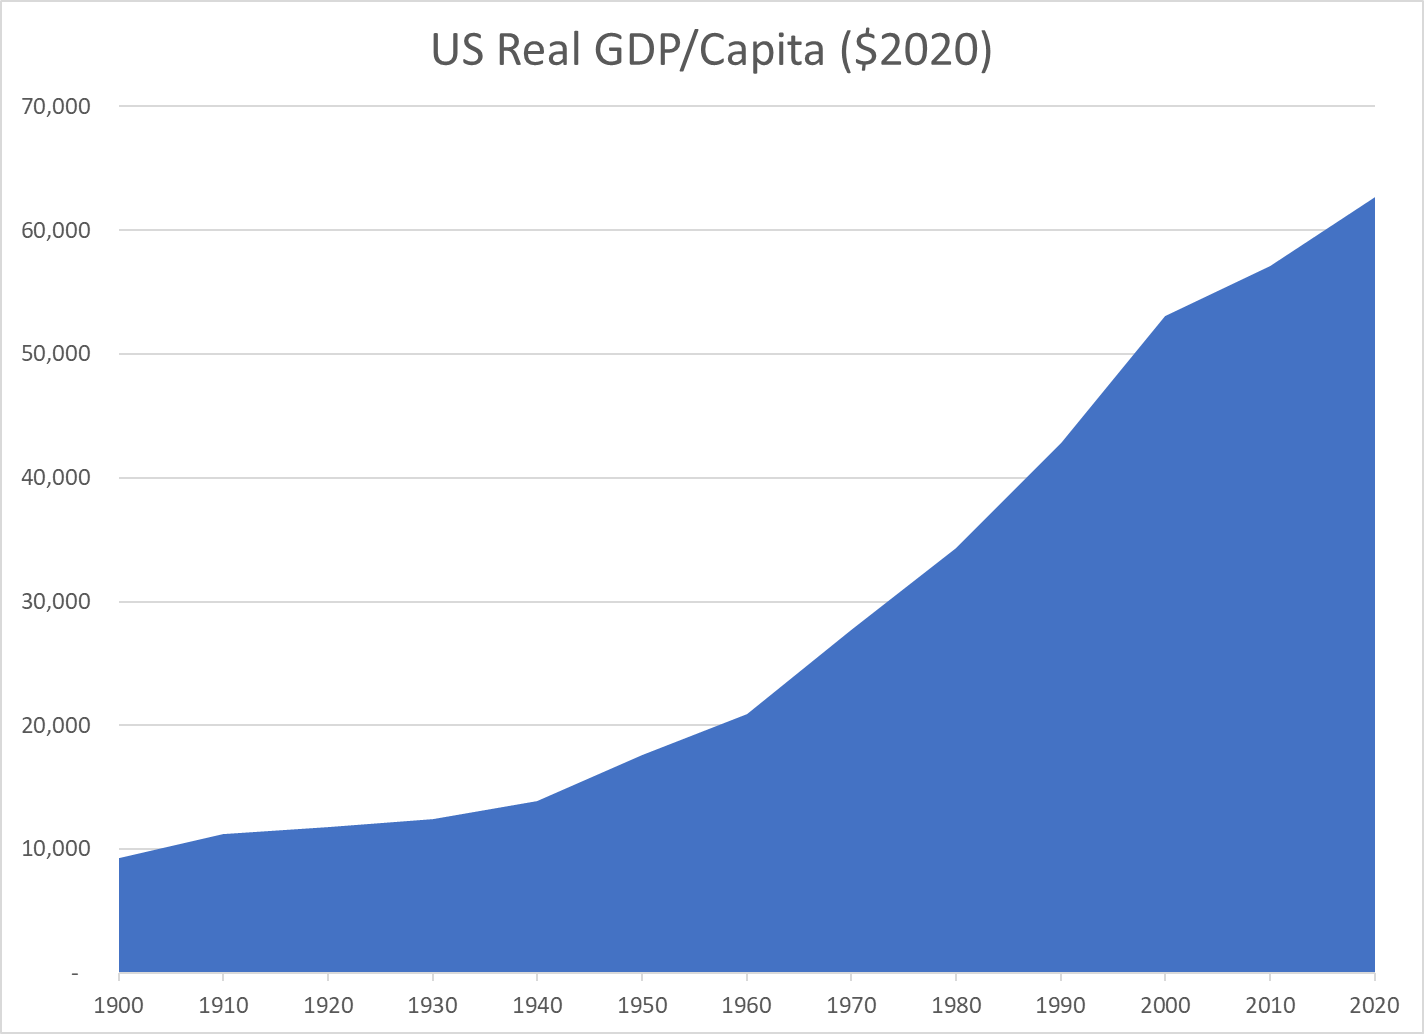
Real $GDP Per Capita
| Year | Real $GDP/Capita | $ Added | Percent |
|---|---|---|---|
| 1900 | 9,300 | ||
| 1910 | 11,200 | 1,900 | 20% |
| 1920 | 11,800 | 600 | 5% |
| 1930 | 12,400 | 600 | 5% |
| 1940 | 13,900 | 1,500 | 12% |
| 1950 | 17,600 | 3,700 | 27% |
| 1960 | 20,900 | 3,300 | 19% |
| 1970 | 27,700 | 6,800 | 33% |
| 1980 | 34,300 | 6,600 | 24% |
| 1990 | 42,800 | 8,500 | 25% |
| 2000 | 53,100 | 10,300 | 24% |
| 2010 | 57,100 | 4,000 | 8% |
| 2020 | 62,700 | 5,600 | 10% |
Real (inflation-adjusted) output per person has grown 6.7 times since 1900!
It has doubled since 1975, tripled since 1960 and quadrupled since 1945. Yes, today’s economy produces four times as much, per person, as the supercharged Word War II winning “arsenal of democracy”. It produces twice as much per person as the 1975 economy which then appeared to plateau in the face of Japanese import competition.
From 1960 through 2020, the economy has added an average of $7,000 more output per American for each decade.
While improved output/productivity in the last 2 decades has not matched that of 1960-2000, it still added $9,600 of output per resident, more than the total output per resident in 1900. In the last 3 decades combined, the economy has added nearly $20,000 of output/income per person, an amount equal to the total output/income per person in the late 1950’s.

Sources
https://fred.stlouisfed.org/series/A939RX0Q048SBEA
https://ourworldindata.org/grapher/gdp-per-capita-maddison-2020
https://en.wikipedia.org/wiki/Demographic_history_of_the_United_States

[…] https://tomkapostasy.com/2022/01/18/good-news-us-economy-is-29-times-as-large-as-in-1900/ […]
[…] Good News: US Agriculture Good News: US Remains the Gold Standard for $GDP/Capita Good News: US Economy is 29 Times as Large as in 1900! Good News: Pets in the USA Good News: Growing US Hotel Capacity, More Consumer Choice […]