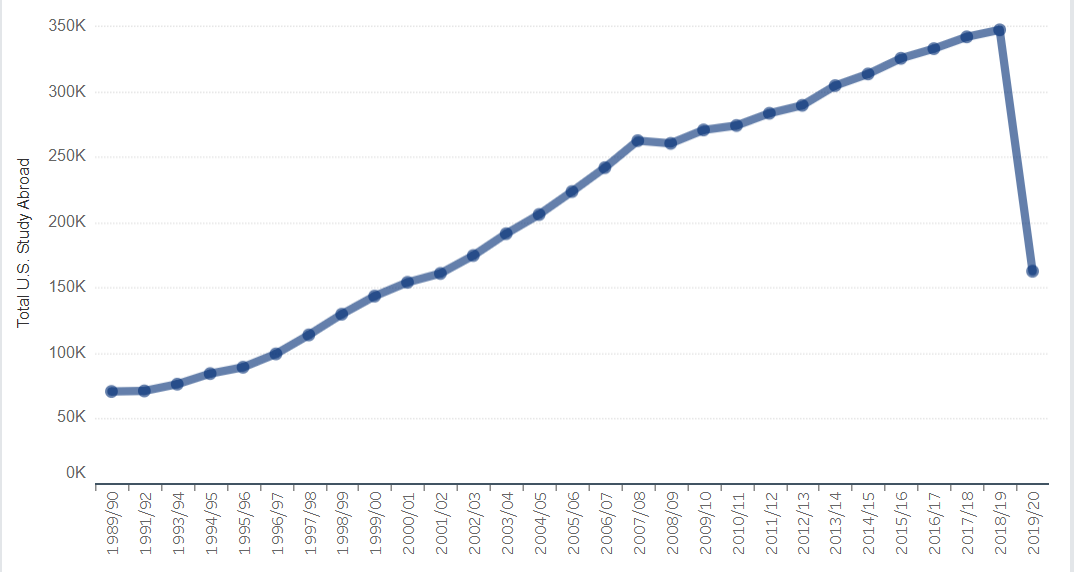
Various global university rankings use different measures and methodologies. US universities lead the way in all major rankings, averaging 18 of the top 30 spots, good for 60% of all world leaders.
Few of us will consider attending these institutions, but they do educate many of our college professors, they educate many of our national business leaders and their research is used in most fields of endeavor.
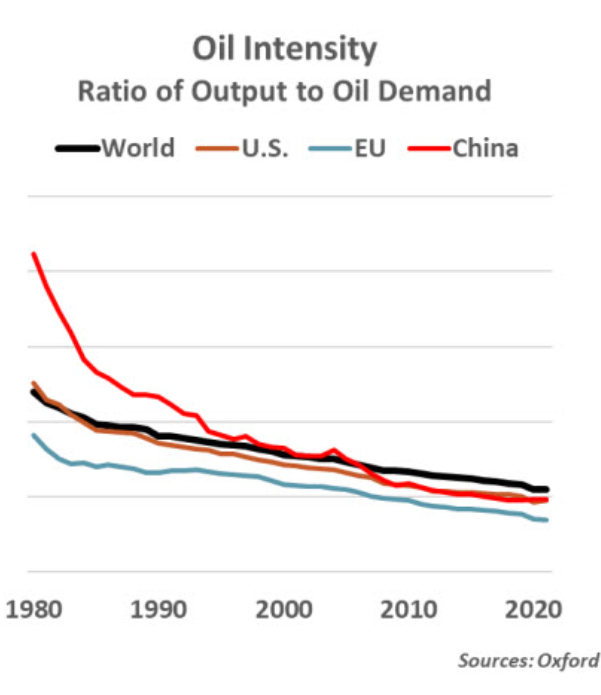
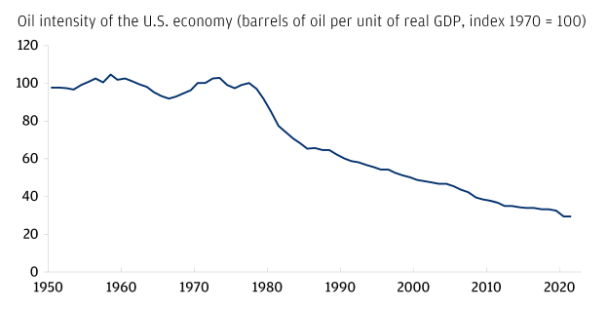
Energy intensity is down as the service economy becomes a greater share of GDP, energy efficiency improves for consumer and industrial uses, electricity power grows with its inherently higher efficiency, and renewable energy grows as a source of power.
Finally, individual country risks still matter: Russia, Iran, Venezuela and Saudi Arabia.
Summary
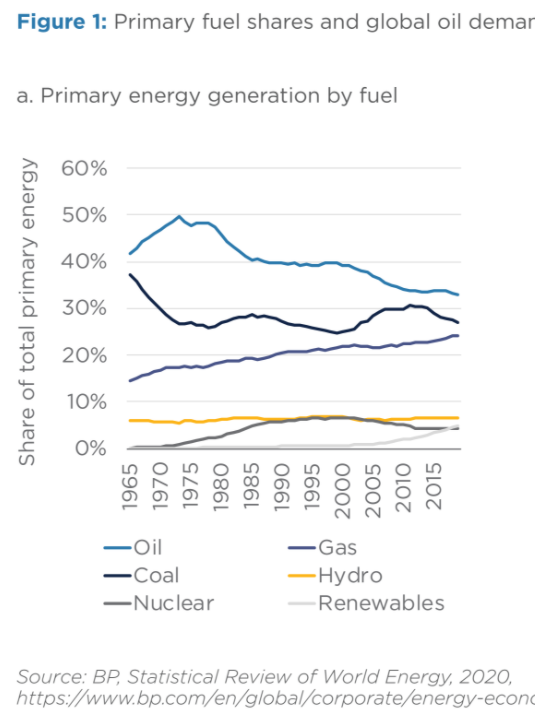
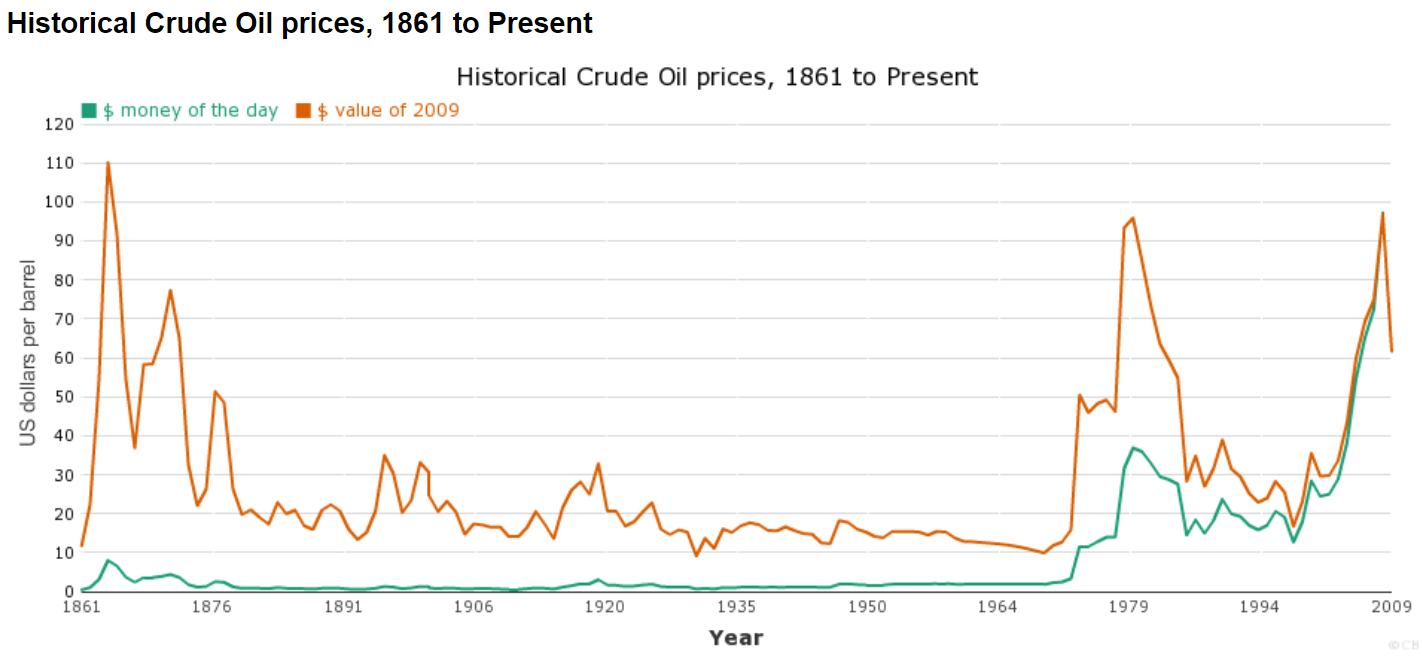
The Oil Shocks of the 1970’s were due to a drastic shift in the pricing power of the OPEC countries following 30 years of greatly accelerated global demand for oil while it was priced attractively. Demand and supply have both grown in the last 50 years. The role of oil in the global and US economies (compared with real output/GDP) has dropped by more than one-half. Increased oil prices can and will have a significant effect today, but less than one-half of that in the past. Long-run trends indicate that the role of oil as a critical resource will continue to decline, although there remain risks as the world closes coal and nuclear power plants and makes the investments required for a renewable energy world.
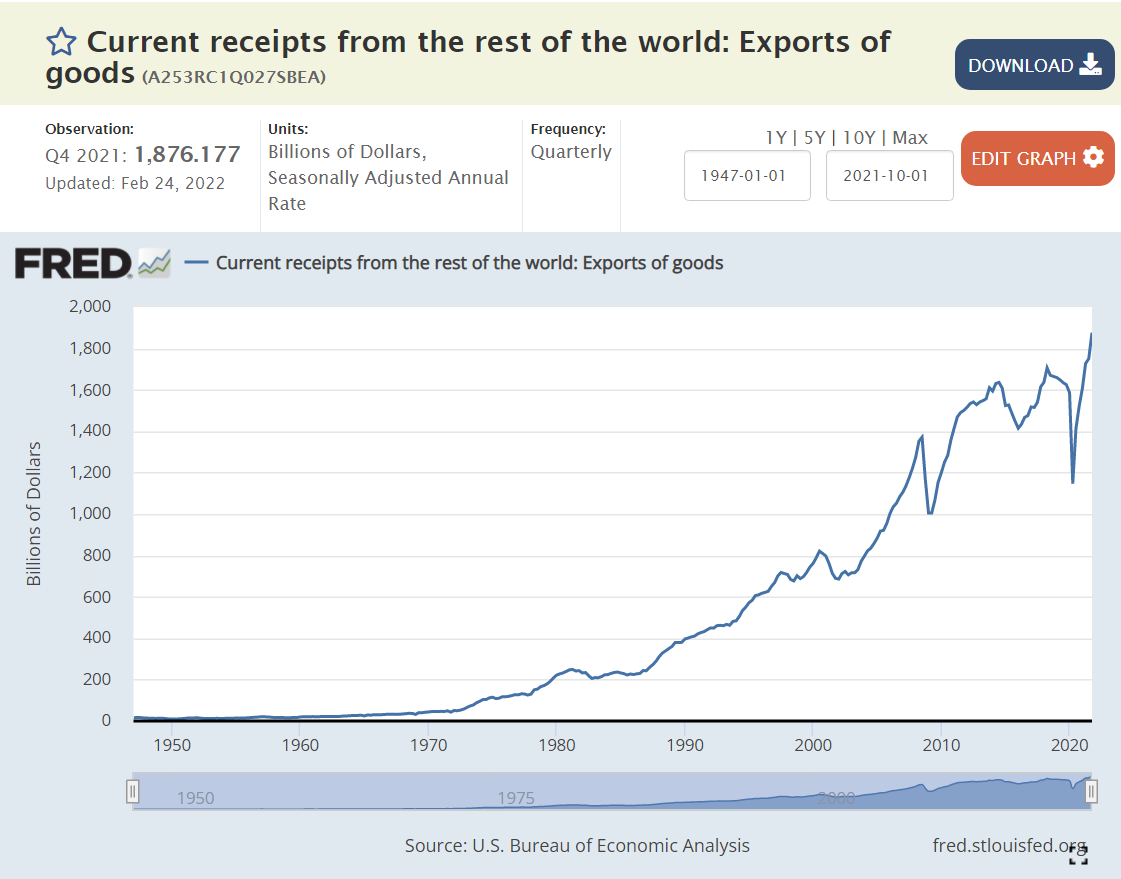
Critics complain about the US economy’s weak international performance in recent decades. Let’s set aside the trade balance (exports – imports) and focus just on exports. US exports occur when US goods and services are more competitive than ALL other countries in the world, subject to limits based upon transportation and purchasing costs, currency values and trade barriers. In real (inflation-adjusted) terms, US exports have increased by 180% since 1980, or 2.5% per year, year after year after year. Despite the 10% increased real cost of labor in the US, firms have leveraged their advantages, developed new products, found new markets and used better financing structures to greatly improve the US export results.
Total Goods and Services
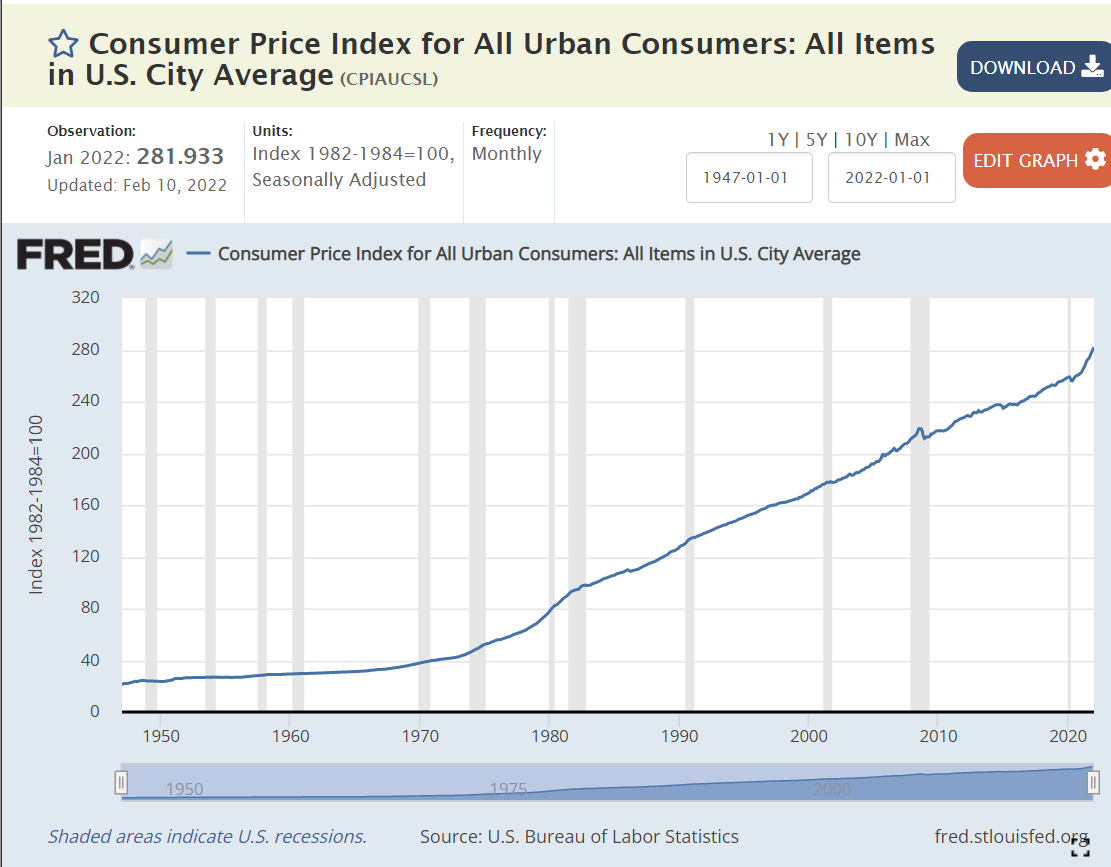
Real goods and services exports increased by 180% from 1980 until today. They increased 9-fold in nominal terms, but consumer prices increased by 230% (3.3x).
The US Dollar fell in value significantly in the 1980’s as US inflation exceeded inflation in other countries, but has since been relatively constant against a market basket of other currencies. The increase in exports is not due to a weaker US dollar.
Goods Exports
US goods exports have increased by 140% or 2.1% per year in real terms since 1980. They have fallen from 4/5ths to a little more than 2/3rds of the total as services exports have grown more rapidly.
Agriculture
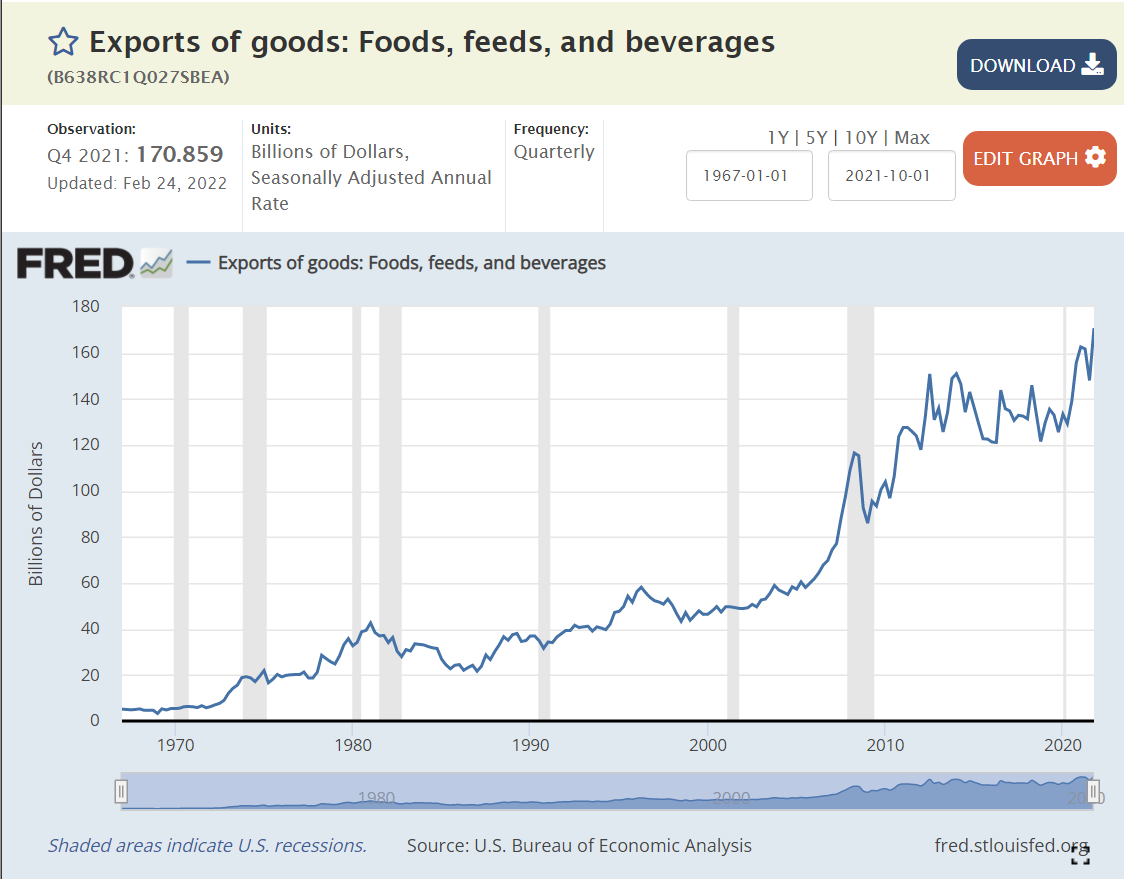
Ag exports grew very rapidly in the 1970’s and then flattened through the 80’s and 90’s before rapidly accelerating in the “oughts”. Ag exports grew by 30% in real terms over these 4 decades, a little less than 1% per year.
Industrial Supplies Exports
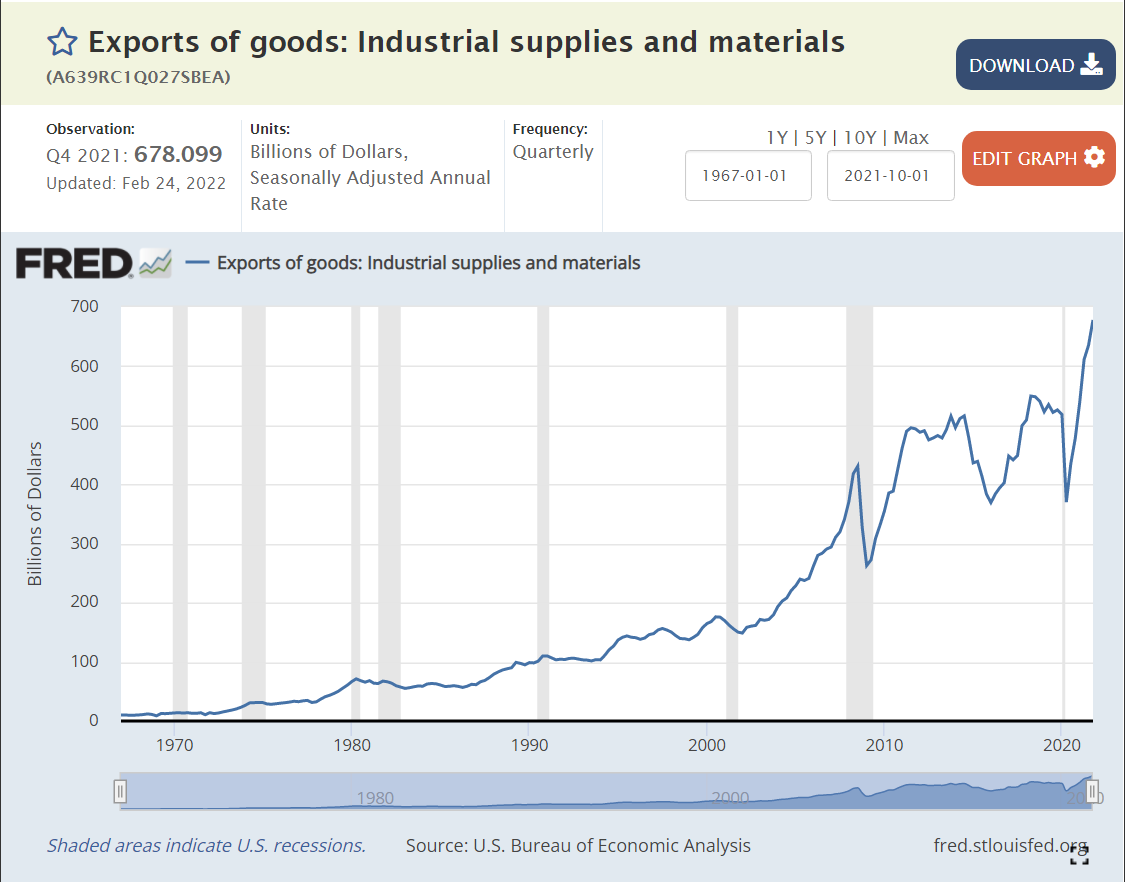
US chemistry based and other engineered supplies and components grew by 210%, or a strong 2.8% annually.
Petroleum Exports
From zero to something, now 10% of US exports.
Capital Goods Exports
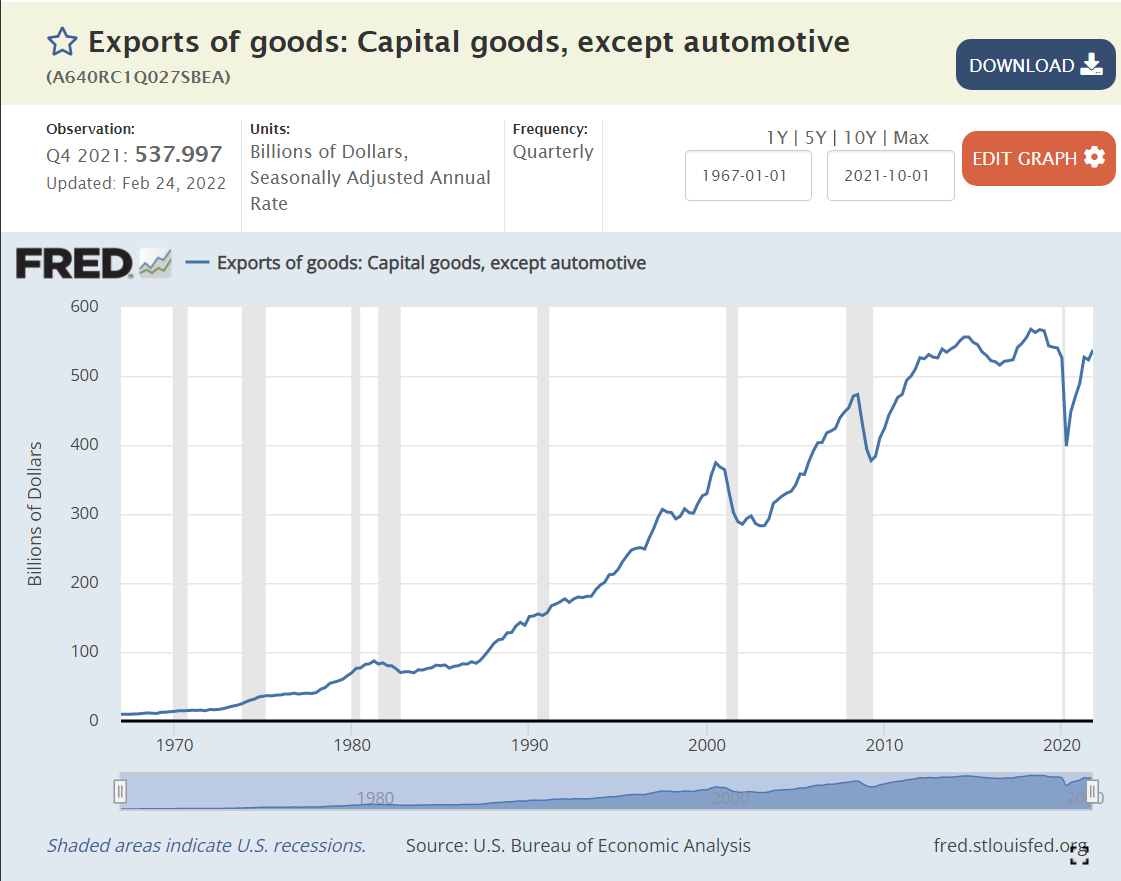
US exports of highly engineered capital goods increased by 100%, or 1.7% per year.
Automotive Exports
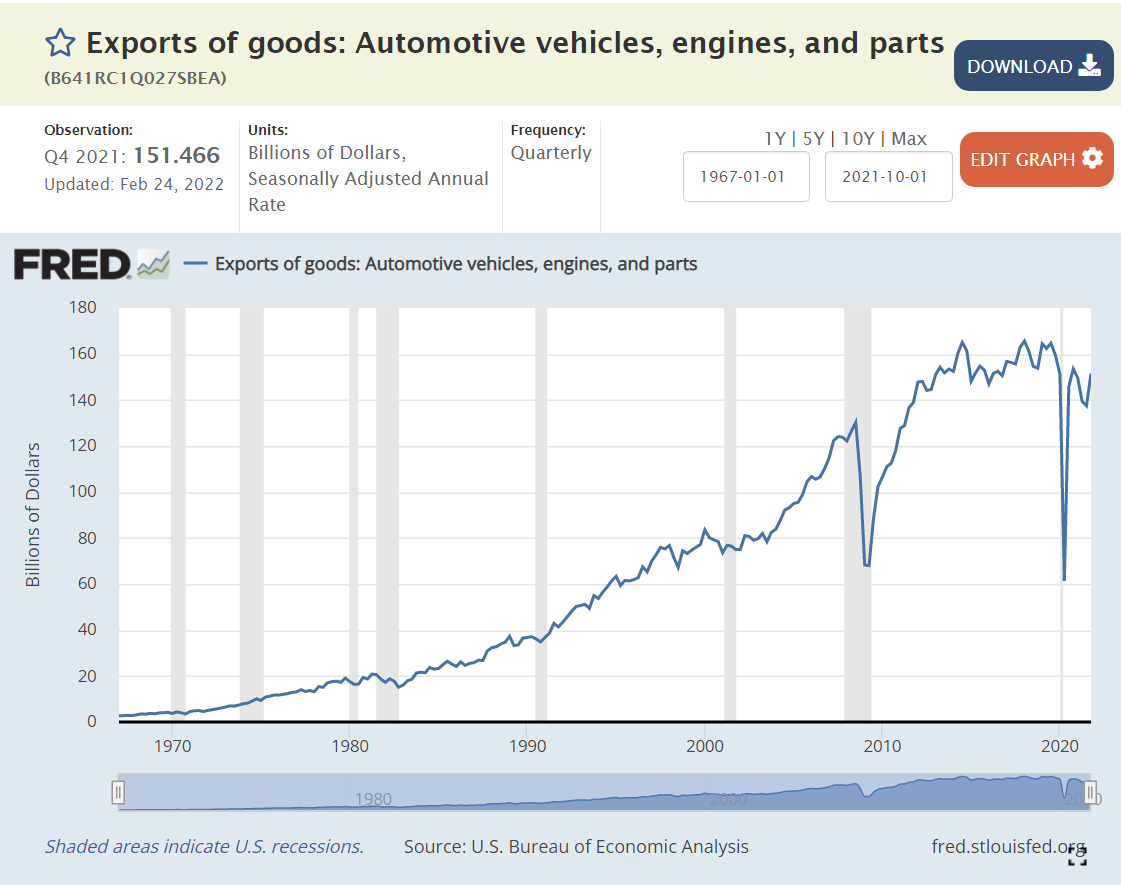
Another positive result. US auto exports are up 140% in real terms, or 2.1% per year.
Consumer Goods Exports
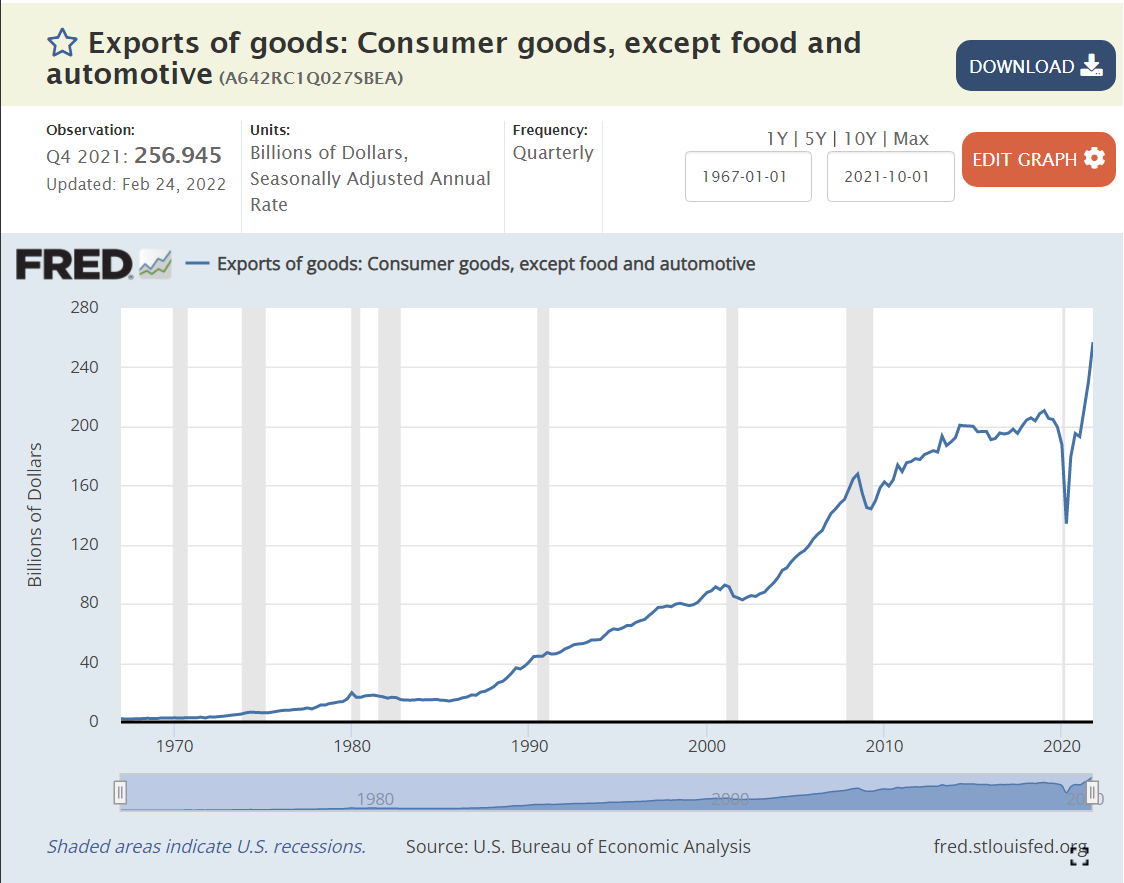
Miscellaneous consumer goods exports increased by 340% or 3.6% annually, an amazing performance!
Services Exports
US services exports grew by 350% in these 4 decades, by 3.7% annually. The US is very competitive in the “most competitive” areas of international trade.
Summary
The US economy continues to increase its internationally competitive real exports at a rate of 2.5% per year in the long-term. The US is very well positioned to prosper in an era of increased global and free trade.
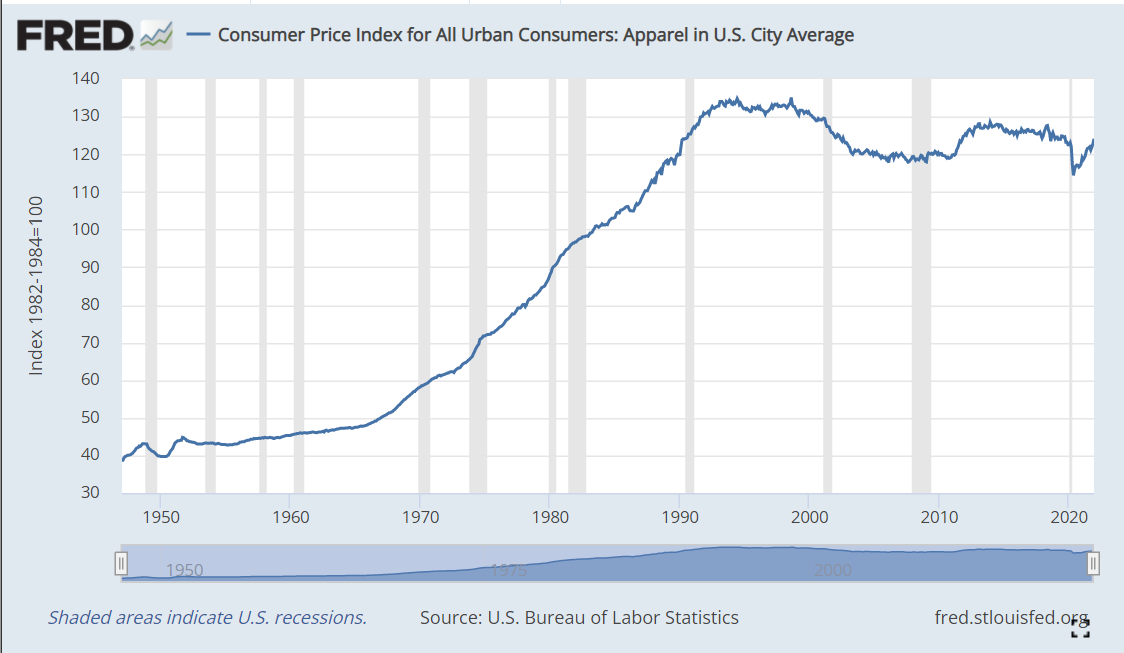
The nominal/actual average price of clothing today in the USA is 3% LOWER than it was 30 years ago, in 1991!!! Meanwhile, the overall consumer price index (CPI), has more than doubled (+106%). So, the price of clothing, relative to overall prices, has dropped by a mind-boggling 53% in the last 3 decades!
This is on top of the 37% real reduction in prices from 1970 to 1991.
From 1960 to 2021, the real reduction in clothing prices is a full 71%. More than two-thirds.
At the height of the cold war, in the year on my birth (1956), Soviet First Secretary Nikita Khrushchev warned the US that “we will bury you”. Agriculture was still a very large share of the USSR and US economies. He couldn’t have been more wrong.
US statisticians have long separated the farm and nonfarm economies. A “census of agriculture” is conducted every 5 years to complement other economic statistics collected. The USDA Economic Research Service (ERS) does a great job of compiling statistics for the narrow (farming), moderate (fishing, timber) and broad (ag based production) agriculture industries.
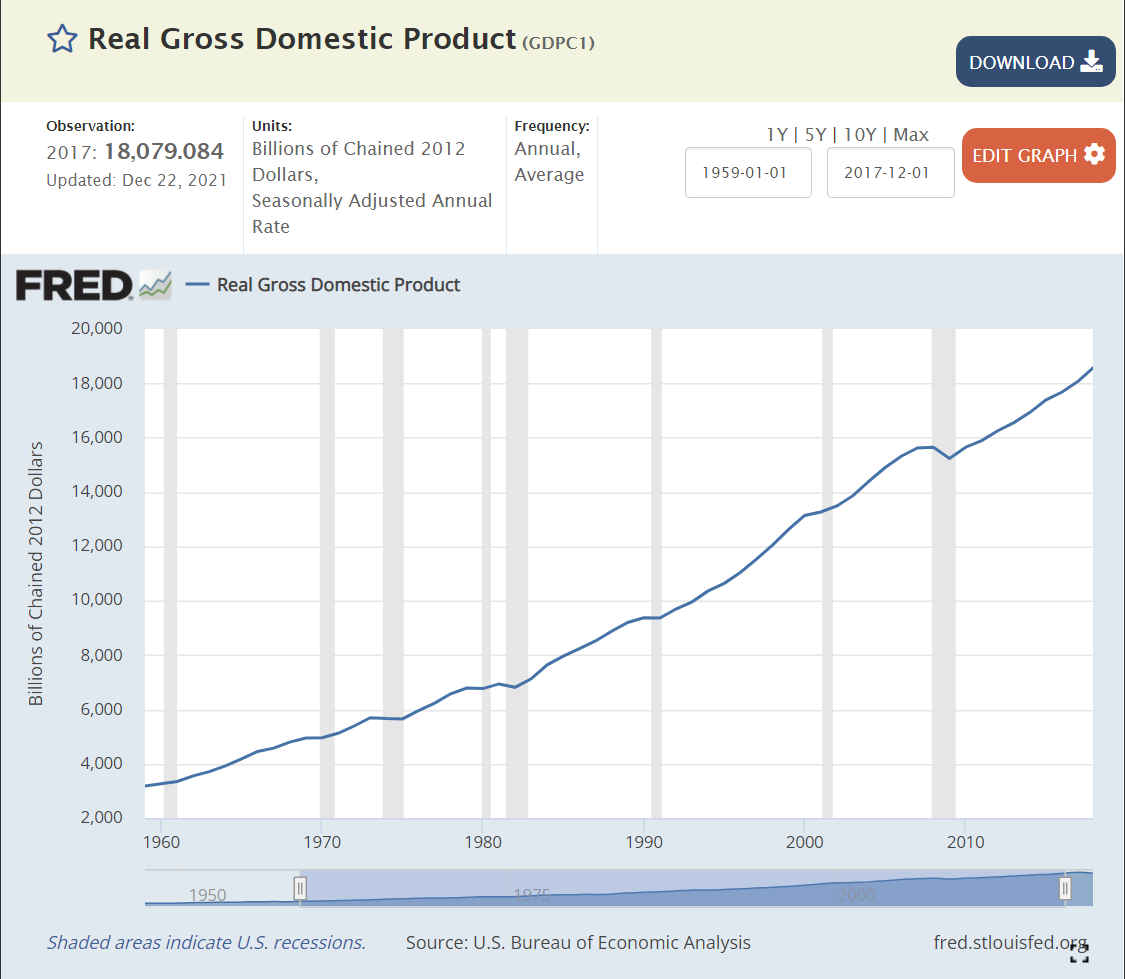
I’ve chosen to examine the near 60-year period from 1959-2017 covered by the censuses of agriculture. During this time, Real (inflation adjusted) US Gross Domestic Product (GDP), the value of all goods and services produced, increased from $3 to $18 trillion dollars, a near 6-fold increase, or 3% annually, year after year after year.
We don’t have an economic series that tracks wage and salary income back before 1979, but real disposable income per capita exists for this whole time period. This indicator or labor costs increased 3.4 times, from $12,600 to $42,900, or 2.1% annually. Given the strong growth of the US economy and its many new opportunities AND the increase in labor costs facing the oldest industry, one might have agreed with the Soviet premier back in 1956, at least regarding US agriculture. But, that prediction was wrong.
Index of Unit Outputs
The US agricultural economy grew to more than 2.5 times its 1959 base by 2017. It grew by 75% in the first 30 years and an additional 50% on top of that new base. The consistent pattern of growth is striking.
Real Market Value Produced
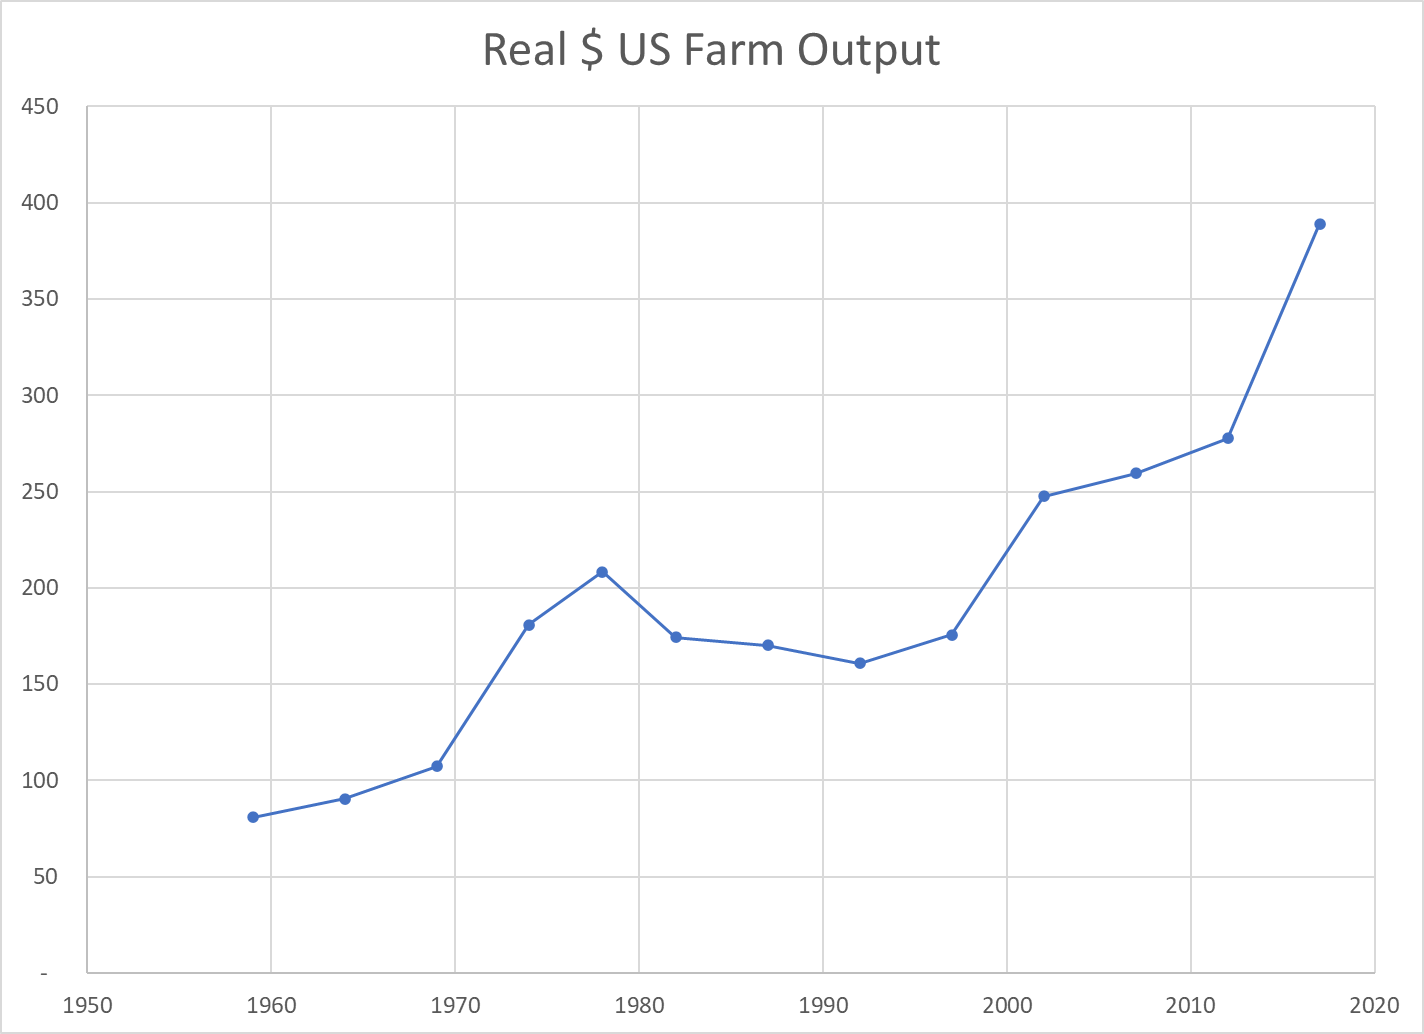
The Ag economy grew (based on variable market prices) 5-fold from $80B to $390B during these six decades, increasing by 110% in the first 30 years and a compounded 130% in the most recent 30 years.
Land Input (Acres)
The amount of land dedicated to production agriculture has decreased by 20% during our period of focus, from 1.1B to 0.9B. The decline was faster in the first 30 years (14%) than the second 30 years (7%). Despite this reduced demand for agricultural land, the value of such land has increased in real terms as its productivity has grown.
Labor Inputs FTE
The full-time equivalent labor force in the ag industry, as best as the USDA can measure it, dropped by nearly two-thirds in our six decades, from 2 million to about 700,000. It fell more rapidly in the first 30 years (50%), but a solid 25% in the most recent 30 years.
Total Factor Productivity
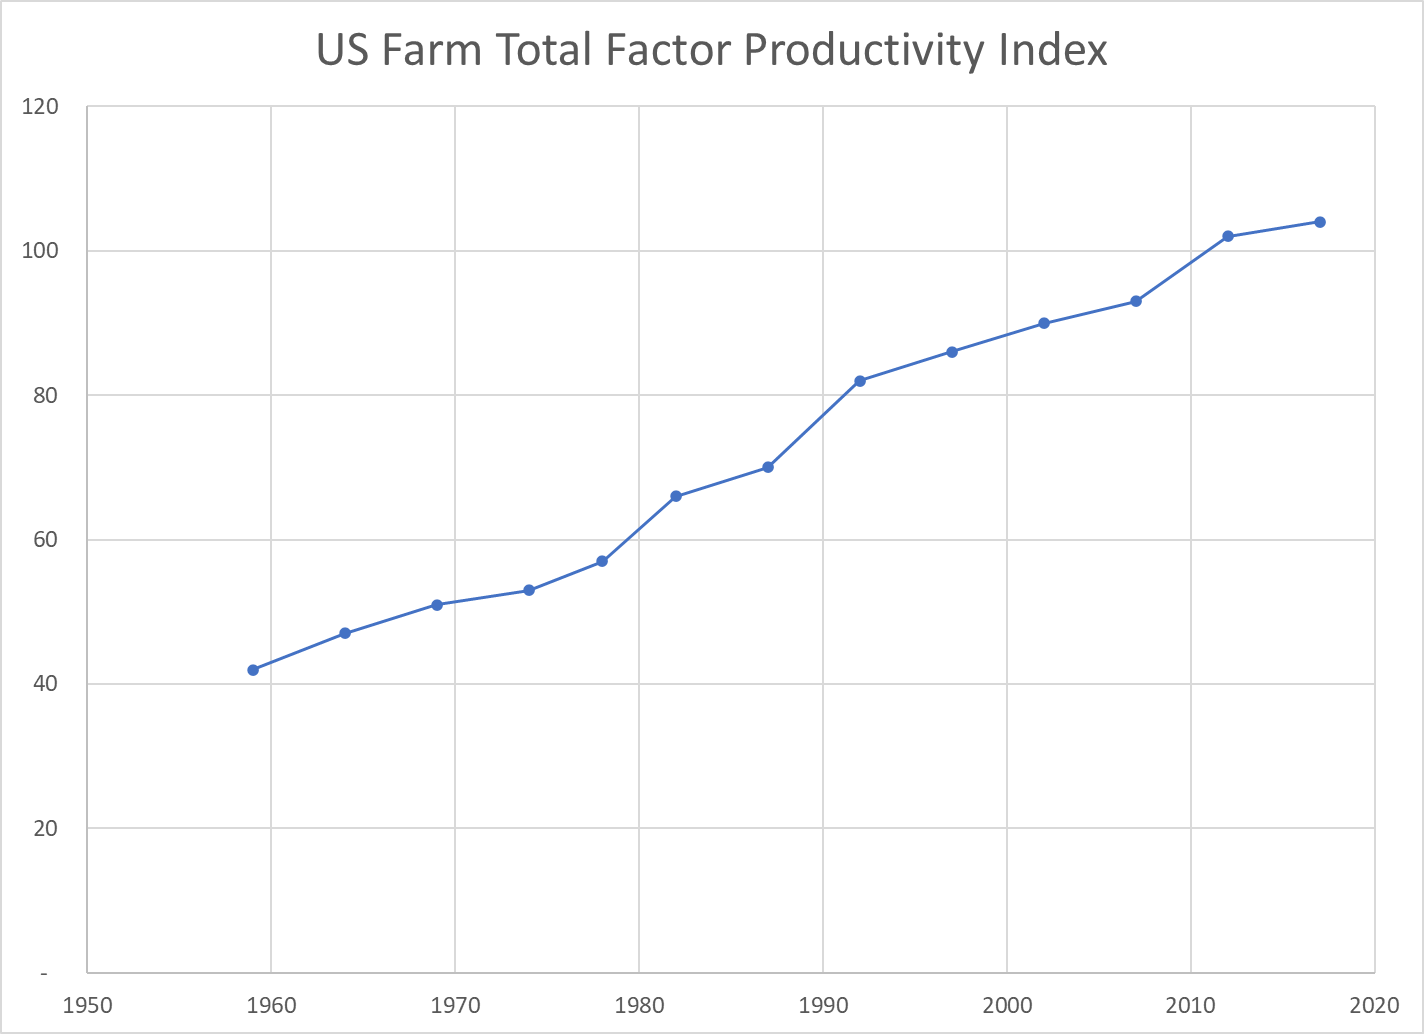
Economists try to measure land, labor and capital as inputs to the agricultural production process. As noted above, land and labor have declined. Capital – equipment, improvements, patents, inventory, etc. has increased. Overall, the total inputs have remained roughly flat for 60 years. Hence, almost ALL of the increased unit output is due to increases in productivity. Better crops, better labor skills, better processes, better methods, better irrigation, better crop rotation and selection, etc. Economists call this “total factor productivity”. After accounting for measurable increased inputs, the remaining improvement is called “productivity”.
The oldest industry in the world, increased its productivity in the US by 150% in these six decades; by two-thirds in the first 30 years and by one-half on the higher base in the second 30 years.
Output per Labor Unit (Labor Productivity)
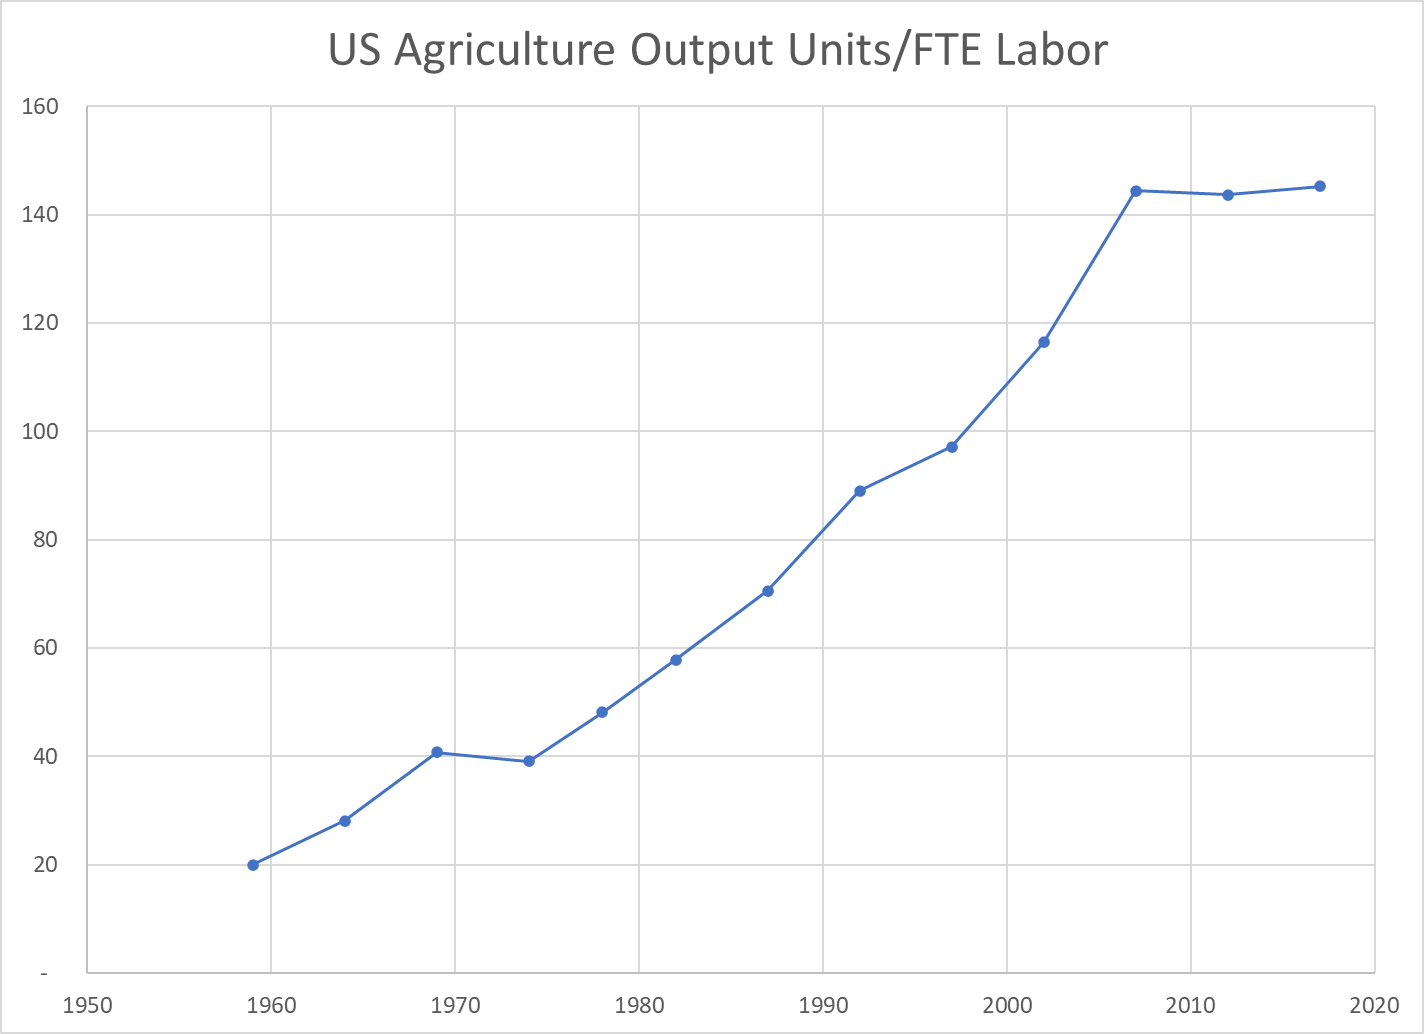
The strong increase in production combined with the two-thirds reduction in FTE labor required resulted in a 7-fold measure of improved labor productivity. The land input was down by 20% and the capital input increased significantly, but in simple terms, each hour of labor in 2017 delivered 7 times as much output as the labor in 1959. The increase was 2.5x in the first 30 years and a solid 2x in the more recent 30 years.
US Agriculture Output Price Index
The index of agricultural industry output prices has increased by 3-4x versus 8x for the consumer price index or GDP price index.
Real Market Value Produced Per Acre
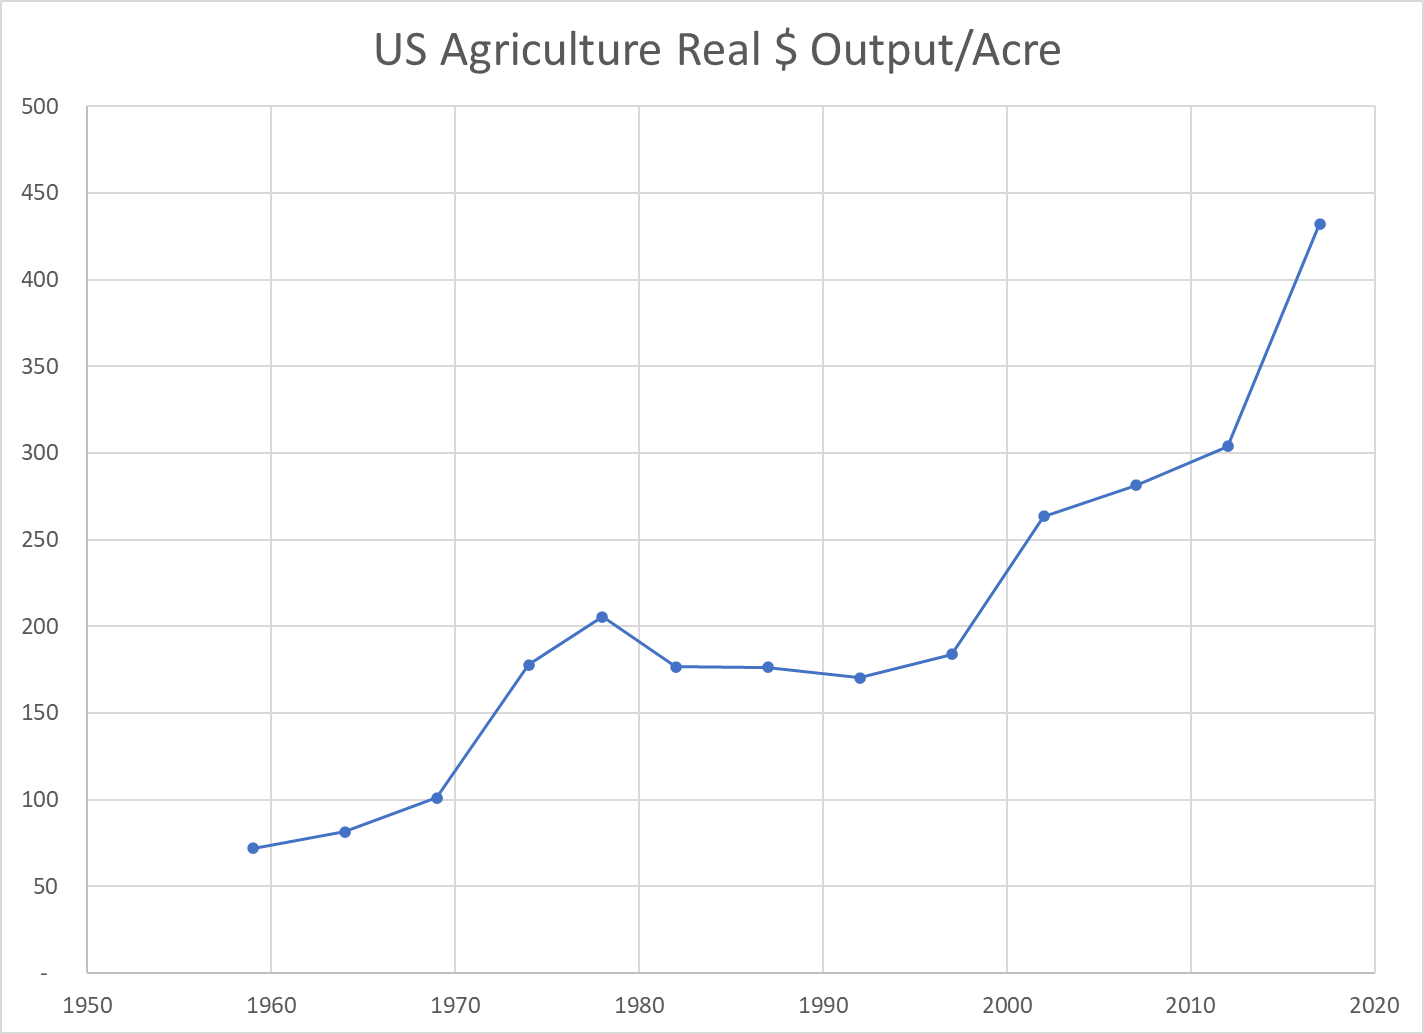
The real market value of ag goods produced increased 5-fold. The land acres required declined by 20%. The output value per acre figure improved 6-fold. Again, labor inputs declined and capital inputs increased. This measure of land productivity improved by 150% in both of the first and second 30-year periods.
Real Agricultural Exports
Real ag exports increased 4-fold in these 6 decades, doubling in the first and second 30-year periods.
Summary
Less land and labor. More capital (equipment). Much better R&D and processes. Total factor productivity up by 150% across 6 decades, an average of 1.6% year after year after year.
The US ag industry faces many challenges today. Environmental issues and climate change. Water shortages. Lower public and private R&D investment. Brain drain. Political polarization. Concentration of key property rights. Low wage labor access. Changing trade rules. Nonetheless, the last 60 years indicates that this industry is capable of delivering further increases in production and productivity for the next 60 years.
US GDP/Capita remains the world leader among large countries in 2018. I’ve extracted comparison data for a dozen representative countries covering the period of 1900 through 2018.
Kuwait/Qatar/Brunei, Singapore/Hong Kong and Iceland/Norway/Luxembourg have higher GDP/Person. For reference, Saudi Arabia is just below the US, while other potential key comparison countries are much lower: South Korea ($39), Russia ($26) and China ($17).
Taking the long view (120 years), this above (table) set of countries grew their real (inflation adjusted) GDP per person 9-fold, from just $4,000 to $36,000. The US increased 7-fold, from an $8,000 initial position (twice as high) to $55,000 (still 60% higher).
Sweden (14x), Brazil (16x) and Japan (18x) lead the way in century long growth. Argentina (4x) and the UK (5x) were the only countries with slower percentage growth than the US. The US was the world-leader in 1900, providing an advantage for generating growth dollars and a governor on generating percentage growth. The history of the twentieth century was one of less developed countries using technology transfer and increased trade to “catch up” with the historic leaders.
Prior to WW II, most countries grew by the average 60%. Germany and Brazil grew a little faster (80%). Japan and Sweden grew much faster (130%).
Growth from 1960 until 2018 averaged a remarkable 240%! Japan grew 5-fold, leading the way for the “Asian Tigers”. Brazil, Hungary and Germany grew 4-fold. The UK continued its subpar performance (180%), despite the alleged Thatcher revolution and Argentina fell even further behind (110%). US growth was a little slower than average (210%) in the last 60 years, from a starting base of $18,000 versus the average of $10,000 (80% higher).
On a percentage basis, the US growth in output per person was slower than average. On a dollars basis, it remained the market leader overall and added more value than all other countries.
For the whole 120 year period, the US added $47,000 to its GDP/person, growing from $8,000 to $55,000. Australia (43), Germany (41), Sweden (41) and Canada (40) were solid competitors. Japan, France, UK and Italy added more than $30,000 per person. Hungary, Argentina, Mexico and Brazil lagged, adding just $10-20,000.
In the last 60 years, the US added $37,000 to $GDP/capita, tripling its $18,000 base. Australia (36), Germany (34), Sweden (31), Canada (31) and Japan (32) were close competitors. France, UK, Italy and Hungary added $20-27,000. Argentina, Mexico and Brazil grew more slowly ($10-12,000).
Per Capita GDP as % of USA
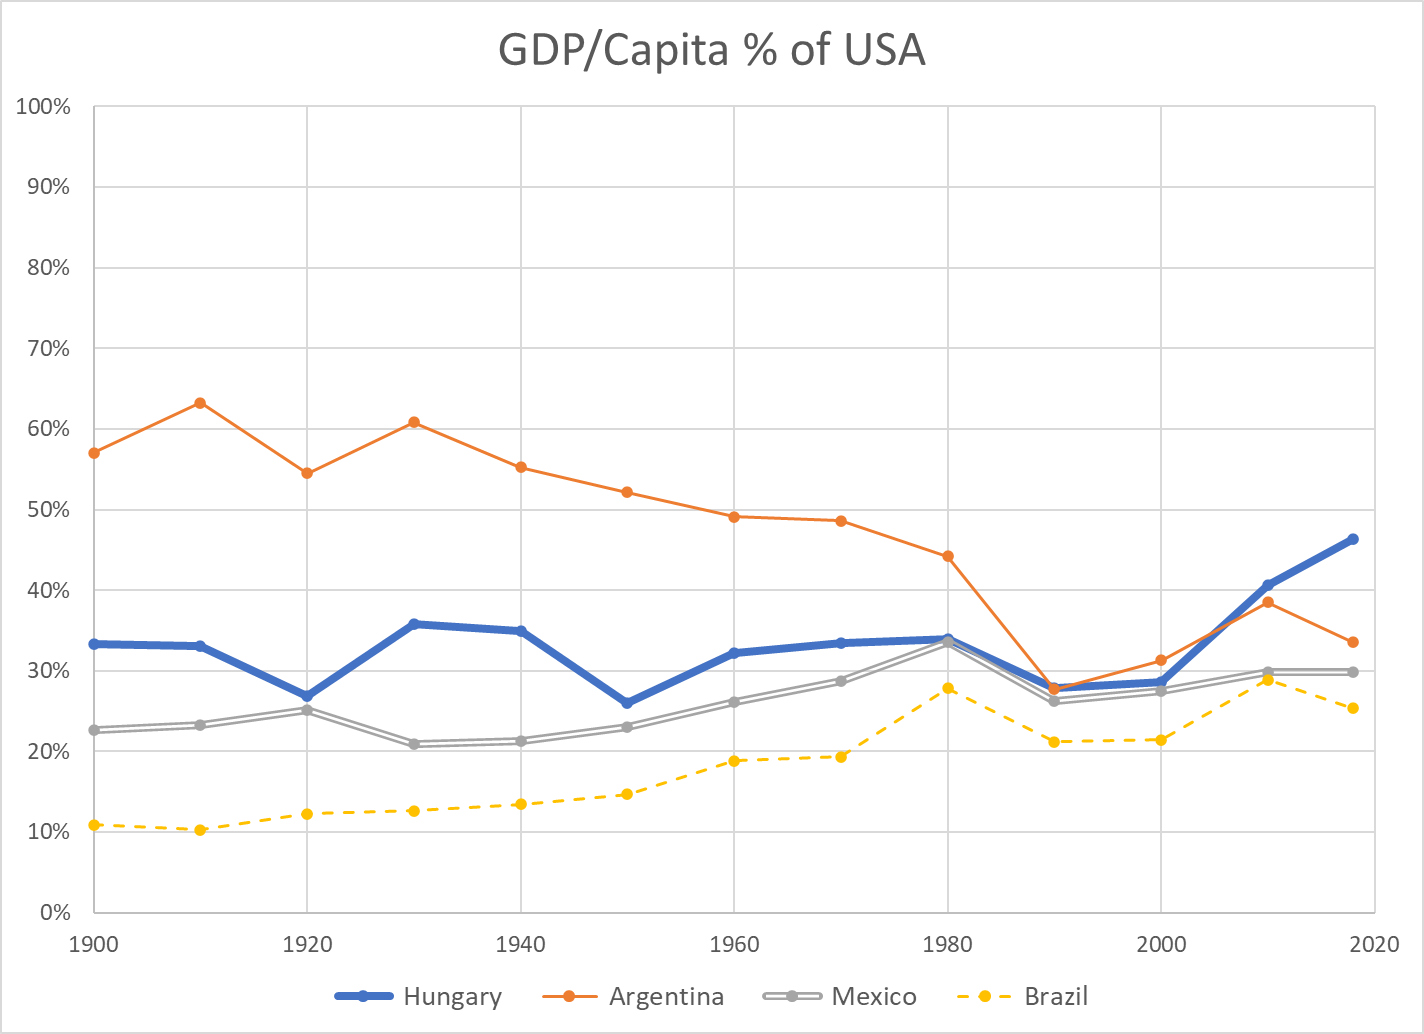
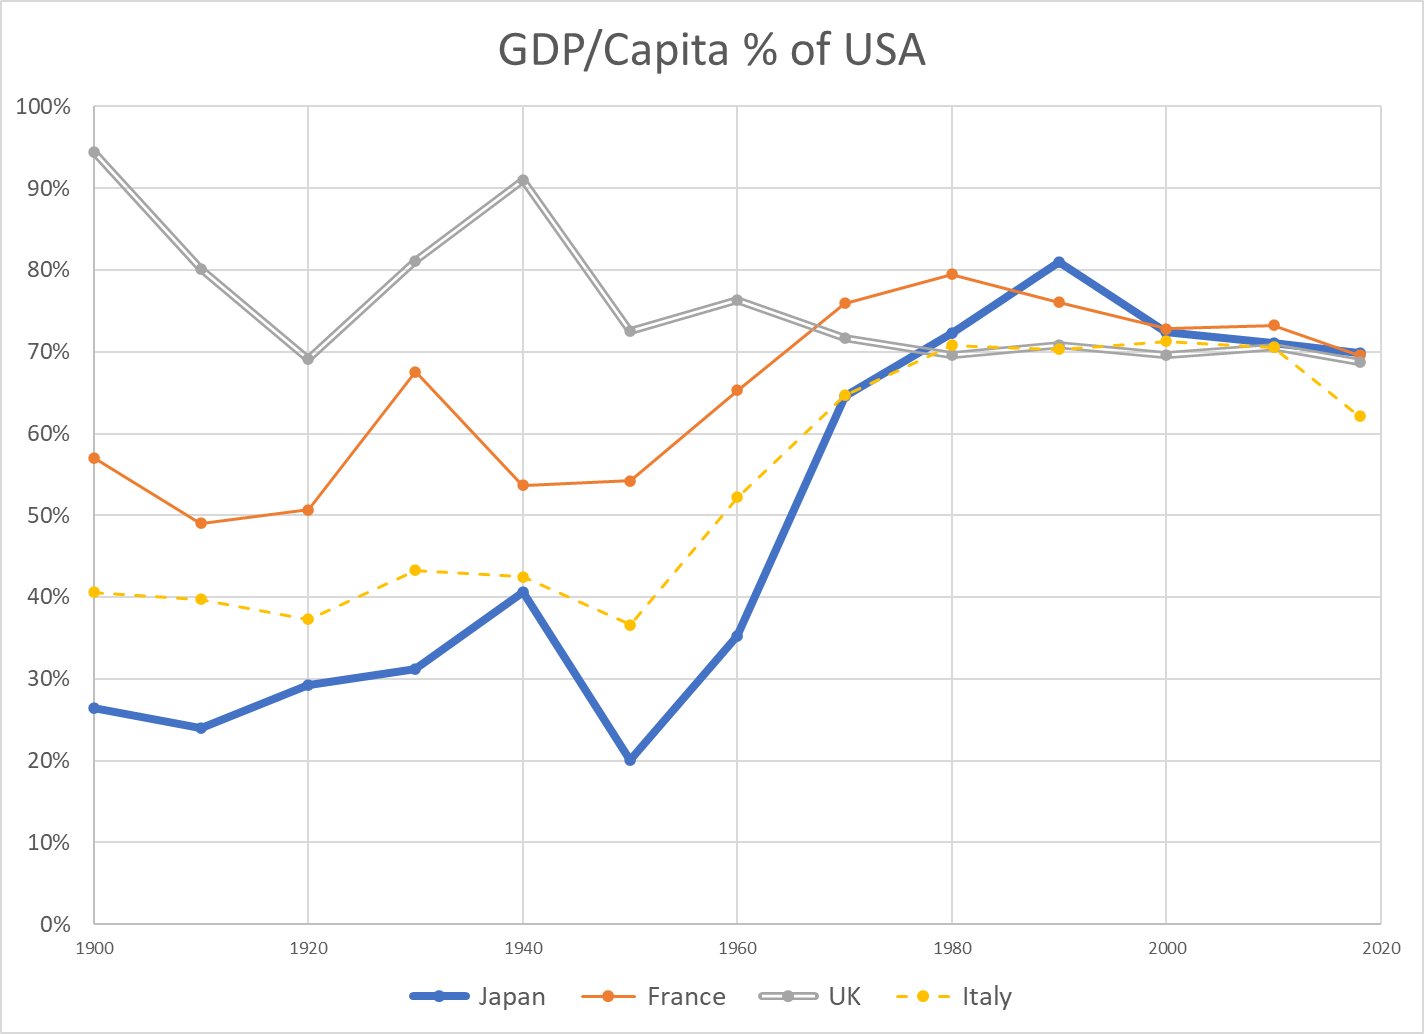
Another way to place the US performance in perspective is to use it as the baseline and plot other countries’ per capita GDP as a percentage of the US level.
There are different ways to compare GDP across countries. There is not a full consensus among economists. I’m using data from the Maddison Project Database. The data shown on the Worldometer website uses a different method, but the basic results are comparable.
First, we see that the US has had the highest $GDP/capita throughout the 120 year period. In 1900, the US was at $8,000 and second place UK was at $7,600, beginning its long relative decline from being THE imperial power to a mid-level (nuclear armed) European country. In 2018, the US produces $55,000 per person versus second place Australia at $50,000 and third place Germany at $46,000. Adjacent Canada generates 20% less value at $45,000. Formerly high-flying Japan now rests at $39,000 per person.
Argentina is an outlier, dropping from 60% to just 35% of US income per person for various political, financial, economic and trade reasons. Hungary is representative of smaller eastern European nations that remained at just 35% of US levels until the fall of the Berlin wall and subsequent integration into the European economy, allowing them to grow towards 50% of the US level. Mexico has slowly grown from 20% to 30% of the US level, but not been able to accelerate further. Brazil has grown from just 10% to nearly 30% of the US level, with significant volatility.
The UK fell from 90% to 70% of the US value added per citizen level by 1970, where it has remained. France weathered the 2 world wars at 55% of the US income level. It recovered nicely to 75% by 1970, peaked near 80% and then drifted back to 70% with its 4-day work weeks. Italy remained at just 40% of the US level through the war years. It grew remarkably to 70% of the US level by 1970, where it remained, before falling back somewhat in the last decade. Japan also struggled through the war years, averaging 30% of the US level. It rocketed to 80% of the US level by 1990, riding total quality management, manufacturing, peacetime and expanded trade. It has dropped back to 70% of the US level.
Australia level pegged the US at 80% for much of the period, until the China lead commodities demand boom pulled it up to 90% recently. Canada grew from a rural, thinly populated, commodities-oriented country at 60% of the US up to 80% by 1970 and has remained in the low 80 percents since then. Germany began the century at 60% of the US level. Following two failed wars, it attained 70% of the US level by 1960. Digesting East Germany was a challenge, but Germany was at 75% of US levels in the early 2000’s and exceeded 80% soon thereafter, riding its manufacturing export capabilities.
Summary
US $GDP/Capita continues to lead the world, as it has done for more than a century. The US percentage growth rate has slowed, but the incremental value added has remained first among large countries. Some other countries have shown periods of relatively strong growth, but none has demonstrated an ability to challenge the US. A number of European countries have found a “mixed” market approach that is competitive with the US, leveraging lower trade barriers within the EU and across the world.
China Postscript
China $GDP/capita (000’s) numbers for 1950 through 2018 are 0.8, 1.1, 1.4, 1.9, 3.0, 4.7, 9.7 and 13.1. Low scoring Argentina (19), Mexico (16) and Brazil (14) each have higher productivity per person. China per capita GROWTH per decade figures are 0.3, 0.3, 0.5, 1.1, 1.6, 5.0, and 3.4 (thousands). The percentage figures are very impressive. Considering China’s 1.4 billion population, they are very impressive. Comparable US decade growth (thousands/person) figures are 3, 6, 5, 7, 9, 3 and 6.
The US has a century-long track record of generating an extra $5,000 per person of value-added output each decade. China has leveraged its low-wage labor, a young work force, manufacturing technology transfer, willing investors, willing importers and an international free trade system to drive its growth. The country has maintained political stability and invested in its economic infrastructure, using economic progress and some level of economic freedom to offset the risks of its political and social restrictions. It faces a flat population and shrinking working-age population before it transitions its remaining rural work force into the manufacturing or urban environment.
It is facing what economists call the “middle income trap”, where countries with rapid economic growth based upon manufacturing or resource extraction need to transition a large part of their economy to higher value-added services and advanced manufacturing. Many countries have failed to make this transition. Some have done so.
I’ve worked closely with Chinese electronics firms for more than 25 years. Their capabilities are much greater than what is recorded in the US media. They have solid manufacturing capabilities, including Japanese-style process improvement. They have very strong sales, marketing and account management capabilities, focused on their global business-to-business customers. They have strong product development engineering capabilities and growing project management skills. They have modern MBA management skills and business styles. Their “clusters” of manufacturing, parts, R&D, resources and logistics skills point to long-term competitive advantages in many industries.
I believe that China will continue to be a manufacturing powerhouse, despite trade restrictions. China is well positioned to deliver products to growing markets in Asia, Africa, the Middle East and Latin America.
That being said, I am not concerned that China will eclipse the US in total productivity per citizen in the next 50 years. The gap is simply too large. In 50 years, the US will very conservatively grow from $55,000 to $80,000 of output per person (8%/decade). Mathematically, this requires 3.7% growth in China each year for 50 years, or 44% growth per decade compounded to reach 6.2 times the current level. The historical data contains 1 or 2 decades of 40% growth for some exceptional countries, but not 8 (3 in the bank, plus 5 in the future). If China can grow by 6% annually for one decade (79%) and 5% annually for the next decade (63%), it COULD then grow by just 2.5% annually (28%/decade) to catch the US in 2070.
China has 1.4 billion people versus 330 million in the US. Even including Canada and Mexico, the North American population is just 0.5 million. Europe has roughly 750 million people. Japan, South Korea, Australia and New Zealand have just over 200 million people. Indian has 1.4 billion people, Africa 1.2 billion and Latin America 0.7 billion. China will be a growing world economic and military power, even with its population peaking in 2025-30. The US should consider China to be its primary global rival, perhaps with less “us versus them” posturing. China aims to protect its economic, political and military interests, never again to be dominated and humiliated by outsiders. But, China truly considers itself to be the “center of the universe” and has no “need” to dominate the rest of the world or export its ideology. There are low confrontation options available.