Human Progress: Accumulate and Innovate

https://www.cnn.com/2016/03/17/world/gallery/tbt-albert-einstein/index.html

Human progress is based on 4 things, IMHO. We are able to abstract and generalize. We accumulate our lessons learned. We innovate. We combine our structured, accumulated knowledge with innovations. Creativity and innovation get most of the attention. Yet, the accumulation of our practical and theoretical experience in language, books, records and equations may be equally important. The ability to switch “back and forth” between a fixed structure, history, religion and culture and new innovations may be the most important aspect of all. We have divergent and convergent thinking abilities. We use inductive and deductive reasoning. We intuitively prefer “either/or” but can manage “both/and” logic. The modern history of mankind’s progress points towards the importance of creativity and “both/and” logic.

Abstraction is a relatively recent phenomenon. Democritus imagined atoms, smaller and smaller particles. Heraclitus imagined all as change. The Greeks imagined earth, water, air, and fire beneath everything. Pythagoras and Euclid provided geometric proofs and ideal figures. Aristotle offered a powerful version of formal logic. Plato defined the “forms” and the ideal realm that stands above our experienced reality. Descartes defined mind versus body and the Cartesian coordinate system. Newton rationalized the universe in terms of algebraically defined laws. Kant defined pure logic and the limits to pure logic. The great appeal of abstract rules and an implicit mechanical universe remains to this day. The “Enlightenment” produced new politics, economics, culture, science and religion based upon these powerful insights.

The accumulation of knowledge has occurred in a surprisingly wide variety of forms. Life in DNA. Sexual reproduction. Man’s biological memory. Human consciousness. Spoken language. Music. Myths. Written language. Culture. Laws. Accounting systems and records. Religious practices. Architecture. Books. Libraries. Scribes. Printing. Histories. Universities. Experimental science. Prophets. Peer-reviewed journals. Scientific societies. Mass media. Recordings. Radio. Video. Internet. Wikipedia. Zoom. 

The history of innovation is well known. I want to highlight the general trend away from simple, atomistic, “either/or”, static views to more complex, multi-level, “both/and”, dynamic, organic views that provide much better insights into our real experience.

Physics has moved from statics to dynamics. Classical mechanics has been replaced by complex, probabilistic quantum mechanics. The fixed, static, deterministic perspective has been replaced by Einstein’s relativity. In general, deterministic views are replaced by probabilistic views. The solid atoms have been replaced by waves and fields. Light exhibits both wave and particle behaviors. Heisenberg says we cannot measure everything. The background framework of an “ether” is no longer required. The mathematics required to describe physics has moved from algebra to multi-variate calculus to string theory. Only a handful of people truly understand the frontiers of physics in the last 100 years. 

Mathematics has advanced wonderfully in the last 500 years. Newton and Leibniz invented the calculus. Man could now measure, describe, imagine and control changes through time. There is an equation underlying all activities that can, in theory, predict the future and explain the past. Dynamics can be described. Three-dimensional Euclidean geometry was superseded by multiple-dimensional geometry, Riemann curved space and fractals. Probability theory was developed to clearly describe apparently random activities, providing a solid basis for evaluating the results of experiments. Set theory evolved to encompass all of mathematics and logic, including various conceptions of infinities. Goedel’s 1931 “incompleteness theorem” undercut Russel’s attempt to define a single, bottoms-up, certain, powerful mathematics.

Biology evolved from collecting, illustrating and categorizing specimens to Lamarck’s deterministic evolution to Darwin’s evolutionary survival of the fittest perspective. Society increasingly adopted a biological, process, systems theory perspective in place of a physics, mechanical, materialistic perspective. Nature versus nurture became nature and nurture. The details of genetics is better understood as a very complex process involving multiple genes and other structures.

In philosophy, Hegel defined his dynamic thesis, antithesis, synthesis model. History now ruled. Eternal universals were much less likely. Multiple perspectives were elevated. Certainty was less likely. Marx tried to use Hegel’s general framework combined with an economic, materialist determinism but he failed.

In practical technology, we have seen the rapid accumulation of knowledge. We have also witnessed the great importance of “both/and” solutions. For example, ships and automobiles required the invention of a clutch that provided both solid propulsion and slippage. Powered vehicles first required rails but were turned loose as motor carriages. Wheels evolved from steel to rubber to accommodate shocks, turns and rough roads. Vehicles added suspension systems. 

In economics, we advanced from mercantilism to comparative advantage and free trade. We left behind land, labor or capital as the only sources of value with the insights of the marginal productivity economists. We moved from static to dynamic perspectives and focused on the determinants of growth in advanced and developing nations. Keynes demonstrated that national economies were more than the sum of individual markets and that self-regulating equilibriums were not inherent in a market system. 

Computer systems have evolved from fully defined linear and logical systems to massively parallel systems capable of artificial intelligence and spoken interaction with humans.

Businesses have replaced assembly lines and Taylor’s experiments with a deeper understanding of individual tasks in probability terms and the sequence of events in any process. Firms have embraced Japanese style process management and improvement, delivering constantly improving results. Supply chains span the globe. Project management is now “agile”. Strategic planning is no longer deterministic, but focused on mission, vision, values, strengths, weaknesses, opportunities, threats and culture. Investments are considered within the framework of portfolios of risks and returns. Entrepreneurs and leaders are valued above technical and professional experts.

For many, religion has evolved from a legal, literal, deterministic perspective to one that emphasizes the principles, insights, opportunities, feelings, experiences and possibilities of a given creed, despite the loss of absolute certainty in a “Secular Age”. 

As humans we prefer a simpler, more deterministic view of the world. Yet the world shows us that it is more complex and that we will never fully understand it. 

Mostly Good News Since the 2008 Great Recession

https://content.time.com/time/specials/2007/article/0,28804,1733748_1733756_1735278,00.html

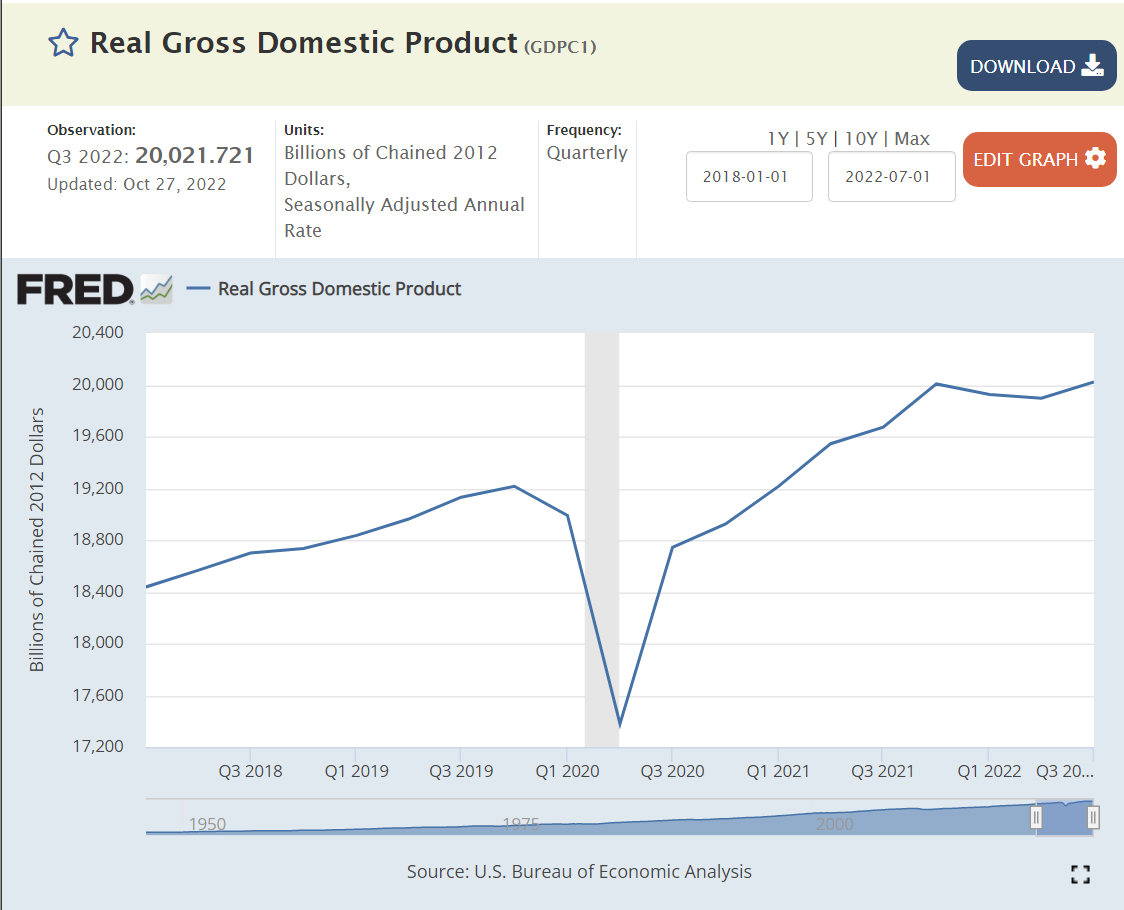
Real, after inflation, Gross Domestic Product is up by one-third, despite the pandemic. That’s 2% annually, despite the Great Recession and the pandemic. The US economy is very solid.

A 21% increase in per capita income during this time. Quite solid and constant growth.

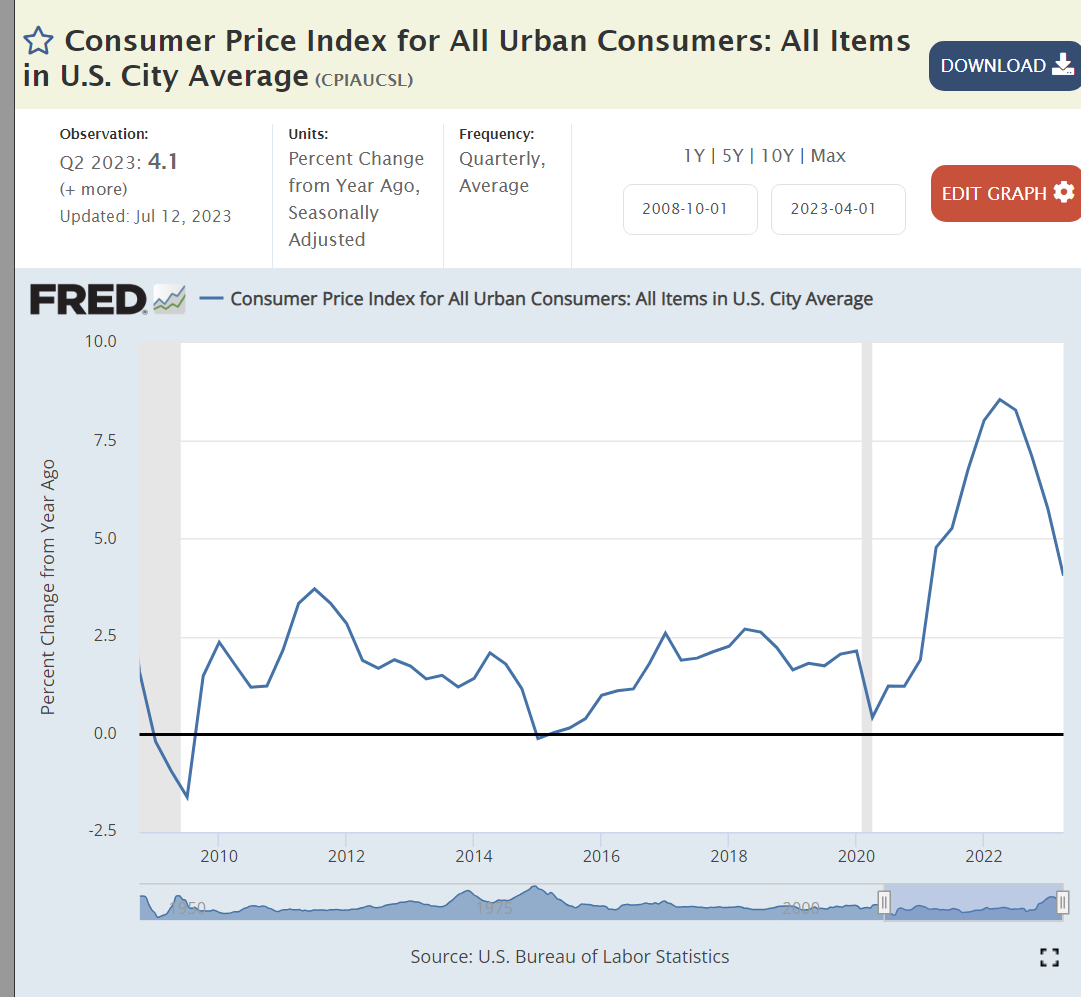
Inflation averaged a bit less than 2% before the pandemic, spiked to 8%, and has since declined to 4%. Experts disagree on whether it will return to 2% soon.

Gas prices are the most obvious component of inflation. They are largely driven by global supply and demand. Prices today are the same as in 2011-14, despite the general inflation increase of more than 20% since then.

Despite the pandemic, US unemployment is at a 50 year low!

Job seekers today encounter 3 times as many job openings.

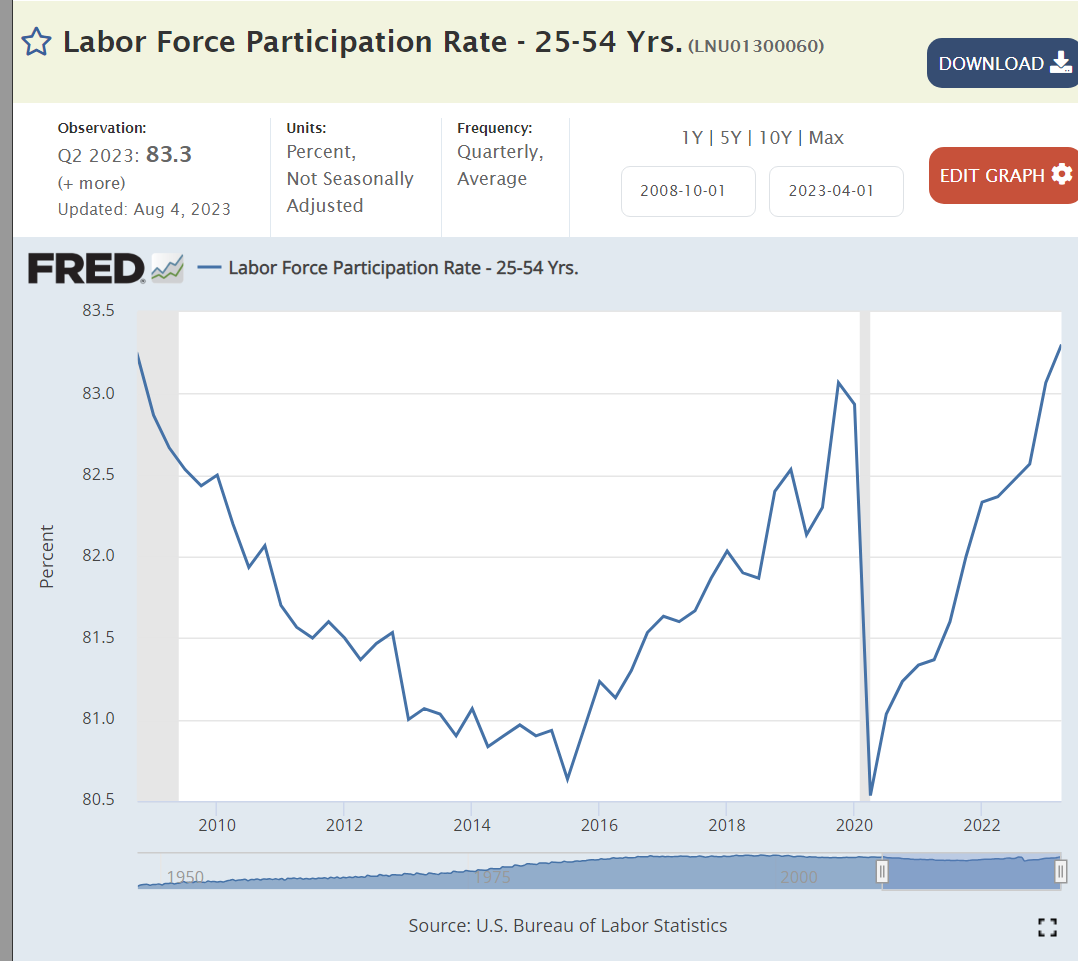
Core age labor force participation has snapped back after the pandemic.

Investment values have doubled.

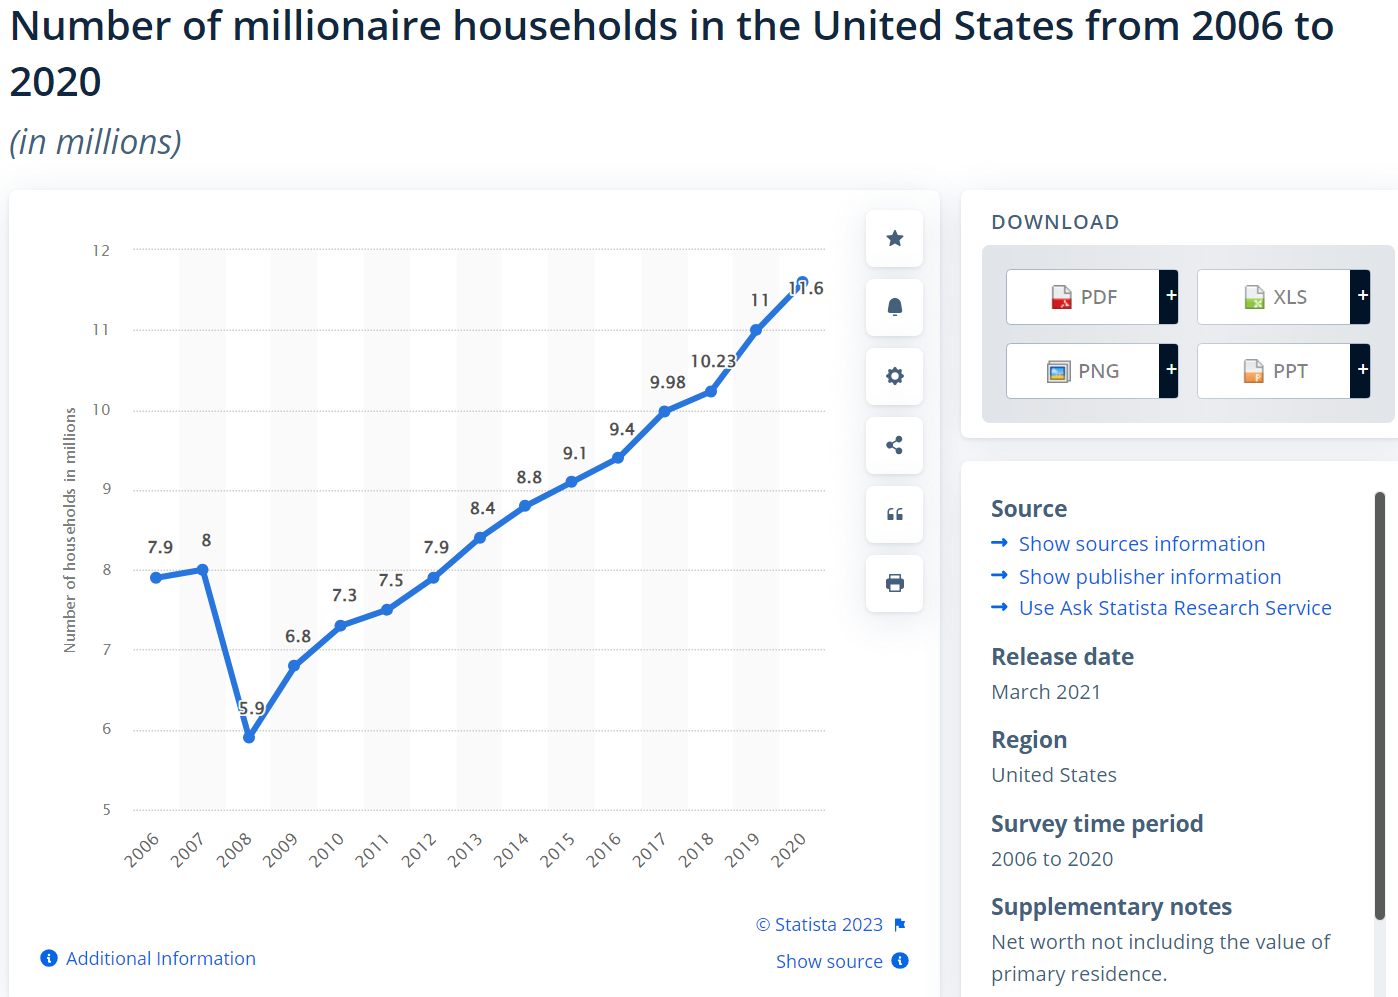
The number of millionaires and billionaires in the US has continued to increase.

Personal savings rates rose from 6% to 9% before the pandemic, shot up and fell back down to just 4% recently.

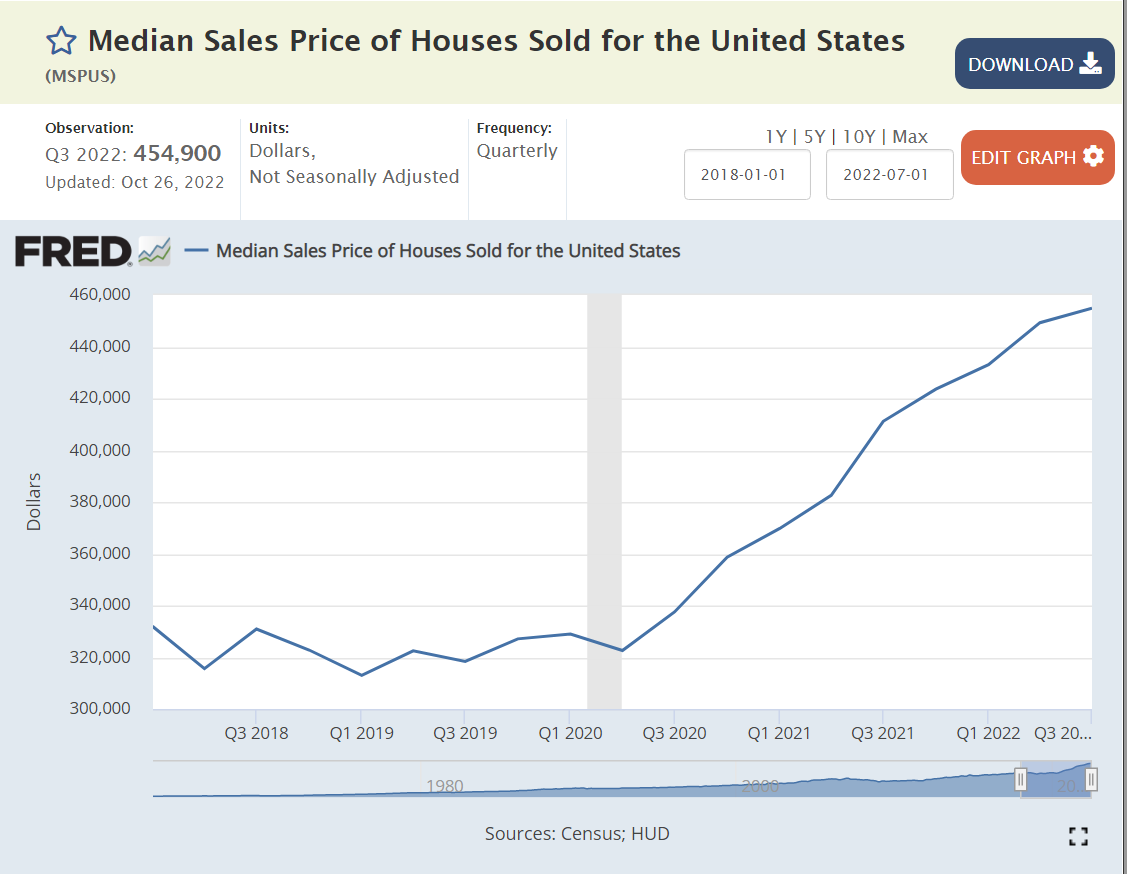
Housing values have doubled since the Great Recession.

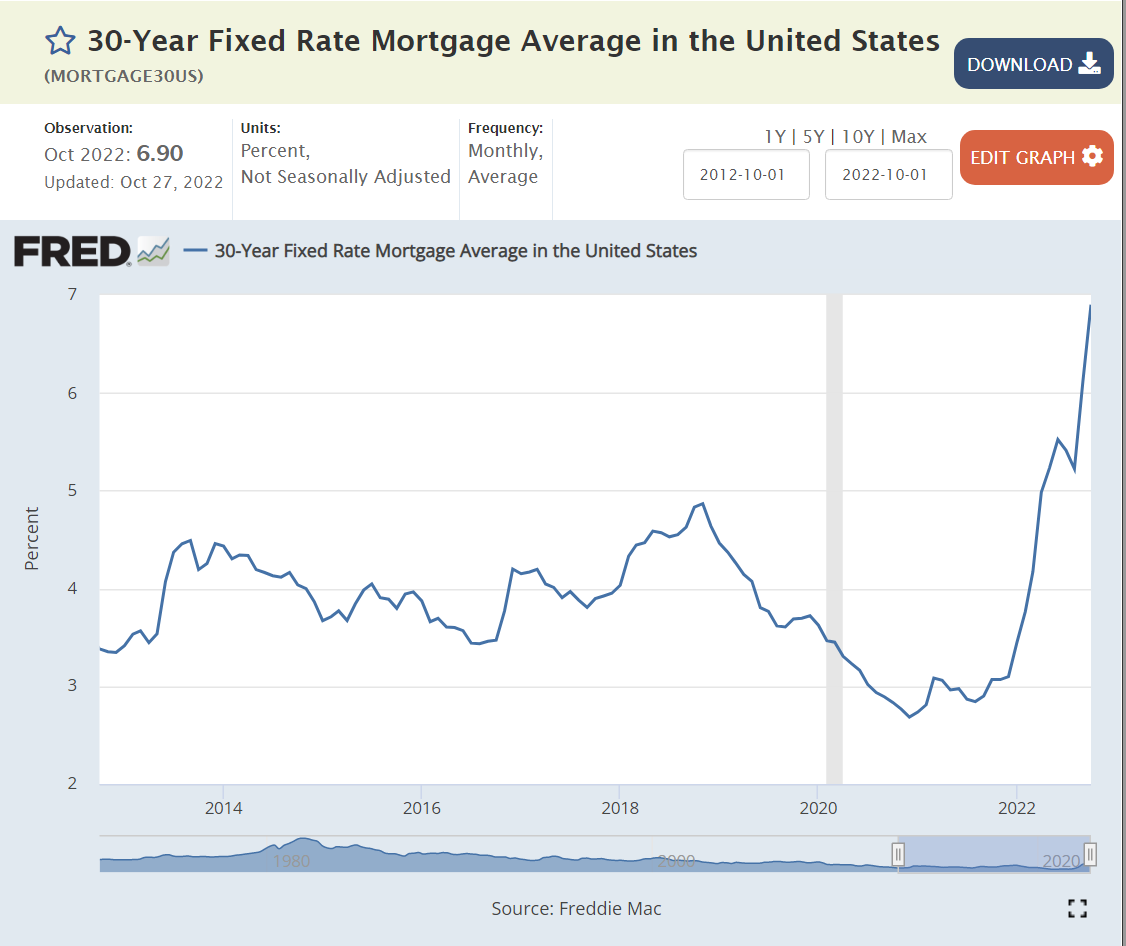
Mortgage rates averaged 4% after the Great Recession, dropped to 3% and then increased to 6%+ as the Federal Reserve raised interest rates.

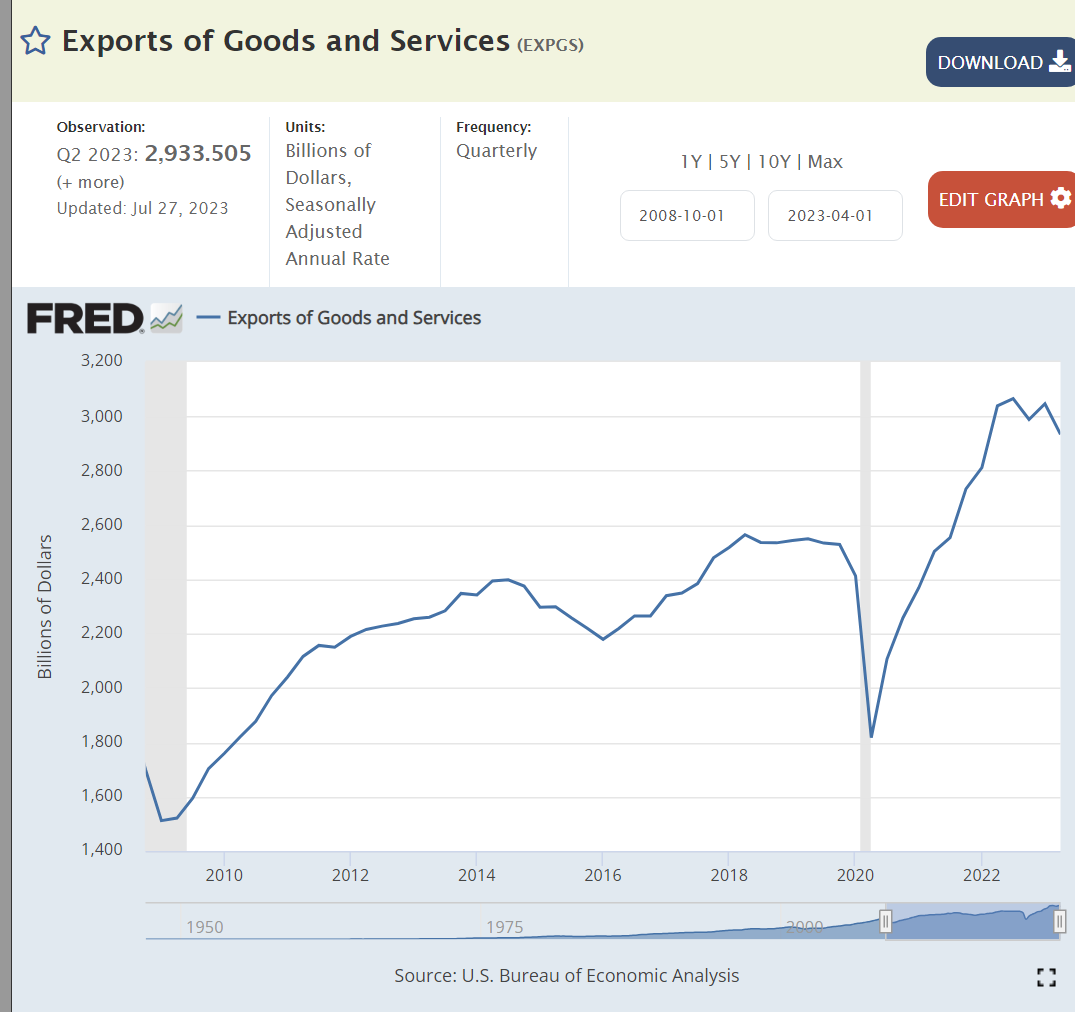
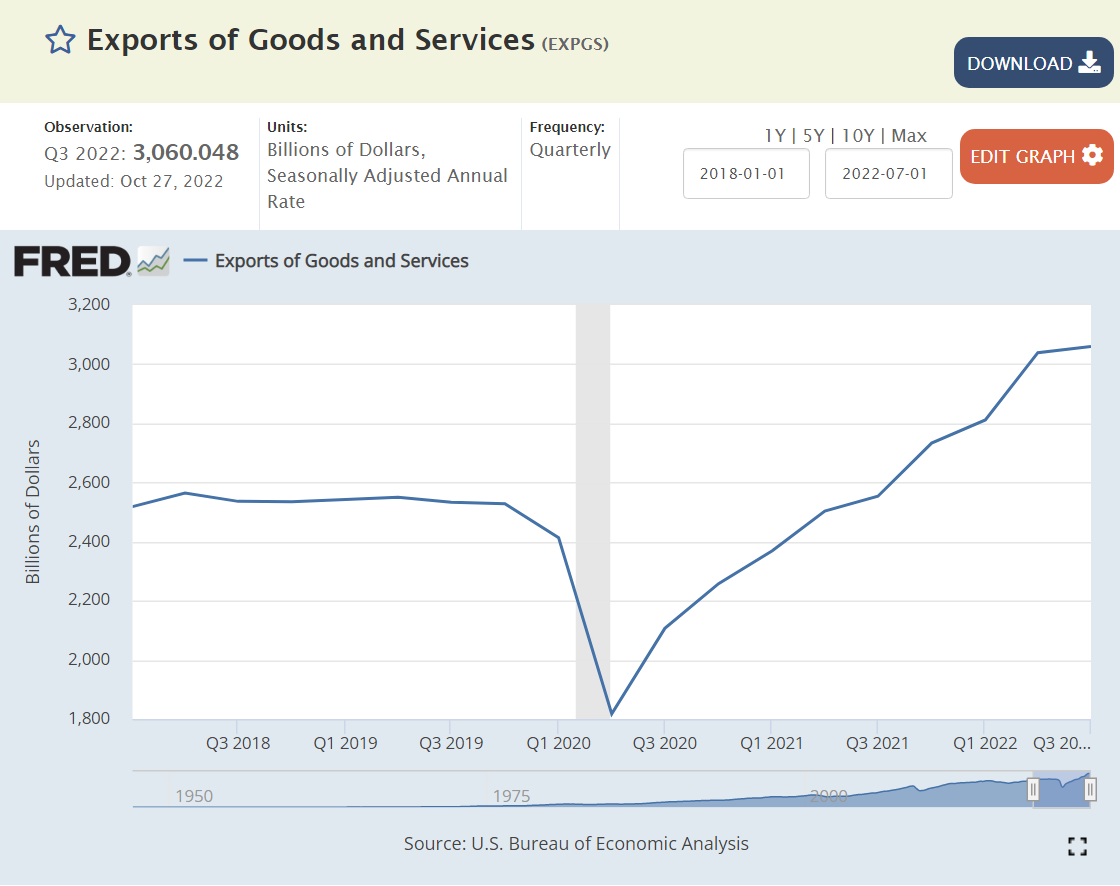
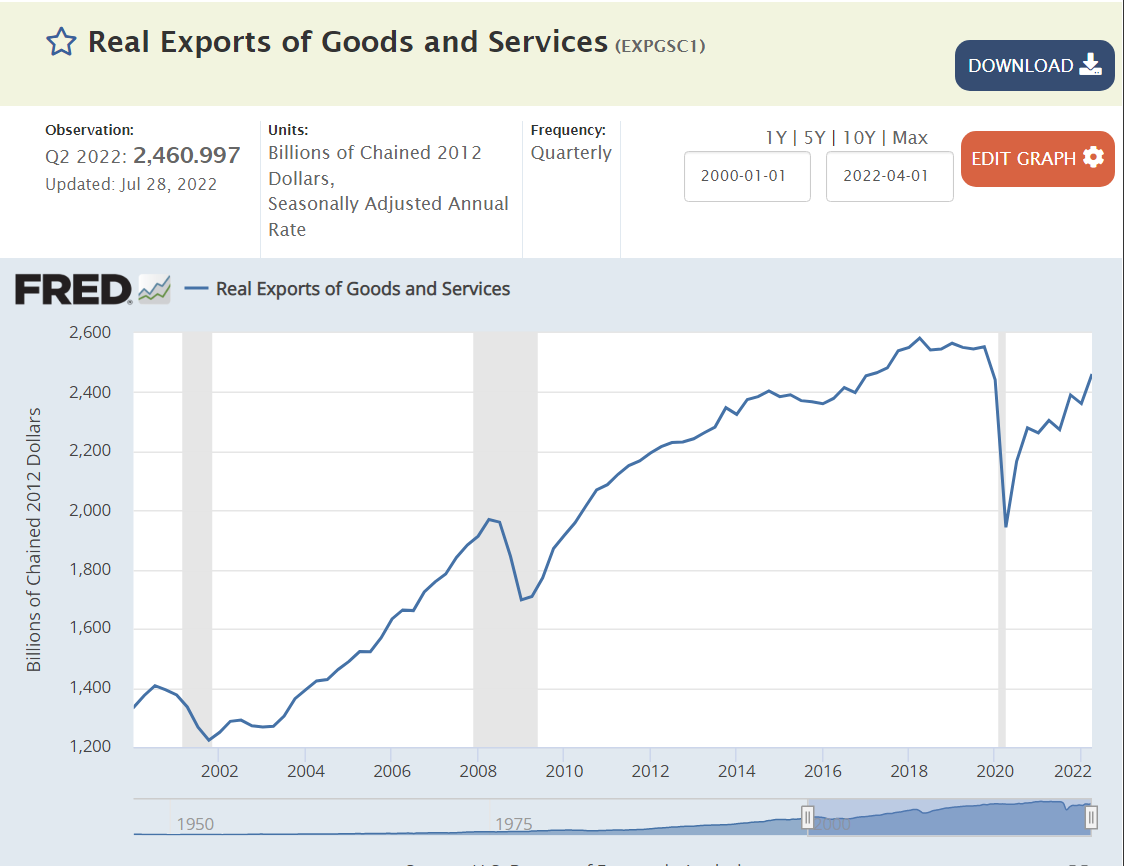
US exports have nearly doubled in 14 years.

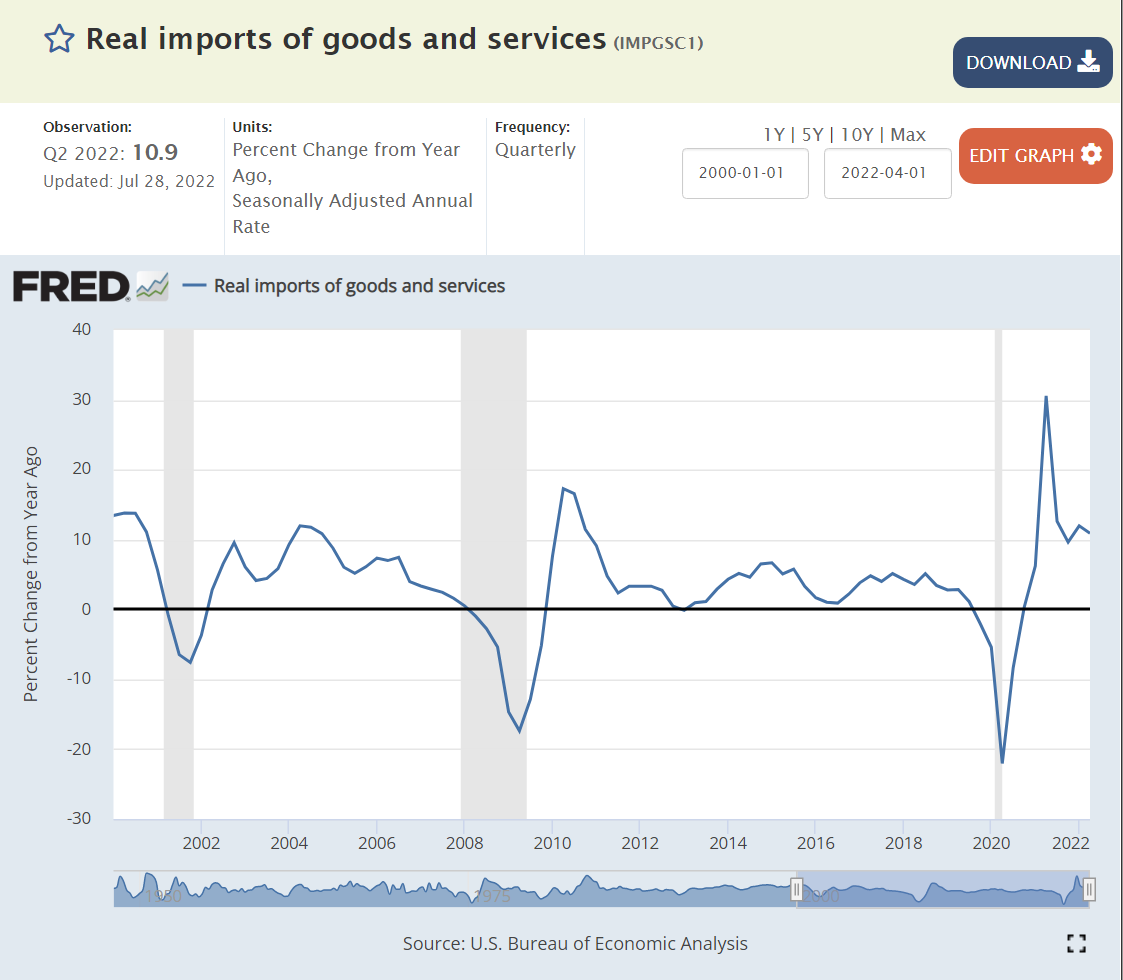
Despite the Trump tariffs, which Biden has maintained, imports have also nearly doubled.

Despite historically slower growth rates, higher budget deficits and looser monetary policies, the US dollar is more highly valued today than in 2008.

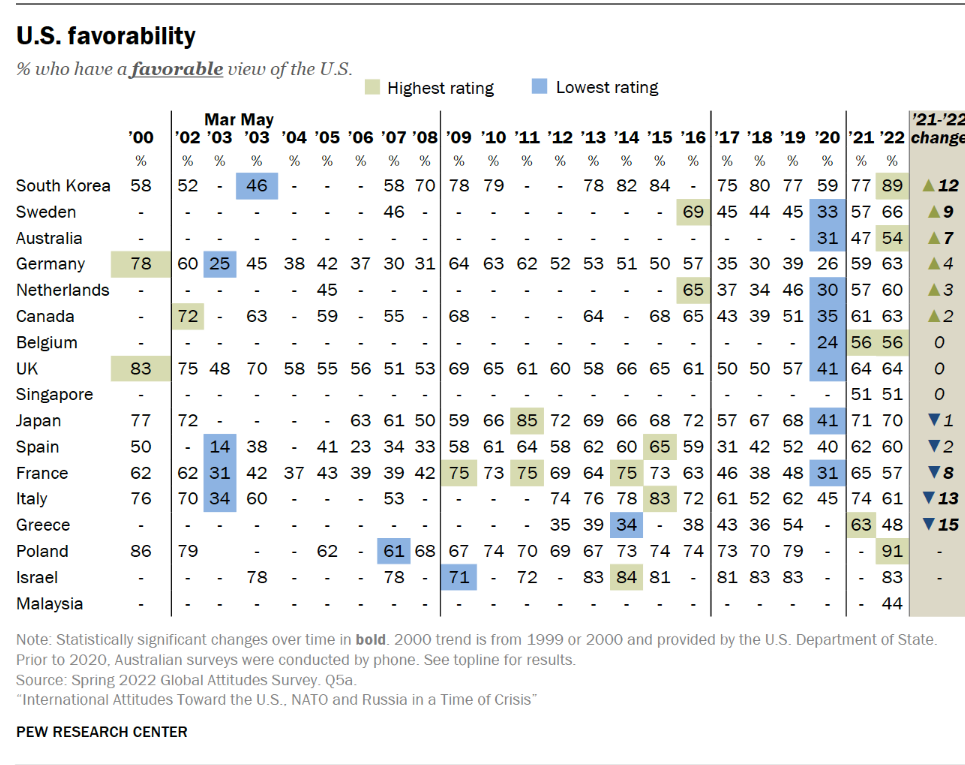
Foreign countries still see the US as a positive ally, despite their concerns during the Trump era.

Obama returned the budget deficit to a “reasonable” 3% by 2016. Trump expanded it to 5% and then 15% as the pandemic struck. Biden drove some recovery to 5% by 2022, but has not driven further reductions.

US coal production is in a long-term decline.

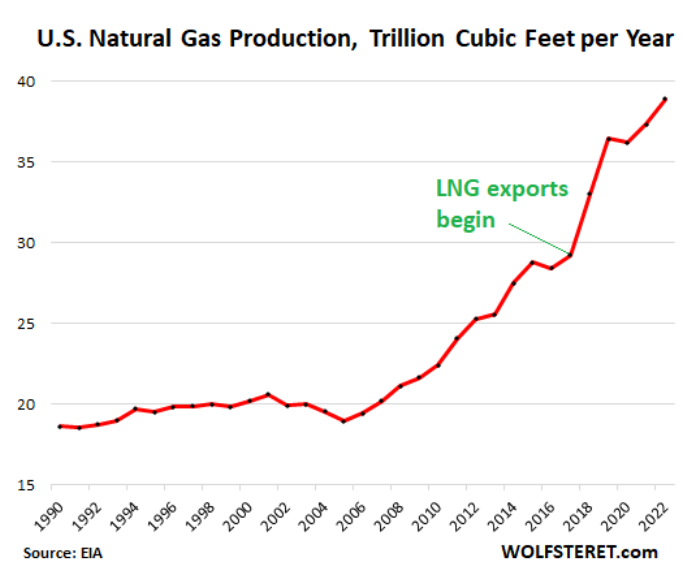
Natural gas production has nearly doubled in 14 years.

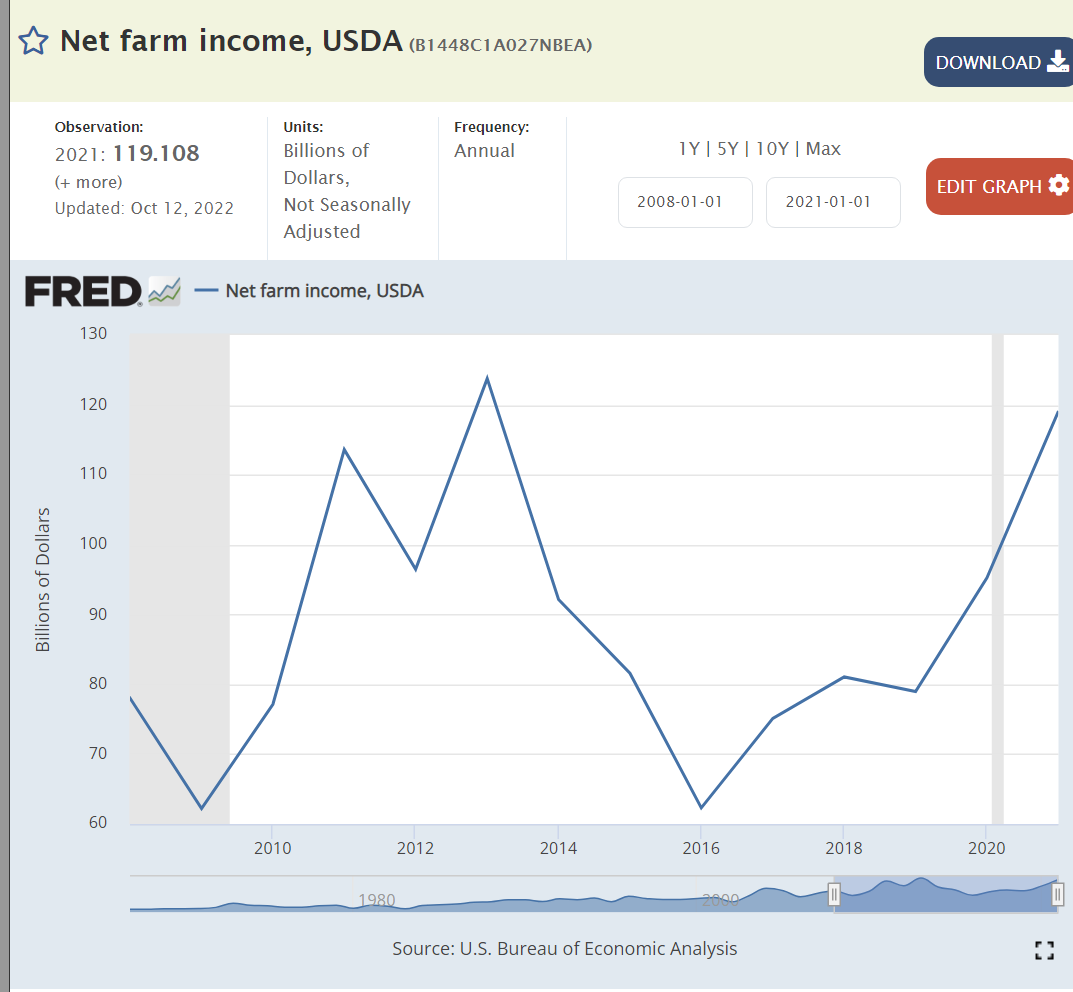
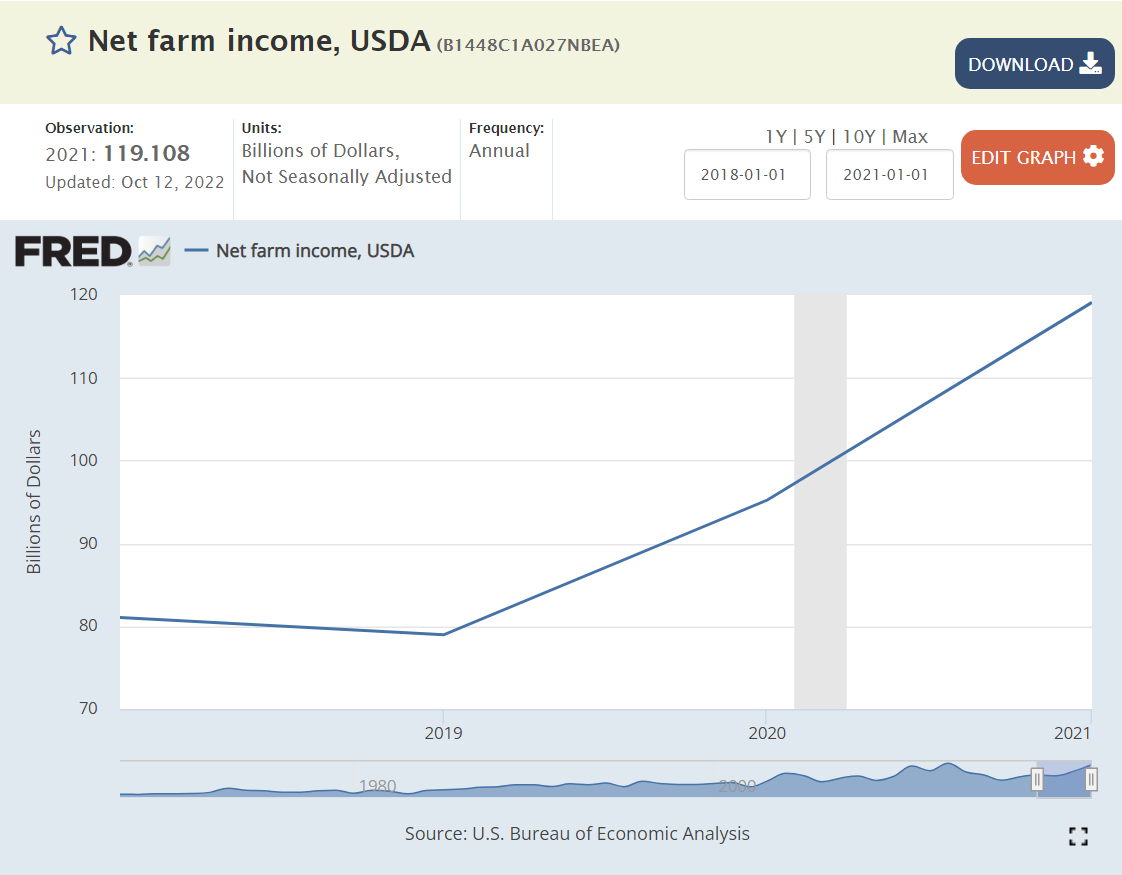
Net farm income has been significantly above the base for 6 of the last 14 years, despite lavish Trump farm subsidies.

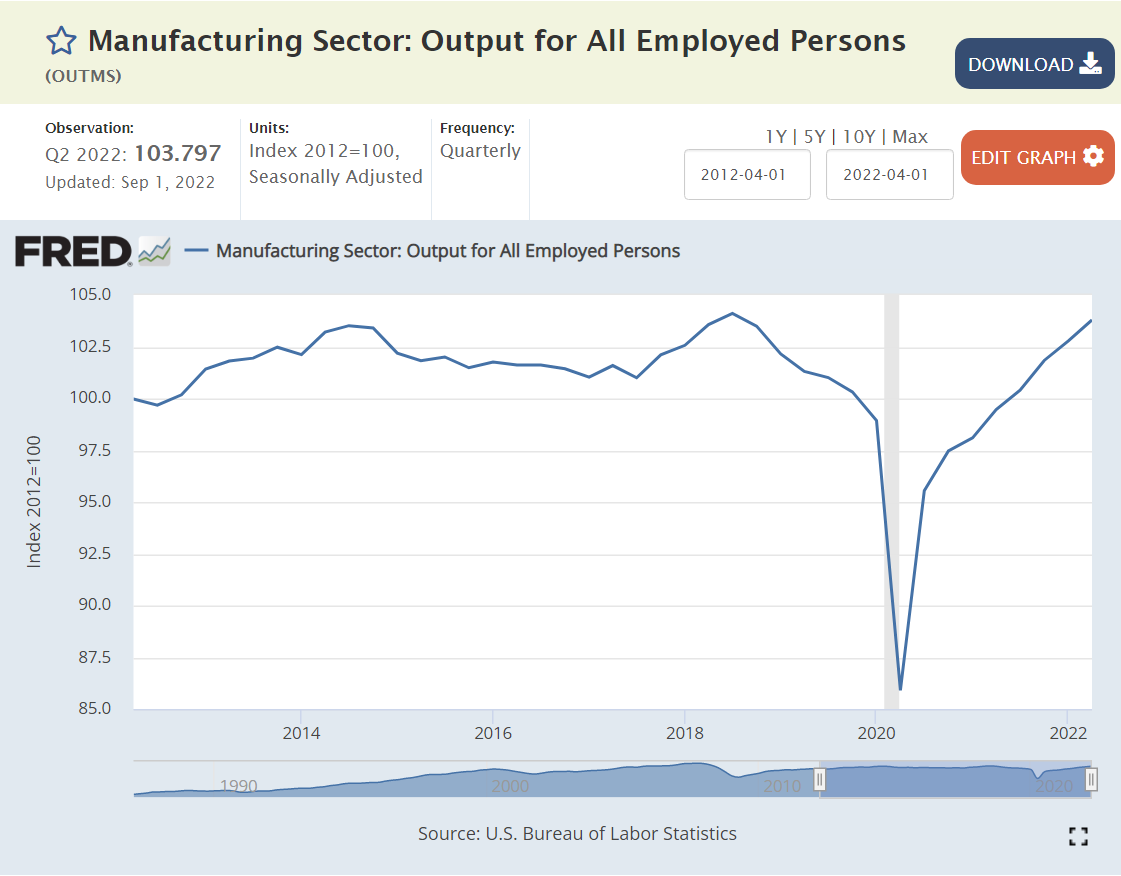
Manufacturing employment has continued to rise slowly in the last 14 years against the headwinds of international competition.

It’s difficult to put the pandemic in perspective, but here we see a 2-year reduction in expected lifespans. Opioid deaths and so-called “deaths of despair”, alcohol, drugs, suicide, also play a role.

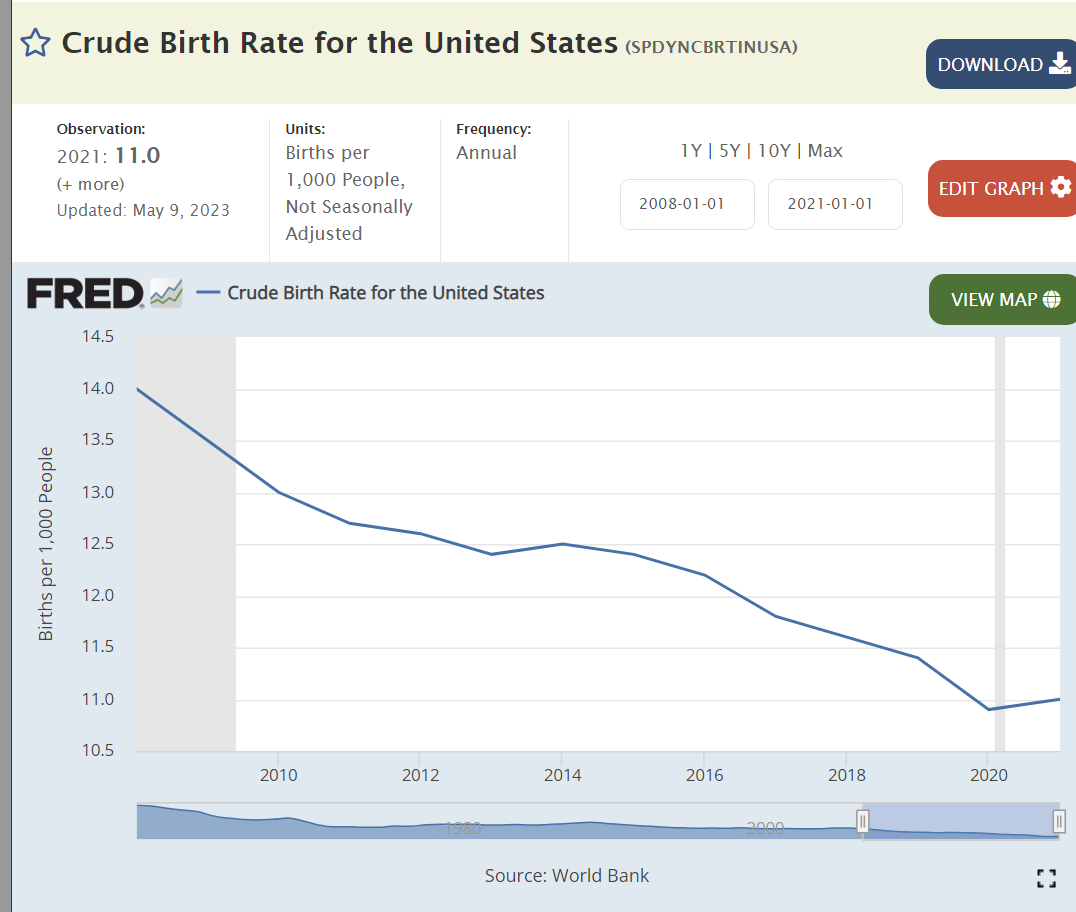
Birth rates continue to drift lower as seen in all regions of the world.

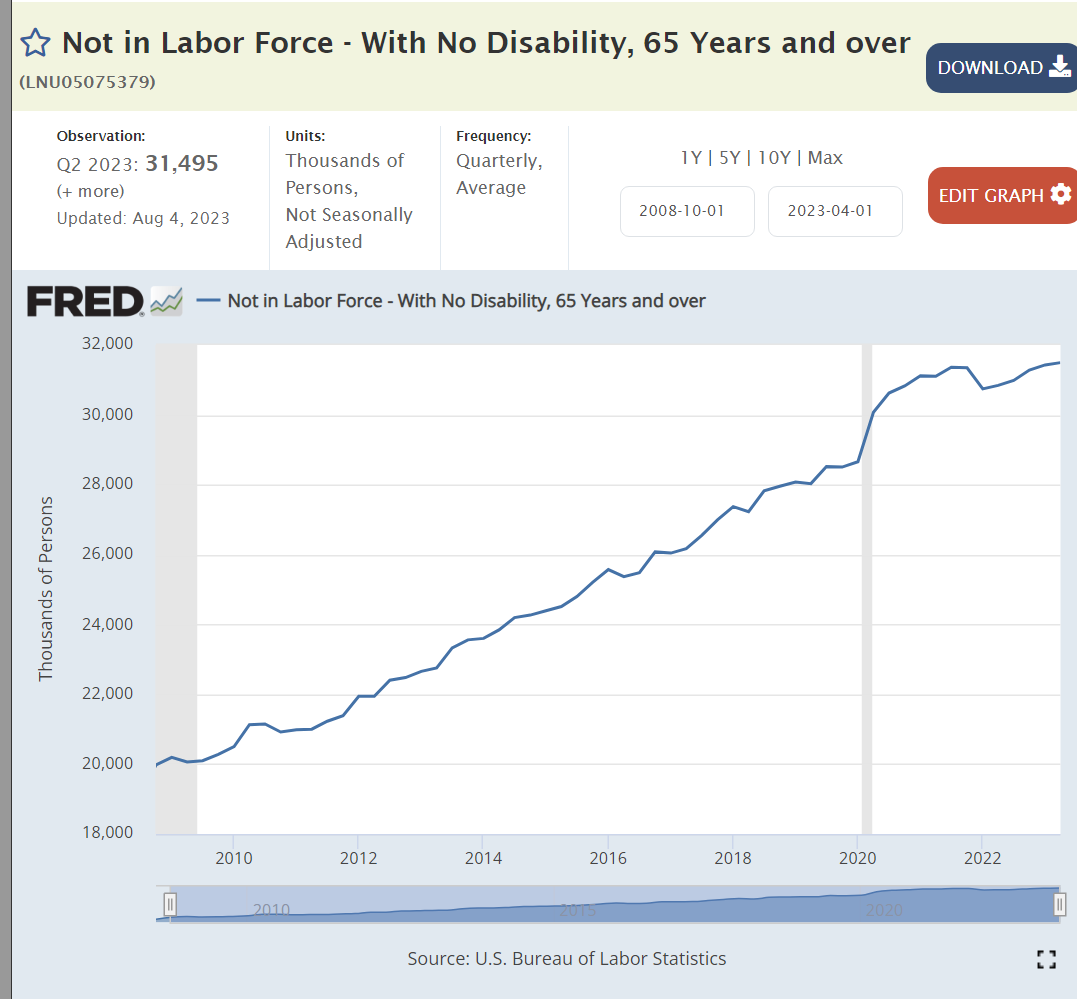
The number of retirees has increased by more than 50%.

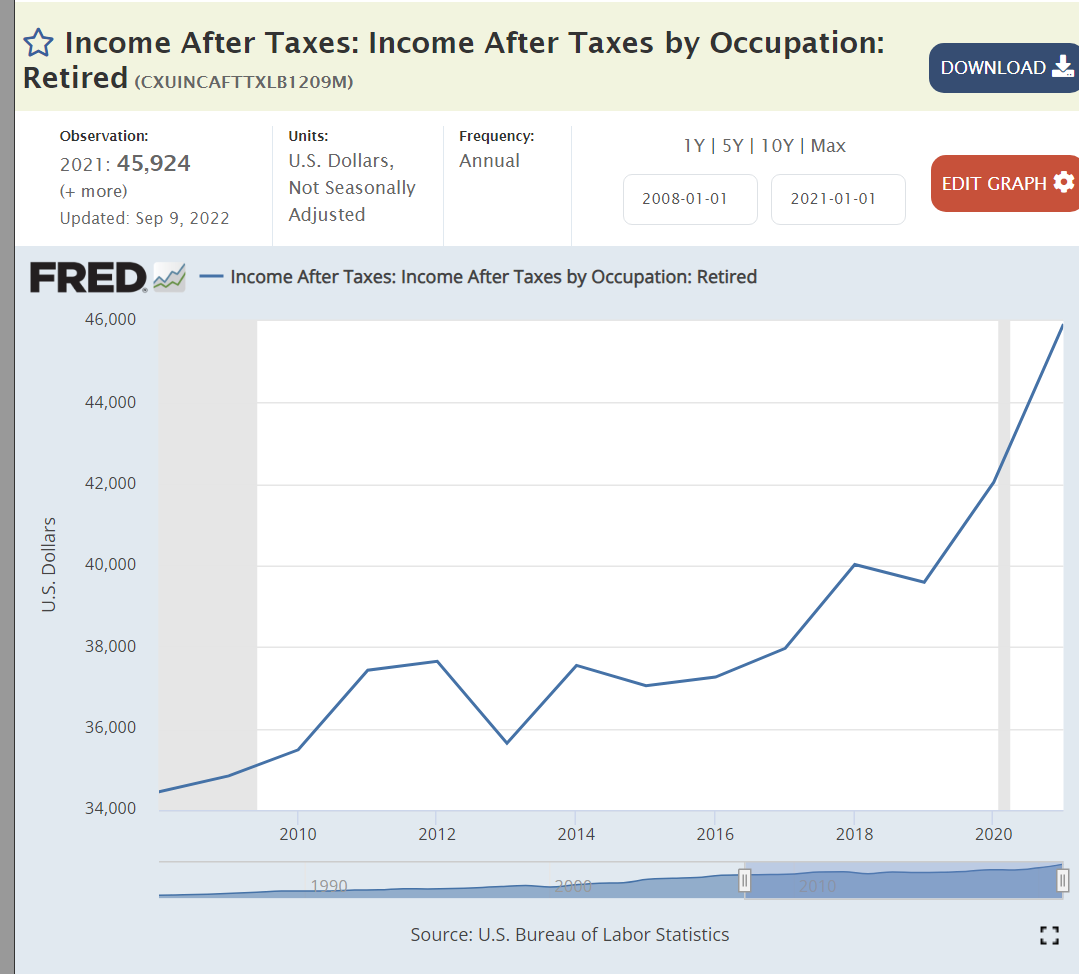
Retiree incomes are up by one-third, matching inflation.

Prospective retirees have doubled their cumulative savings.

The abortion rate has continued to fall in the last 30 years.

Church attendance has dropped from 40% to 30%.

Summary

The US economy recovered slowly after the Great Recession and then very quickly after the pandemic. Real, after inflation, output and per capita output increased. The labor market became very tight. Asset prices (investments and housing) rose for intrinsic and monetary reasons. The US remained a competitive international producer. The federal budget deficit was better at the end of the Obama period but worse for Trump and Biden. The pandemic reduced life expectancy and households had fewer children. Successful retirements grew and will grow. Social trends continue, uninterrupted by political positioning and policies.

Perceptions of the country and the economy are increasingly shaped by partisan political party views. Nonetheless, the US economy continues to grow and thrive.

Good News: The US Economy

https://www.indystar.com/story/news/local/hamilton-county/carmel/2022/05/13/carmel-indiana-parking-garages-add-1-300-new-spaces/9515644002/

Recovery from Covid Pandemic

https://fred.stlouisfed.org/series/GDPC1

https://fred.stlouisfed.org/series/PAYEMS

https://www.cnbc.com/2022/10/07/jobs-report-september-2022.html

Real, inflation adjusted, GDP has quickly resumed its long-term growth rate. GDP grew in the 3rd quarter and on an annual basis has continued to grow through the 3rd quarter of 2022. Employment recovered more slowly, but has exceeded the pre-pandemic peak. Very solid job growth has continued through September, 2022.

Real Consumer Spending

https://fred.stlouisfed.org/series/PCESC96

https://fred.stlouisfed.org/series/PCEDG

https://fred.stlouisfed.org/series/PCEC96

Real, inflation-adjusted, consumer spending quickly recovered from the pandemic and continues to grow. Consumers have enough income and savings to spend more, despite inflation challenges.

Best Labor Market in 50 Years

https://fred.stlouisfed.org/series/UNRATE

https://fred.stlouisfed.org/series/JTSJOL

https://fred.stlouisfed.org/series/LNU01300060

https://fred.stlouisfed.org/series/LES1252881600Q

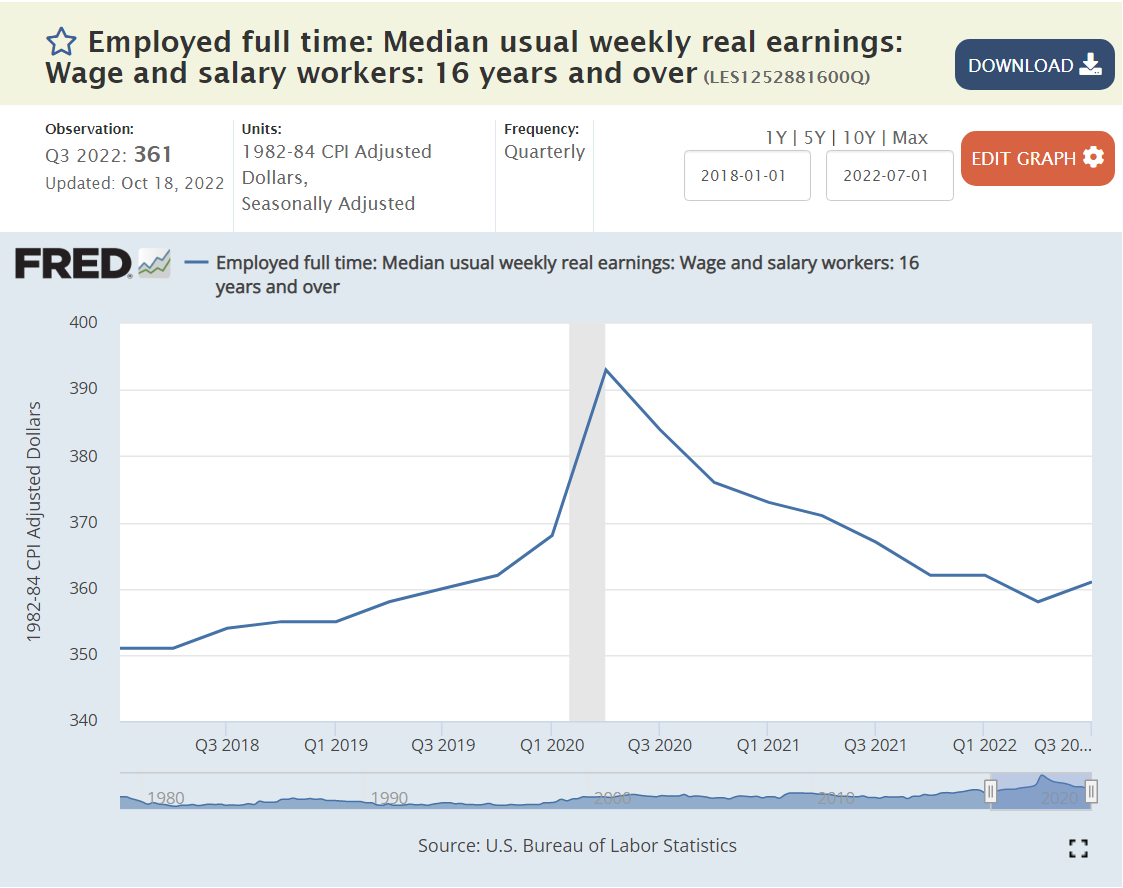
This is the labor market we have been waiting for since I graduated from high school in 1974. Record low unemployment, twice as many job openings and real wages above those of 2018-19, after inflation.

The Growing Economy

https://fred.stlouisfed.org/series/GDPC1#0

https://fred.stlouisfed.org/series/EXPGS

https://fred.stlouisfed.org/series/IEAMGSN

https://fred.stlouisfed.org/series/DTWEXBGS#0

https://fred.stlouisfed.org/series/OUTMS

https://fred.stlouisfed.org/series/MANEMP

https://fred.stlouisfed.org/series/B1448C1A027NBEA

https://fred.stlouisfed.org/series/B359RC1Q027SBEA

The overall US economy continues to grow, faster than other countries, including China. Exports are up by 20% as US companies continue their competitive wins. This is in spite of a much stronger US dollar. Imports are also up by more than 20%, providing consumers with the best of all global choices. Manufacturing output and employment have recovered to pre-pandemic levels. Farm incomes and output are up significantly.

Government Deficits Are Way Down

https://bipartisanpolicy.org/report/deficit-tracker/

https://www.pewtrusts.org/en/research-and-analysis/articles/2021/10/15/states-financial-reserves-estimated-to-surpass-pre-pandemic-levels

https://www.pewtrusts.org/en/research-and-analysis/articles/2022/05/10/budget-surpluses-push-states-financial-reserves-to-all-time-highs

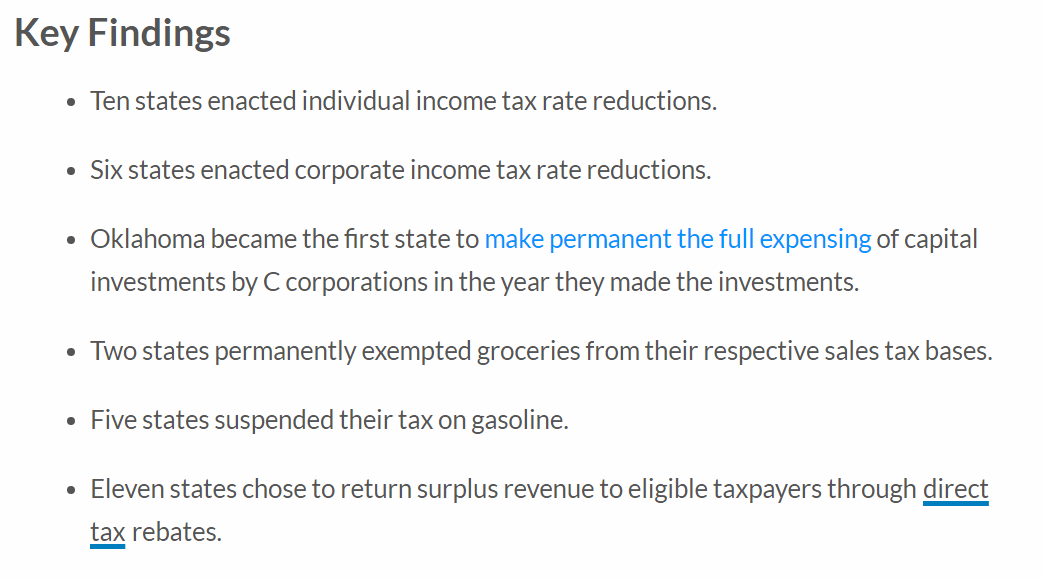
The federal budget deficit has been cut in half, with fiscal year 2022 back to the 2019 level. States have strongly recovered from the pandemic with increased revenues and slowly growing expenditures. State reserve funds are at record levels. 11 states had enough reserves to provide rebates to their taxpayers.

Personal Assets Are Way Up!

https://fred.stlouisfed.org/series/SP500#0

https://fred.stlouisfed.org/series/MSPUS

https://fred.stlouisfed.org/series/CUSR0000SETA02

https://fred.stlouisfed.org/series/LNS11324230

https://fred.stlouisfed.org/series/CP

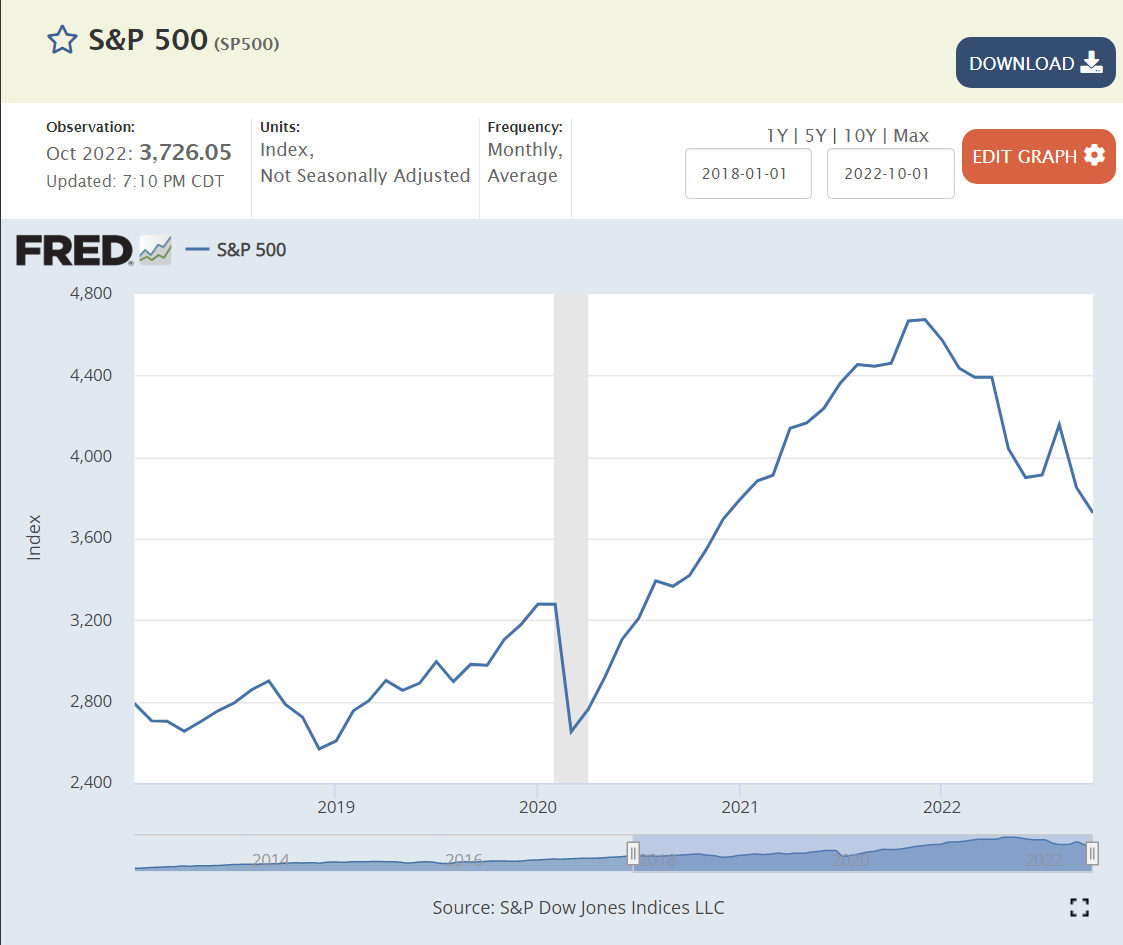
Retirement savings is at a record high. House values are up by one-third. The US stock market is up by one-third, despite the significant declines in 2022. Used car values are up by one-third. Retirement after age 55 remains very attainable for a majority of individuals. This growth in personal asset values has taken place while corporate profits have increased by one-half.

Fewer Downsides

https://fred.stlouisfed.org/series/MORTGAGE30US#0

https://fred.stlouisfed.org/series/DRSFRMACBS

https://fred.stlouisfed.org/series/DRCCLACBS

https://www.axios.com/2022/09/14/child-poverty-rate-census

Most Americans today have fixed rate mortgages at 2.5%-3%-4%, locking in advantageous low mortgage payments for 10-30 years. New home buyers and those who must move and get a new mortgage do face 7% interest rates. Mortgage delinquencies are down by 80% and credit card delinquencies are down by one-third. Child poverty, after transfers, is at a record low.

Summary/Interpretation

The news media and politicians want to highlight the negative aspects of the US economy: higher inflation, lower personal savings rates, higher mortgage rates, higher home and apartment rents and prices (lower affordability).

It’s important to put all of the pieces in perspective. Inflation is higher and threatens fixed income and low-income households. Households are using up their extra pandemic period savings. The real estate market is slowing, but prices remain high. Economic growth is close to zero, so there are relatively fewer open positions and net new jobs created. There is a threat of a mild recession continuing through the second half of 2023. BUT …

The overall economy has quickly recovered from the pandemic and exceeded record pre-pandemic levels. Recall that the post-Great Recession recovery continued for almost a full decade. The economy recovered from the record pandemic lock downs and “lost jobs” faster than anyone expected.

Economic growth was low, marginally below the arbitrary 0.0% level in the first and second quarters, but recovered to 2% in the third quarter. Annual GDP growth is likely to be in the -1% to +1% level for the next 3-4 quarters as the Federal Reserve Bank’s increased interest rates work through the economy. We may have an “official recession”, but households will encounter limited negative effects.

The labor market is likely to continue its very positive status. Firms still have 10 million open positions that they expect will EACH deliver positive net economic results. We have a labor shortage. At some point, business Republicans will join Democrats to revise restrictive immigration rules and other policies that limit labor force participation.

Firms, businesses, retirement plans and state governments are in very solid economic shape. Assets are very high, liabilities are low. Net assets are at record levels. The Federal government budget deficit is back to the pre-pandemic level.

There is no evidence of a wage-price spiral of inflation. The president and most Democrats seem to accept the Federal Reserve Bank’s actions to increase interest rates, slow the economy and return inflation to its prior 30 years of modest 2%.

Behavioral economists have repeatedly shown that most people are much more sensitive to losses and risks than they are to economic gains. Hence, it is natural to focus on higher inflation and slower growth and discount the many other positive results.

The US economy quickly recovered from the severe pandemic recession with less collateral damage than anyone expected. The growth in the money supply and federal spending/transfers to ensure that we avoided a business, banking and personal meltdown drove a faster than expected recovery resulting in supply chain disruptions, labor shortages and inflation. The “experts” were slow to identify this situation and take offsetting policy steps. Fortunately, fiscal and monetary policy during 2022 have been tight, slowing the economy. We are in the difficult months of transition. No one knows if the steps taken so far are adequate, exactly right or too much. We need another 3 quarters to decide.

US Recession? Probably Not Yet

https://www.un.org/en/coronavirus

I tried to find a “mainstream media” article that objectively and insightfully evaluates the state of the US economy as of the end of the second quarter without success. So, I’ll take a shot at it.

First, I want to highlight that “this time, it’s different”. The US and global economies are recovering from a global pandemic situation last seen more than 100 years ago. The global economy is more integrated than ever. Viruses spread faster than ever. Businesses and governments have more information and ability to change quickly than ever before. The economic contraction was sharp, far more severe than the Great Depression or the Great Recession. The health care experts were unable to immediately evaluate the threat or recommend public policies. Nonetheless, “they persisted” and the medical, travel and economic recovery was far quicker than ANYONE expected in March, 2020 or December, 2020 or September, 2021 or January, 2022.

Second, I apologize for the required details involved to evaluate the simple question, “are we in a recession?”. Unfortunately, there is some judgment involved, as we have to evaluate three factors. Is there a clear downturn versus the trend rate? Is the downturn of significant length? Is this a widespread downturn, effecting most sectors of the economy?

Einstein said “be simple, but not too simple”.

https://wiki.c2.com/?EinsteinPrinciple

Sir Walter Scott noted the “tangled web we weave”.

https://nosweatshakespeare.com/quotes/famous/oh-what-a-tangled-web-we-weave/

The Ancient Greeks noted “many a slip twixt cup and lip”.

https://en.wikipedia.org/wiki/There%27s_many_a_slip_%27twixt_the_cup_and_the_lip#:~:text=There%27s%20many%20a%20slip%20%27twixt%20the%20cup%20and%20the%20lips,your%20chickens%20before%20they%20hatch%22.

Cheech and Chong rambled on with ” recession, repression …”

https://www.lyricsfreak.com/c/cheech+chong/santa+clause+and+his+old+lady_20745568.html

Total Economy Level

https://fred.stlouisfed.org/series/GDPC1

At the aggregate level, we clearly have a peak. Do we have an extended downturn? Not yet, based on the total. The rapid recovery from the second quarter 2020 bottom could not be sustained. A significant slow-down in the growth rate was expected. Typical annual real GDP growth in recent years has been only 2%, so the difference between “extended expansion” and “recession” is thin.

Components

Macroeconomic theory focuses on aggregate demand and aggregate supply. Real, inflation adjusted, gross domestic product (GDP) is a measure of the productive output of a nation. The demand side is split into consumption, investment, government and net exports. I’ll go one level deeper, reviewing 9 components of GDP.

The business cycle is influenced by the relative sizes of the components of GDP and their relative variability from quarter to quarter and typical changes as the business cycle moves from expansion to decline to recovery.

From most to least correlated with the business cycle, with their current percentage share of GDP (sums to more than 100 because imports are a negative factor and changes in private investment can be negative), the 9 components are: Change in private inventories (1%), Residential Investment/Housing (5%), Business Investment (14%), Durable Goods Consumption (9%), Imports (16%), Non-durable Goods (food, energy) (15%), Services (45%) !!!!, Exports (8%) and Government (17%).

Overall, I see 4 sectors as “maybe” trending to a recession and 5 sectors currently at “no”. Unfortunately, the two most sensitive, Housing and Business Inventories, are in the “maybe” category, along with non-durable goods consumption and government consumption.

It is critical to look at the longer-term trends and context to evaluate short-term changes. There is significant month-to-month and quarter-to-quarter variability in the final numbers for GDP and especially for the initial estimates, like those we just saw for the second quarter of 2022. Significant revisions are made for 6 months, which is why the NBER committee which officially declares recessions is typically waiting longer to make a final call than everyone desires. Hence, I won’t usually share a long-term graph, a short-term graph, annual percentage changes and quarterly percentage changes annualized for each component. The media tends to focus on the preliminary quarterly percentage change annualized as the “gospel”. This is unwise. Let us begin to review the 9 main components.

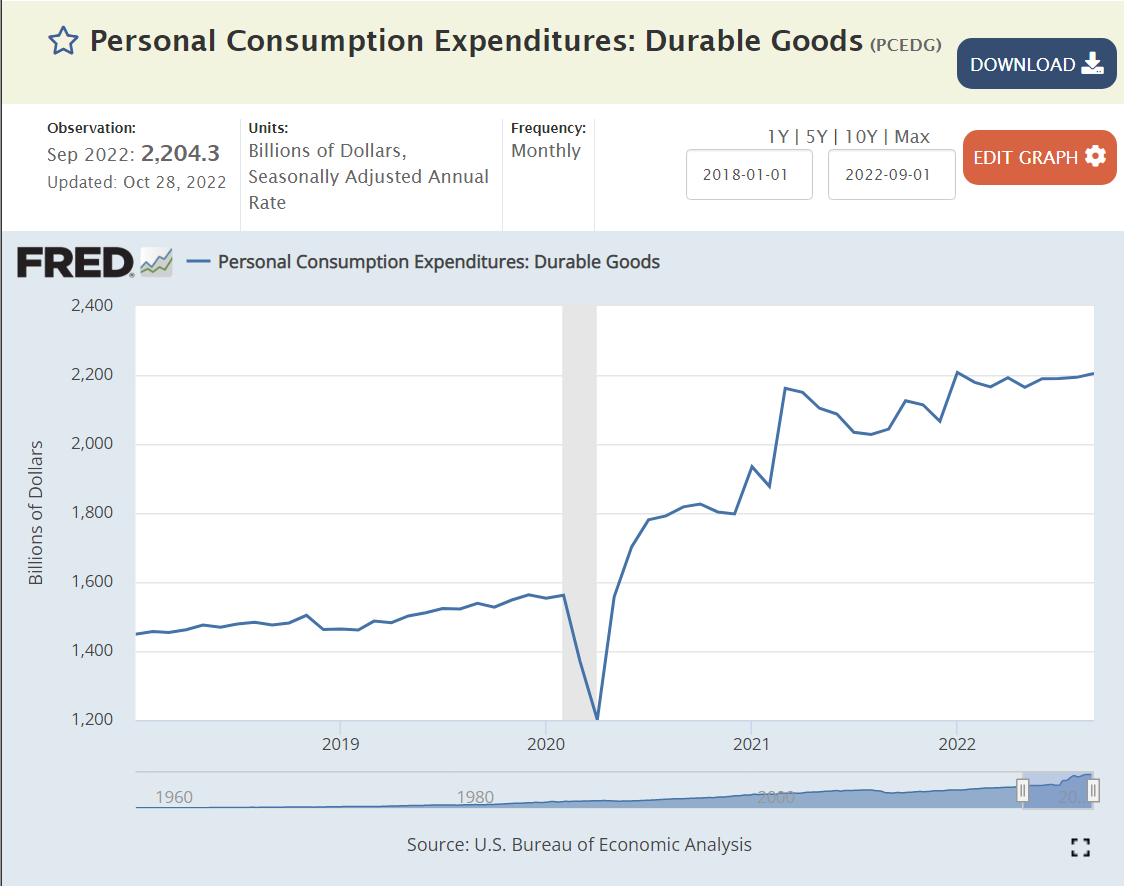
Durable Goods (9% of GDP, 4/9 Volatile)

https://fred.stlouisfed.org/series/PCEDGC96#0

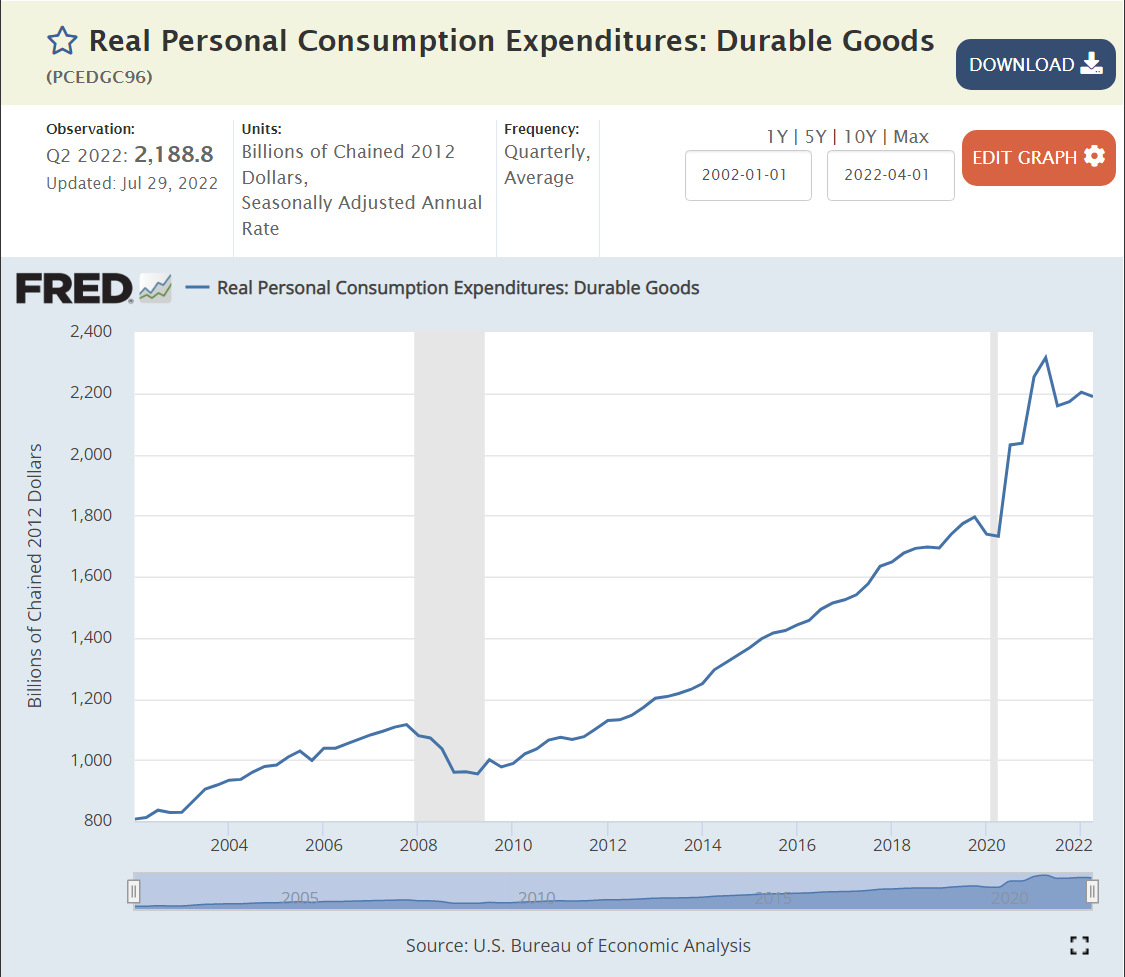
Durable goods demand spiked by an incredible 20-30% during the pandemic, fueled by government transfers and fewer opportunities to consume services. Demand for durable goods has flattened at this 20% higher level, it has not declined. In my view, this sector is not signaling recession.

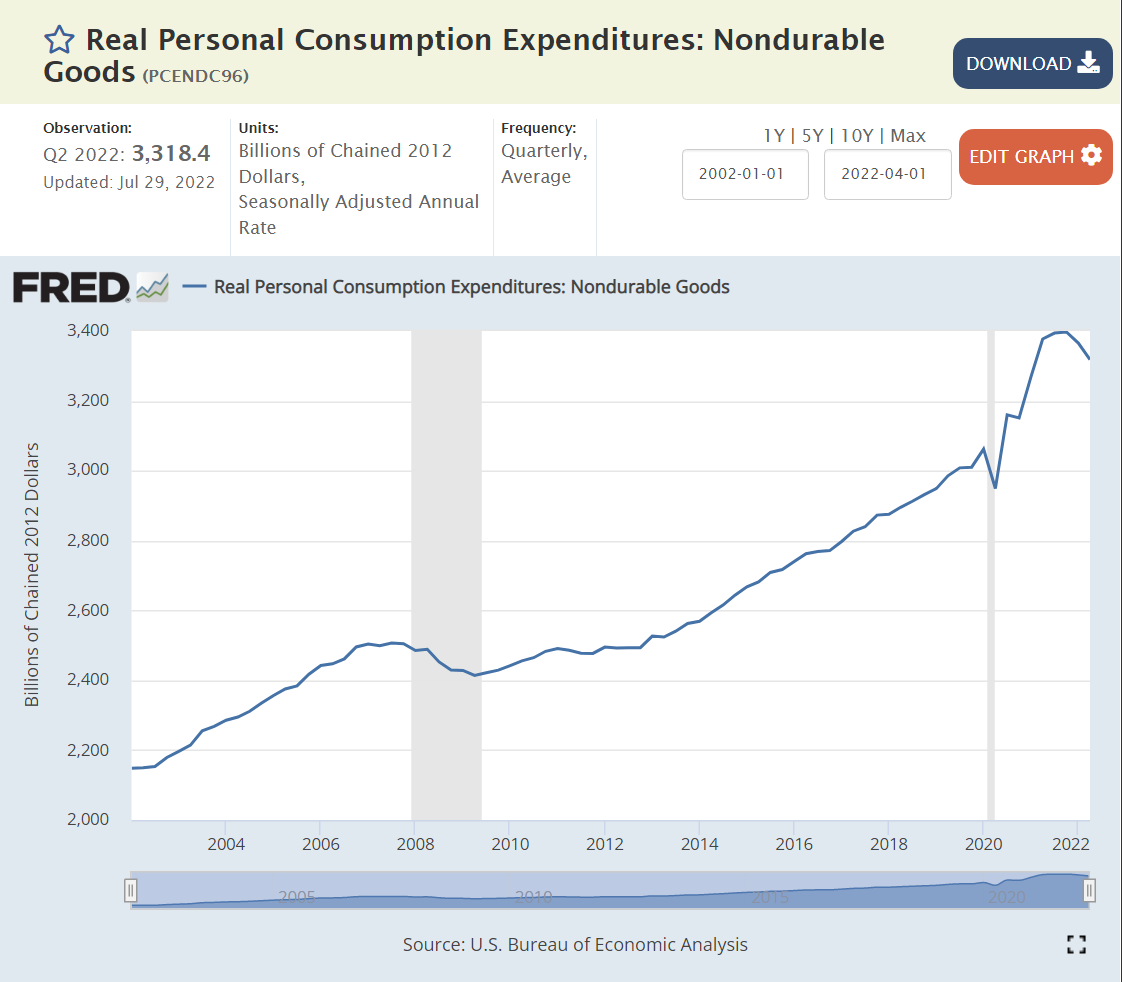
Non-durable Goods (15%, 6/9 Volatile)

https://fred.stlouisfed.org/series/PCENDC96

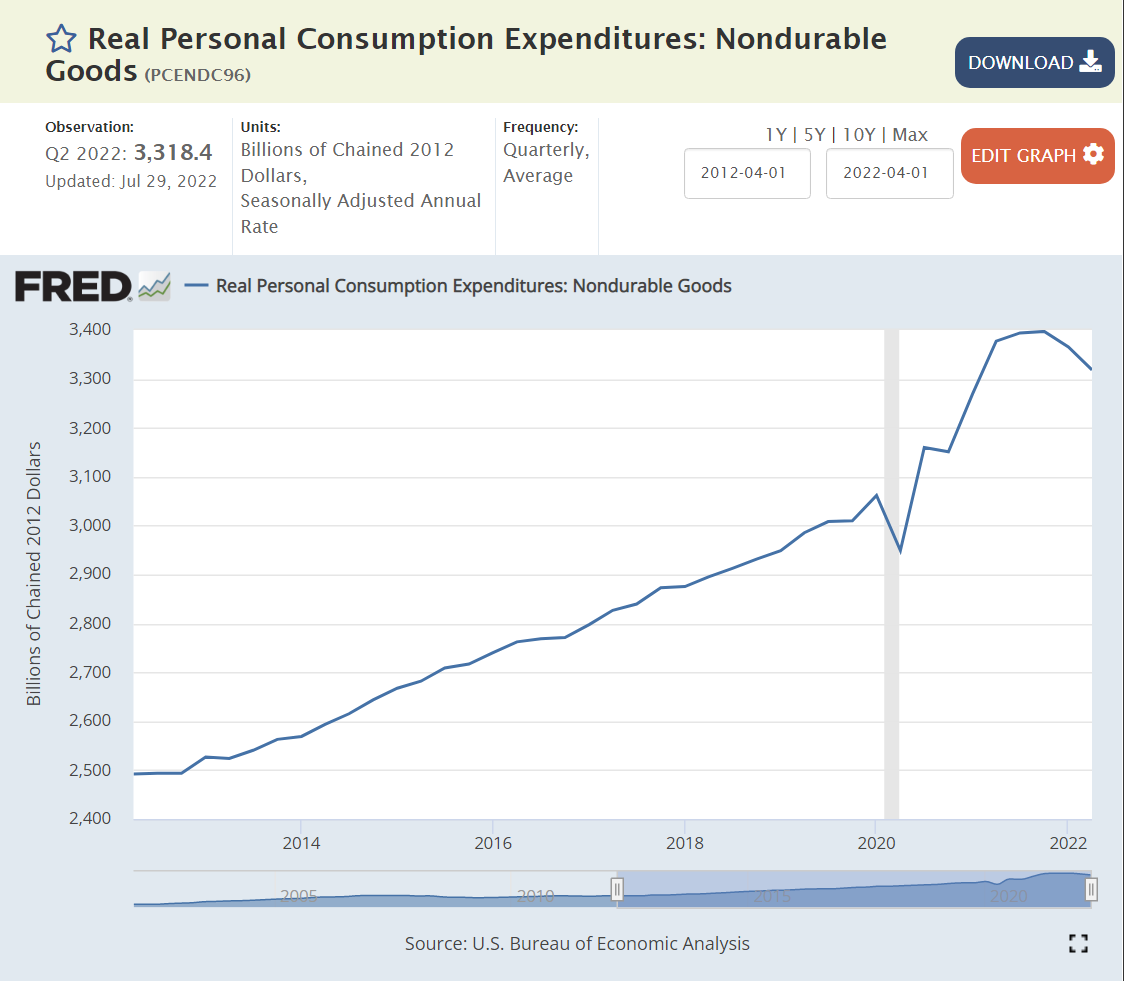
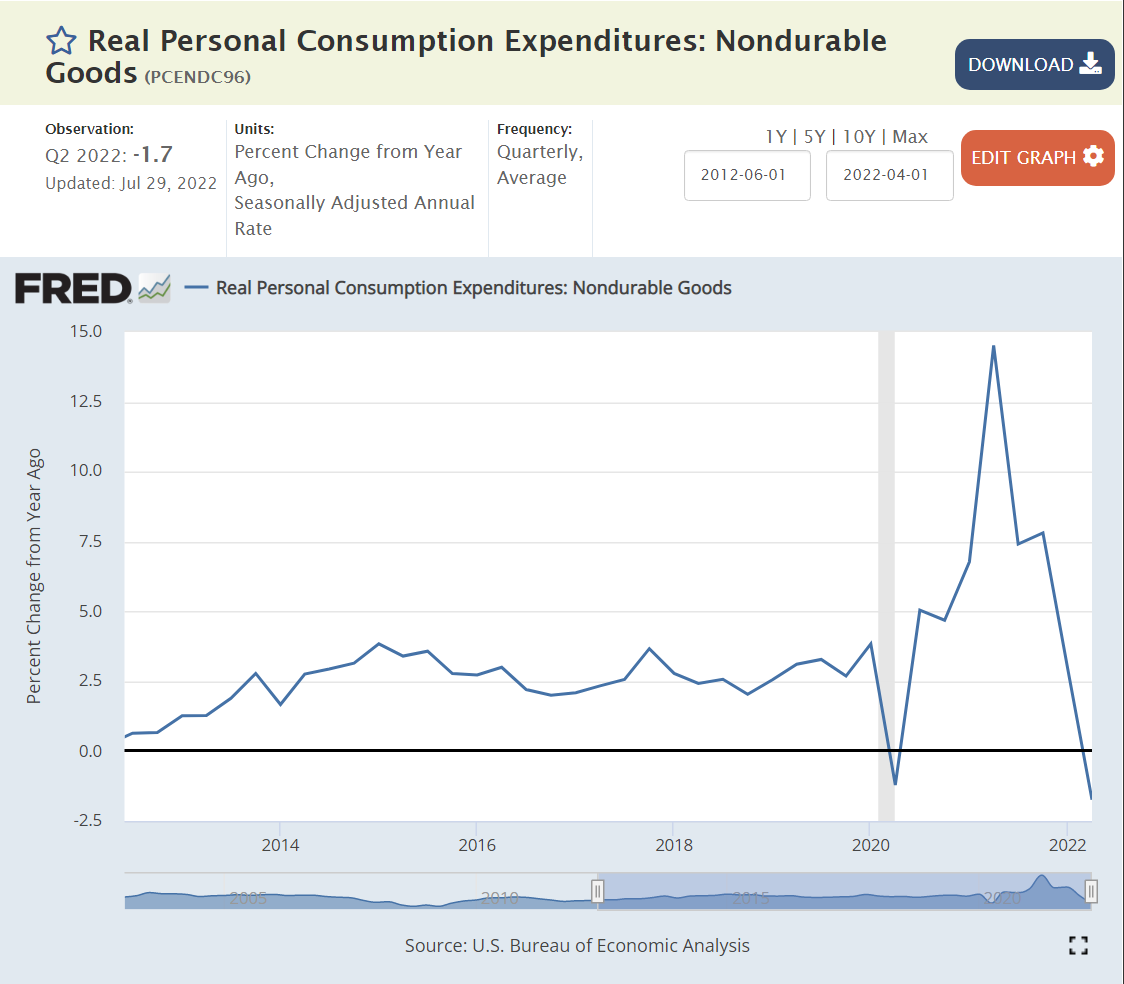
Non-durable goods consumption jumped by a real 12% during the pandemic and has essentially remained at this elevated level. We have two quarters at slightly lower consumption levels, so I rate this as “maybe” moving to a recession. Focus on the “big picture”. Both durable and non-durable goods consumption increased by historic percentages during the pandemic period and have remained at that elevated level 2 years later. It is not surprising that this demand has flattened or fallen off a bit. The surprising feature is the willingness of the American consumer to voluntarily spend much more money on “things” during the pandemic and maintain that level of spending as service opportunities returned, government transfers ended, and savings were drawn down.

Services (45%, 7/9 Volatile)

https://fred.stlouisfed.org/series/PCESC96

The very large (44% of GDP) services sector was slower to recover from the pandemic, but demand for services remains quite strong, even though the percentage growth rate is lower than during the initial recovery period.

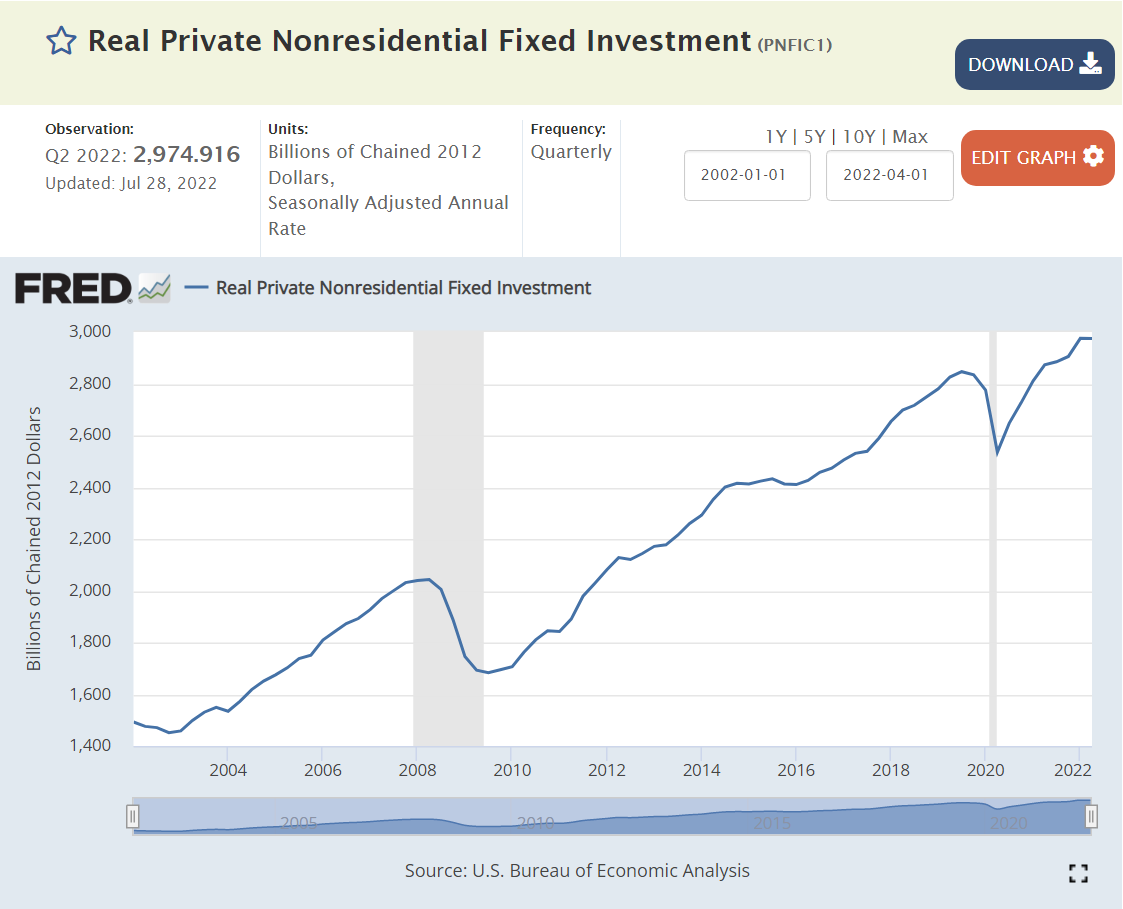
Business Investment (14%, 3/9 Volatile)

https://fred.stlouisfed.org/series/PNFIC1

Business investment was above trend in the two years before the pandemic and has resumed its solid level. No recession indicator here.

Housing (5%, 2/9 Volatile)

https://fred.stlouisfed.org/series/PRFIC1

New housing investment grew by 50% between 2012 and 2016 and then remained at that level for the next 4 years before the pandemic. Long-run supply and demand factors indicate a “need” for more housing construction in the US to make up for the “missing” construction from 2008-2016. New housing construction did not decline with the pandemic, it increased by 15% in real terms! As with durable and nondurable goods consumption/production, this would not have been predicted in March, 2020 by anyone. Residential construction has levelled off 15% above 2019, equal to 2007 before the Great Recession. The increased mortgage interest rates indicate that demand will soften and this sector will decline somewhat in the second half of 2022, so this is a “maybe”. The long-term shortage of housing supply provides a floor for this sector.

Business Inventories (1%, 1/9 Volatility)

https://fred.stlouisfed.org/series/CBIC1
https://fred.stlouisfed.org/series/A371RX1Q020SBEA

“Supply chain issues” have restricted the accumulation of business inventories since the pandemic began. The unexpected spike in demand for durable and nondurable goods and residential construction lead to shortages. Worries about supply chain resiliency have led to higher targeted business inventory levels. Retailers have overstocked some product categories as the recovery has slowed and are being forced to discount prices to move these goods. Overall, this is a slight “maybe” recession indicator. I think that businesses would like to have 20% higher inventories overall.

https://fred.stlouisfed.org/series/ISRATIO

Exports (12%, 8/9 Volatility)

https://fred.stlouisfed.org/series/EXPGSC1

US exports continue to solidly recover from the pandemic.

Imports (16%, 5/9 Volatile)

https://fred.stlouisfed.org/series/IMPGSC1\

Although imports act as a reduction in the calculation of GDP, they tend to decline when the US economy declines. Import demand remains high, not indicating a recession.

Government (17%, 9/9 Volatile)

A majority of government spending is accounted for as a simple transfer, not part of the annual production of goods and services.

https://fred.stlouisfed.org/series/GCEC1

Government production activity grew quite significantly from 2014 to 2020. It has since declined by less than 1%. I rate this as a “maybe” indicator of recession, even though government activity is typically a countercyclical indicator, rising when recession arrives.

Summary

Services (45%), Business Investment (14%), Exports (12%), Imports (16%) and Durable Goods (9%) are NOT in recession. Housing (5%) and Non-durable Goods (15%) point towards recession, while Government (17%) and Business Inventories (1%) show warning signs. If I were a member of the NBER board, I would not designate a recession in the first half of 2022 as of today.

For the second half of 2022, a recession is possible. The Fed raising interest rates is already affecting the housing industry. But businesses continue to report solid to record profits. The stock market has declined by a bear market 20% but may or may not have found a bottom. The global risks from Russia’s attacks on Ukraine and China’s Covid lockdown strategy remain. Consumer confidence is weak, especially in a partisan world. Business confidence is weaker than in recent months, but most measures remain marginally positive. The labor market is at its strongest position in 50 years, supporting consumer demand. Higher than expected inflation has slowed consumer spending, but not to recession levels. Consumer savings and debt levels remain positive. Business debt levels have increased, but most businesses locked in low debt interest rates during 2020-22.

Why So Positive?

  1. Governments operate with expansionary fiscal policy, ensuring that aggregate demand is adequate. There is a risk of too much stimulus and “modern monetary theory” excesses, but so far this is not a risk in the major economies.
  2. Central banks are more effective. They provide credit in downturns, increase interest rates when required, coordinate with each other and pressure banks to hold adequate capital.
  3. Governments and central banks take proactive steps to avoid currency crises,
  4. After the Great Recession, lending in the US housing market is more reasonable.
  5. Businesses have worked through many challenges in the last 15 years and are well positioned to prosper.
  6. The overall economy is increasingly based on services more than manufacturing, mining and agriculture. The operations leverage of manufacturing facilities is a smaller factor in the world economy.
  7. Labor power is lower. Cooperation with management is stronger.
  8. Demand for labor is high. US has record open jobs and voluntary quits. The effective minimum wage has increased from $8-10 per hour to $12-15 per hour without major business disruptions.
  9. Trade is lightly restricted.
  10. Global economy is multipolar, relying on US, EU, Japan, China, India, Middle East, etc.
  11. Technological progress continues. Better goods and services. Better processes, trade, transportation, markets, communication and insights.

Good News: Vehicle Dependability Continues to Improve

https://www.vwvortex.com/threads/jd-power-dependability-2001-vs-2011.5350295/
https://www.jdpower.com/business/press-releases/2021-us-vehicle-dependability-study-vds

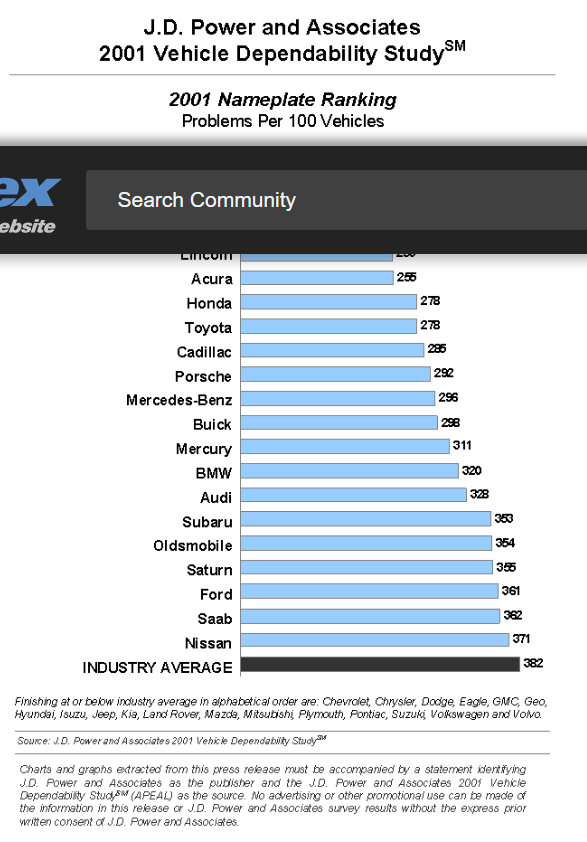
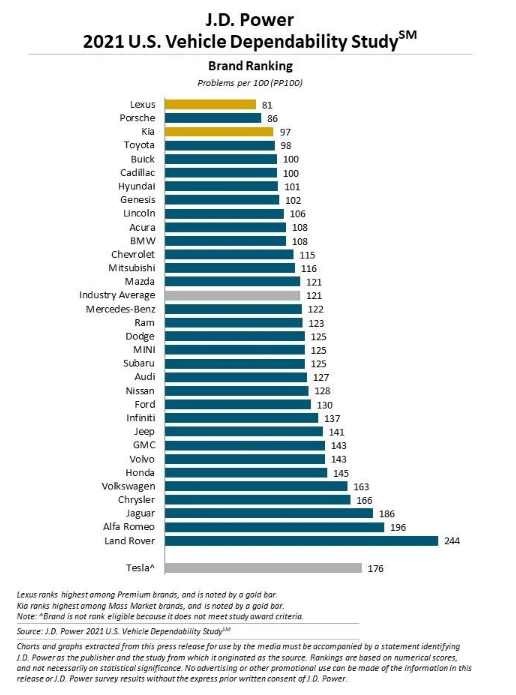
Ongoing defects dropped by 60% from 2001 to 2011 and then dropped by another 20% from 2011 to 2021. The compounded reduction is 68%, a little more than two-thirds of the defects disappearing in 20 years.

JD Powers started its initial quality surveys in 1987 and its Vehicle Dependability surveys in 1990. The summary results are not easily found on the internet. The Consumer Reports defect rates are similarly restricted to paying customers.
https://www.yahoo.com/news/30-years-iqs-perspectives-history-222747086.html

In the 1980’s, Toyota and Honda offered significantly higher vehicle quality. Other manufacturers essentially “caught up” in the next 20 years. A snapshot from 1985 illustrates the gap that was closed by 2000-5, before the Vehicle Dependability improvements shown above.

https://www.carqualityinfo.net/reliability-durability-gpas/car-brands—7-best-brands-of-my-1985/
https://www.jdpower.com/business/press-releases/2022-us-vehicle-dependability-study

The very disappointing 2022 results are inconsistent with the downward defect trend of the last 20 years, reflecting the pandemic production, supply chain sourcing and vehicle prep problems of the last 2 years.

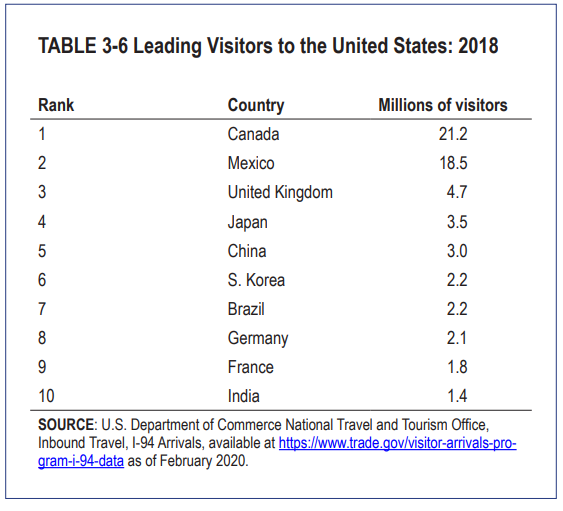
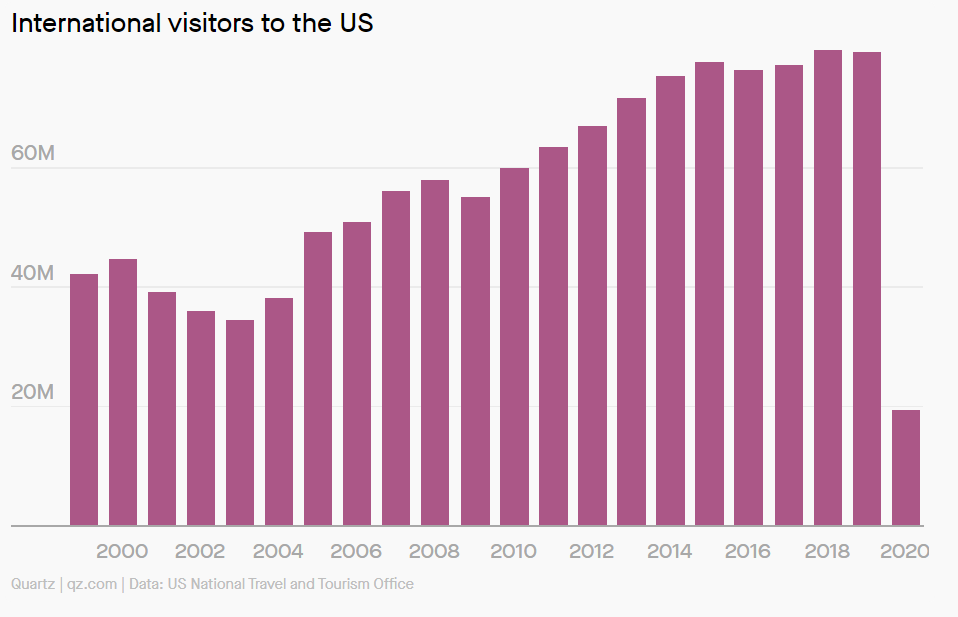
Good News: International Travel to US Trends Upward in 21st Century

https://ntlrepository.blob.core.windows.net/lib/79000/79200/79277/TSAR_2020_Compressed_20210104.pdf
https://qz.com/2020189/the-us-is-losing-its-appeal-as-a-global-tourism-destination/
https://www.trade.gov/sites/default/files/2021-03/Fact%20Sheet%20International%20Visitation%20FINAL.pdf
https://ntlrepository.blob.core.windows.net/lib/79000/79200/79277/TSAR_2020_Compressed_20210104.pdf
https://qz.com/2020189/the-us-is-losing-its-appeal-as-a-global-tourism-destination/

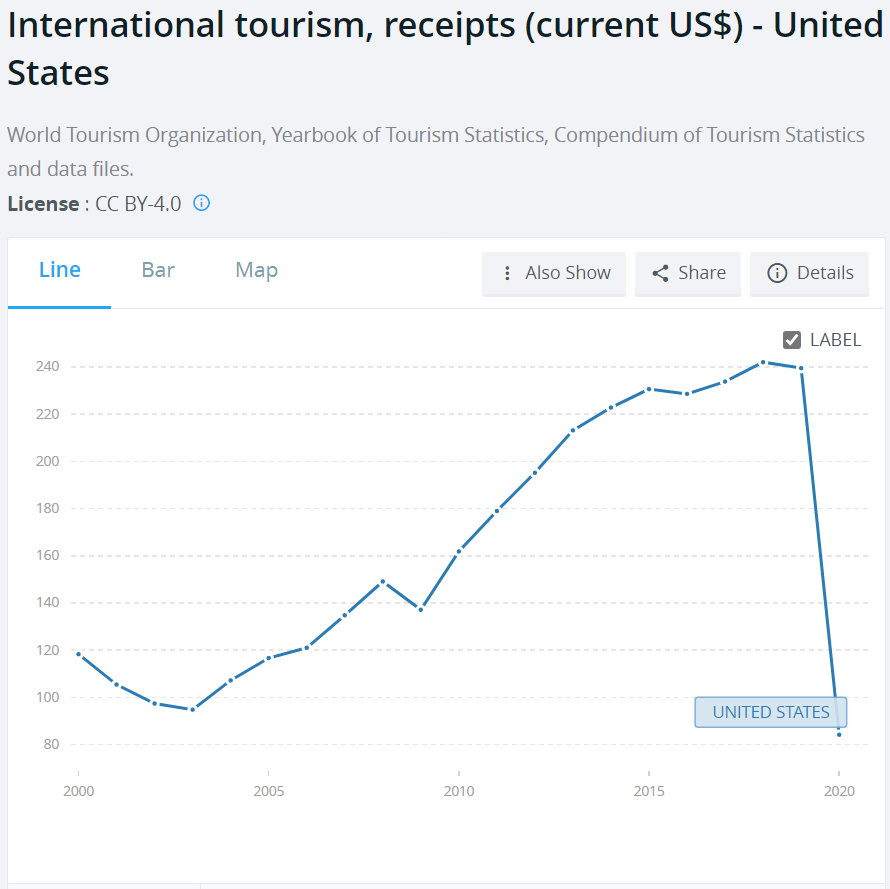
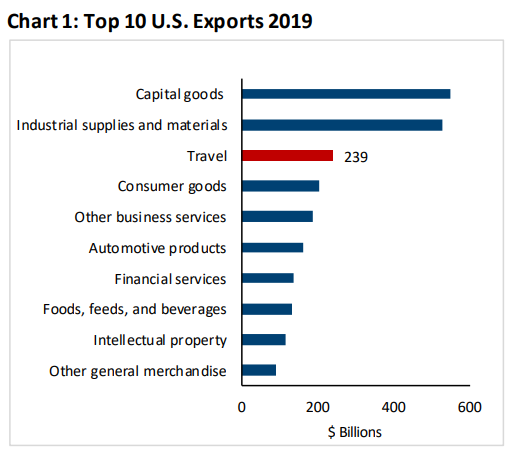
US Top Recipient of Foreign Travel Dollars

https://data.worldbank.org/indicator/ST.INT.RCPT.CD?most_recent_value_desc=true
https://www.trade.gov/sites/default/files/2021-03/Fact%20Sheet%20Exports.pdf
https://www.ustravel.org/sites/default/files/2021-12/research_fact-sheet_travel_and_trade.pdf

Many US Cities/Destinations Remain Attractive

https://www.worldatlas.com/cities/america-s-10-most-visited-cities.html

https://www.bts.gov/archive/publications/state_transportation_statistics/summary/table_04_19

Future: Forecast, Challenges, Opportunities

72% Recovery in 2022, 100% in 2024

https://www.ustravel.org/research/travel-forecasts

Less “America First” Headwinds

https://qz.com/2020189/the-us-is-losing-its-appeal-as-a-global-tourism-destination/

Marketing Investment Opportunities

https://www.ustravel.org/press/us-travel-market-share-continue-decline-through-least-2023-report

Good News: US Foreign Aid

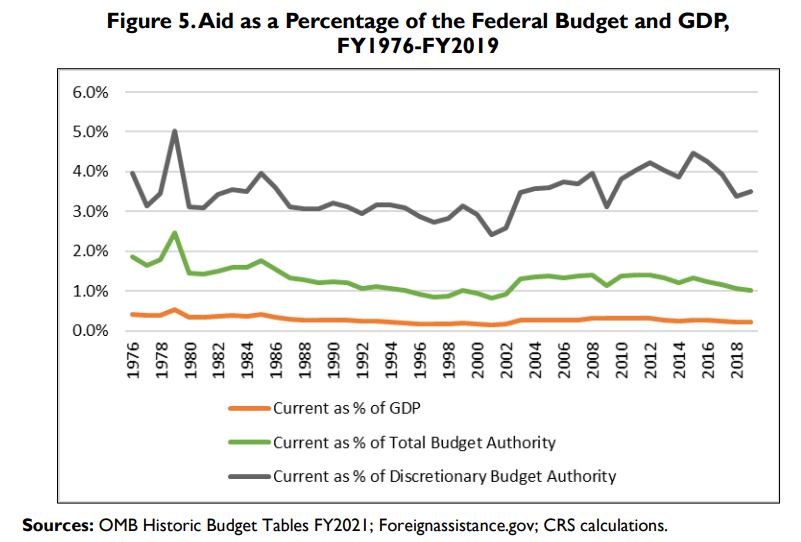
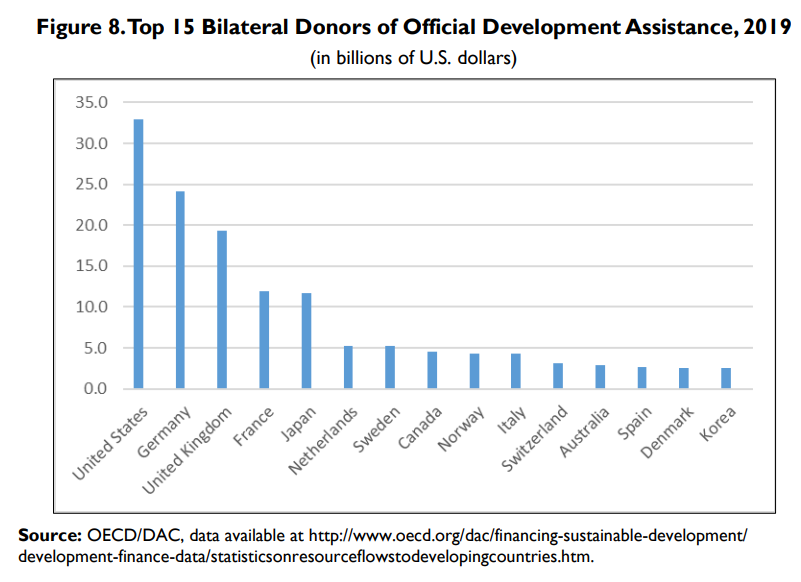
US Spends 1% of Federal Budget on Aid, Not 25%

Aid is 1% of Budget, Down from 1.6% in 1980

Aid is 1% of Budget, Down from 1.4% in 2006

https://crsreports.congress.gov/product/pdf/R/R40213

Real $ Spending Increase Driven by Terrorism Threats with Bipartisan Support

https://crsreports.congress.gov/product/pdf/R/R40213

US Leads in Dollar Spending, Trails in $/Person

US Accounts for 23% of Global Aid

US 0.2% of GDP is Very Low for Developed Nation

https://crsreports.congress.gov/product/pdf/R/R40213

Where Does the Money Go?

41% to economic development and commercial interests

35% to military aid and national security

20% for humanitarian purposes

The congressional report splits up the $48B as

Peace/security 16B

Health, Ed $9B

Humanitarian $9B

Economic Growth $4B

Governance $3B

https://crsreports.congress.gov/product/pdf/R/R40213

Where Does the Money Go?

Africa 25%. Middle East 25%. Afghanistan $5B, Israel $3B, Jordan $2B, Egypt, Iraq, Ethiopia, Yemen, Colombia, Nigeria, Lebanon $1B each. Top 10 $16B, one-third of total.

Criticisms of Foreign Aid

Limited evidence that specific country investments provide political returns

Limited evidence of anti-terrorism campaign effectiveness (counterexamples)

Weak administrative structure and oversight at all levels

Direct evidence of individual country economic growth due to aid is limited

Some autocratic governments have benefitted from aid

Some aid is diverted to corrupt governments and individuals

Specific high priority countries have provided weak returns (Egypt, Pakistan, Afghanistan, Iraq)

Higher returns could be gained from investing in Western Hemisphere, Eastern Europe.

https://www.cfr.org/backgrounder/how-does-us-spend-its-foreign-aid

https://www.npr.org/sections/goatsandsoda/2018/09/18/649155725/why-the-u-s-ranks-at-the-bottom-in-a-foreign-aid-index

Benefits

Health measures, disease rates, lifespans. Global health. Economic development results globally and in individual countries. US trade benefits from developing trade lanes. Global education. Increased number of democracies, commitment to mixed capitalist economies. Lower cost of defense. Terrorism activities thwarted. Improved strength of US alliances. Improved flow through NGOs, multilateral organizations improves effectiveness. Dollar allocation provides US policy leverage.

https://www.cfr.org/backgrounder/how-does-us-spend-its-foreign-aid

https://www.concernusa.org/story/foreign-aid-myths-facts/

https://www.pbs.org/newshour/world/column-addressing-myths-surrounding-u-s-foreign-aid

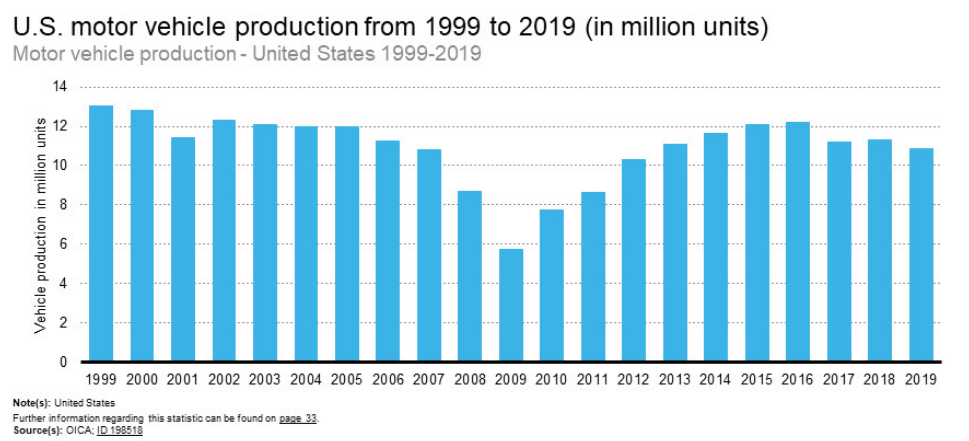
Good News: US (Still) Produces 10 Million Motor Vehicles Annually

https://www.thomasnet.com/articles/top-suppliers/car-manufacturers-in-usa/

https://www.ceicdata.com/en/indicator/united-states/motor-vehicle-production

US production is roughly same size as the EU, a larger developed market.
https://www.acea.auto/figure/eu-passenger-car-production/#:~:text=9.9%20million%20passenger%20cars%20were,during%20the%202010%2D2021%20period.

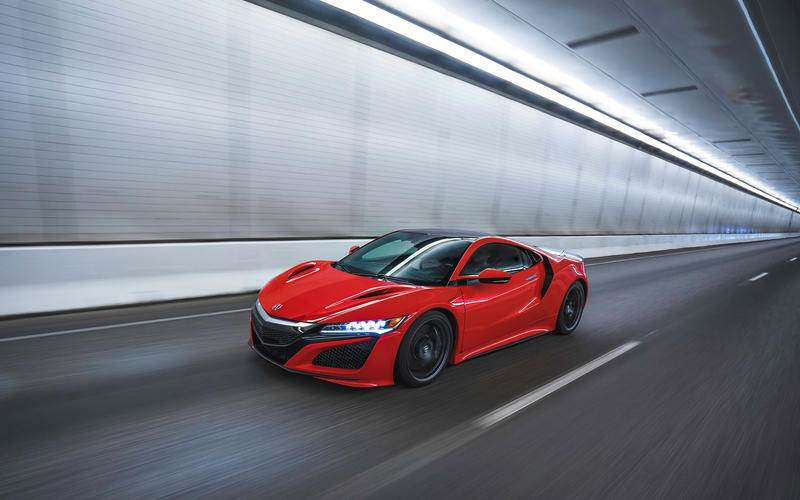
Japanese corporations produce about one-third of US output in the US. They export 400,000 vehicles from the US. Three-fourths of Japanese brand cars sold in the US are produced in the US. Japanese cars, on average, have more US (domestic) content than so-called American made cars.

https://www.autocarpro.in/feature/america-japanese-car-usa-26972

https://www.cnn.com/2019/06/26/business/japan-american-honda-hnk-intl/index.html

https://www.bizjournals.com/columbus/news/2016/06/01/japans-big-3-automakers-built-more-cars-in-u-s.html

https://www.cnbc.com/2019/05/21/japanese-automakers-tout-all-time-high-us-job-creation-pressure-on-trump.html

https://www.businessinsider.com/all-the-japanese-cars-made-in-the-usa-2017-11#toyota-avalon-toyota-motor-manufacturing-kentucky-georgetown-kentucky-13

https://www.detroitnews.com/story/business/autos/foreign/2019/06/25/american-made-cars-sold-us-japanese/39620085/

https://www.hotcars.com/11-foreign-cars-made-in-the-us-and-12-american-cars-that-arent/

https://www.motortrend.com/features/8-foreign-cars-might-surprised-made-america/

Latest Good News

Twice as many passport holders

American eagles recover from extinction threat

More voting in recent elections

Stable US steel production

Less smoking.

Record low unemployment

US universities lead global rankings

US is Energy Self-Sufficient

Flat real gas prices

Less oil/energy intensive economy