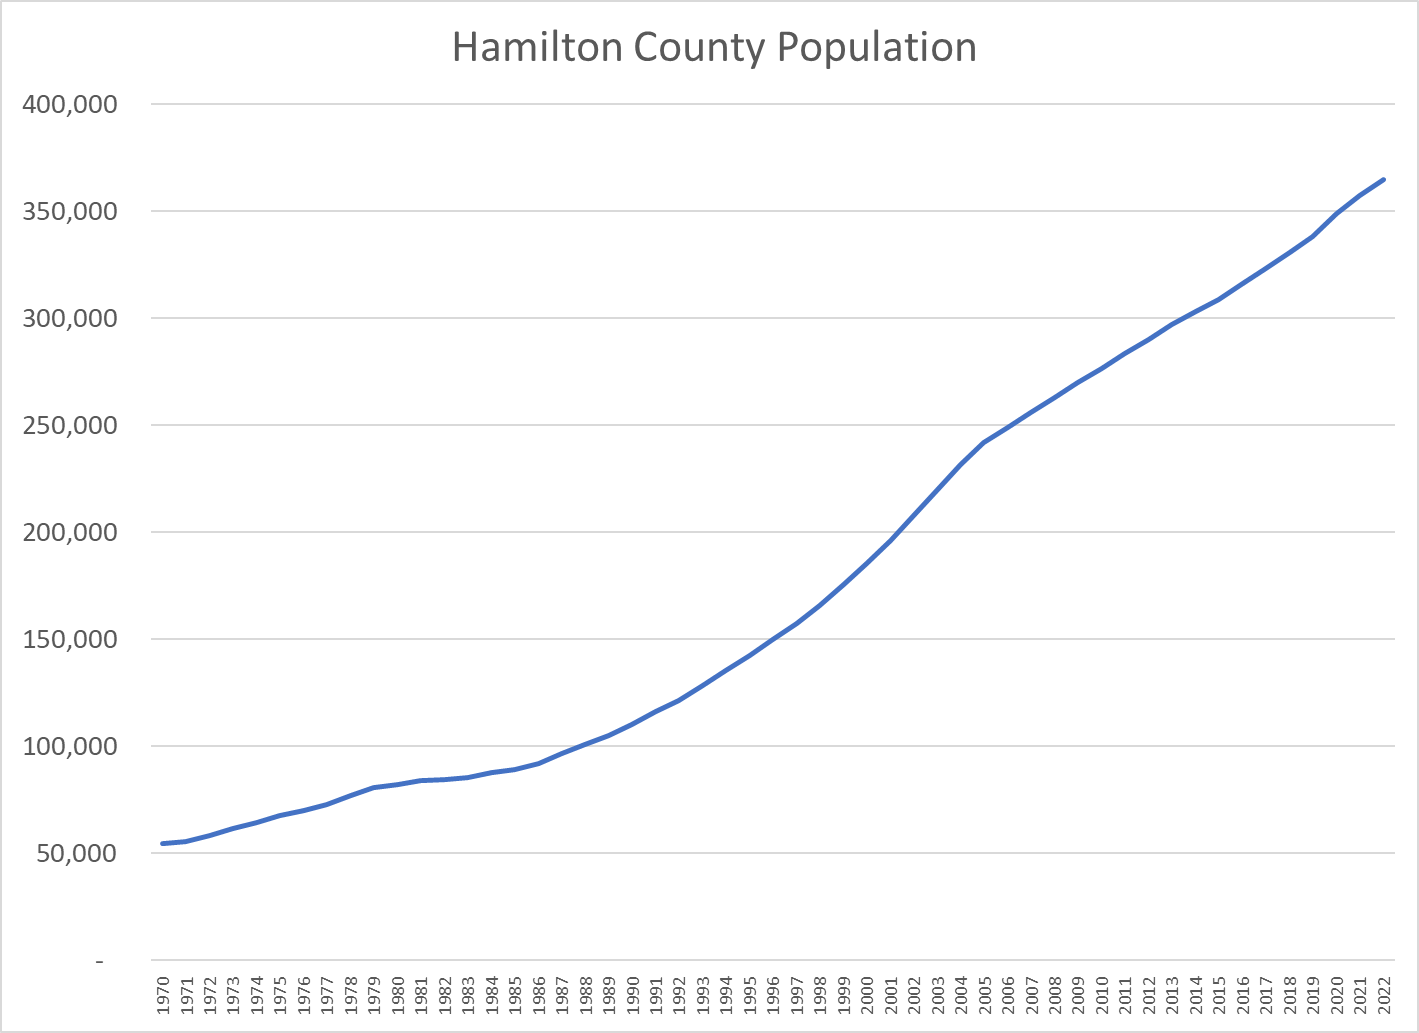
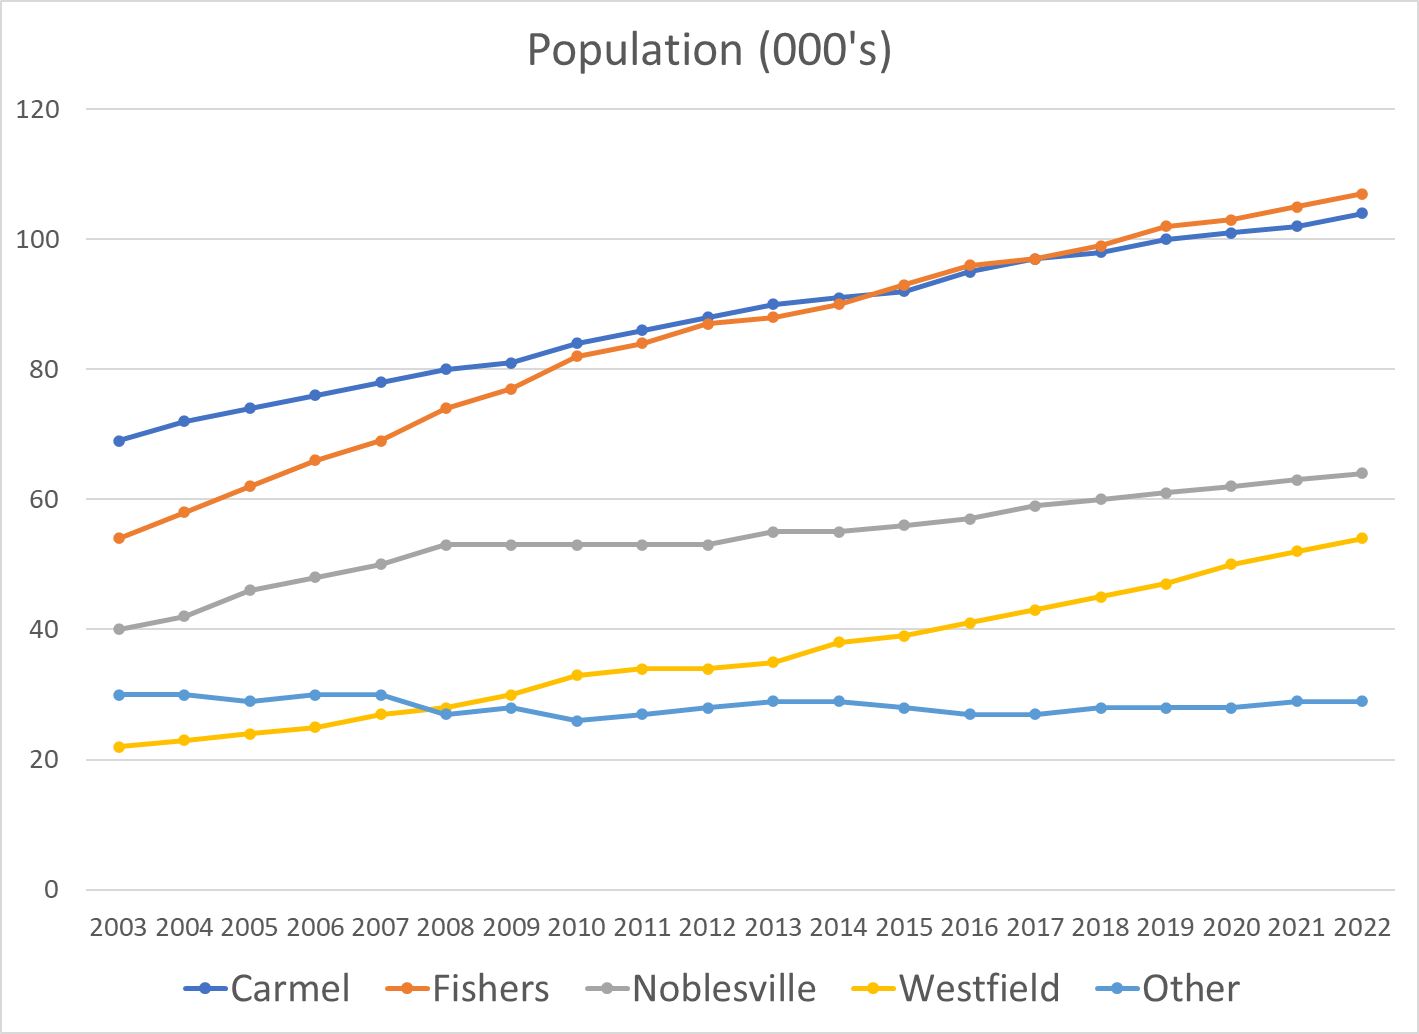
Hamilton County, Indiana is north of Marion County and Indianapolis. It has grown seven-fold since 1970, from 54,000 to more than 365,000 people. It now ranks in the top 7% as the 209th largest county of the 3,142 in the US. It is the fourth largest of Indiana’s 92 counties, trailing Marion (Indianapolis), Chicago’s suburban Lake County and Allen County (Ft. Wayne) which it will surpass for third place in 2029.
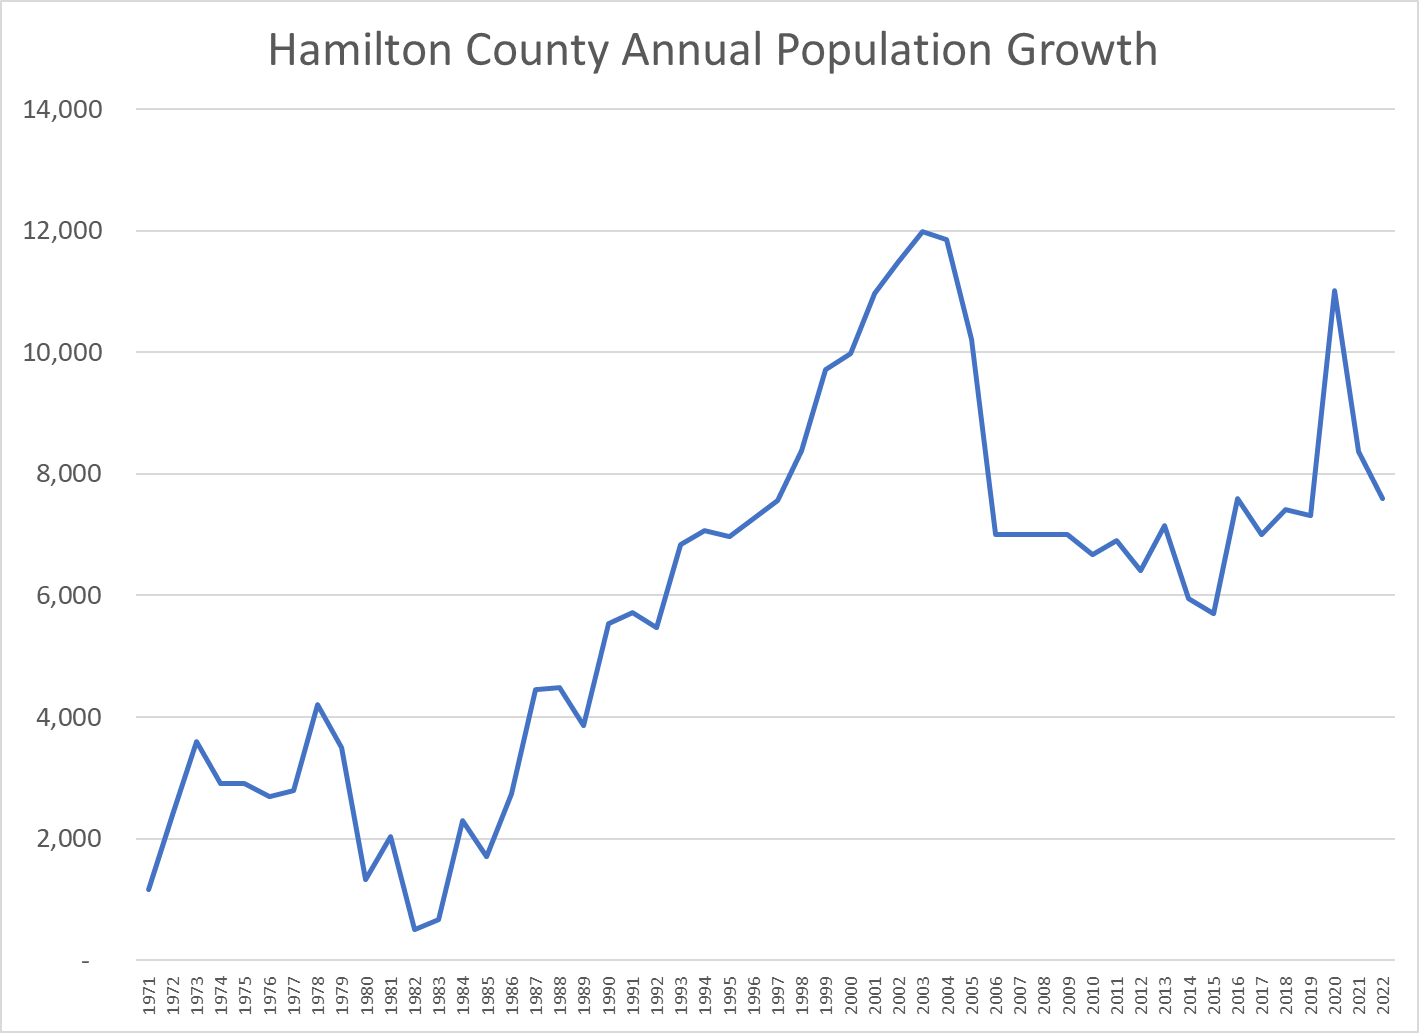
The county has averaged a 7,800 person annual increase since 1990 and has maintained a 7,500-person annual increase in the last decade.
Growth reached a peak of 12,000 per year prior to the Great Recession, dropped back to 7,000 per year and has slowly grown to 8,000 per year.
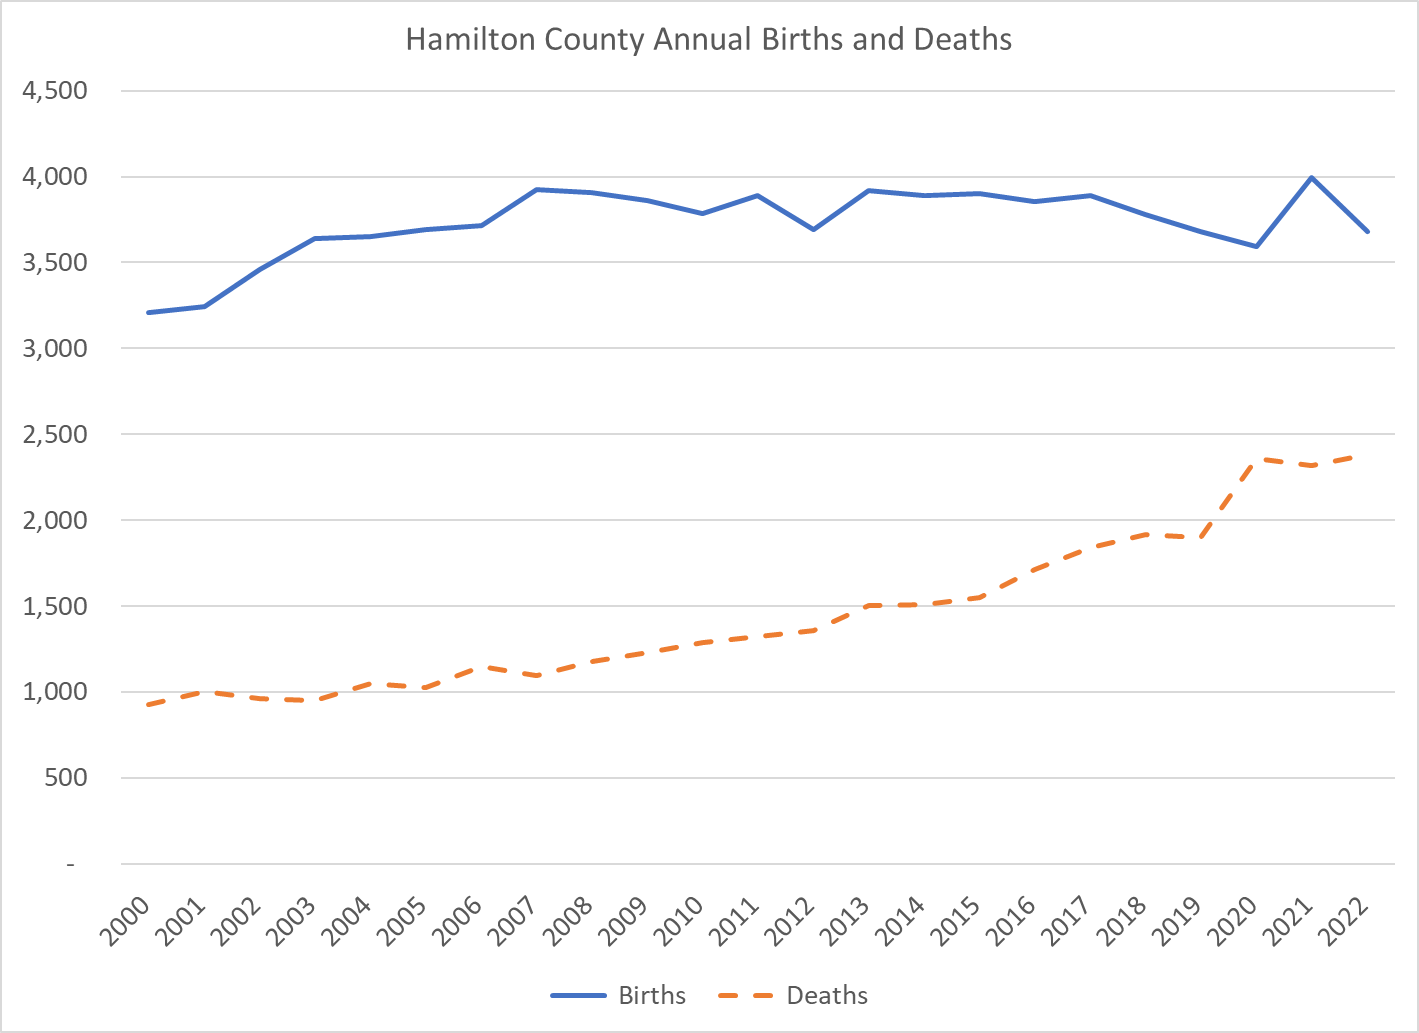
As a growing suburban area, the county has benefitted from a younger population with relatively more births and less deaths. This demographic advantage has decreased through time.
On average, this natural increase advantage has provided 2,000 additional people each year for the last two decades. The net in-migration level was over 8,000 before the Great Recession, dropped in half to 4,000 before recovering to about 6,000 people per year.
The US Census Bureau’s American Community Survey (ACS) attempts to measure the annual migration flows between all 3,142 counties! It’s survey techniques generally require a 3-5 year sampling period to have statistical reliability. The US Census Data and the Indiana Vital Statistics Data (Births and Deaths) show an implicit net in-migration to Hamilton County from 2011-20 of 4,575 annually. The ACS reports just 3,124. The actual increase is 144% of the surveyed increase.
Hamilton County’s population ranged from 283-346,000 between 2011-20, for an average of 314,000. Inbound migration averaged 23,600 per year or 7.6% of the population. Outbound migration averaged 20,400 per year or 6.6% of the population. On average, the county’s population turns over every 15 years. The net in-migration in the ACS survey was 3,100, a little more than two-thirds of the implicit 4,600 net in-migration per year. I compared the 2011-2015 and 2016-2020 data and found that they were generally consistent. I believe that the proportions reported are generally accurate.
International In-Migration
ACS reports an annual average of 1,800 international immigrants. This is 59% of the net 3,100 figure; quite material. On an annual basis, this is just 0.6% of the county population, but for a decade it is 6%. 61% of Hamilton County’s international immigrants report Asia as their home continent.
Total US Migration
Net in-migration to Hamilton County from the US is a positive 1,300 per year in the ACS survey, perhaps 1,900 including the 1.46X factor. Net domestic net in-migration is two-thirds the size of international net in-migration; 0.4% annually or 4% per decade.
48 States Aside from Indiana and Illinois
Net in-migration to Hamilton County from the other 91 counties in Indiana plus Illinois averages 3,004 per year, essentially equal to all of the total net in-migration. Net in-migration to Hamilton County from the other 48 states is a negative 1,700 per year, roughly one-half of the positive overall net in-migration figure. Hamilton County receives minor positive inflows from the adjacent states of Ohio, Michigan and Kentucky. It sends 1,000 residents to Texas each year and receives just 400 in return. Texas accounts for one-third of Hamilton County’s net out-migration aside from Indiana and Illinois. Hamilton County exports 1,200 residents annually to Florida but an equal 1,200 return each year.
Chicago, Illinois
In the last decade 1,500 people annually moved to Hamilton County from Illinois (Chicago) and just 700 returned the favor. Hamilton County received a net 800 residents from Illinois each year in the past decade. This is one-fourth of the net in-migration to Hamilton County. Many Hamilton County college graduates make Illinois their first professional home, so the flow of experienced professionals from Chicago to Hamilton County is probably more than 1,500 per year.
Marion County, Indiana (Indianapolis)
Hamilton County’s Carmel, Fishers, Westfield and Noblesville claim that they are “edge cities” somewhat independent of Indianapolis. In the last decade a net 3,300 migrants from Marion County chose to make Hamilton County their home each year, accounting for more than ALL of the ACS survey’s 3,100 annual increase. Marion County has nearly 1 million people and continues to grow slowly despite this 0.3% annual leakage to Hamilton County.
College Students
Hamilton County school graduates have very high college attendance rates. Hamilton County exports 2,600 students each year to IU, Purdue and Ball State and receives 1,000 back, for a net out-migration of 1,600 per year, about one-half of the net in-migration figure.
Indiana
Hamilton County has a minor net in-migration from sparsely populated Boone County to its west (300/year). It’s net in-migration with the 8 nearby counties, including Boone, is a 500 loss. Hamilton County is an attractive suburban destination, but net net it loses 500 residents annually to nearby counties other than Marion.
Setting aside Marion County and the 3 university counties, Hamilton County attracts 500 new residents annually from the other 87 Indiana counties.
Summary
Hamilton County enjoys a 2,000-person annual natural population increase due to its relatively young age profile. Half of its 6,000-person annual net in-migration is driven by international immigrants attracted to its schools, amenities, services and culture. Most of its remaining growth is driven by nearby Marion County residents who are seeking the same results. Hamilton County is attracting residents from Chicago as retirees, commuting residents or transplants. Hamilton County loses about 2,000 college students each year who migrate into a national labor market. This is an opportunity for further population growth. It also shows that the net 3,100 growth per year figure understates the attractiveness of this county to all potential migrants.
Real, after inflation, Gross Domestic Product is up by one-third, despite the pandemic. That’s 2% annually, despite the Great Recession and the pandemic. The US economy is very solid.
A 21% increase in per capita income during this time. Quite solid and constant growth.
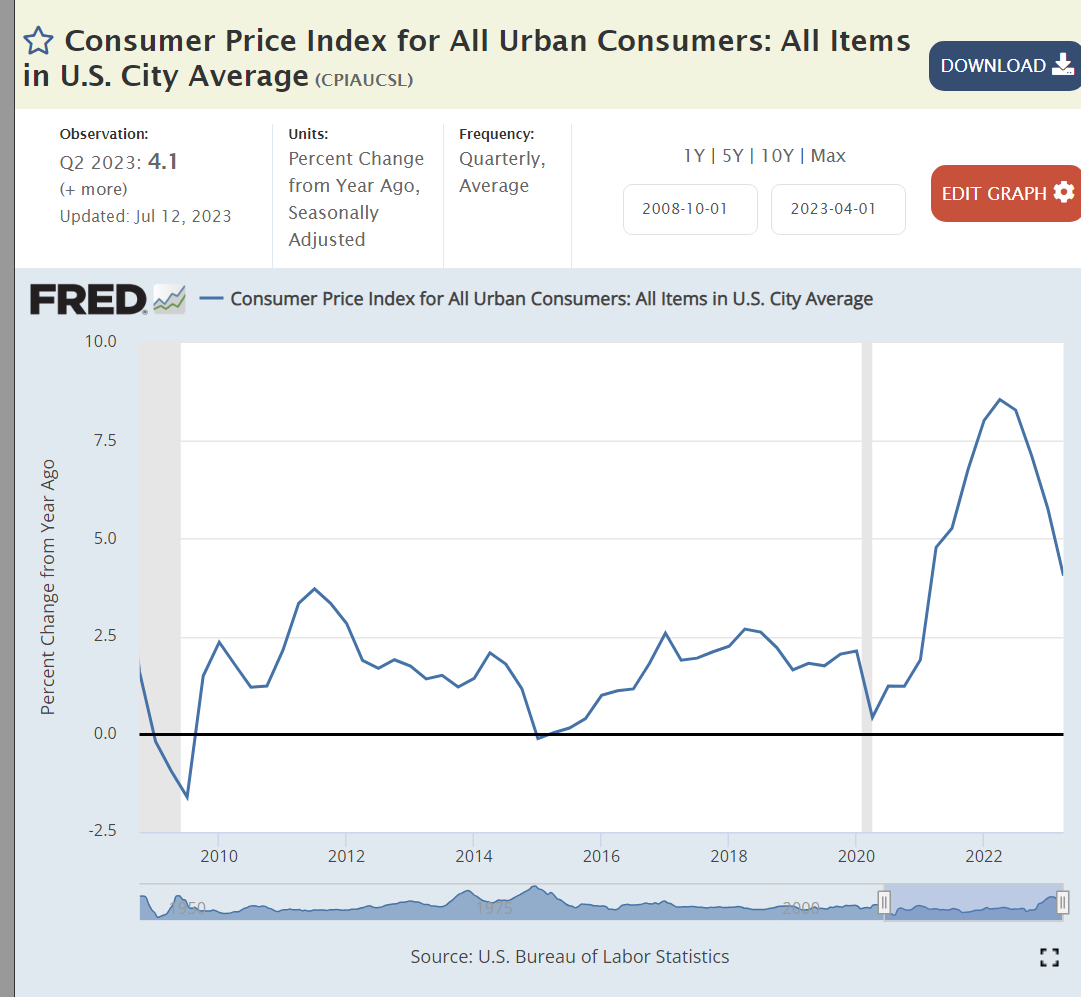
Inflation averaged a bit less than 2% before the pandemic, spiked to 8%, and has since declined to 4%. Experts disagree on whether it will return to 2% soon.
Gas prices are the most obvious component of inflation. They are largely driven by global supply and demand. Prices today are the same as in 2011-14, despite the general inflation increase of more than 20% since then.
Despite the pandemic, US unemployment is at a 50 year low!
Job seekers today encounter 3 times as many job openings.
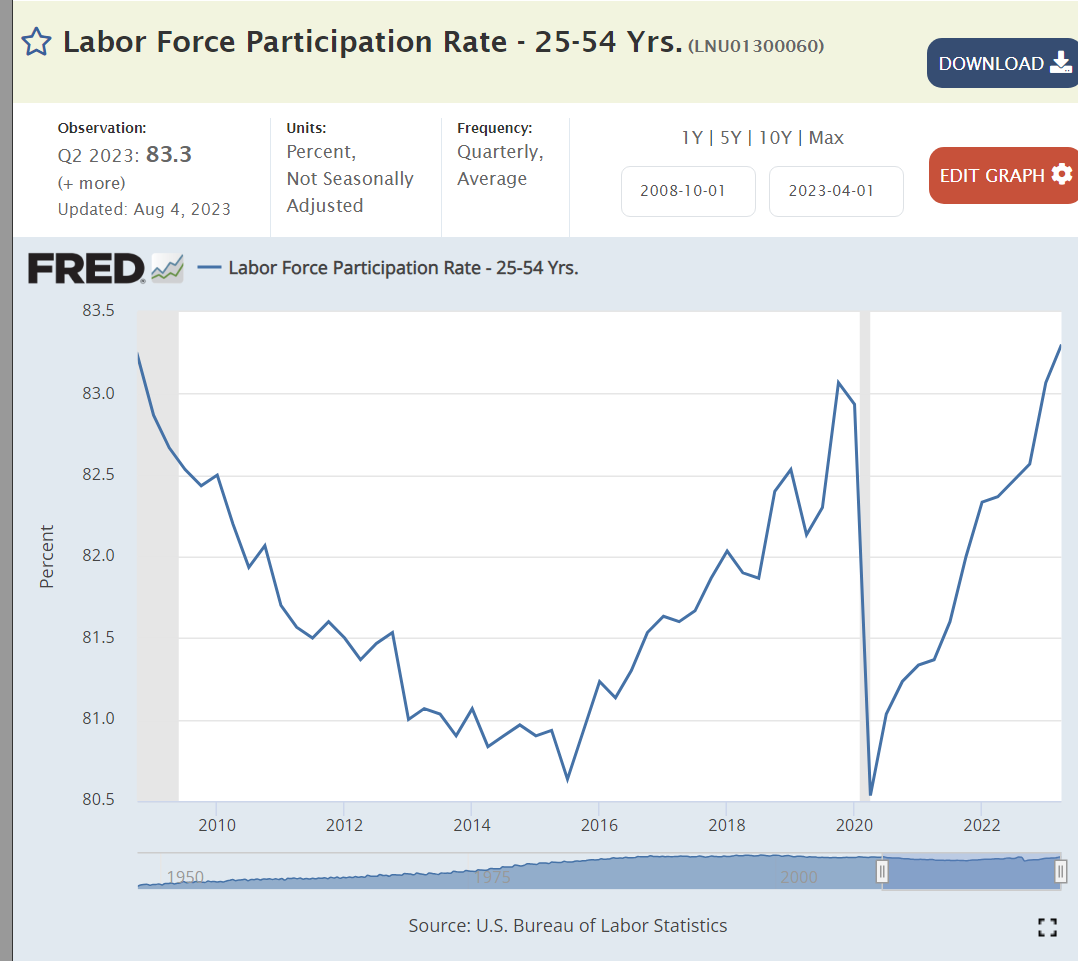
Core age labor force participation has snapped back after the pandemic.
Investment values have doubled.
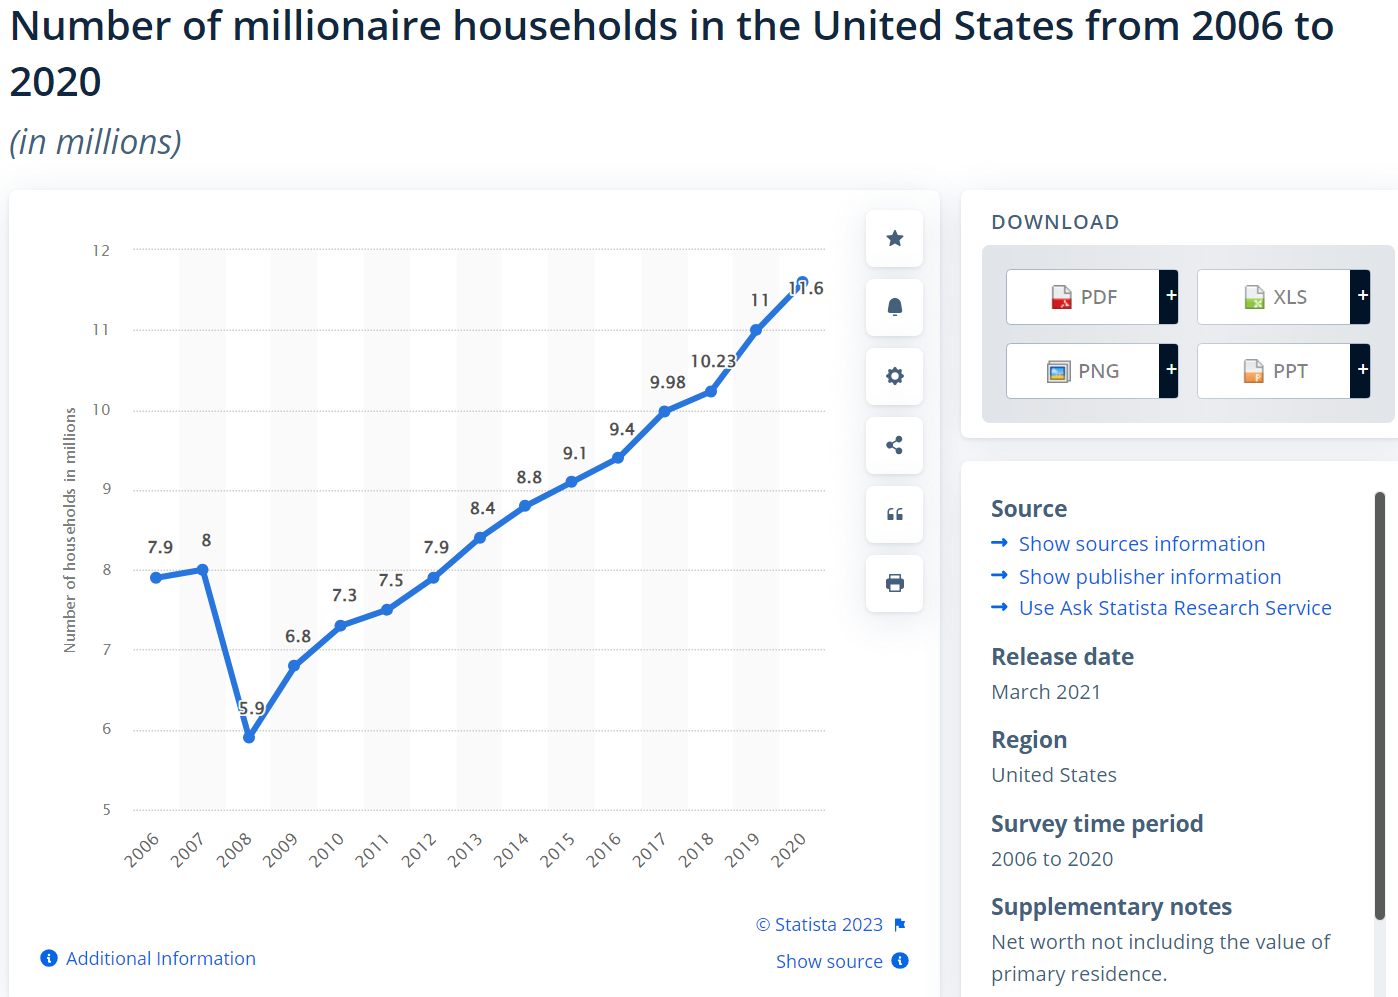
The number of millionaires and billionaires in the US has continued to increase.
Personal savings rates rose from 6% to 9% before the pandemic, shot up and fell back down to just 4% recently.
Housing values have doubled since the Great Recession.
Mortgage rates averaged 4% after the Great Recession, dropped to 3% and then increased to 6%+ as the Federal Reserve raised interest rates.
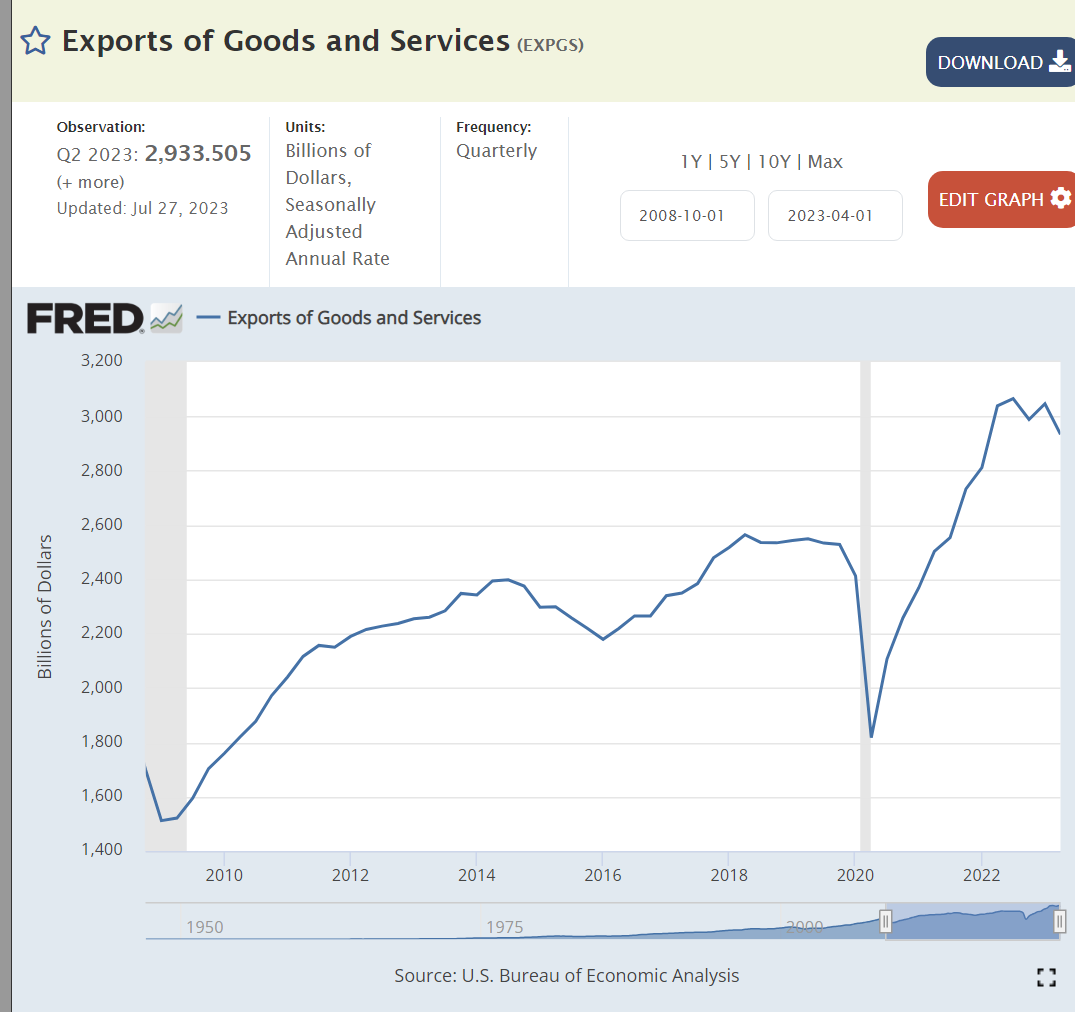
US exports have nearly doubled in 14 years.
Despite the Trump tariffs, which Biden has maintained, imports have also nearly doubled.
Despite historically slower growth rates, higher budget deficits and looser monetary policies, the US dollar is more highly valued today than in 2008.
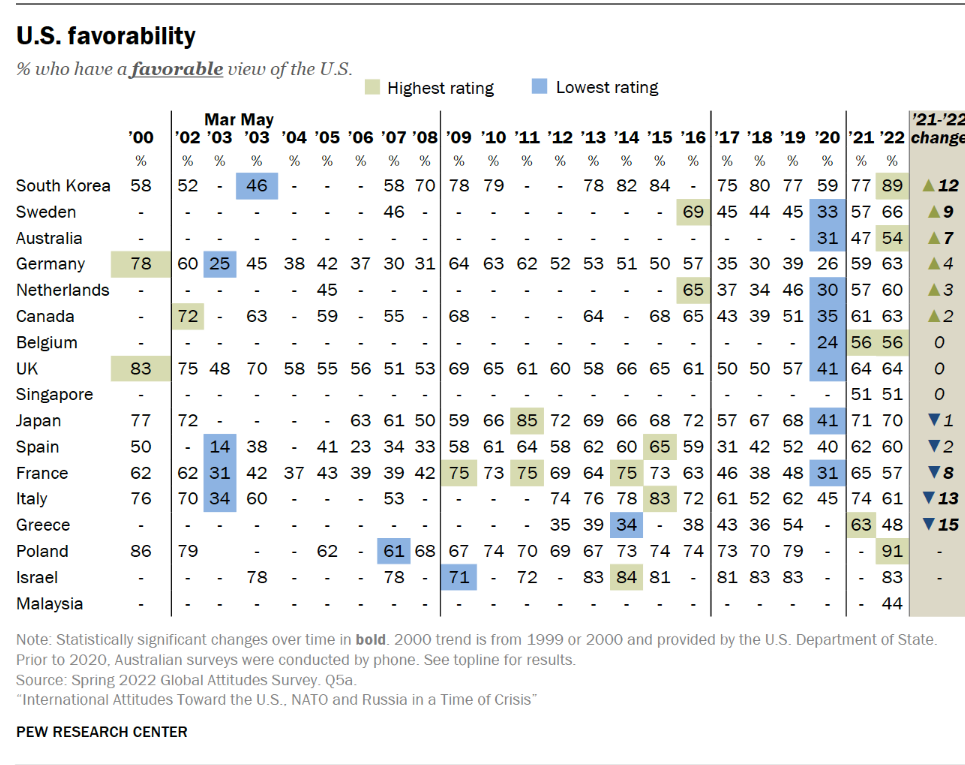
Foreign countries still see the US as a positive ally, despite their concerns during the Trump era.
Obama returned the budget deficit to a “reasonable” 3% by 2016. Trump expanded it to 5% and then 15% as the pandemic struck. Biden drove some recovery to 5% by 2022, but has not driven further reductions.
US coal production is in a long-term decline.
Natural gas production has nearly doubled in 14 years.
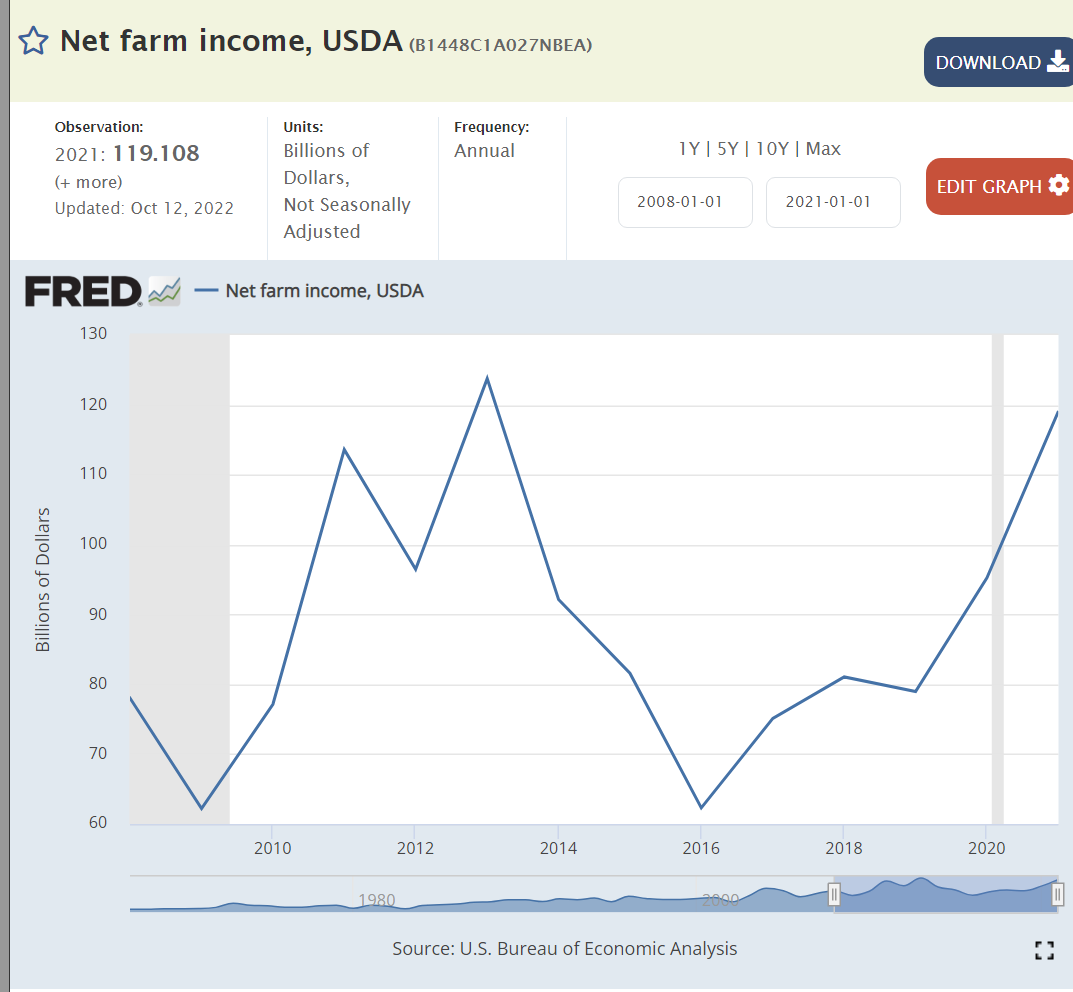
Net farm income has been significantly above the base for 6 of the last 14 years, despite lavish Trump farm subsidies.
Manufacturing employment has continued to rise slowly in the last 14 years against the headwinds of international competition.
It’s difficult to put the pandemic in perspective, but here we see a 2-year reduction in expected lifespans. Opioid deaths and so-called “deaths of despair”, alcohol, drugs, suicide, also play a role.
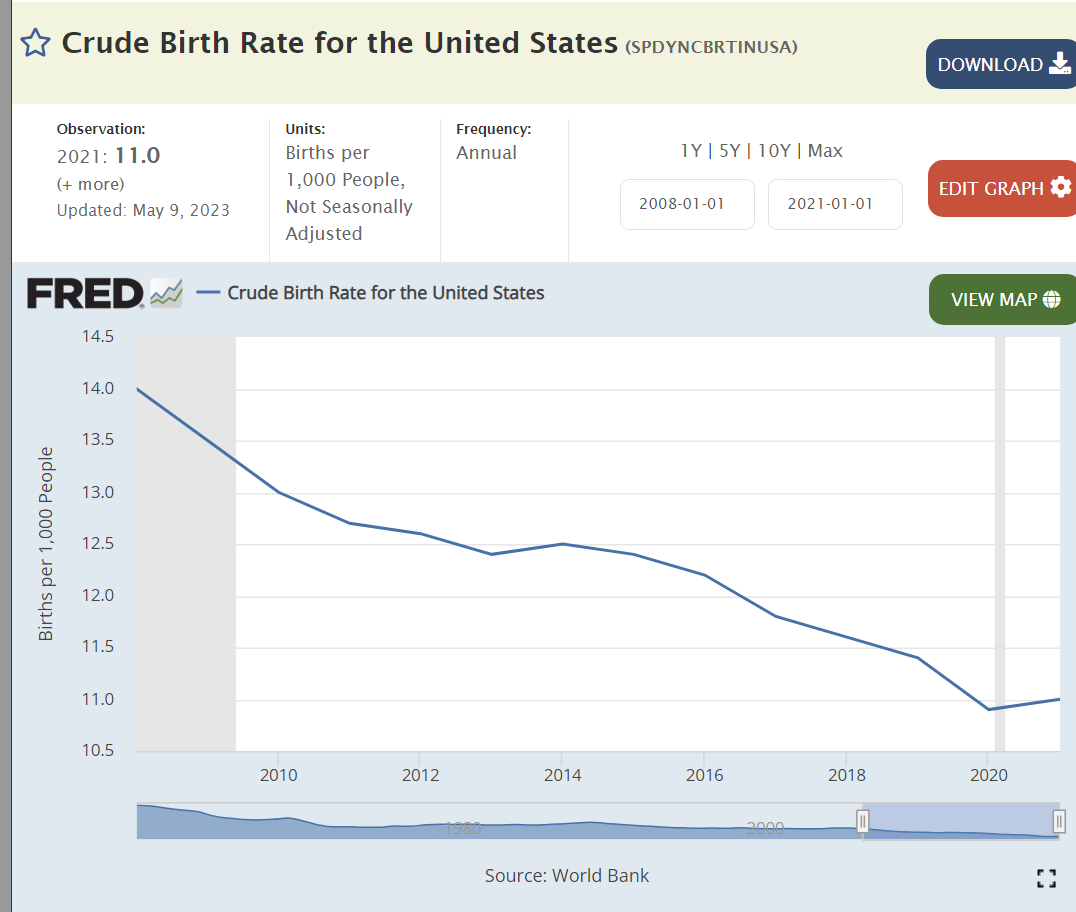
Birth rates continue to drift lower as seen in all regions of the world.
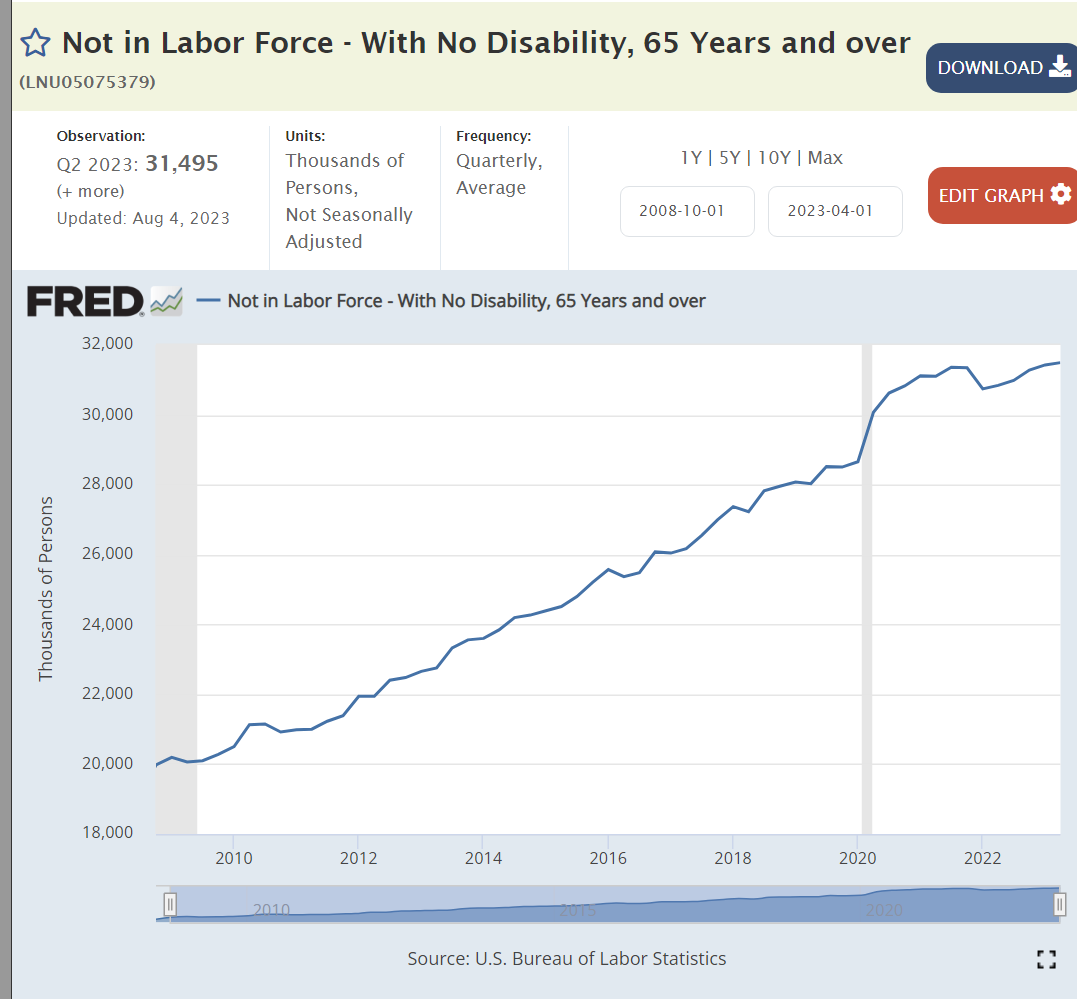
The number of retirees has increased by more than 50%.
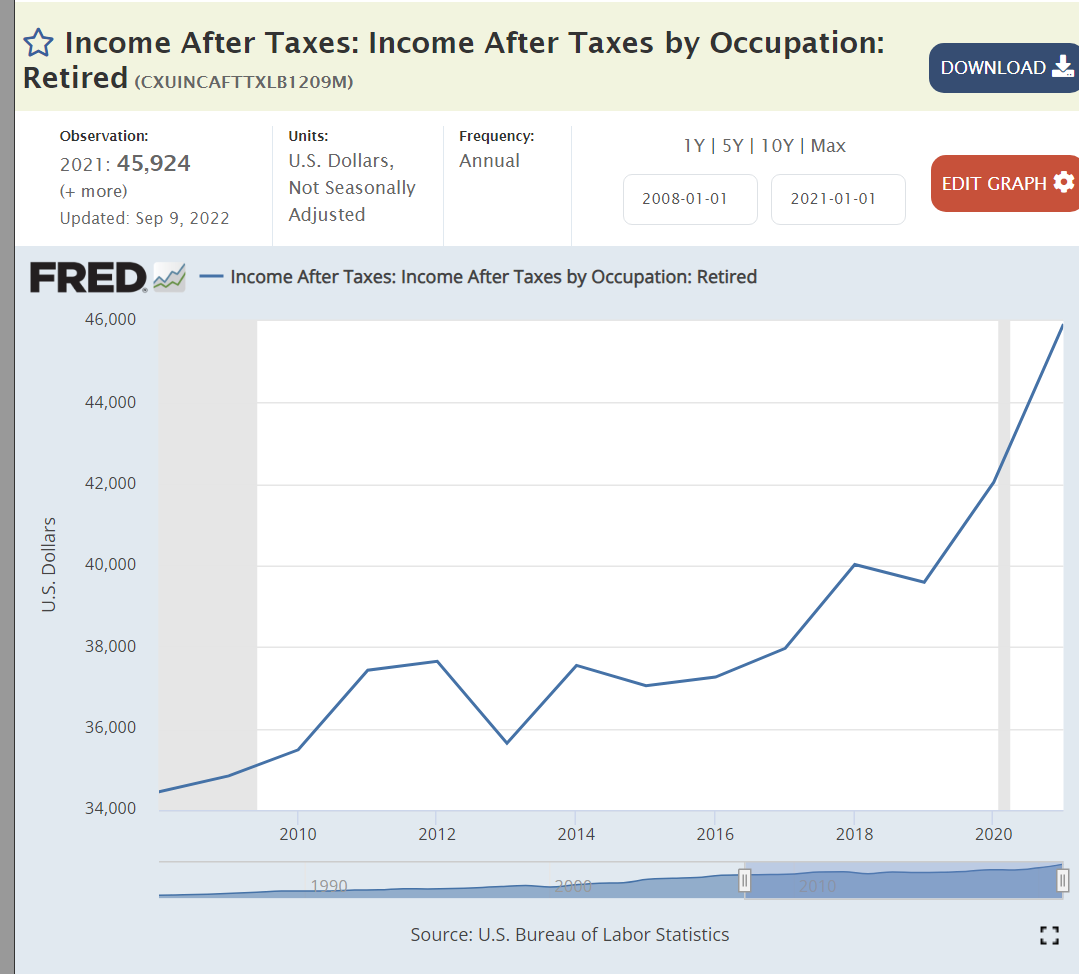
Retiree incomes are up by one-third, matching inflation.
Prospective retirees have doubled their cumulative savings.
The abortion rate has continued to fall in the last 30 years.
Church attendance has dropped from 40% to 30%.
Summary
The US economy recovered slowly after the Great Recession and then very quickly after the pandemic. Real, after inflation, output and per capita output increased. The labor market became very tight. Asset prices (investments and housing) rose for intrinsic and monetary reasons. The US remained a competitive international producer. The federal budget deficit was better at the end of the Obama period but worse for Trump and Biden. The pandemic reduced life expectancy and households had fewer children. Successful retirements grew and will grow. Social trends continue, uninterrupted by political positioning and policies.
Perceptions of the country and the economy are increasingly shaped by partisan political party views. Nonetheless, the US economy continues to grow and thrive.
The alliance of 13 independent states to become the United States of America enshrined the notion of “minority representation” in the US constitution. North versus South. Different religious majorities. Rural versus urban. Domestic versus international leaning. Free versus Slave.
We should embrace that principle but fine-tune the mechanism. Two senators per state when the population was just 3 million was a practical compromise. The US population reached 300 million in 2006; 100 times larger. The numerical and proportional differences today are simply too large to ignore. Louisiana and Kentucky at 4.6 million people are the median states. The average state population is 6.6 million today. 5 states, SD, ND, AL, VT and WY have less than 1 million citizens. They get 5 to 7 times more representation than the “typical” state. I recommend that we accept this difference as a way to preserve “minority representation” and the legitimacy of our democratic system.
On the top side, four states stand out. California (39M), Texas (30M), Florida (22M) and New York (20M) have populations 5-8 times the median and 3-6 times the average population. [For perspective, note that California’s population today is 13 times as large as the whole country in 1780.]I recommend that these four states be given 2 extra Senators since they have more than 4 times the median state population. Seven states have populations more than twice as large as the median 9M: PA, IL, OH, GA, NC, MI and NJ. I recommend they each get an additional Senator.[California (19x), Texas (15x), Florida (11x) and New York (10x) after these changes are still less represented than the dozen states with populations of just one million, rounded; just not so disproportionately.]
This change would add 15 Senators. It would dilute the “minority representation” of the other 39 states by 15%.
Fortunately, the political impact of this change would be modest, so both parties can support this improvement in political legitimacy. CA and NY are Democratic locks, while Texas and Florida are Republican locks. Illinois and New Jersey are Democratic locks, while Ohio is a Republican lock. Pennsylvania and Michigan lean left, while Georgia and North Carolina lean right. Net, net this change adds one Democratic Senator out of the new 115 seats, an immaterial number.
The Senate is a very important part of our government. It acts as a check on the more representative and responsive House. It approves treaties, constitutional amendments, judges and presidential appointments. The number of Senators drives the size of the electoral college. Changes should not be made without due consideration.
My Republican colleagues might reject this “out of hand” because it costs them a Senate seat today and it reduces the future leverage of less populated states. I think that the legitimacy of our government, to prevent populist winners and civil war is reason enough to “fine tune” our system. Republican oriented Texas and Florida are growing faster than California and New York, so their citizens are the most “disenfranchised” by the current system in the future. A revision might block the pressure to admit DC and PR as states. Four of the five next least populous states are likely Democratic states in the future: DE, RI, ME, NH versus MT, which has some Democratic voting potential. The next, Hawaii, is a Democratic lock. In the next five, KS, NE and WV are safe Republican seats, but Idaho and New Mexico could follow Colorado and Nevada into the other party’s column.
It’s time for all Americans to step out of their partisan comfort zones and think about what is best for the country in the long-term. This is a reasonable change that everyone should support.
The relationships between firm size, age, growth, survival, death, locations and job creation and retention are many, complex and politicized. However, the core relationships expressed in my 2 recent posts are well supported by data and theory. I’d like to share more background information.
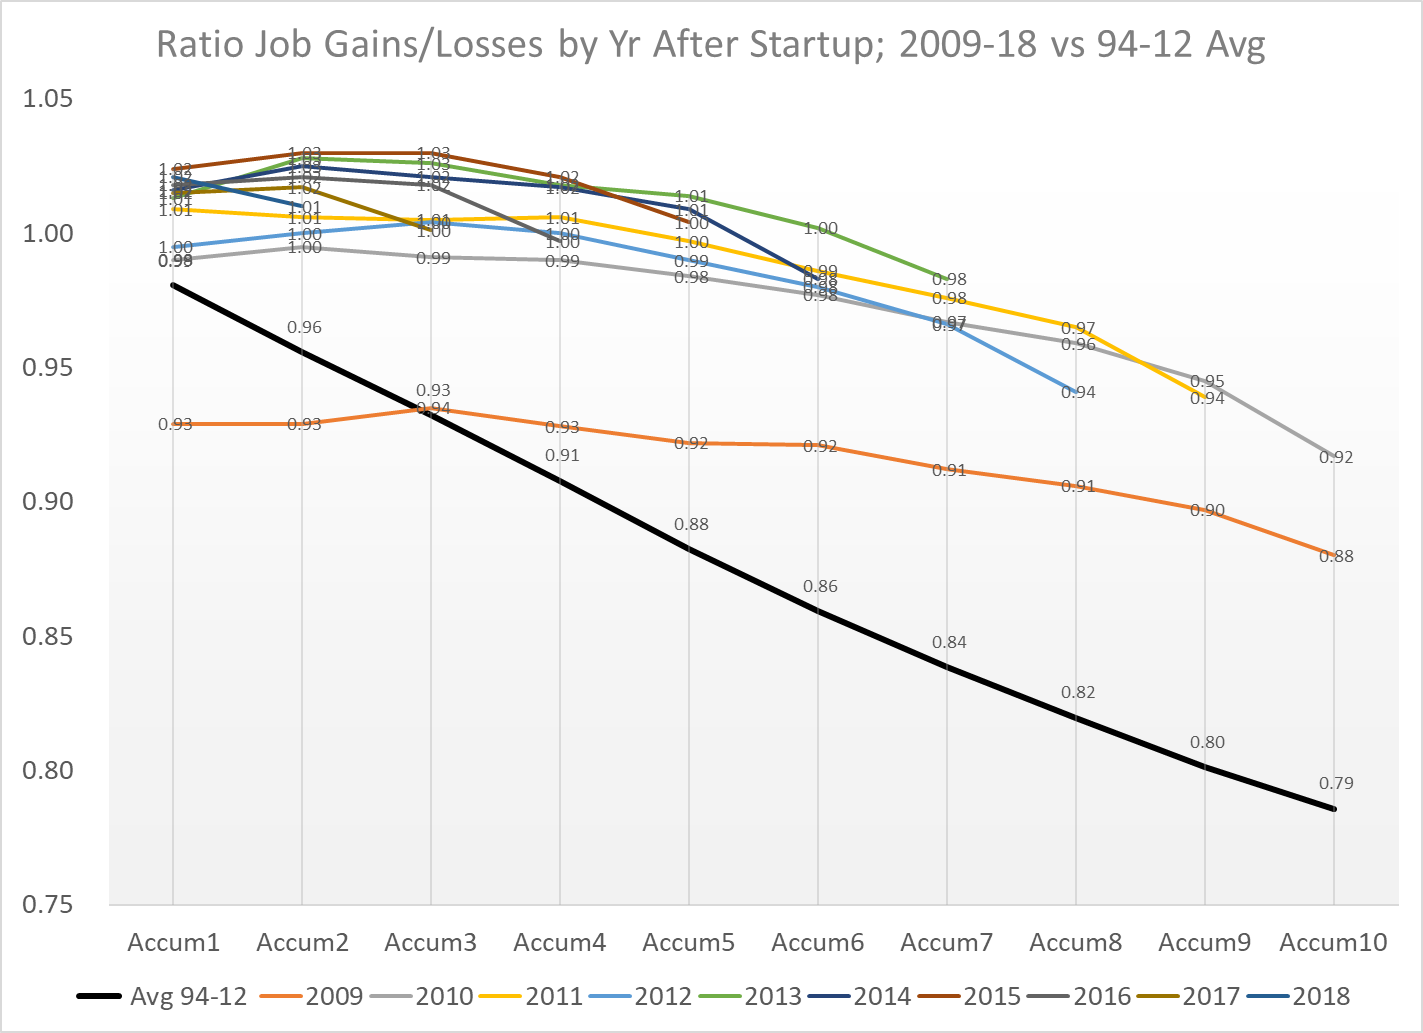
The 10-year job survival rate for startups is roughly 80% and has improved in the last 10 years. However, the FIRM survival rate is much lower. The surviving firms, through economic natural selection, grow rapidly from a low (4 average employees) initial base.
This study of 2011-14 highlights the initial start-up job surge, followed by 10 years of net job attrition and then modest net job growth by mature firms when low firm death rates (5%) are exceeded by decent levels of net jobs added.
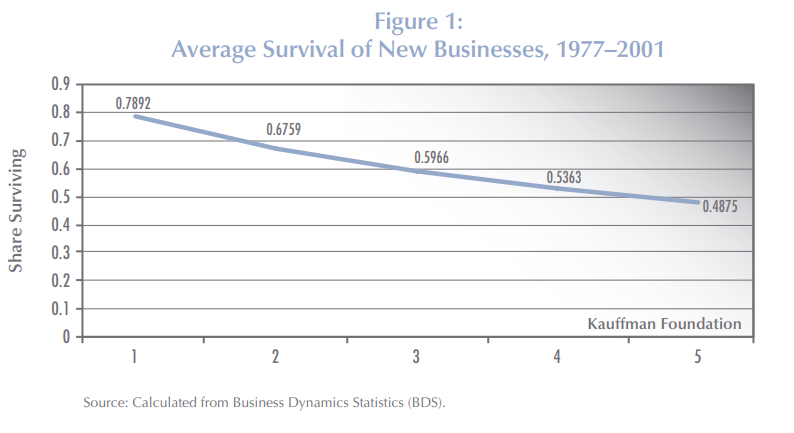
The Small Business Administration (SBA) reports the average firm survival rates for 1994-2019 as roughly two-thirds for 2 years, one-half for 5 years, one-third for 10 years and one-fourth for 15 years.
My review of the 10-year data confirmed the 33% rate for most of the period, with an increase to 36% for firms that began after the Great Recession in 2010-12.
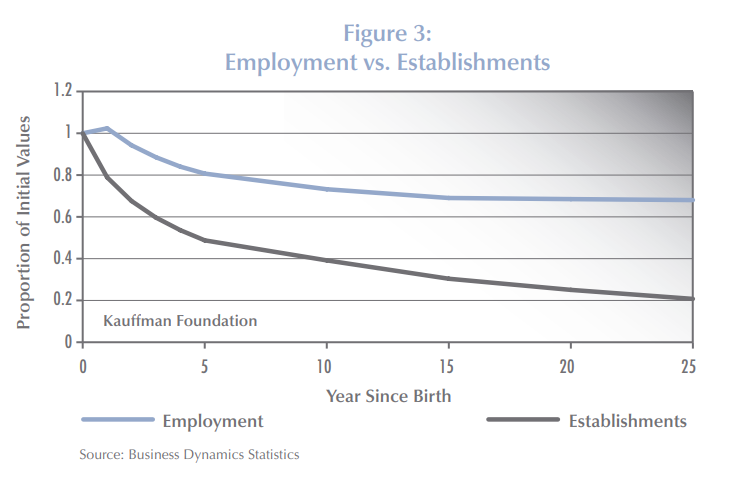
In 2010, Kauffman Foundation researchers summarized the detailed Business Dynamics Statistics (BDS) data, showing the relatively slow decline in net added employment from 100% initially to 80% at 5 years to 70% at 15 years and the rapid decline in the surviving firms rate to one-half at 5 years, 40% at 10 years and just 20% at 25 years.
Another Kauffman report from 2010 shared similar results. The universe of firms is dominated by young firms because the cumulative attrition makes “mature” firms quite rare.
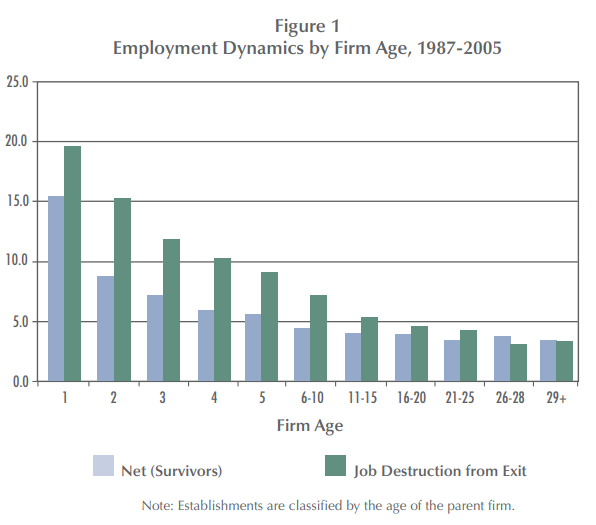
Another Kauffman report in 2009 summarizes this competition between dying firms killing jobs and surviving firms adding jobs. In the first 5 years, the firm failure rate is so high that it overwhelms the high job growth rate of those successful startups. In years 6-10, the death rate is still winning, but the total net job destruction is much smaller. For this 18-year data set, firm deaths exceed added jobs at every age, although 29+ year-old firms basically break-even. This is a critical insight when thinking about the claim that all or nearly jobs are added by startups. It is “true” due to the firm survival and jobs added rates at different ages. It is possible to have quite different results, with existing firms accounting for relatively more jobs, but that would require either the firm/establishment death rates to fall or the job creation rates of surviving firms to increase significantly. It looks like there has been some of that change after the Great Recession. This chart also helps to show that the “net, net” addition of jobs from start-ups, when considered as the sum of their first 5 years is in the 75-80% range, because the net jobs lost in those early years is only 5% per year, despite the more rapid loss of firms.
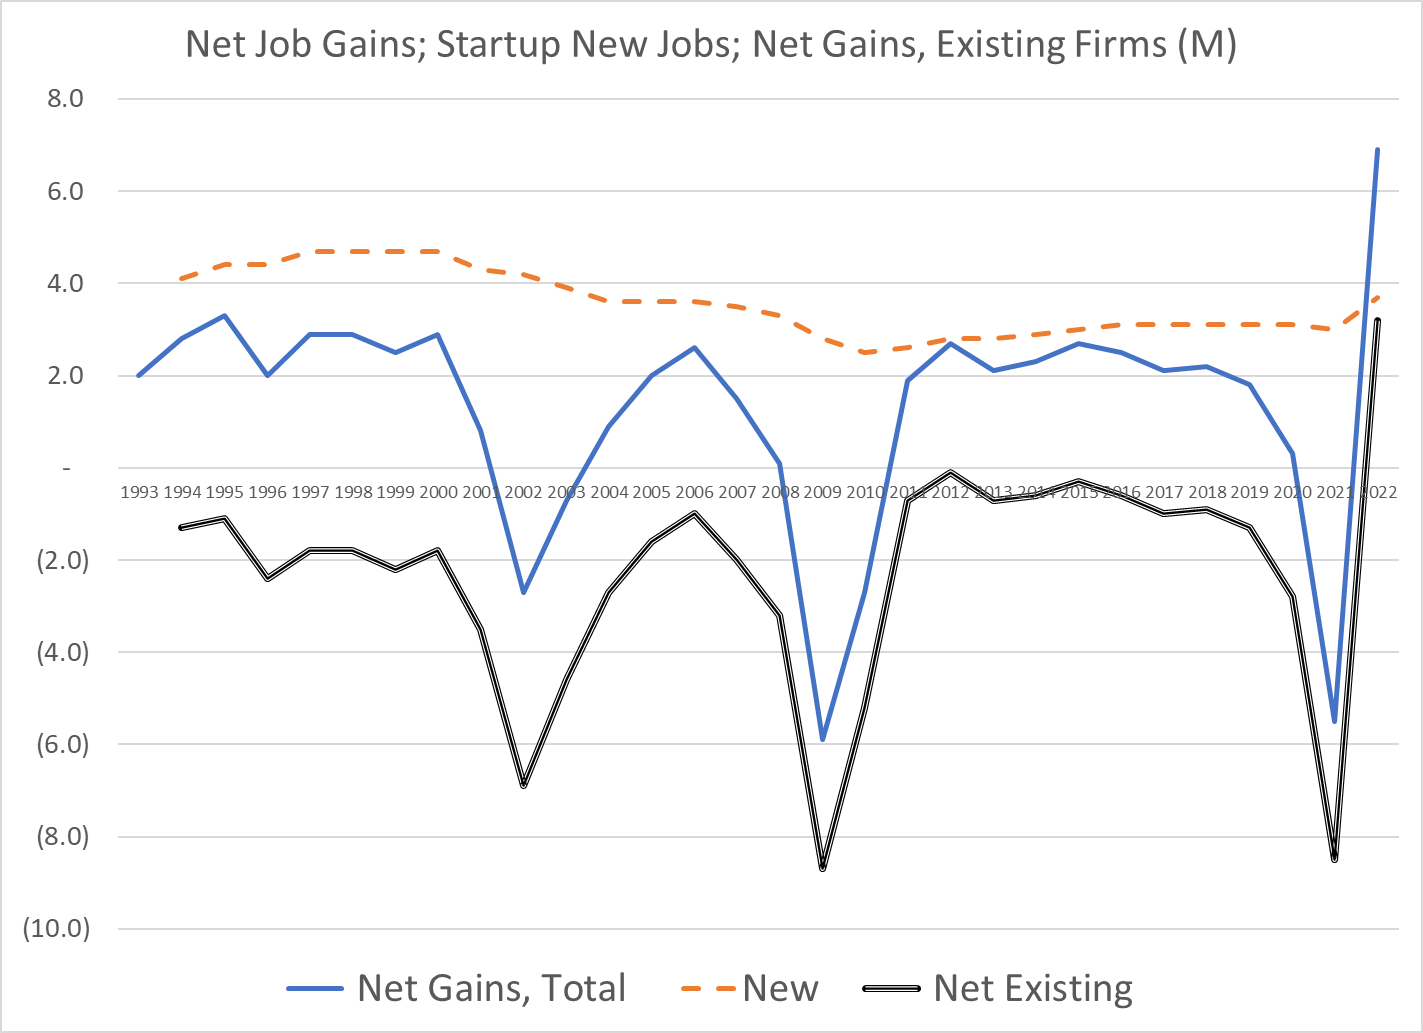
My summary of the last 30 years of data shows that startup firms do account for “all” new job growth. As others note, in a way this is almost “by definition”, because this is the only age group that only has “adds”, but no “losses”. It always must be positive. As we’ve seen in the details on job departures/hires, jobs created/lost, firms created/lost and establishments created/lost the positive and negative flows tend to be “roughly equal”. Hence, even a single year which is not burdened with an offset will stand out as the “big winner”. So, on the one hand we can discount the critical, essential, vital role of startup job creation, but we can’t ignore it. It is a necessary part of the life cycle of firms that delivers a growing economy.
The 2010 Kauffman study combined the initial jobs created with the jobs lost in the next years to emphasize the vital role of startups, using 2007 data. Mature firms also made a small contribution to jobs added.
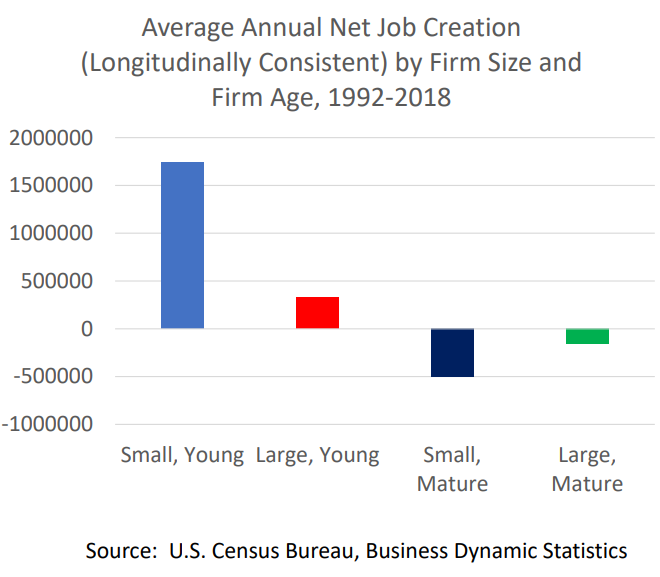
A follow-up report in 2011 by Dr. Haltiwanger summarized the data slightly differently but tells the same story. New firms, nearly all “small”, account for almost all job growth. Other small firms destroy jobs in their first 10 years at a high rate and as mature firms at a modestly high rate. Middle-aged firms lose jobs while successful firms grow to more than 500 employees and become large firms! Young large firms add a few net jobs. Old large firms lose a small percentage of jobs for this time period (1992-2005).
The central takeaway remains valid with more recent data across industries. The initial growth of jobs is not offset by the net losses in the next 5 years. Firms more than 6 years old do not add jobs overall.
I don’t know how to reconcile these competing claims but expect that the time periods chosen, and firm sizes chosen, are keys to understanding the significantly different claims.
In the early papers the Kauffman Foundation explains that it is new firms that drive new jobs. There is an overlap between new firms and small size that makes an analysis based on size alone appear to say that “small firms create most new jobs”; but the “newness” logically comes first. Existing small employment firms tend to shed jobs through firm death or internal job reduction.
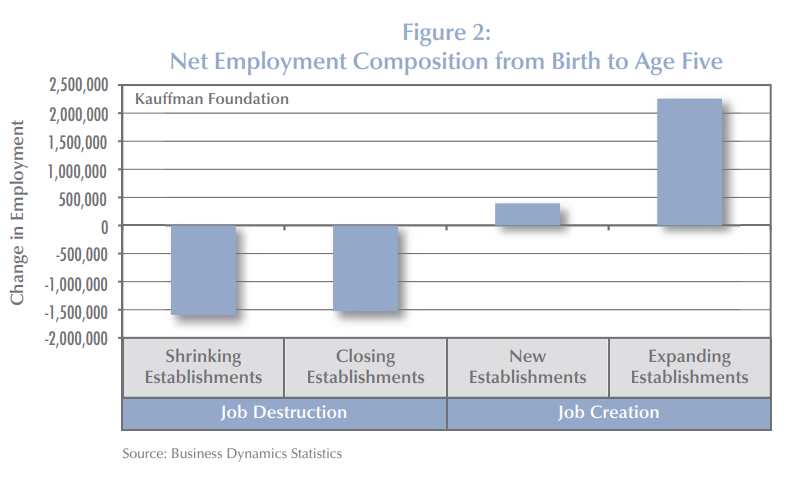
A simple model focuses on just the first 5 years of a firm’s life after the initial startup year and defines four buckets of job growth and loss due to adding new establishments or experiencing deaths versus internal job growth (up or down) at the survivors. All four buckets matter. New establishments are infrequent for startup firms. Deaths are a major job killer. Job creating firms outweigh job losing firms. But the net gains from internal job growth is less than the drag from firm deaths.
Kauffman also created a complete theoretical model of job changes through time based on the key parameters and demonstrated that the model was a good match with the observed relative consistency of the parameters and the net output of jobs created. In a prior life, we called this the “layer cake” graph, using it to explain the composition of revenues or profits in a business based upon the year of customer contracts signed or new products introduced. At any point in time, there is a history of additions of various ages. Employment tends to decline over time based upon the combination of firm deaths, establishment gains/losses and internal job growth. Each year a new group of firms is added, all with job gains in the first year. This group too follows the pattern of job erosion in the first 5 years, smaller erosion in the next 5 years, close to break-even by age 20 and small net job creation for the mature surviving firms. Again, the parameters could be different, and the results would be different. But this framework provides economists and statisticians with the tools to analyze the components.
Another author created a dynamic model which illustrates how this process works through time.
The Small Business Administration promotes the view that small businesses (less than 500 employees) are essential to the US economy and create a majority of all jobs. As noted above, startups are the key. Size is a byproduct.
In my earlier post I discounted the importance of the decline in the share of new to total firmsbecause the corresponding decline in failure rates and improved job creation by mature firms was still delivering solid annual job creation. However, this warning signal is worth monitoring together with the other measures. The Brookings Institution provides some other “warning signals” about the health of the new firm/job creating capacity of the economy in light of reduced measurable competition in many industries (a topic for another day).
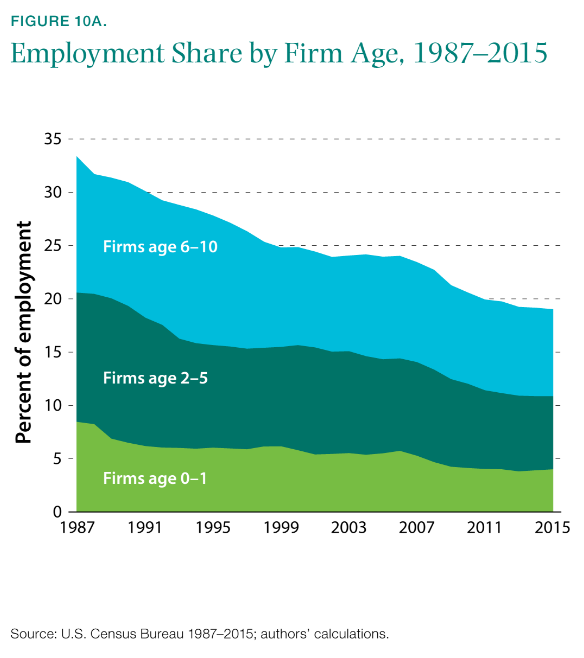
New firms account for a smaller share of total employment.
Business formation takes longer. Recent Kauffman reports shows that this trend has continued.
The entrepreneurship rate of college educated Americans has fallen most significantly.
One professor analyzed this and concluded that it was the result of American firms taking advantage of the low cost of capital and paying the higher salaries and incentives needed to attract and retain high potential employees. He says that job creation is happening more in existing firms and less in startups with no negative overall effect. He says that “marginal” (low return) entrepreneurs have been removed with little negative impact on the economy as a whole.
The slowdown in the new firm/job creation rate after the Great Recession attracted much attention from the media and politicians. Two representative articles are listed below, mostly bemoaning the decline of startups/small firms and the relative growth of large firms.
With the renewed emphasis on small firms and public policy to support them, others have responded by emphasizing the benefits of large firm growth and questioning the need to support/subsidize small firm growth.
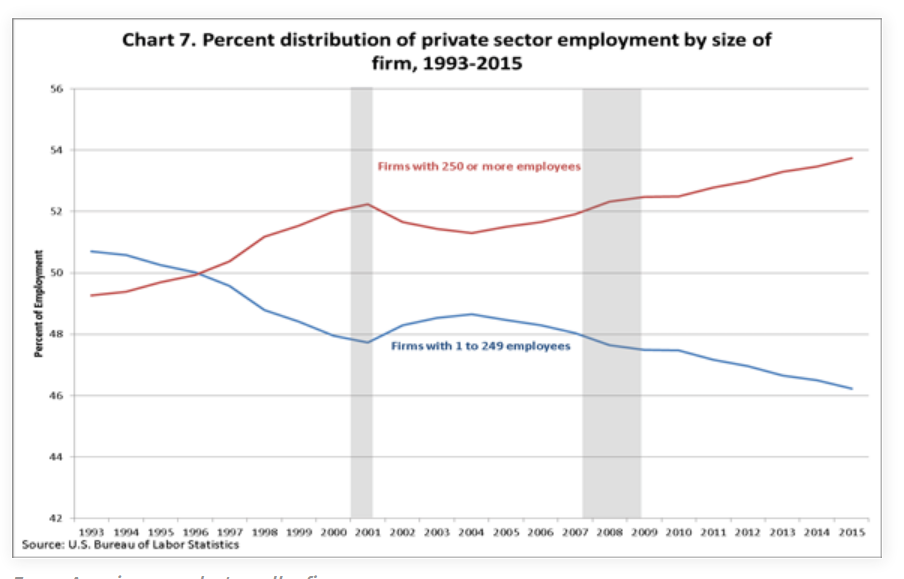
Using less than 250 employees to define “small business”, this article shows a 4% decline in small business share and 4% increase in large business share.
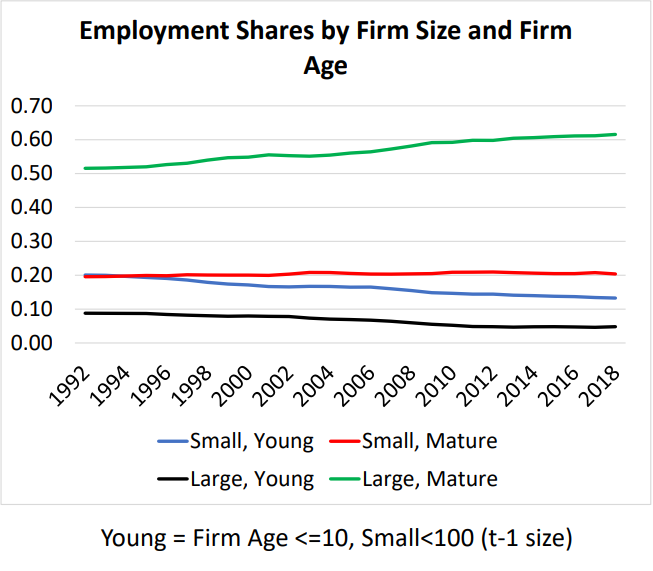
Professor Haltiwanger reports that large, mature firms have increased their share of total employees from 50% to 60% between 1992 and 2018. Both large and small young firms have lost offsetting market share.
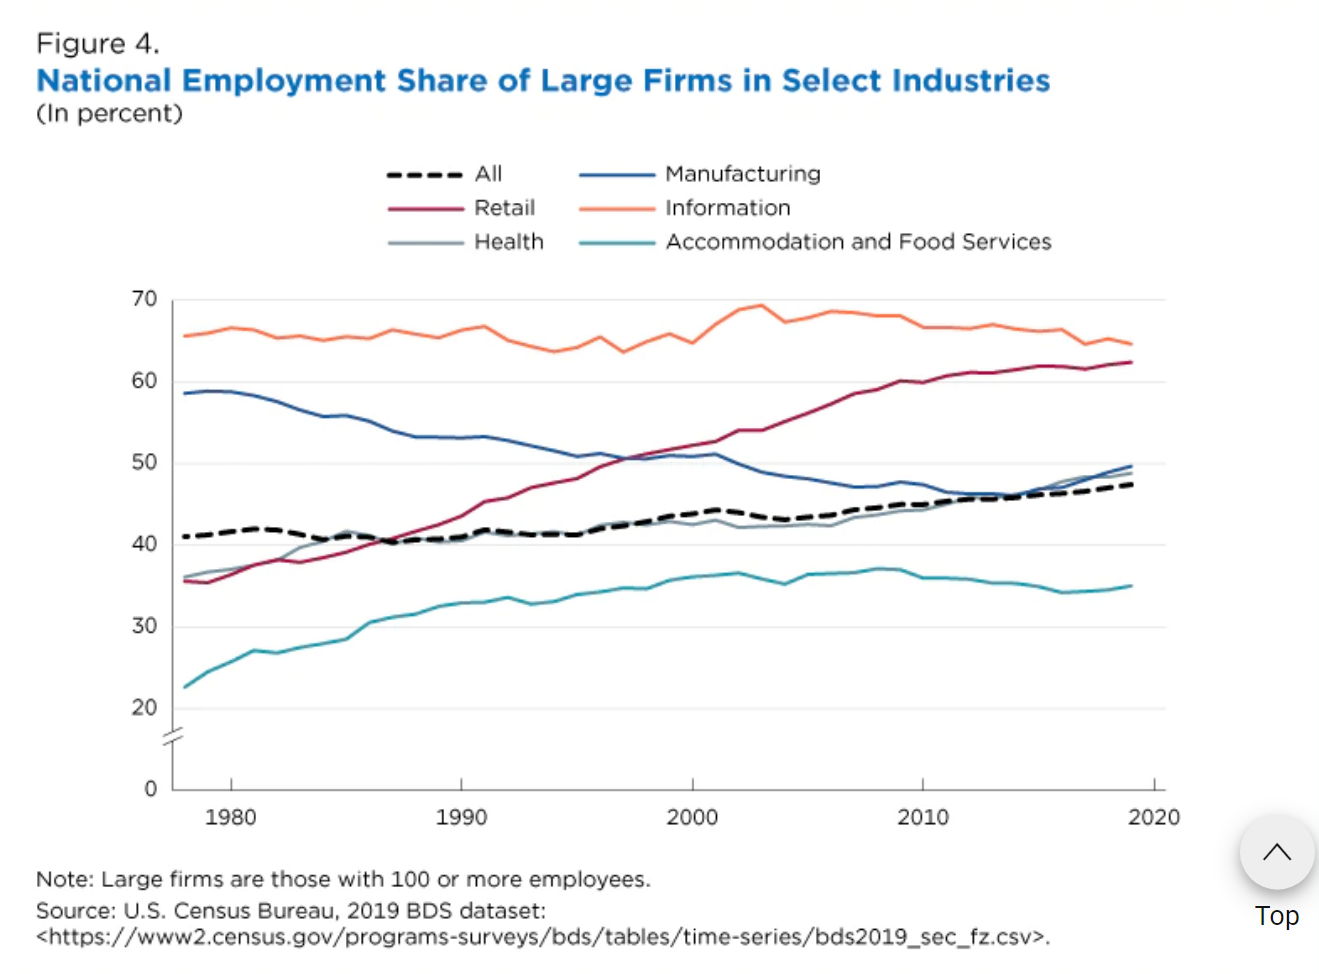
A recent Census Bureau article documents the increased employment share of older firms (6 years+) in many key industries.
It also highlights the increased concentration of workers in large firms in the retail, health care, accommodation and food services sectors.
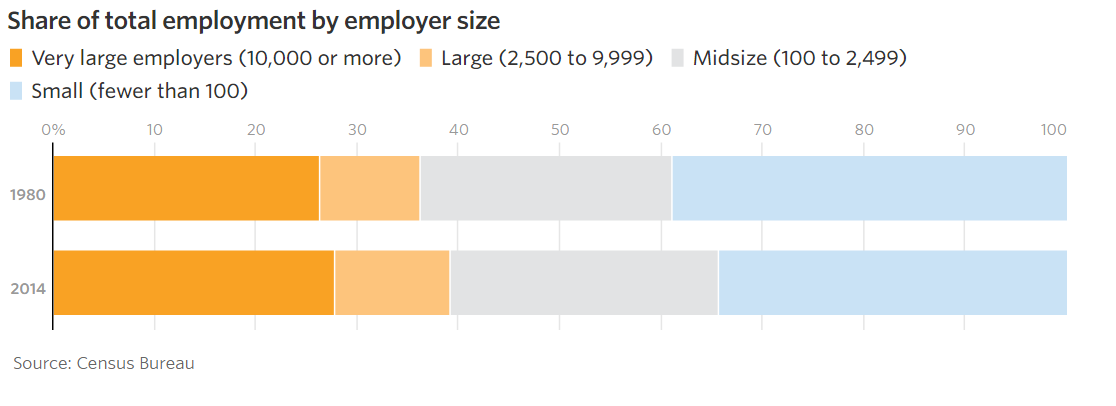
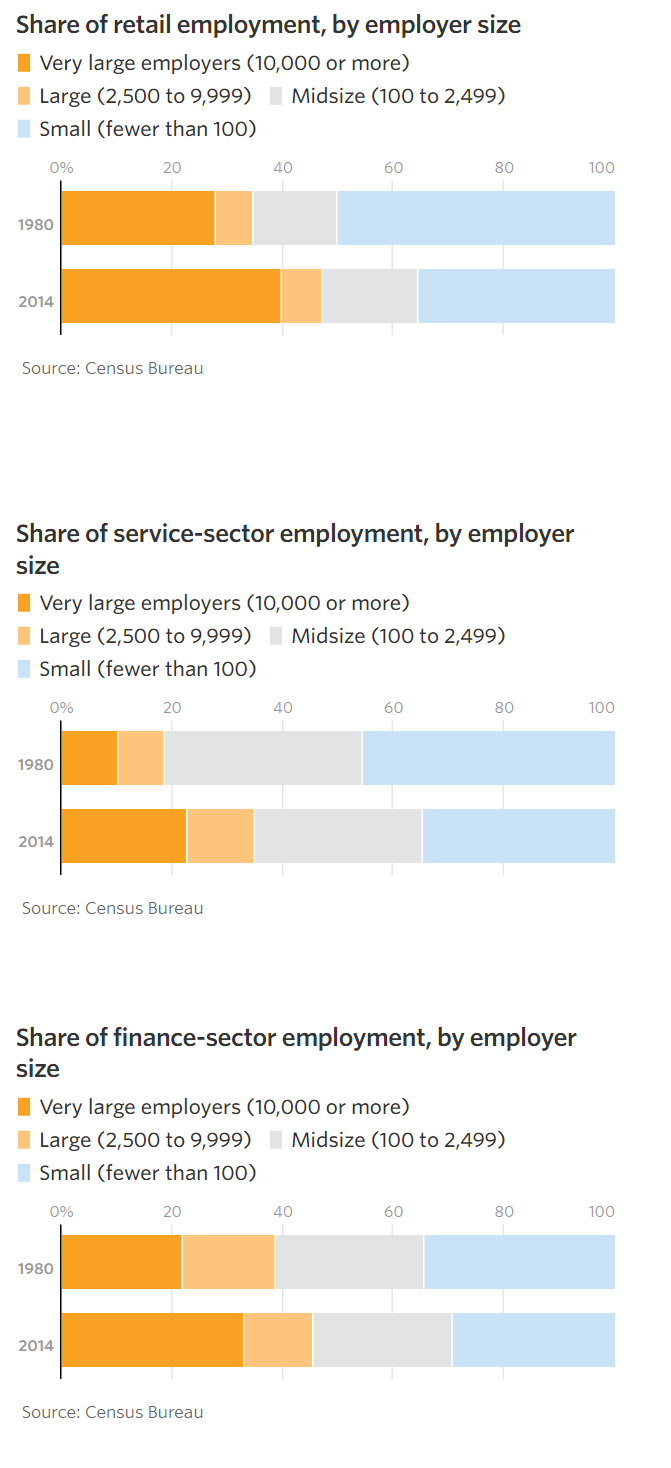
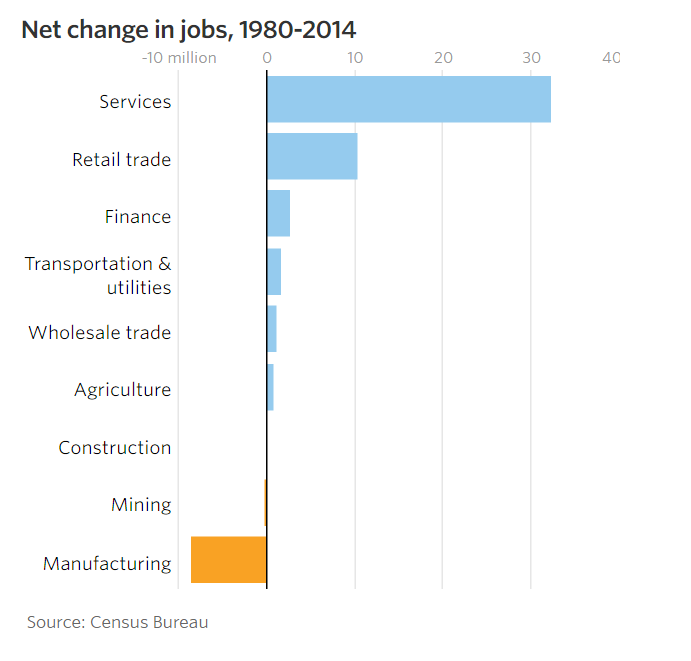
The WSJ articles itemizes the increased concentration of employment in large firms in the retail, services and finance sectors and documents that these are the growing segments of the economy.
Summary (It’s Complicated)
The Business Dynamics Statistics database provides researchers with the consistently defined and reported data since 1977 to document the key role of startup firms in adding net new jobs to the US economy. Startup firms are one part of an ecosystem of firm, establishment and job creation and destruction that plays out through time in relatively predictable ways. The death rates of young, middle age and mature firms play a similarly important role. The growth and decline of new establishments in existing firms matters. The internal job growth rates of young, middle age and mature firms matter. The relatively small size of startups compared to mature firms has an impact on job growth. Historical parameters are generally similar and change slowly, causing the layers of employment by firm age to be similar in this 50-year period. The model and framework for measuring firms, establishments and jobs is solid. Startup firms are essential, but they are not the only driver of success.
“Jobs created by firm size” is similarly shaped by all of these factors which describe the typical firm life cycle. Small firms are not superior job creators. New firms are job creators, and they happen to have small individual employment levels (4 on average), so small firms have higher measured rates of job creation.
In the last 10-20 years there has been a significant decline in the rate of new firm creation as a share of total firms. New firms created have not lost as many jobs due to firm deaths in their first 5-10 years. Mature firms continued to shed a disproportionate number of jobs during recessions, but after the Great Recession began to add more net jobs due to internal growth than they had in the prior 40 years. The overall number of jobs created has remained in the 2-4 million per year range across the 50 years.
The conservative SBA, Kauffman Foundation, WSJ and Republicans promote policies to ensure a thriving entrepreneurial environment for new and small businesses. The more liberal Brookings Institute, college professors and Democrats have an instinctive distrust of big business and concentrated economic power, so also lend support to some pro-small business policies. If job creation falters during periods of economic prosperity, this may be a rare place where bipartisan agreements could be reached to promote new firm and job creation.
Many people complain that the US economy does not create enough new jobs or soon won’t create enough jobs or won’t create enough good jobs or … People worry about employment. Writers and politicians cater to that worry. Fortunately for us, the US economy creates jobs year after year after year, only briefly interrupted by increasingly less frequent and brief periods of economic recession. I’ll share the core numbers on healthy firms and new jobs and provide some context and history which indicates that this is inherent in the modern US economy. The economy is not relying upon any major political change or special insight to continue adding jobs. It just happens.
For 9 straight years, from 2011-2020, across 3 presidential terms and 5 congresses, the US economy added 2 million new jobs each year. In the 1980’s, it added 2-4M per year. In the 1990’s it added 3M per year. In the “oughts”, it added 2M per year. 30 years of expansion, 7 lesser years that averaged more than zero. 4 strong years for every 1 weak year..
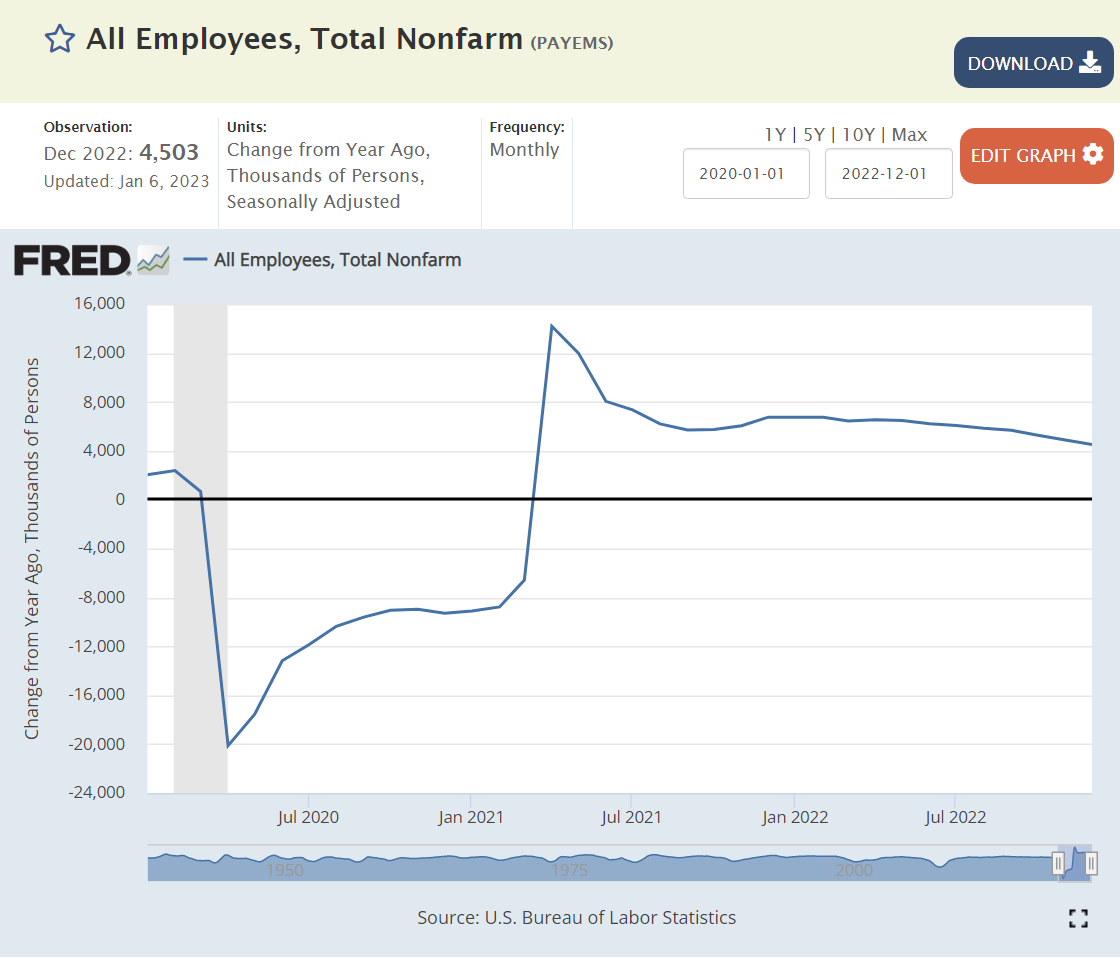
The recovery since the pandemic has been even stronger, starting at 8M new jobs per year in 2021 before sliding to 6M per year and most recently 4.5M per year.
The total number of firms in the US grew slowly in the last 40 years, from 3.5 million to 5 million. The growth rate was much faster prior to the Great Recession (2007-9). Much of this growth was accounted for by single employee firms. Despite this tame 1% growth per year, the economy was able to add more than 2 million jobs per year.
The US economy requires some growth in the number of firms or establishments each year to drive job growth. Fortunately, it does not require heroic growth rates.
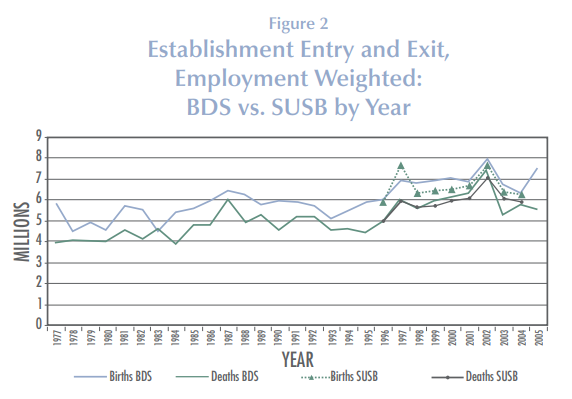
The number of new establishments added per year is remarkably consistent, averaging about 700,000 per year on a base of 5-7M. Of course, this means that the RATE of new establishments is shrinking, from 14% to less than 10%.
Establishment exits have increased from 500K to 600K to 700K before returning back to 600K per year. Big picture, 700K new establishments and 600K lost establishments each year across 4 decades.
Firm deaths have also been consistent at 450,000 per year.
Data calculated from BDS data. Direct graph not available.
Firm births have also averaged about 450,000 per year but present a different pattern. Firm births were much lower in the troubled time around 1980. Births ranged from 450-500,000 per year in the next 25 years. The Great Depression destroyed businesses, access to capital, personal net worth and aggregate demand. Hence, new firm creation dropped back to the 400,000 level. It recovered back to the 450,000 per year rate by 2015. As with firm deaths, the rate has fallen from 14%+ to less than 10%. Most importantly, the birth and death rates have been relatively consistent and have both been relatively flat, leading to a slow increase in the number of US firms.
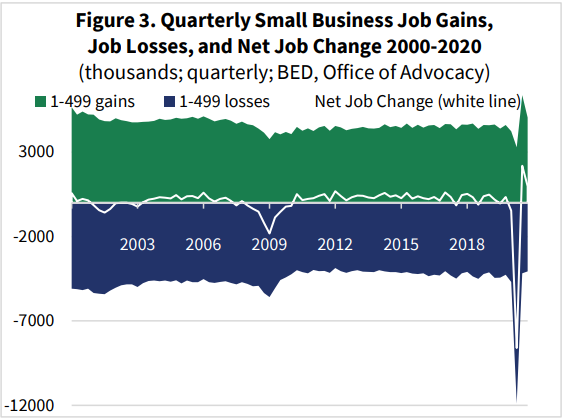
The BDS database shows that job gains and job losses generally move together, but that in a recession job gains fall and job losses increase. This is a very important result. Without active government or policy intervention, the economy creates 12-14M jobs each year and destroys 11-13M jobs each year. There is no guarantee that net jobs will be created in any given year, but overall that is the normal result.
Writers who wish to emphasize the decline of entrepreneurship focus on firms instead of establishments because of the slower growth rate. They emphasize the growth rate rather than the growth numbers because this is less positive. They don’t compare the growth and death rates or numbers, which move together. They focus on the aftermath of the Great Recession which did greatly slow firm creation, resulting in slower than historical numbers and rates of job creation from new firms. Nevertheless, the economy created 2M new jobs per year for 9 years. During that period, existing firms captured a larger than usual share of the job growth required to provide demanded goods and services.
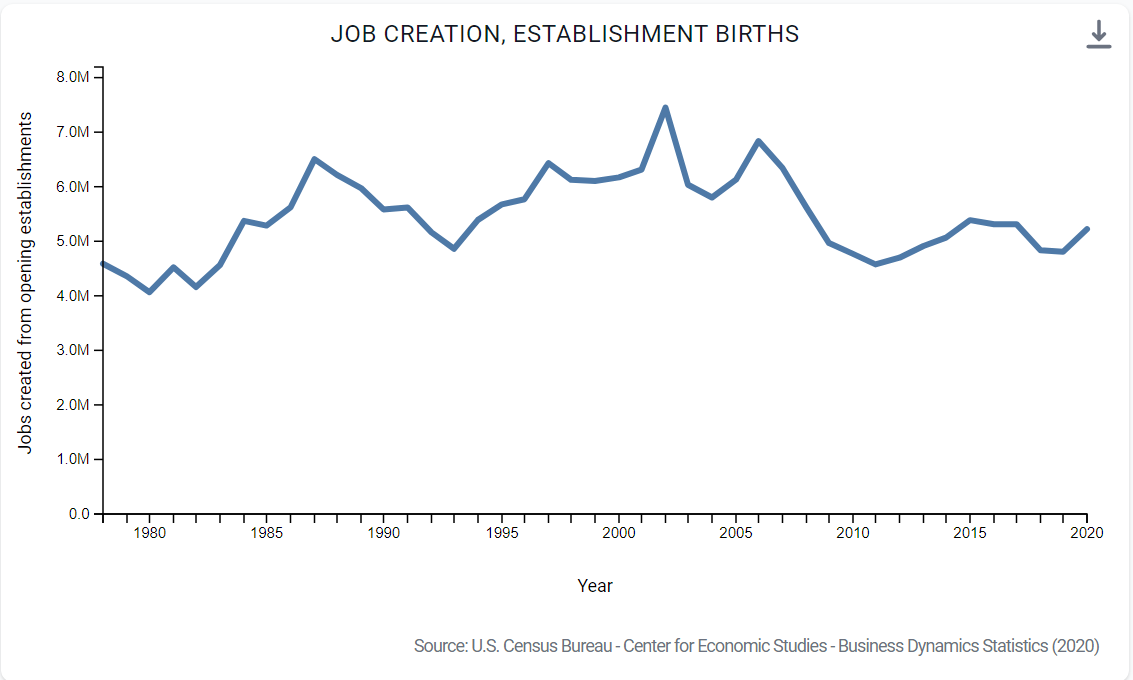
New establishments have driven 5-6M new jobs each year. The late nineties to early “oughts” reported the higher 6M per year figure.
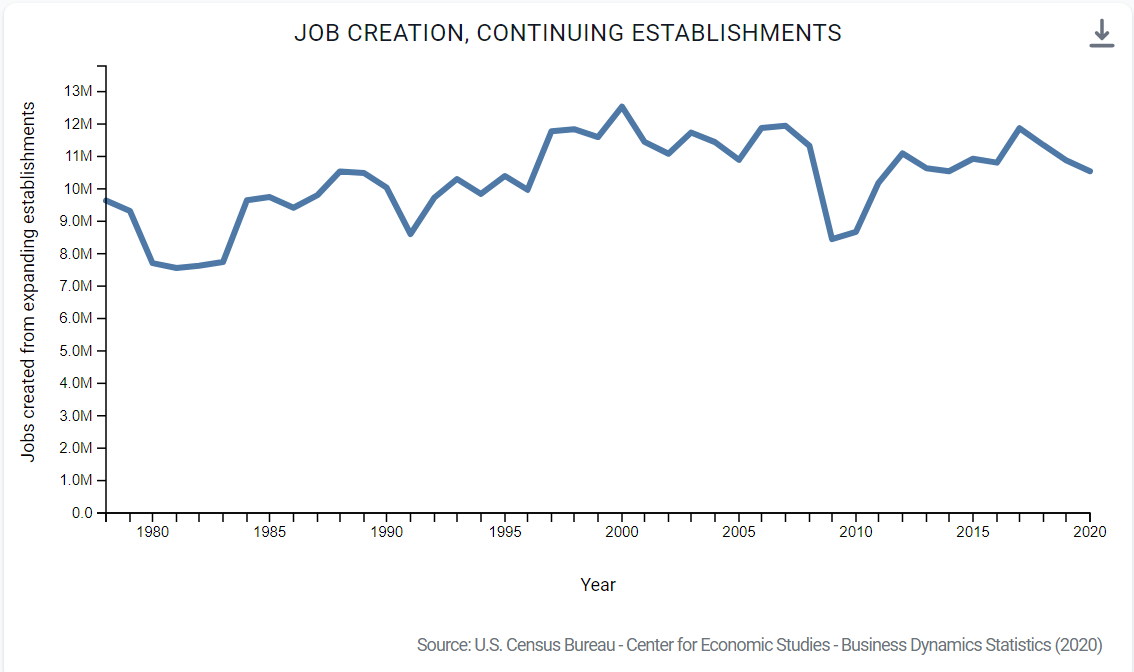
Existing (continuing) establishments have added 10-12M gross new jobs each year.
Establishment deaths (including firm deaths) resulted in 4-5M jobs lost each year.
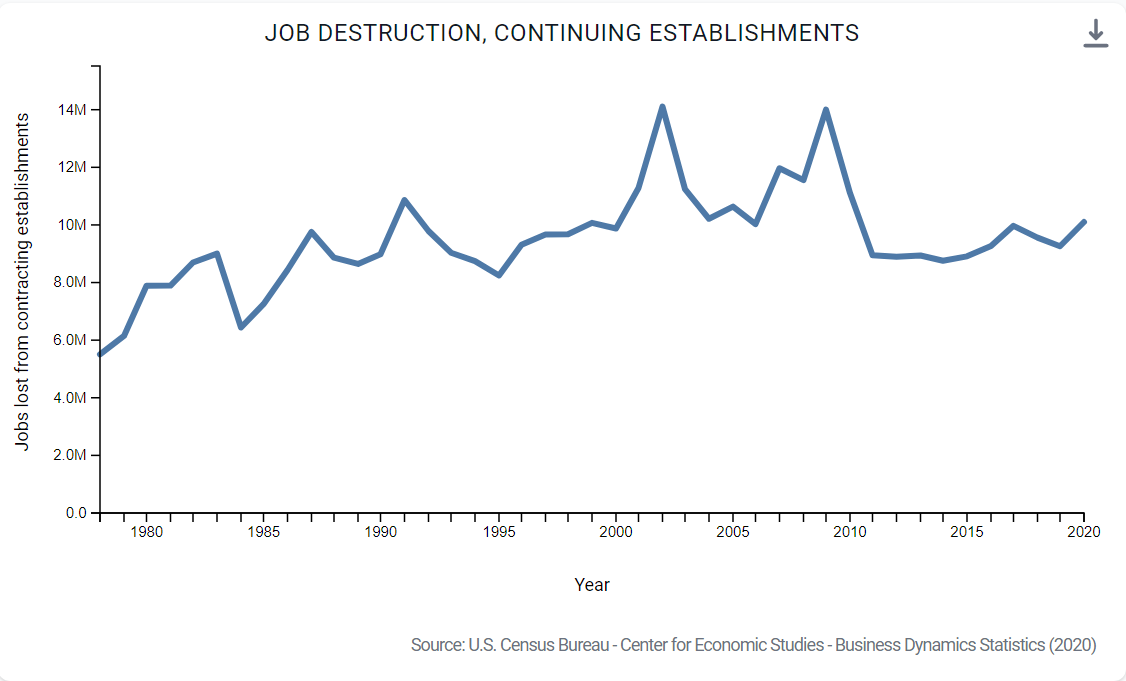
Continuing establishments trimmed 8-9M jobs each year, and many more during recessionary times. Although there are many moving parts, continuing firms eliminate more jobs than they create, especially during recessionary periods when they are adapting to lower demand. Firms die and they close locations, removing 4M jobs each year. New firms and new establishments add the new jobs required to fill the 2M net new jobs each year. This does not happen automatically or precisely, but overall, through time, the pattern is clear.
The US job market has grown from 90-150M positions during the last 40 years.
Firms hire 75M people each year. The typical job tenure is just 2 years.
Separations and hires generally move together. The net 2M jobs added annually is a small fraction of employment, hires, separations, gross job adds and gross job losses.
Establishment births exceed establishment deaths except during deep recessions.
New firms have high failure rates. Fortunately, firms that survive their first year have high percentage rates of new hires. They start with a small number of employees (4) and grow rapidly. The survival rate improves with the age of the firm and the employment growth rate of surviving firms tends to decline as they grow. The combined effect is that 80% of the new employees added by startup firms remain after 10 years. This employment survival rate has been improving in the last 15 years, partially offsetting the reduced number of start-up businesses.
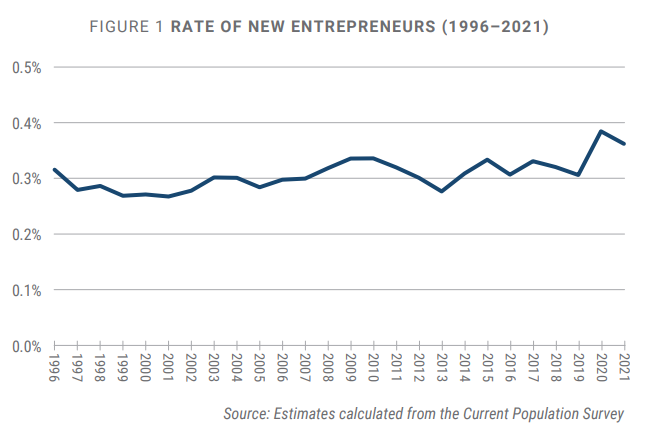
The share of “new employer businesses” dropped after the Great Recession and has not fully recovered.
The number of application for new business tax ids increased significantly after the Great Recession and jumped by 50% after the pandemic.
The Census Bureau also tracks a subset of the total new business applications based upon industry classification that is a better predictor of actual businesses eventually started. This measure shows modest growth after the Great Recession and a 30% spike after the pandemic.
About 10% of new business applications become new businesses. Hence, the rate of new business formation to be reported for 2022 is expected to be very high.
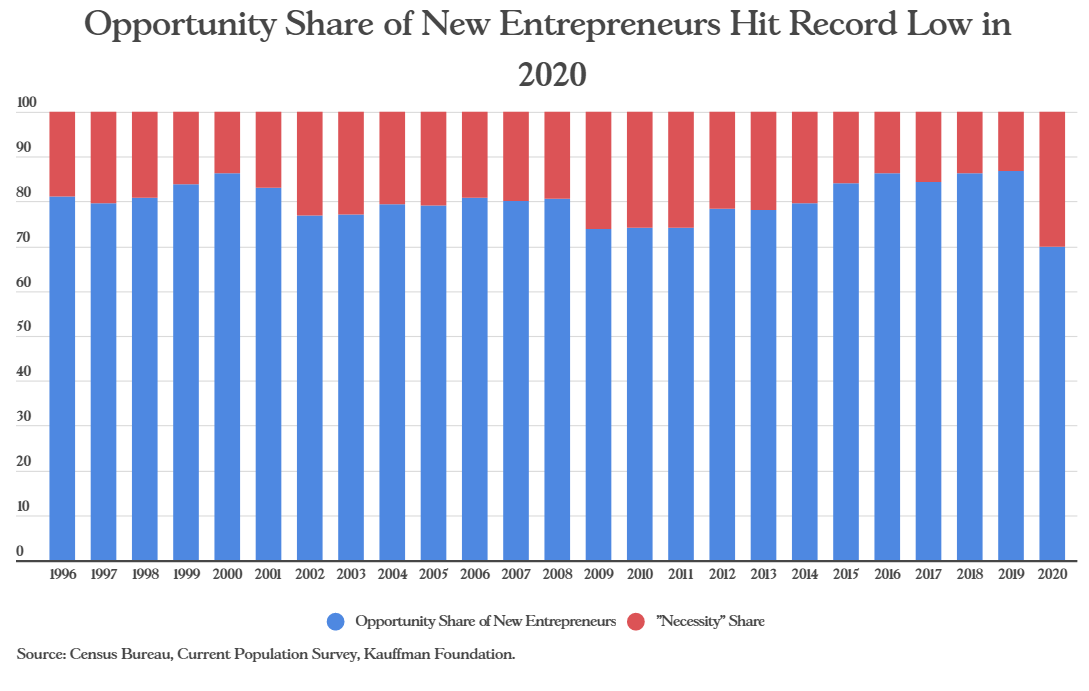
About 80% of new businesses are formed based on opportunity and 20% based on necessity. Kauffman estimates that 2020 business formation was 30% based on necessity.
Summary
The US economy continues to generate 2 million new jobs in each non-recession year, even more in boom periods like the last 2 years. Firms and establishments are born, grow and die. The net employment growth rate for established firms is less than zero in their first 5-10 years and then slightly positive. The annual death rate of existing firms and establishments is relatively low, but on a 150M employee base it is 4M per year. The new jobs added by startup firms and new establishments allow the total number of employees to grow in normal years.
There is no “iron law of employment” that requires new firms or establishments to be created in numbers greater than the job losses. There is no law that requires surviving young firms to nearly offset job losses by young firms that die at a high rate. There is no law that requires mature firms (10 years old+) to add new employees or to die at slow rates. But these results have been consistent or improving for the last 40 years. I look forward to continued success.
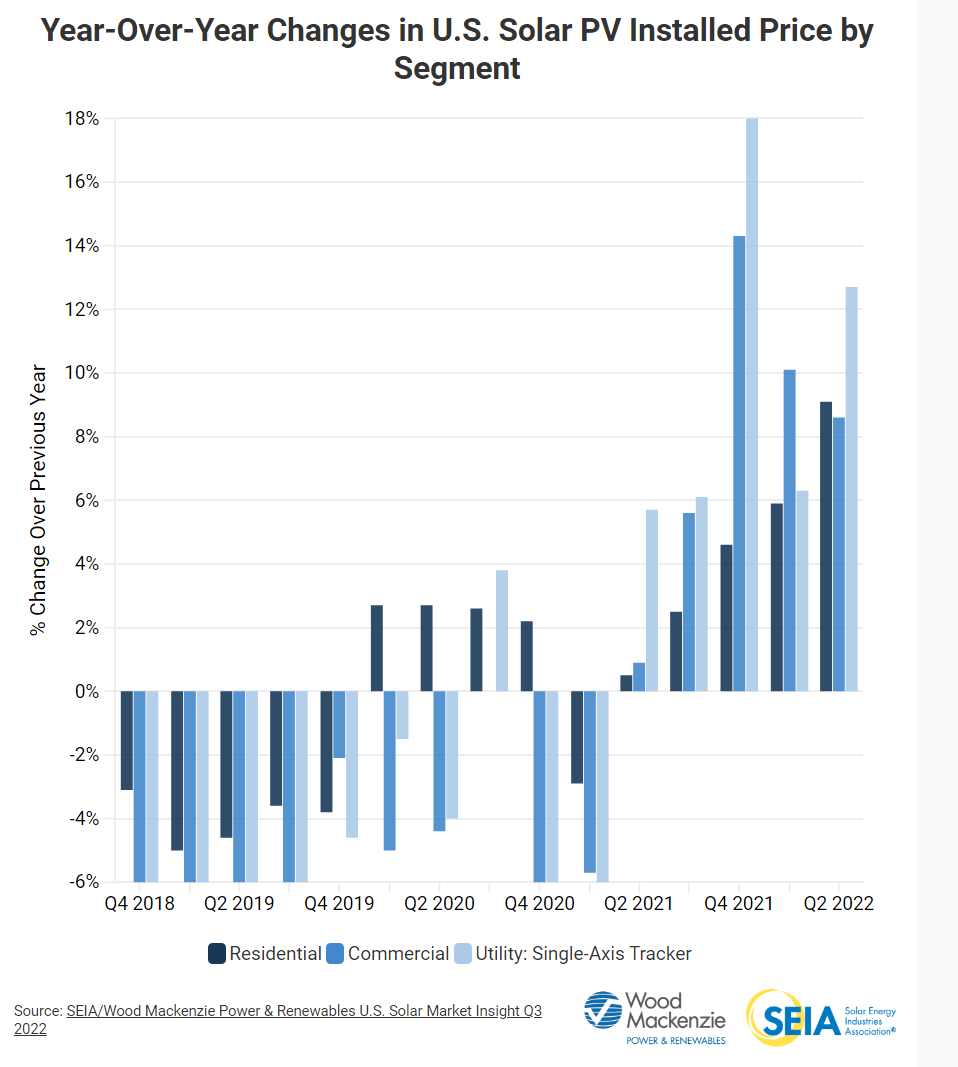
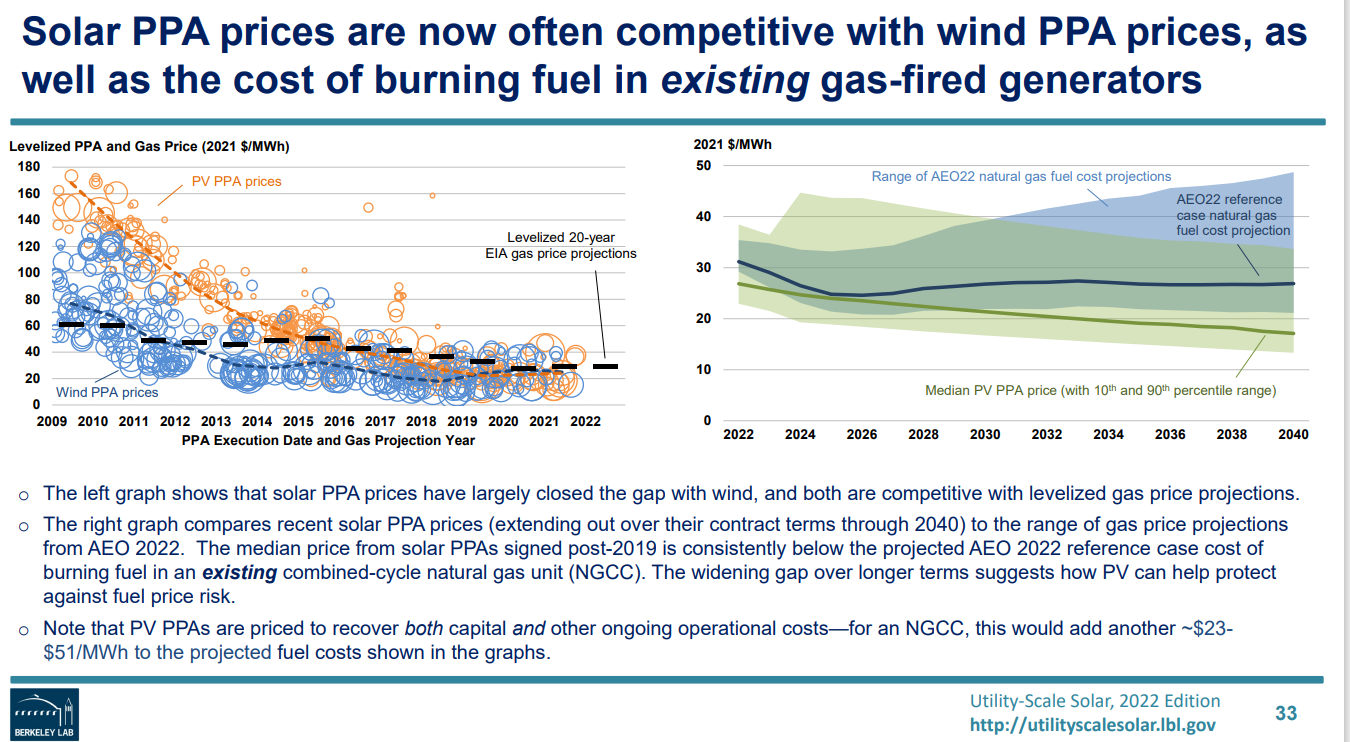
Utility scale photovoltaic solar panel energy generation is the future for the US energy market. The cost structure is already low enough to justify 30-40 year investment projects. Solar projects are 40% of new electricity generation projects, heading towards 50-60%, competing fairly with wind power. Solar power at 4% of the total electricity generating capacity is still relatively small, but the new investments will drive it to 8%, 12%, 16% and 20% in the next 20 years.
This is a follow-up article to my recent post on “A Very Robust Long-term US Labor Market (1970-2021). Rather than focus on total growth or the “skill-level” of jobs in the labor market, I want to focus on the roles or functions (like career clusters, similar to industries) played by the 150 million US workers in 2021. I’ve grouped the 500 detailed occupations into 17 categories so that we can look at subtotals ranging from 1% to 20% of the total, with an average of 16%. Enough detail to highlight the very significant changes in the last half-century.
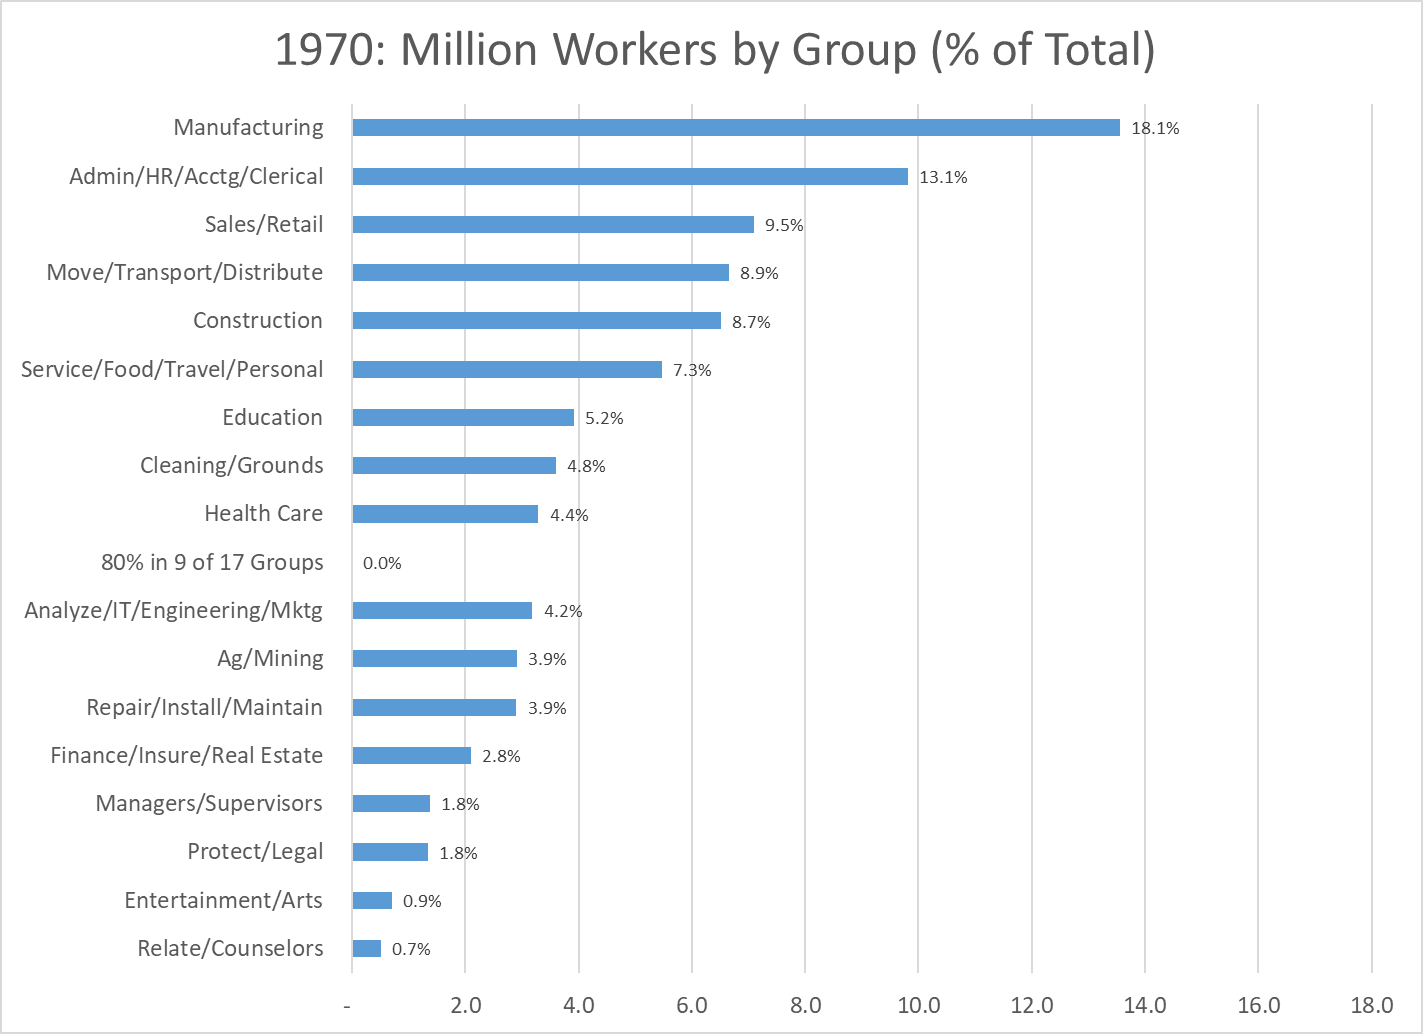
Let’s start with the 1970 data. 75 million employees. Manufacturing was the “big dog”, with almost 14 million workers, 18% of the total, a little less than one out of five.
Administrative workers, including clerical, HR and accounting staff at all job levels were the second largest group, with 10 million people and 13% of the total, one out of eight jobs. These two traditional categories accounted for 31% of the total, not quite one-third.
The next three groups each accounted for 9% of the total, one of every eleven employees. Sales workers, at managerial, professional and retail/clerical levels. Members of the logistics industry broadly defined, including both transportation and distribution staff. Employees of the construction industry. Once again, classic job functions in 1970 that would have been familiar in 1930.
The narrowly defined “service sector”, combining staff in the food service, travel and personal services industries contained 5.5 million workers, or 7% of the total. These six together included 70% of all workers.
Six other categories were each a much smaller 4-5% of the total: Education (KG-post secondary), Cleaning and Groundskeeping, Health Care, Analysis (finance, IT, operations, engineering and marketing), Ag/Mining and Repair/Installation/Maintenance.
The final five categories each averaged just 1.5% of total jobs: Finance/Insurance/Real Estate, Managers/Supervisors, Protection/Legal, Entertainment/Arts and Relating/Counselors.
By 1970 production agriculture had already declined to an immaterial share of the economy. The historically male and blue collar dominated Manufacturing, Logistics, Construction and Repair categories combined to account for 40% of all jobs; two out of five. The historically more female friendly Administration and Sales functions held 25% of all jobs, one in four. Education was the largest “information industry” at 5%, largely dominated by traditional elementary and secondary school teachers. A more broadly defined service group of food service, travel, personal service, cleaning/grounds and health care summed to 17% of the total, or one in six jobs.
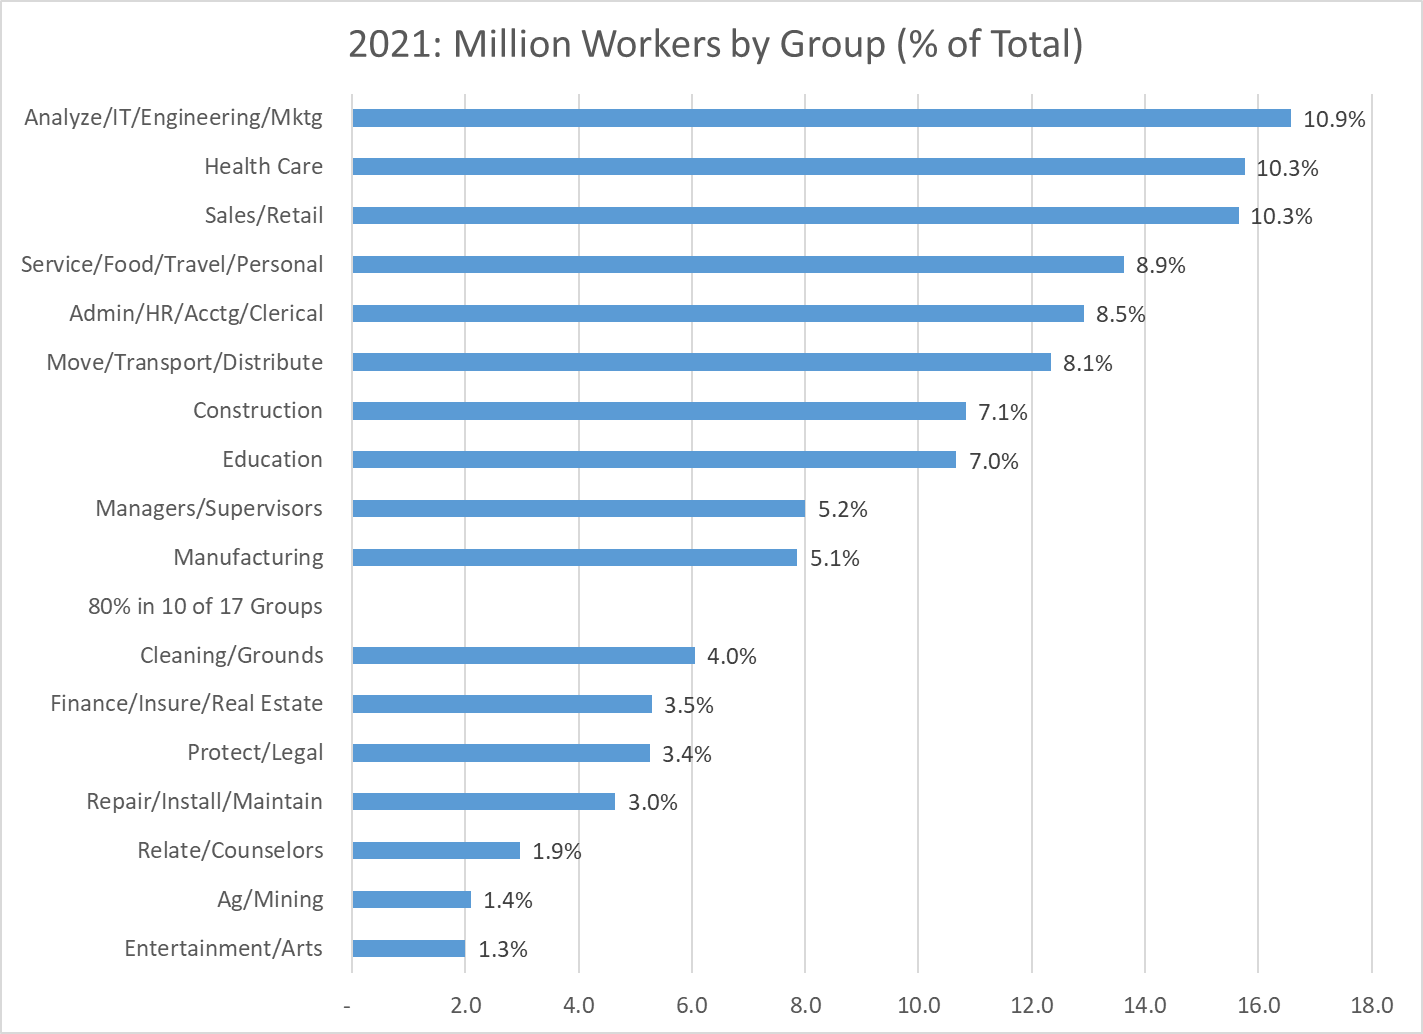
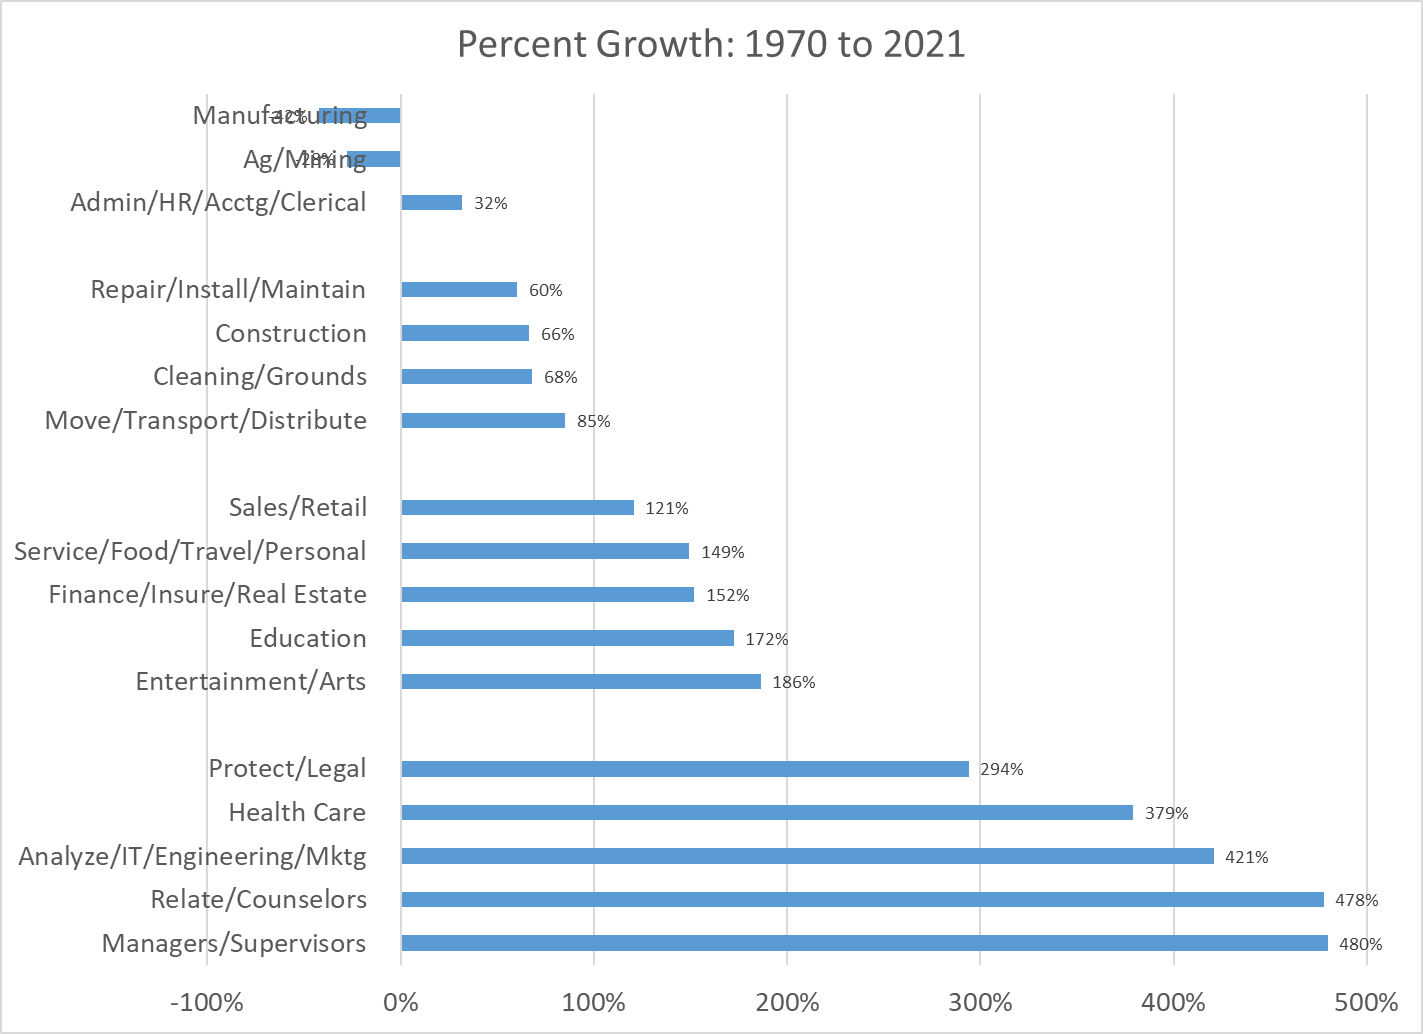
Six categories changed very significantly between 1970 and 2021. Manufacturing dropped from first place to tenth place, from 18% to just 5% of employment, from 14 to 8 million employees. US firms improved labor and overall productivity throughout this period, keeping the most productive firms and factories open, while closing and outsourcing work from the others. This was a tremendous change in the labor market, completed in just two generations of workers.
The Administrative category also declined markedly, from second place to fifth place, shrinking from 13% to less than 9% of total employment, but increasing slightly from 10 to 13 million staff. Process, computer and telecom changes drove improved productivity. Some administrative jobs were outsourced. While the Manufacturing sector lost two-thirds of its labor market share, the Administrative sector lost one-third.
The Ag/Mining group was the third losing category, dropping by nearly two-thirds from 3.9% to 1.4% of all employment. When politicians talk about “reviving” manufacturing, mining or production agriculture they are working against very strong long-term trends.
The largest growth was in the “Analysis” category, which grew by two and one-half times as a share of the total, from 4% to 10%. There was incremental growth in the existing Engineering sub-category, adding 2 million roles. The IT category grew added almost 6 million roles from a base near zero. The operations, finance, marketing analysis group added another 6 million positions to its base of 1.5 million. The “Analysts” category rose from tenth place to first place as firms became more complex and found ways to better employ the talents of individuals with high level analytical skills. At 11% of the economy, one out of every nine jobs falls into the analysis category.
Health Care increased from ninth place to second place, moving from 4.4% to 10.3% of all jobs (2.5X). The number of jobs grew by 13 million, from 3 to 16 million.
The Managers/Supervisors category climbed from fourteenth to ninth place, rising from 1.8% to 5.2% of the economy, adding almost 7 million jobs. The 1970 detailed coding was somewhat different from the modern approach, with many supervisors and managers grouped with other professions or industries. My best guess is that on a comparable basis, the 1970 category would have been closer to 2.5 million than the reported 1.4 million managers and supervisors. This would have put this group in thirteenth place in 1970. Hence, the growth as a share of the total market would be smaller, from 3.3% to 5.2%, but still quite significant. Once again, larger firms with more complexity demanded more managers and supervisors.
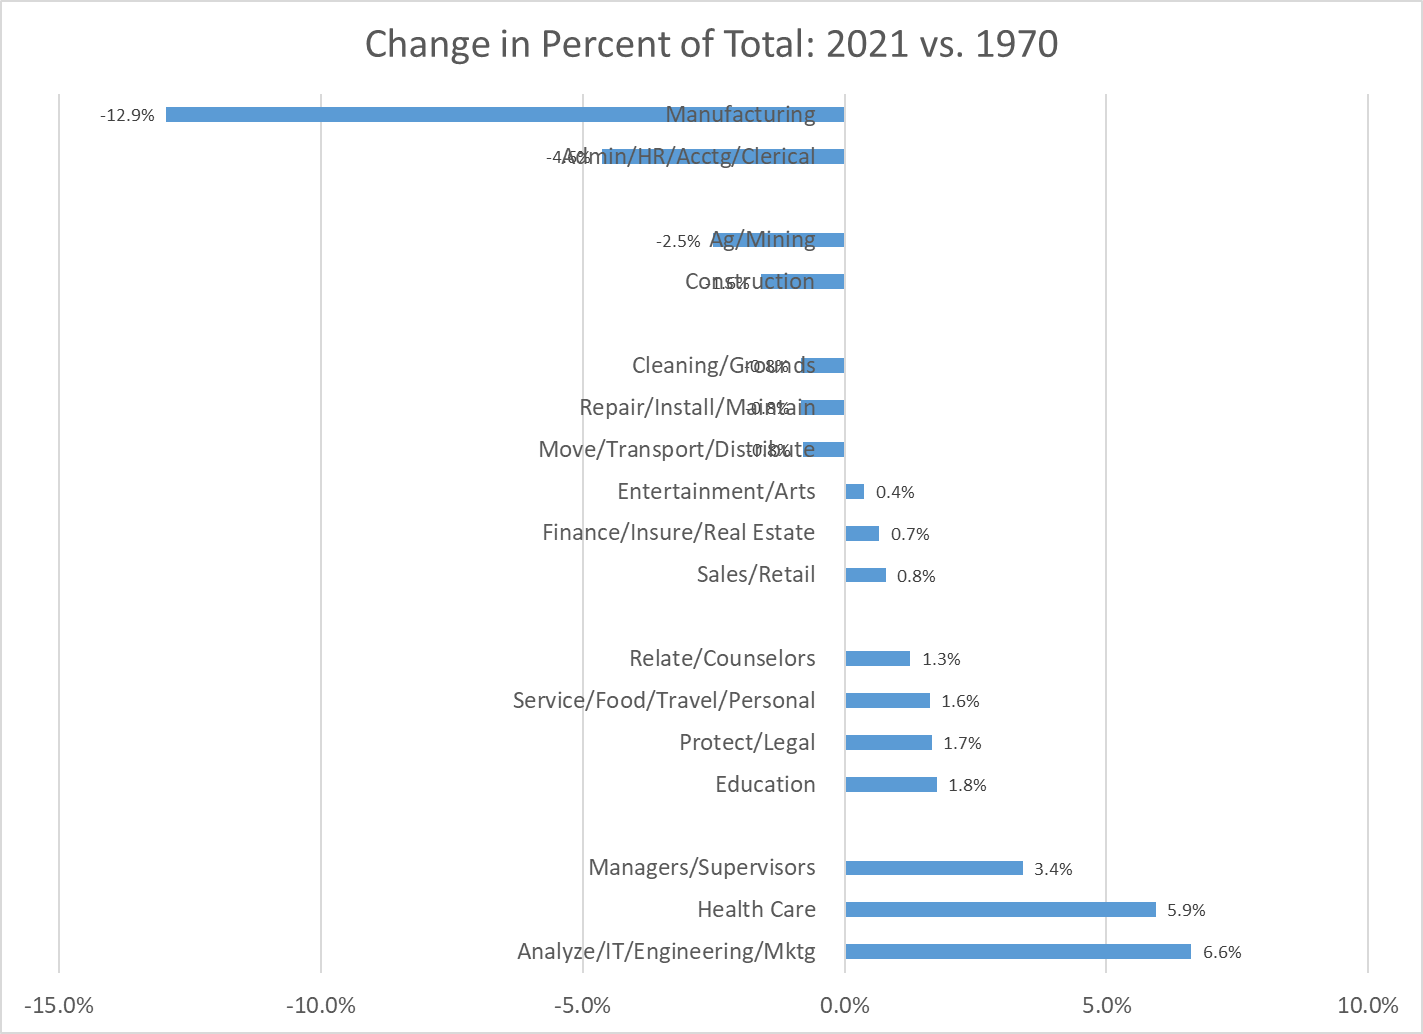
In total, we have 20% (1/5 workers) leaving the Manufacturing, Administration and Ag/Mining sectors and 16% (1/6 workers) joining the Analysis, Health Care and Managers sectors.
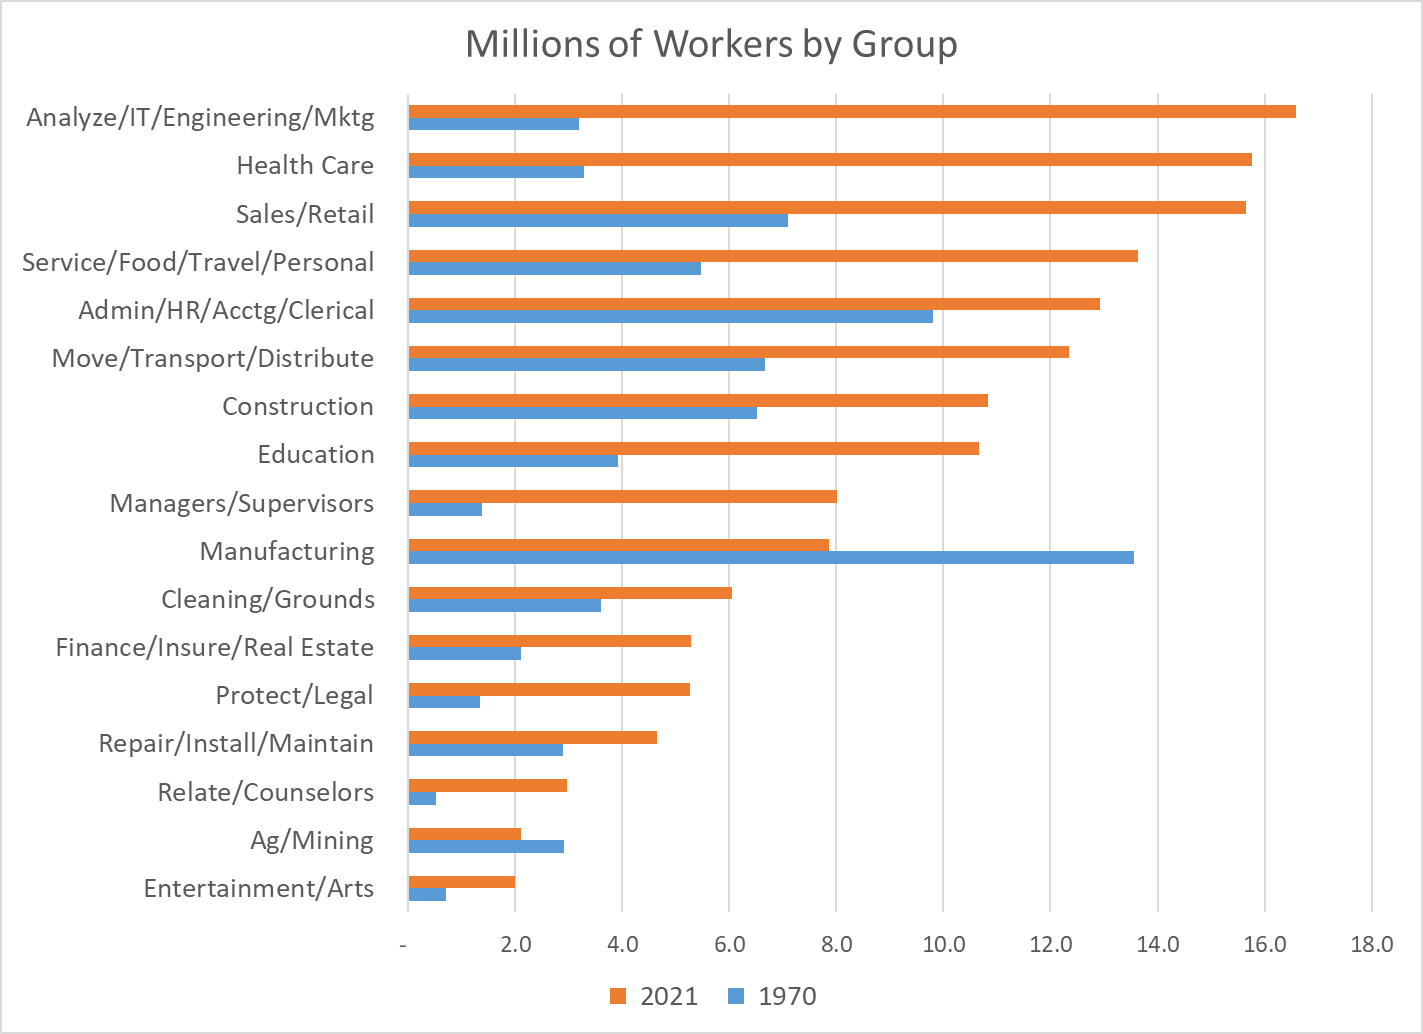
Comparing the millions of employees in 1970 to 2021 by sector clearly shows the massive changes in the labor market. The Health Care and Analysis sectors leapt from a small 3 million workers each to 16 million workers each. Manufacturing fell in absolute terms from 14 to 8 million workers. The Sales and Service sectors began as large sectors, so their relatively normal growth still added about 8 million roles each. Construction and Administration began as larger sectors and were able to add 3 million employees each, despite slower than average growth rates. Logistics grew slightly slower than the market, but added 6 million workers. Education grew faster than average, adding 6 million colleagues.
Relative growth rates as a percentage of the 1970 base or as a percentage of the total mostly tell the same story. Manufacturing, Administration and Ag/Mining have declined sharply. Analysis, Health Care and Management have grown materially.
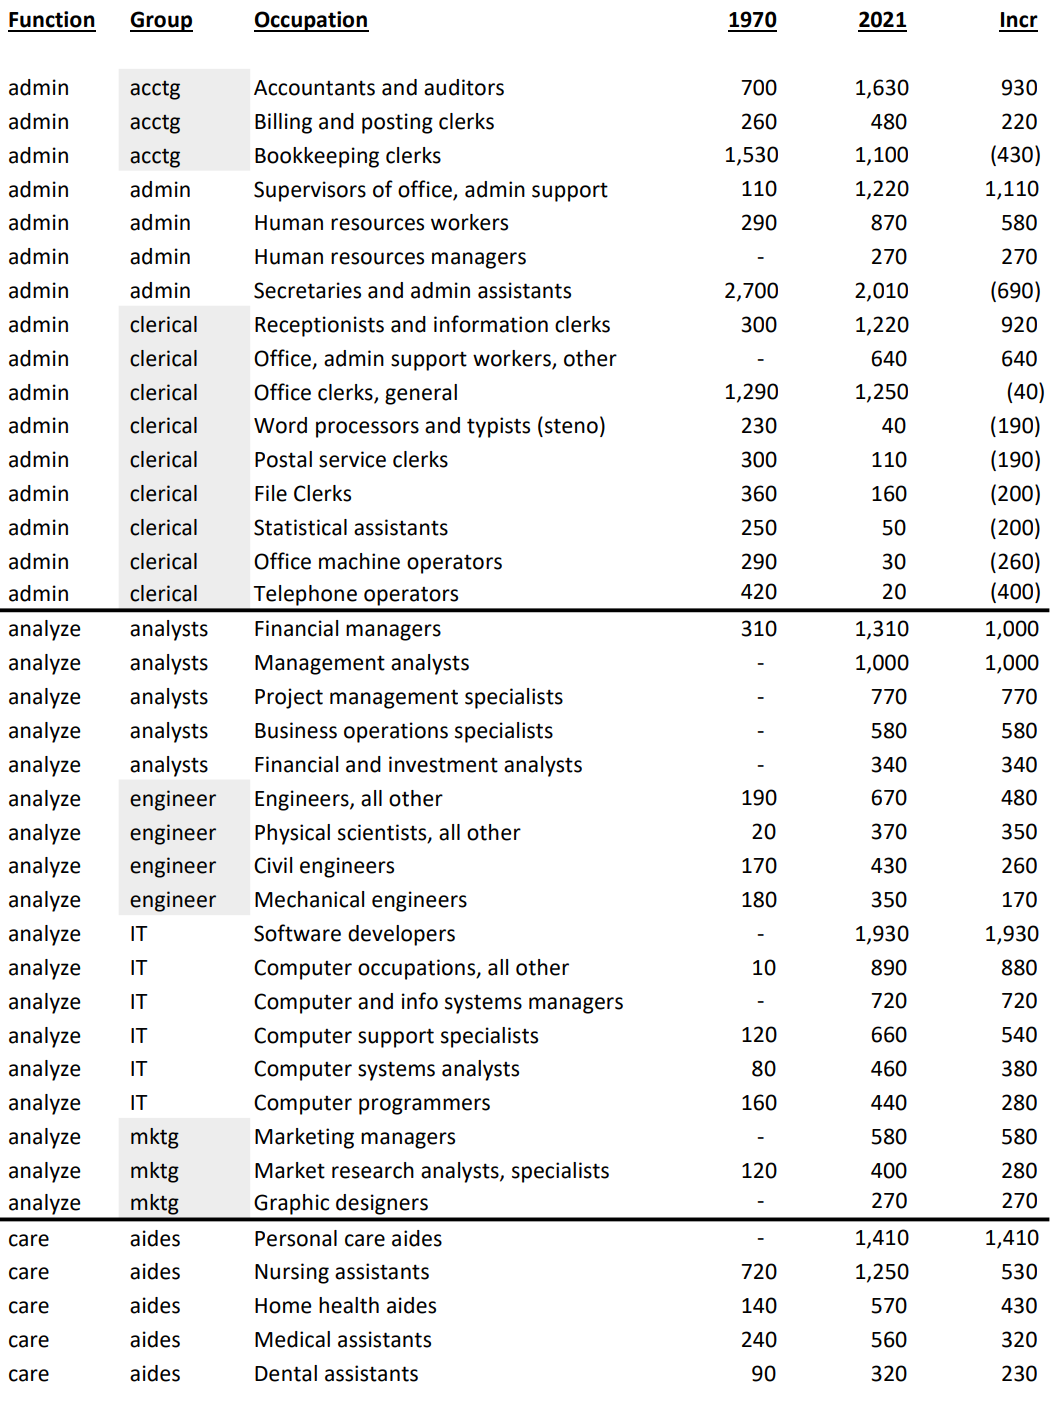
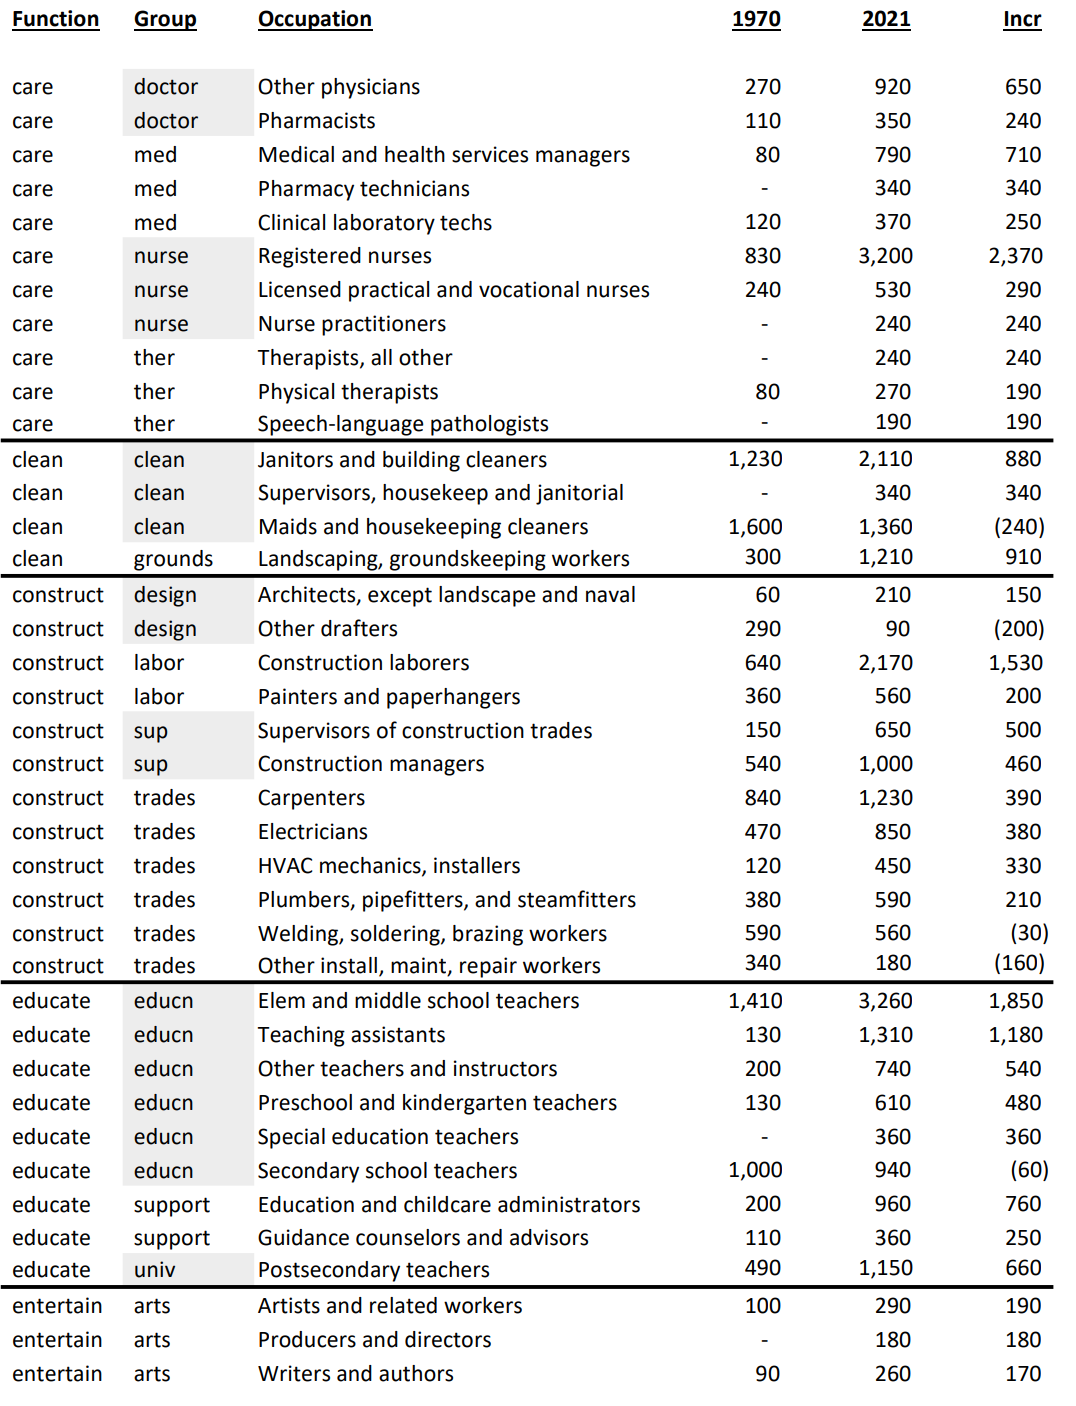
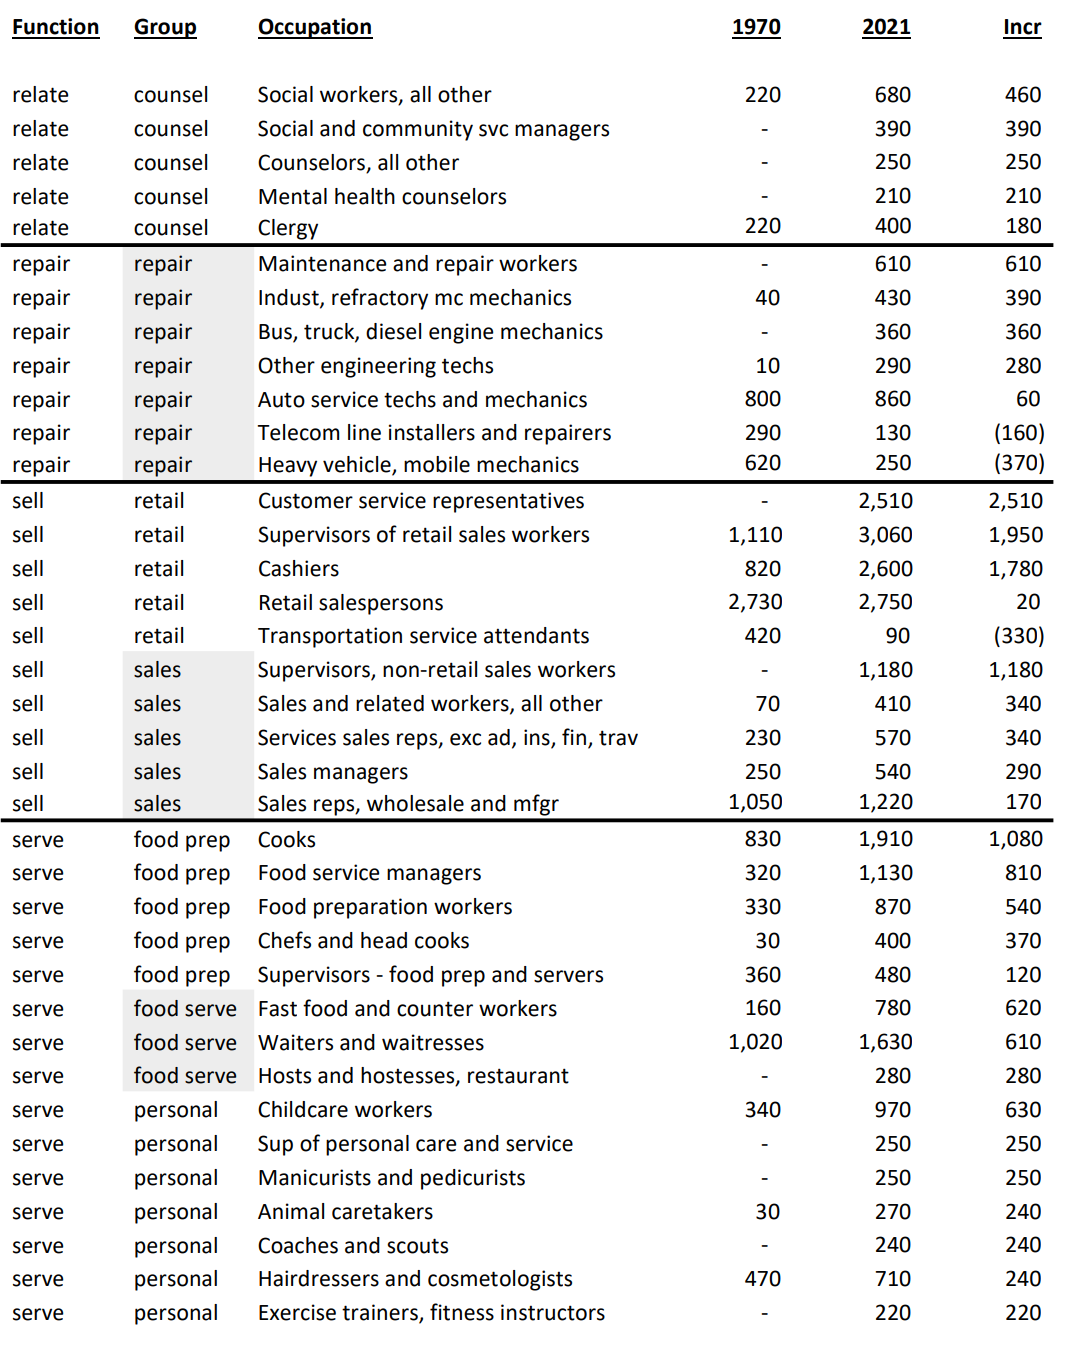
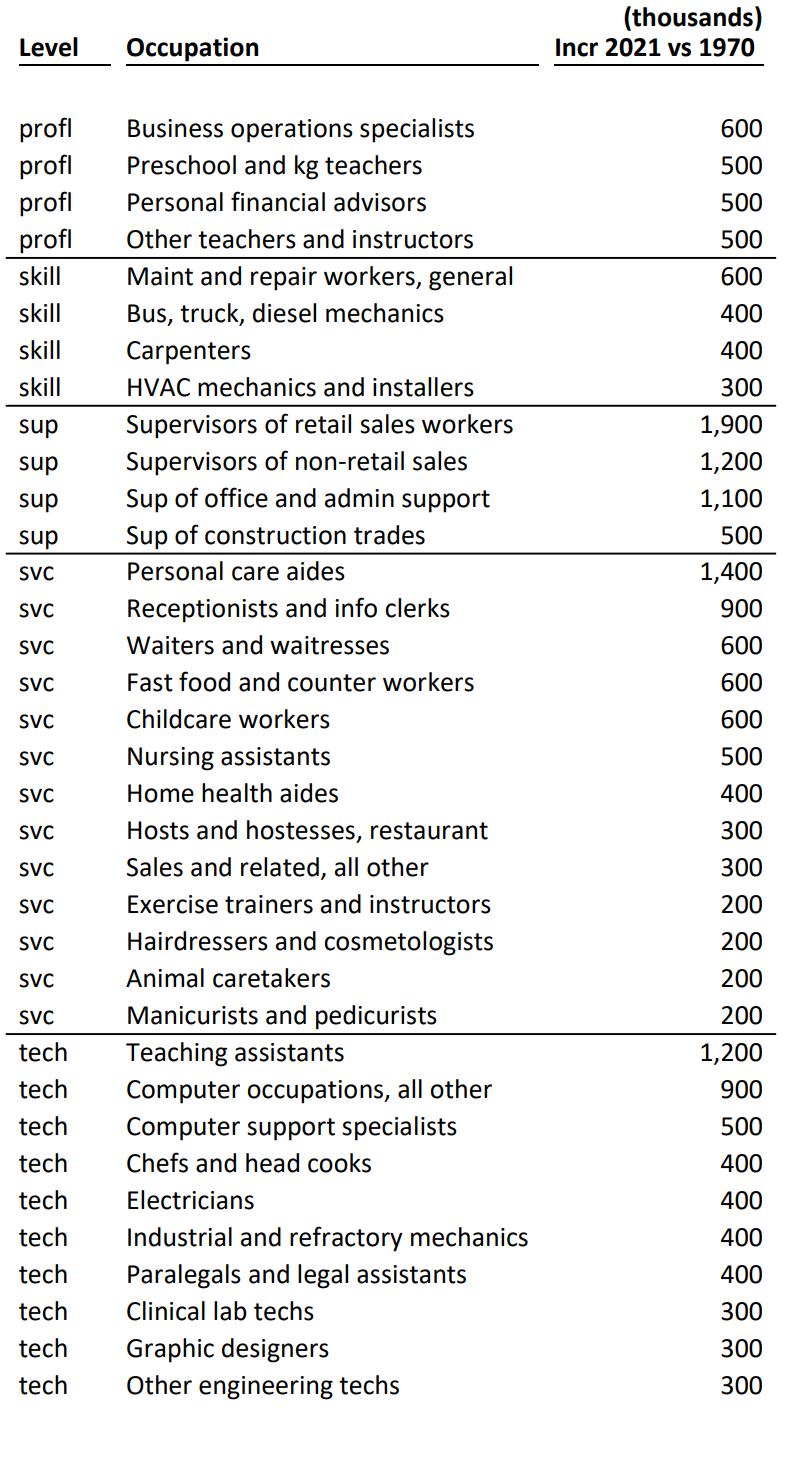
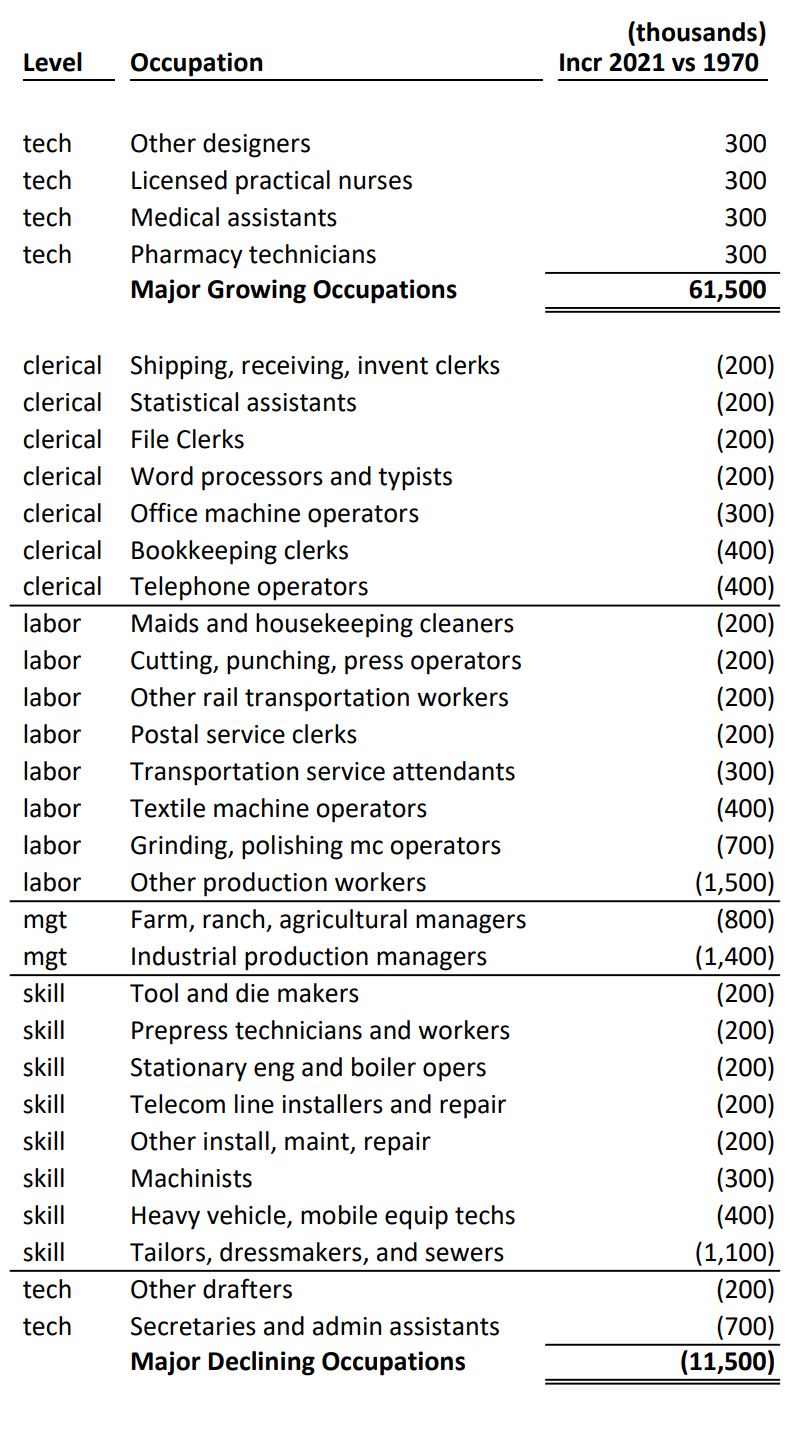
The 152 largest detailed occupations and those with the greatest change in employment are documented below. They account for 91 million jobs, 59% of the 2021 total.
Economists assert that the principles of comparative advantage drive national economic activity. In essence, nations, firms and individuals rationally do what they are “relatively” best at, which changes through time. We see this reduction in the role of agriculture, manufacturing and mining across long periods in the US.
Economists assert that consumers’ tastes change as they have higher income and the relative prices of goods change. Once basic “food, clothing and shelter” needs are met, people turn to other “needs” and “wants”. These tend to be “services” and we also see this transformation.
Economists assert that profit maximizing firms will employ labor that provides a return on the investment based on the marginal or incremental value added by the labor resource. In a more complex economy, professional and managerial skills are in greater demand. Firms (and not-for-profits and governments) have adapted very well to these major changes in the last 50 years.
These changes are not without major pain to individuals, firms and local economies. The general trends in the economy (more automation, greater trade/outsourcing, more services, more personal care, greater role for analytical skills) are clear. Nations, firms, individuals and regions that adapt to the trends will be relatively successful. This requires wise individual and political choices and investments.
A Dozen False Claims of Journalists, Analysts and Pundits
Job growth is too slow, there are not enough jobs.
All of the good jobs are gone, there are fewer good jobs.
The only growth has been in “low wage”, service jobs.
There are no “blue collar” jobs, no “hands-on” work is available today.
Jobs are all “dumbed down”, no real content remains.
Automation, computers and artificial intelligence are eliminating all jobs.
There is no room for advancement at work.
The economy is inherently stagnant, firms are unable to create new positions.
We’ve become a nation of shopkeepers.
There’s no hope for millennials in the job market, Boomers are leaving a disaster.
More and more jobs are subject to the “imposter syndrome”, they really do nothing.
This time is different, we have reached the “end times” for jobs.
The Data Says …
The US Census Bureau and the US Bureau of Labor Statistics attempt to measure the detailed occupations in the evolving US labor market. I have selected 1970 as a baseline because it is effectively prior to the “computer revolution” and within my lifetime of observing the labor market. The US economy was still essentially in the post WWII boom period with manufacturing clearly the most important industry in 1970. Prior to Japanese or Chinese competition. Prior to the “energy crisis” and environmental concerns. Prior to improved social, political and economic opportunities for women, racial and other minorities.
We had 153 million people working in the US labor market in 2021.
The total measures and the detailed measures are somewhat inconsistent between 1970 and 2021. But, they are adequate to make basic comparisons. The labor force doubled in 50 years. 75 million new jobs created! 15 million new jobs each decade. 1.5 million new jobs each year, on average.
The detailed occupation categories have also changed. The 500+ categories in 1970 are very different from 2021, but the basic measures are roughly consistent. I have mapped the 1970 categories onto the 2021 categories. In 1970, the “undefined” responses were in the 10% range and not reallocated back to the detailed occupations as is done currently. Self-employed individuals were measured differently. Managers and supervisors were measured differently. The current definitions are better aligned with the current jobs. The 1970 categories provided much more detail on the manufacturing sector.
Employment by Job Level
Total employment more than doubled.
The highest level “manager/supervisor” jobs category nearly tripled. 18 million manager/supervisor jobs were added between 1970 and 2021. In 1970, there were 10 million manager/supervisor jobs; 13%, or one out of every 8 positions. The newly added positions are 24% of the labor force in 1970. The 28 million current manager/supervisor roles are 37% of the total 1970 work force. Opportunity, indeed. In 2021 terms, manager/supervisor roles are 18% of the work force, more than one of every six positions.
Professional jobs (college degree plus required) also tripled, growing from 14 to 41 million, an increase of 27 million new jobs. This increase is 36% of the 1970 work force. The manager, supervisor, professional subtotal is 23 million in 1970 (31% of the total). It has grown to 69 million (3X) in 2021, reaching 45% of the labor force. The number of “premium” jobs tripled, while the share of “premium” jobs increased by almost 50% in this half-century. Good news, indeed.
“Skilled” labor jobs were flat across 50 years, declining as a share of total jobs by one-half, from 10% to 5% of the economy. However, their neighbor, technical jobs, increased faster than the economy, adding 10 million high quality positions. The combined skilled labor (trades) and technician/technical level positions increased from 15 to 25 million, overall. This two-thirds growth is slower than the overall labor market’s doubling. Hence, this job level decreased from 20% to 16%, or from one in five to one in six positions. This is a “glass half-full or half-empty” situation. The 14% of the total labor market growth for premium positions is offset by a 4% decline in middle skilled positions, resulting in a 10% increase of combined middle and premium positions as a percentage of the total.
Lower skill level jobs accounted for nearly half of all jobs in 1970; 37 of 75 million. They comprised a decreased 39% of the total in 2021, 59 million out of 153 million. A smaller share of “lower skill” jobs seems like progress. Yet, even here, we have a growing labor market, with 59 million jobs in 2021 versus just 37 million jobs in 1970; 50% more.
The “physical labor” category grew from 22 to 32 million jobs, but it declined from 30% to 21% of the work force. Relatively fewer jobs, absolutely more. The clerical workforce encountered a similar, but less extreme change, growing from 11 to 15 million jobs, but declining from 14% to 10% of the work force. The “service sector” grew twice as fast as the overall economy, increasing from 4 to 12 million jobs and from 6% to 8% of all jobs. The “service sector” is growing disproportionately, but it is a relatively small part of the overall economy, just 8% of the total in 2021.
In total, the lower skilled clerical, labor and service groups combined, grew from 37 million to 59 million positions, but declined from 49% to 39% of all jobs. I see this as progress and look forward to the next half century reducing this category to just 30% of all US jobs.
At the detailed level, we have 70 occupations driving 62 million new jobs, 82% of the 1970 base. We also have 27 occupations experiencing a 12 million jobs loss, 15% of the 1970 base. Joseph Schumpeter’s “creative destruction” model of a dynamic economy is validated. Changes in demand and technology eliminated 12 million jobs, 15% of the total, across 50 years. The US economy is capable of permanently destroying and replacing a quarter million positions each year, about one-fifth to one-third of one percent of total employment.
Let’s go back to the dozen negative claims. Is there support in the details? Are there “good” jobs being destroyed? I only see declines due to “natural causes”: improved IT, telecom, process/quality/manufacturing, international trade, railroad, textile automation/imports, ag productivity, printing and DIY office options.
On the upside, what do we see? Management and supervisor roles growing in all areas in a more complex environment with higher sales volume, more products, faster product introduction, more exports, more outsourcing of functions, greater customer demands in all dimensions, global sourcing and competition.
Technology supplemented/infused positions at all levels. Cashiers, customer service reps, distribution employees, tellers and drivers today leverage IT systems and processes.
Increased specialization/technical skill in many service/technical areas. Retail terminals. WMS. HRIS. EDI. Customer service scripts. Web based transactions.
Increased professional skills, sophistication and impact in all areas.
More professional teachers, nurses, analysts, accountants, lawyers, HR, real estate and financial advisors.
Diverse technical computer, automation, lab, design, legal, teaching, culinary and design technical positions.
More medical, food service and personal care service roles.
Summary
In the last 50 years the US labor market has doubled in size and added an increasing share of managerial/professional/technical positions.
In my next blog, I’ll focus on the next level of detail: 17 categories of the US labor market.
It’s time to revisit the state of the US economy. The media and stock market are overreacting to the positive news today that the US economy added about 250,000 jobs in September. Pundits and investors deem this as a “too hot” labor market which will drive higher inflation and force the Federal Reserve Board to further increase interest rates to slow the economy. We need to look at history, components of the economy and specific measures carefully to evaluate our position.
In a nutshell, the US Congress and President spent so much to offset the pandemic that we have classic inflation from higher demand and lower supply. At the same time, the Fed increased the money supply and lowered interest rates to zero to ensure that the banking sector did not provide a “credit crunch” to businesses or households. Foreign governments and banks acted similarly. This allowed the world economy to work through the pandemic with minor negative effects. However, the boost to the economy was too much and governments and central bankers were slow to reduce the stimulus they provided. The world was tightly focused on “recovering” to the pre-pandemic GDP and employment levels during 2021, so major changes in government spending and the money supply were not implemented until near the end of 2021. By the start of 2022, it was clear that growth was unsustainable and inflation was rising quickly, so policy makers needed to adjust. They have now done so and the impacts can be seen. So far, the economy is slowing, official recession or not, to low/zero growth and looks to remain at that level through the end of 2022 with low/slow growth expected in the first half of 2023.
We can call this a “soft landing”. We can call this a “growth recession”. We can call this a “recession” or a “recessionette”. There is no evidence of a “major recession” with 2% GDP declines or 3% unemployment rate increases or “50% declines” in housing starts or bank lending freezes or massive industry balances to liquidate or … Inflation is high and seems to have peaked. It is not coming down as quickly as most experts (or me) predicted during the first half of 2022, but many factors indicate that we are not in a self-perpetuating inflationary spiral.
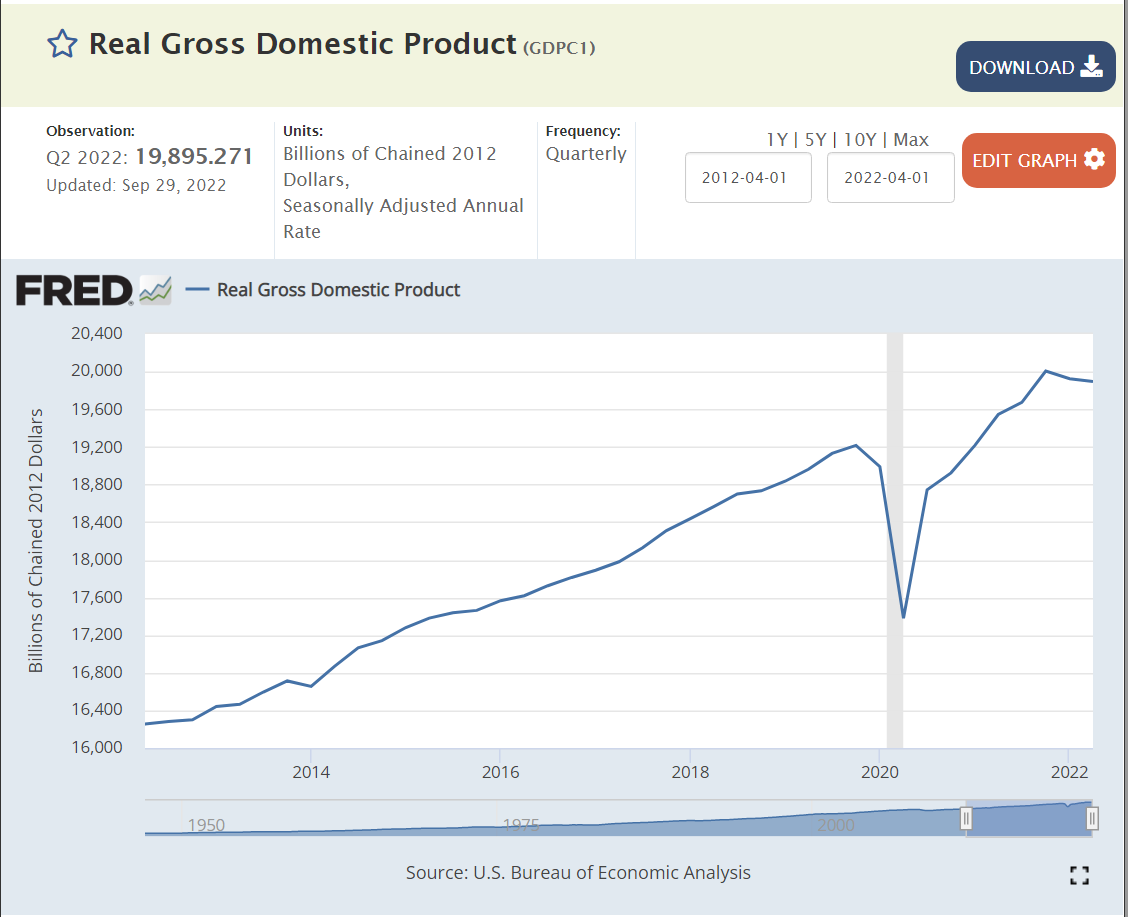
With the benefit of hindsight, real GDP growth during 2018-19 was somewhat above trend and unsustainable. A 2% excess output doesn’t seem like much, but it does matter. The economy at the end of 2021 was in roughly the same place with 3.5% style unemployment. 4Q, 2021 was more than $1 trillion higher (5%) than 4Q, 2020. 5% real annual economic growth is very rare for a large, modern, developed economy. This was after the immediate pandemic bounce. The 3rd and 4th quarters of 2022 are likely to be reported as essentially flat with the 2nd quarter. Consensus forecast is near zero growth in the first half of 2023, returning to 2-3% growth in the second half.
US government budget deficit will be $2 trillion lower in the fiscal year ending September, 2022. This is good news. The “excess” spending was capped more than one year ago, so the trend rate is part of the current core economy. “Excess government spending” is not driving inflation today. It contributed to the inflationary build-up during 2021 into the first half of 2022 (economic stimulus works with a lag effect).
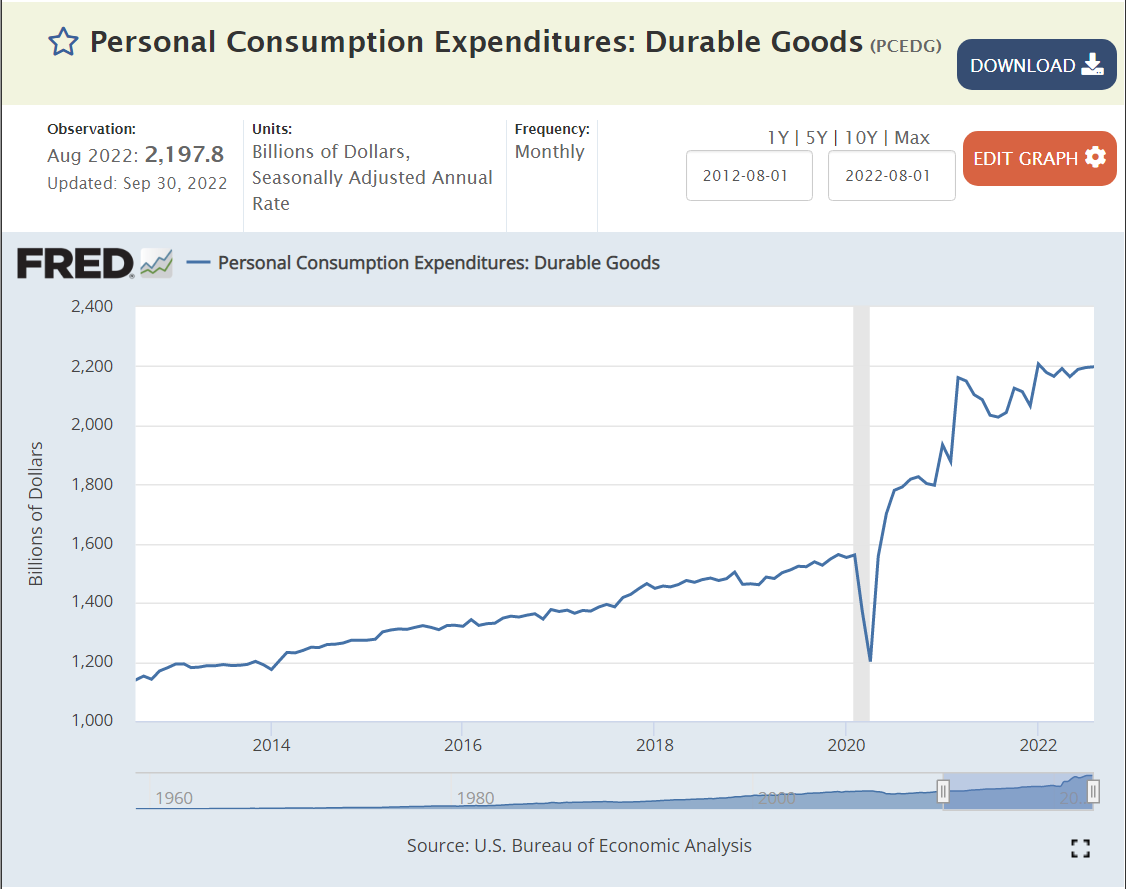
The increased money in consumers’ pockets lead to a 30% increase in purchases of durable goods. Consumers had money. They were afraid to consume in-person services. They bought stuff. They’re still buying stuff. The transition from buying goods to buying services has been slower than expected. This has led to extended supply chain disruptions (globally), higher demand for many commodities and increased goods prices which feed higher inflation and higher demand for labor. The total demand for durable goods has flattened and prices have stopped increasing. This is a much-improved situation from late 2021.
Consumers did save some of their extra earnings during 2020 and the first half of 2021, but as prices increased and services became available, consumers chose to spend more and reduce their savings rate down to just 4% of income, well below the 7-8% of the prior expansion period. So, part of the “excess demand” in late 2021 was the drawdown of savings. That cannot happen again. It’s possible that low consumer confidence will reduce spending in the next year, but flat spending is more likely.
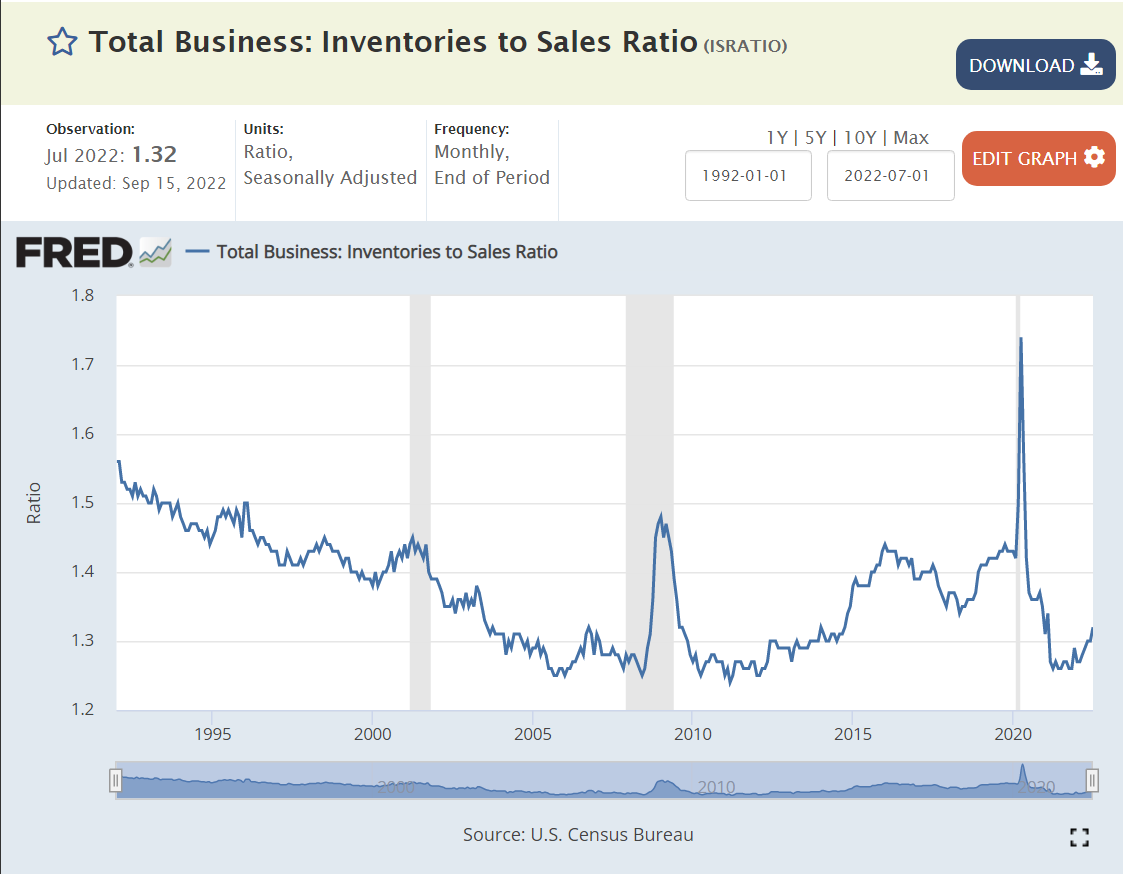
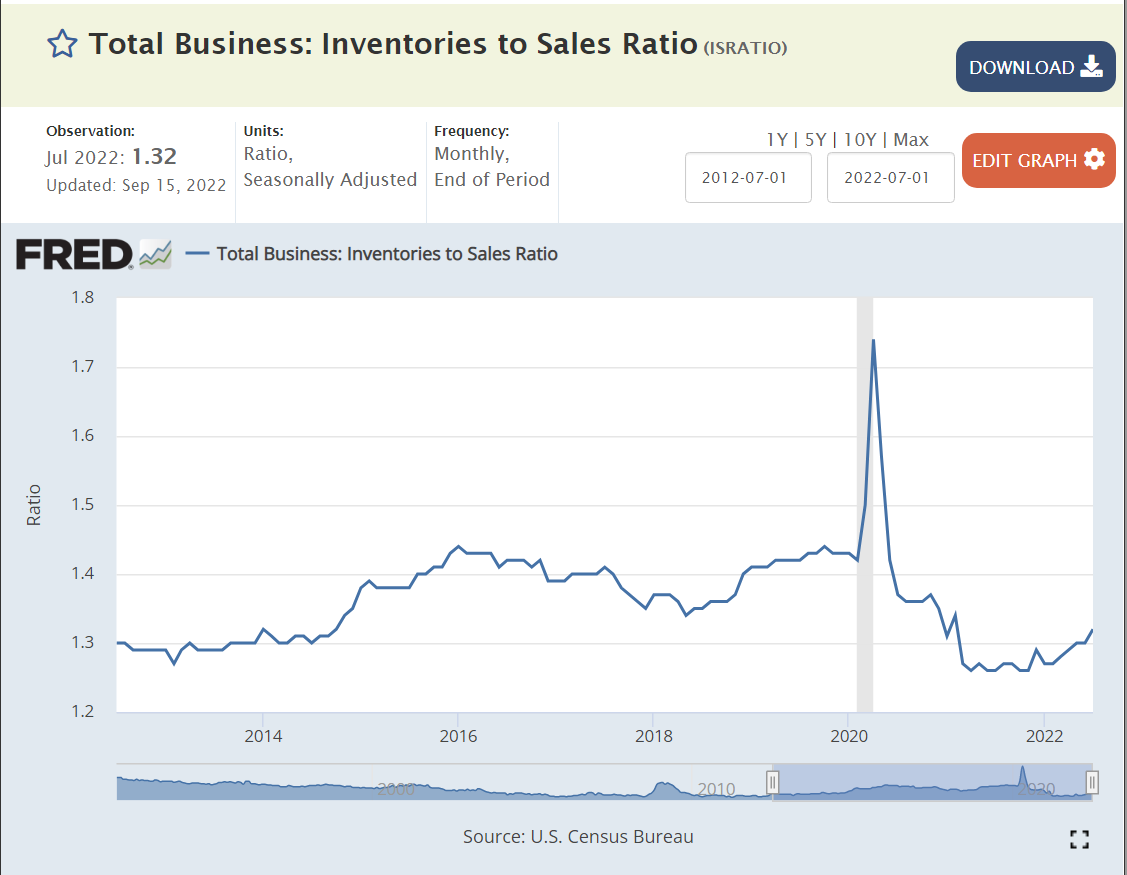
Most business cycle recessions show a clear build-up and subsequent liquidation of business inventories. Inventories were reduced (involuntarily) in the recovery from the pandemic and have increased a bit since then. There is no current indication of a pending “inventory recession”. In a “zero growth” retail holiday sales season, there will be some eternally optimistic retailers that have to cut prices to move goods, but this happens nearly every year.
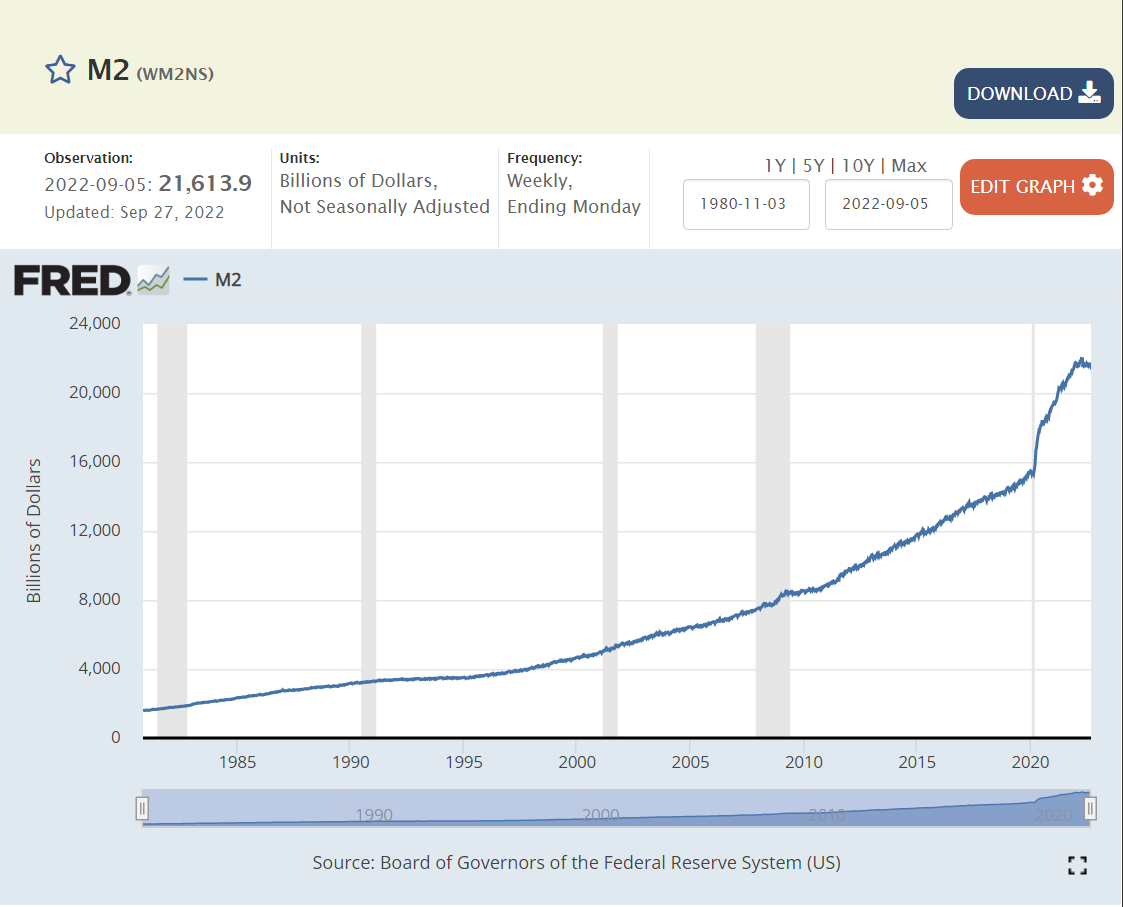
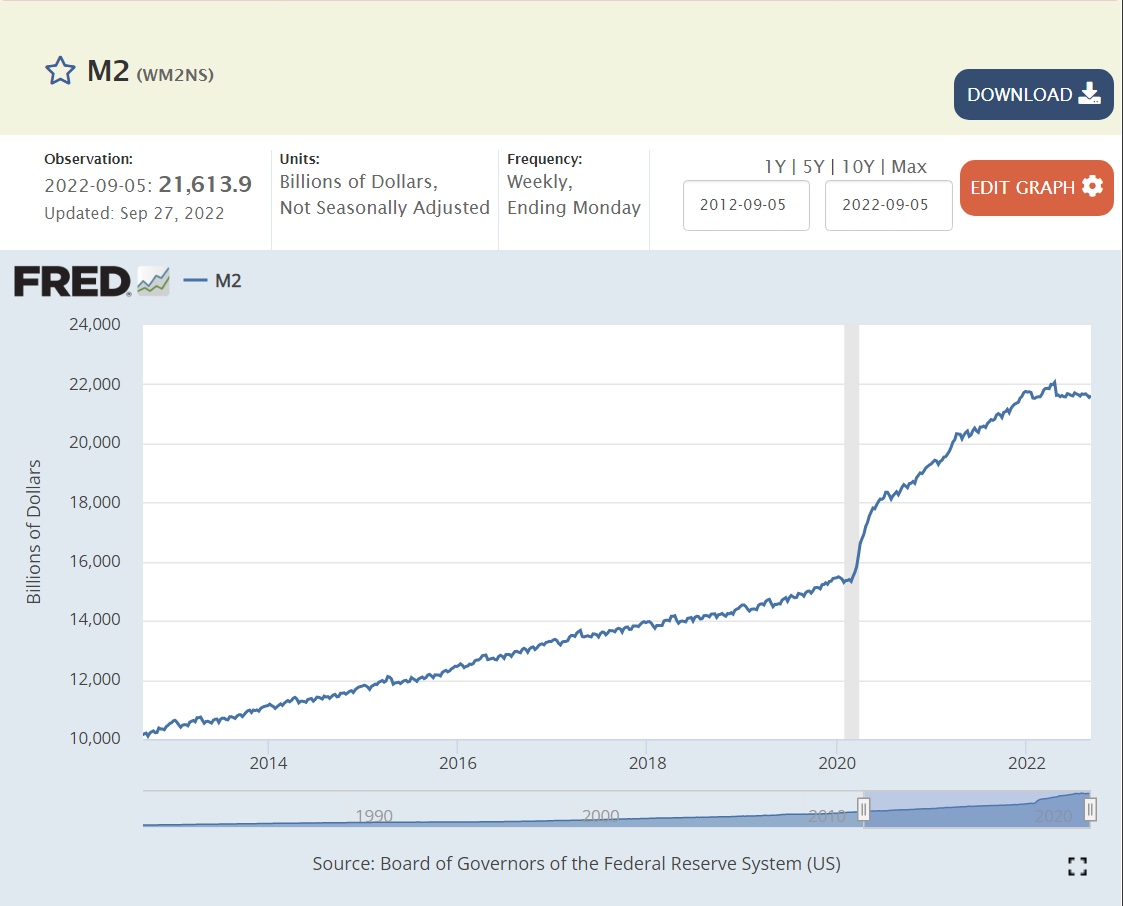
The Fed increased the money supply by an historically unprecedented 25% in response to the pandemic. And then by another 10% during 2021. In hindsight, the 25% was too much and the extra 10% was irresponsible. Fortunately, the money supply growth ended by the fourth quarter of 2021 and has remained flat.
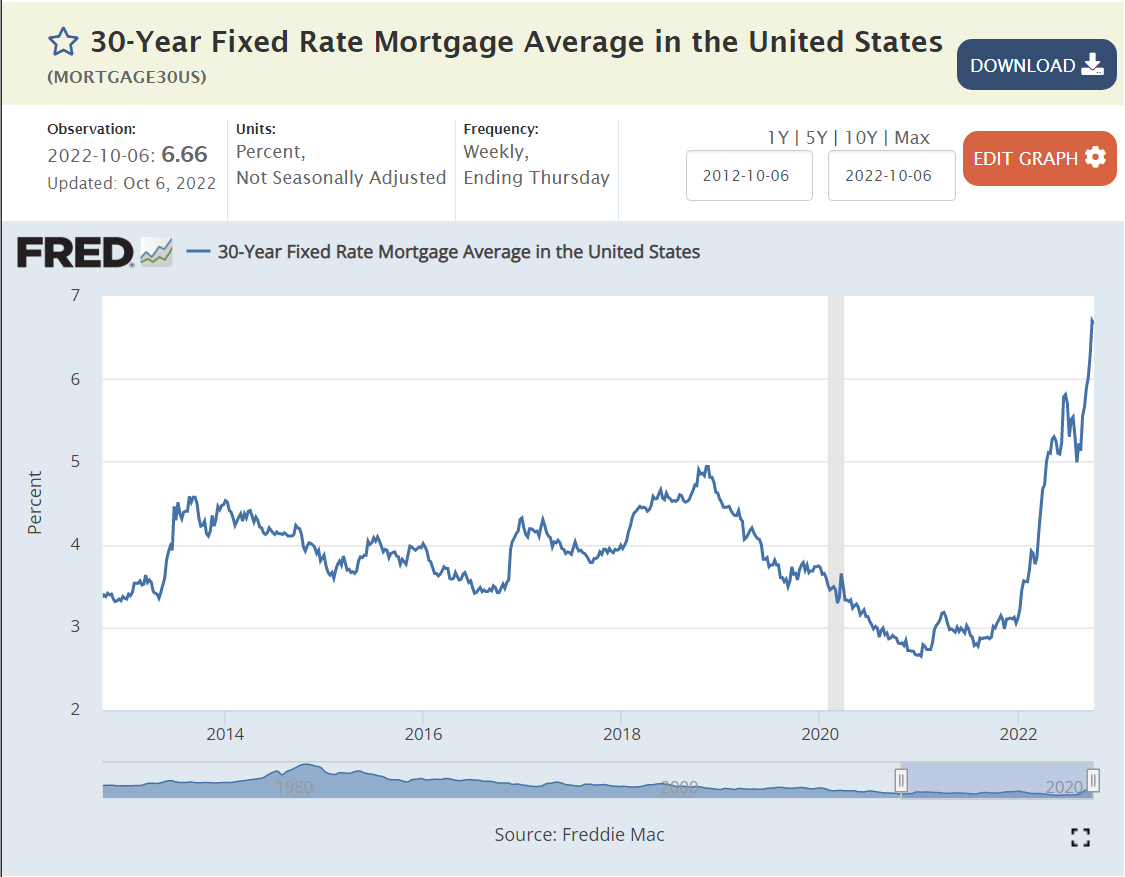
Mortgage rates were held to less than 3% for 2 years to support the recovering economy. They have now more than doubled, in excess of 6%. These higher interest rates will slow economic activity in many dimensions: lending, home buying, consumer credit, consumer spending, business investment, risk taking, stock prices, etc. Higher interest rates work with a lag to slow economic activity. They were still at “crazy low” rates at the end of 2021. The impact of higher rates is now being felt.
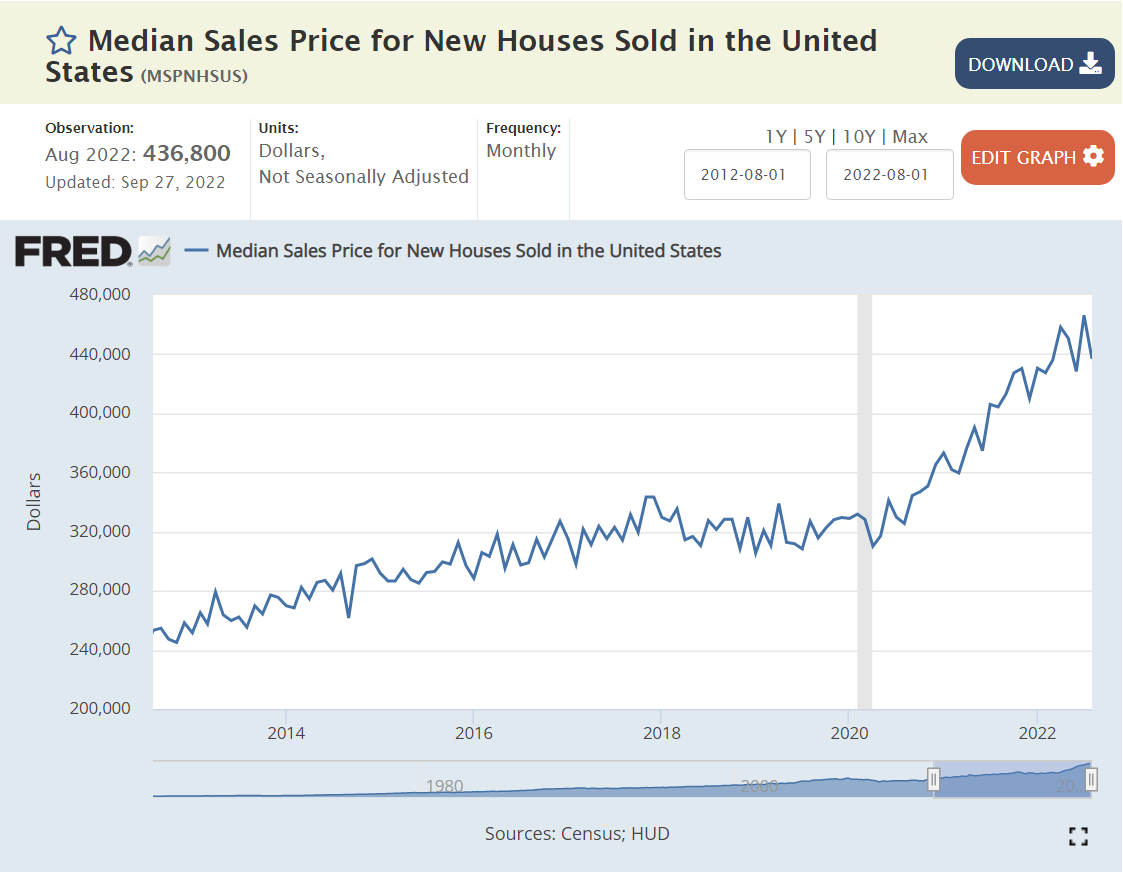
With extra savings, higher earnings, lower unemployment, restricted services available and historically low mortgage rates, consumer demand for housing grew rapidly while supply increased marginally. Housing prices (and rents) grew by 30%. Demand has now slowed. Housing inflation has slowed, perhaps to zero. This is a major channel through which GDP is decreased and inflation is reduced. Home purchases usually trigger thousands of dollars of additional move-in and fix-up expenditures.
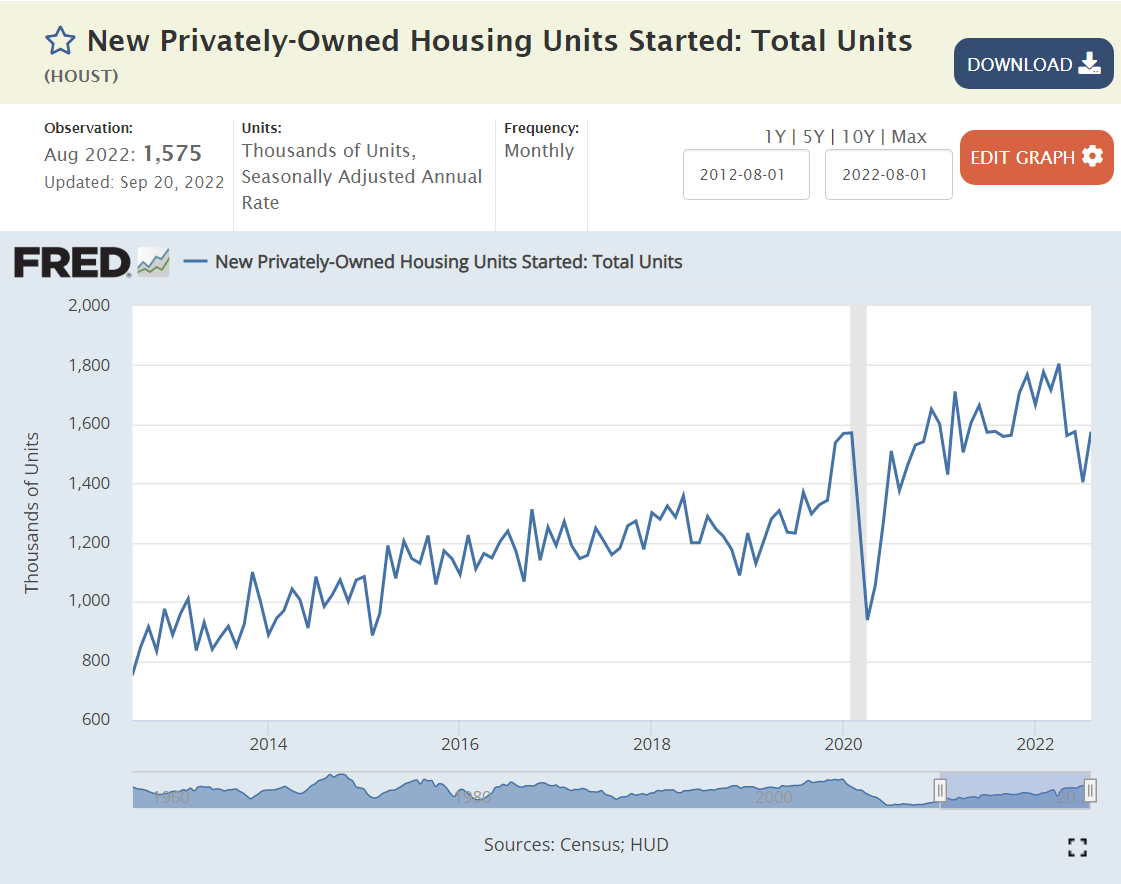
Housing sales and new housing starts have adjusted to the new interest rate environment. Note that the level of new housing starts remains above the pre-pandemic level, so some further decline is possible in the second half of 2022.
The US and global stock markets very quickly rebounded from the initial pandemic fear levels (-25%) back to the pre-pandemic levels which were more than 10% above the 2018-19 trend line. Stock markets increased after the initial pandemic recovery by 50% in line with growing profits. They have since dropped by one-quarter, a combination of lower expected future profits and higher interest rates increasing corporate financing costs and the cost of equity investors’ funds. Lower stock market prices usually have a negative “wealth” effect, with nominally poorer investors spending less in the current economy.
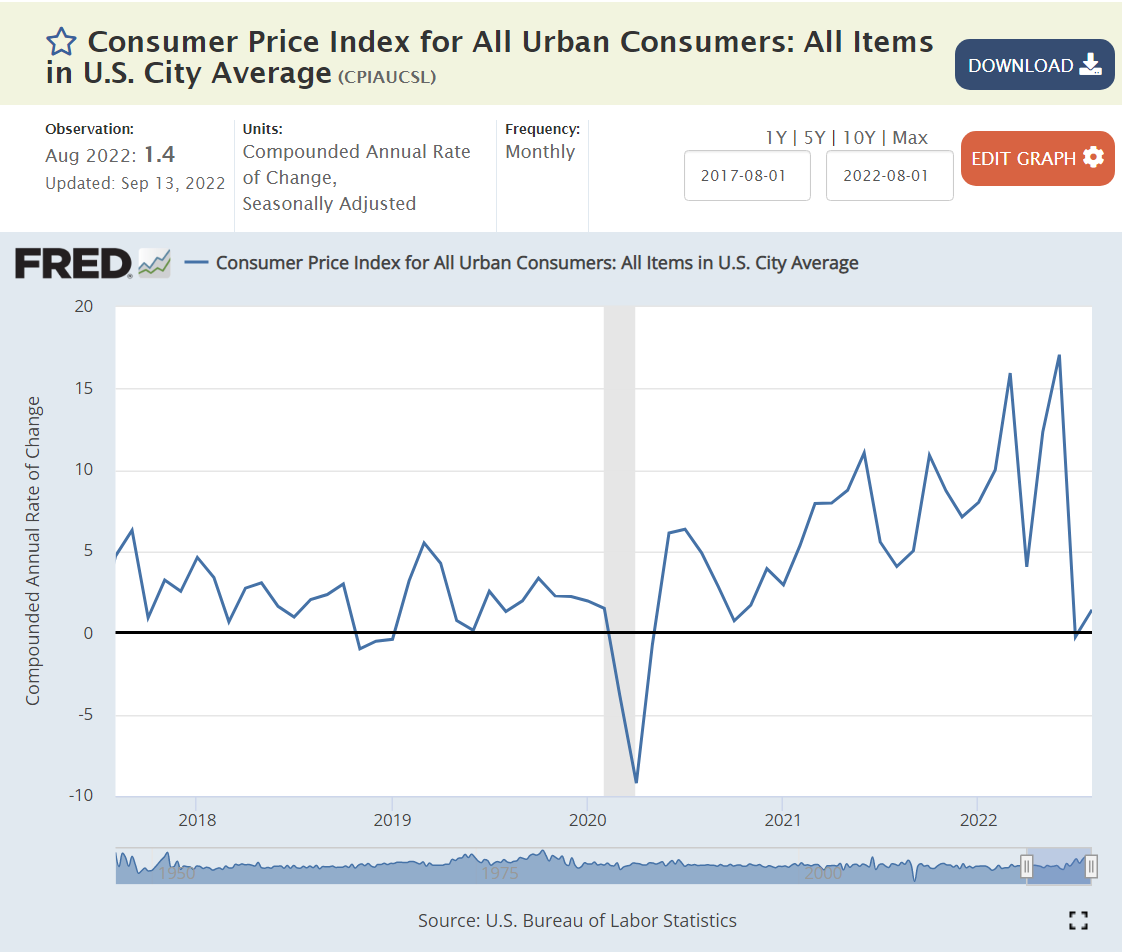
By the second quarter of 2021 we started to see 7-10% annual inflation rates. Increases finally slowed (or stopped) in the last 2 months. Reported inflation on a 12 months apart basis will remain above the 2% target level for the next 9 months, as high monthly inflation during the end of 2021 and the first half of 2022 remains in the measurements. Experts have a wide range of inflation forecasts for the first half of 2023, ranging from 3% to 8%. Most expect inflation to be close to the 2% target by the second half of 2023.
Producer price increases followed the same general pattern as consumer prices. They appear to have reached their peak. Producer prices better reflect global prices, especially the higher price of most commodities. Note the 30% increase in US demand for durable goods.
Global energy prices played a significant role in recent inflation. The last few months displayed an easing of prices, but recent OPEC+ decisions to reduce output indicate oil prices rising some again.
Job openings were at a historical high before the pandemic and quickly returned to that level by the end of 2020 and then nearly doubled in the next year+ as businesses saw opportunities to profit from the expanding economy, but could not find workers at the somewhat elevated prevailing wage rates. The number of unfilled jobs has dropped by nearly 2 million recently, from 12 to 10 million. The labor market is returning towards “normal”, but with 10 million open positions, the number of net new positions added is likely to increase throughout the fourth quarter, even as the Fed attempts to slow the overall economy.
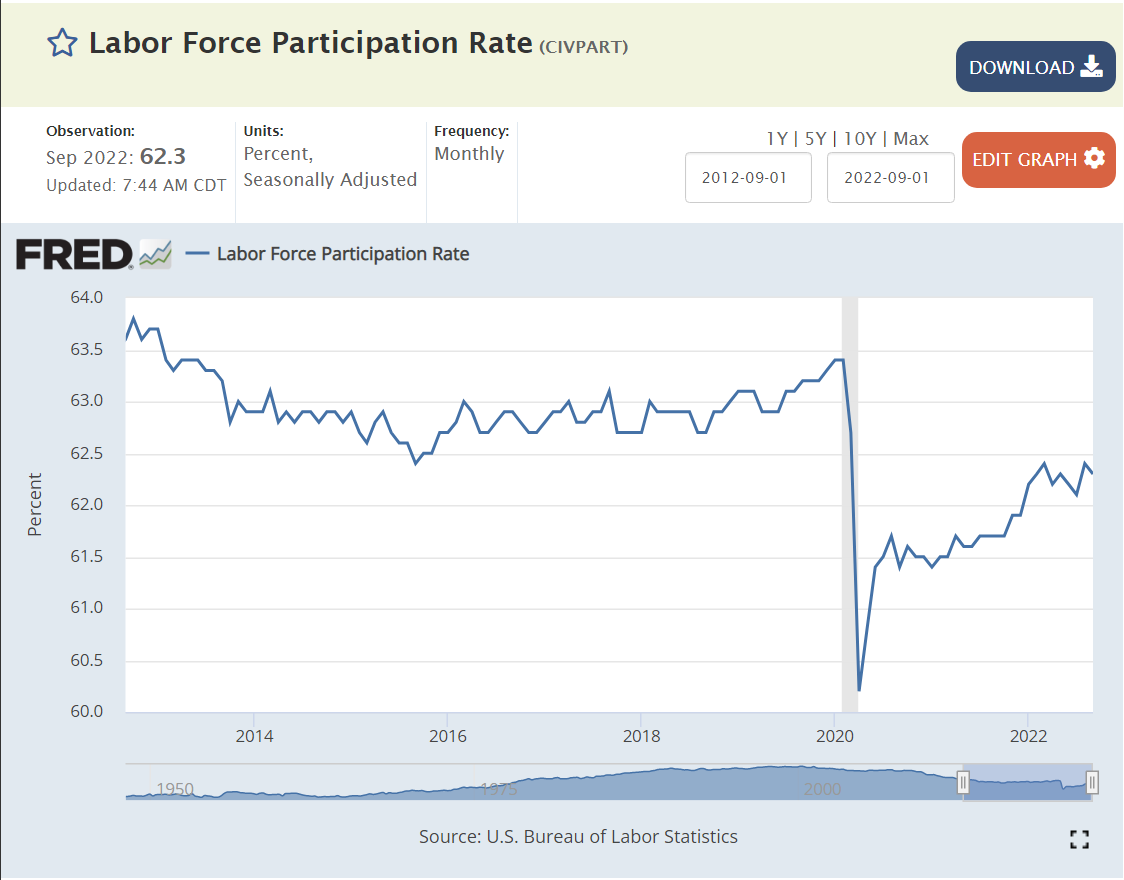
The US labor force participation rate slid from 67% to 66% to 63% from 2000 to 2009 to 2015. It dropped by 1.5% due to the pandemic (61.5%) and has since partially recovered to 62.3%, still a full 1% below the recent peak rate just before the pandemic. The labor market recovery has been good, but not great.
The core, 25-54 year old labor force participation rate has increased by 1.5% since the pandemic to more than 82.5%, less than one-half percent below the recent high of 83% before the pandemic. By this measure, the labor market is recovering nicely, but not completely.
Retirement age workers have not returned to the work force, with more than 1.5% of potential workers choosing to not join the labor market. Employers will need to be more innovative to attract workers back into the labor market.
Summary
The economy is slowing down, inflationary pressures are easing, but the labor market still looks strong. Slow to zero growth for the prior (3rd) and next 3 quarters is likely as inflation falls from 7-8% to 2-4%. Unemployment rates may increase, but it appears that the total number of employees will increase slowly during this low/zero growth period.
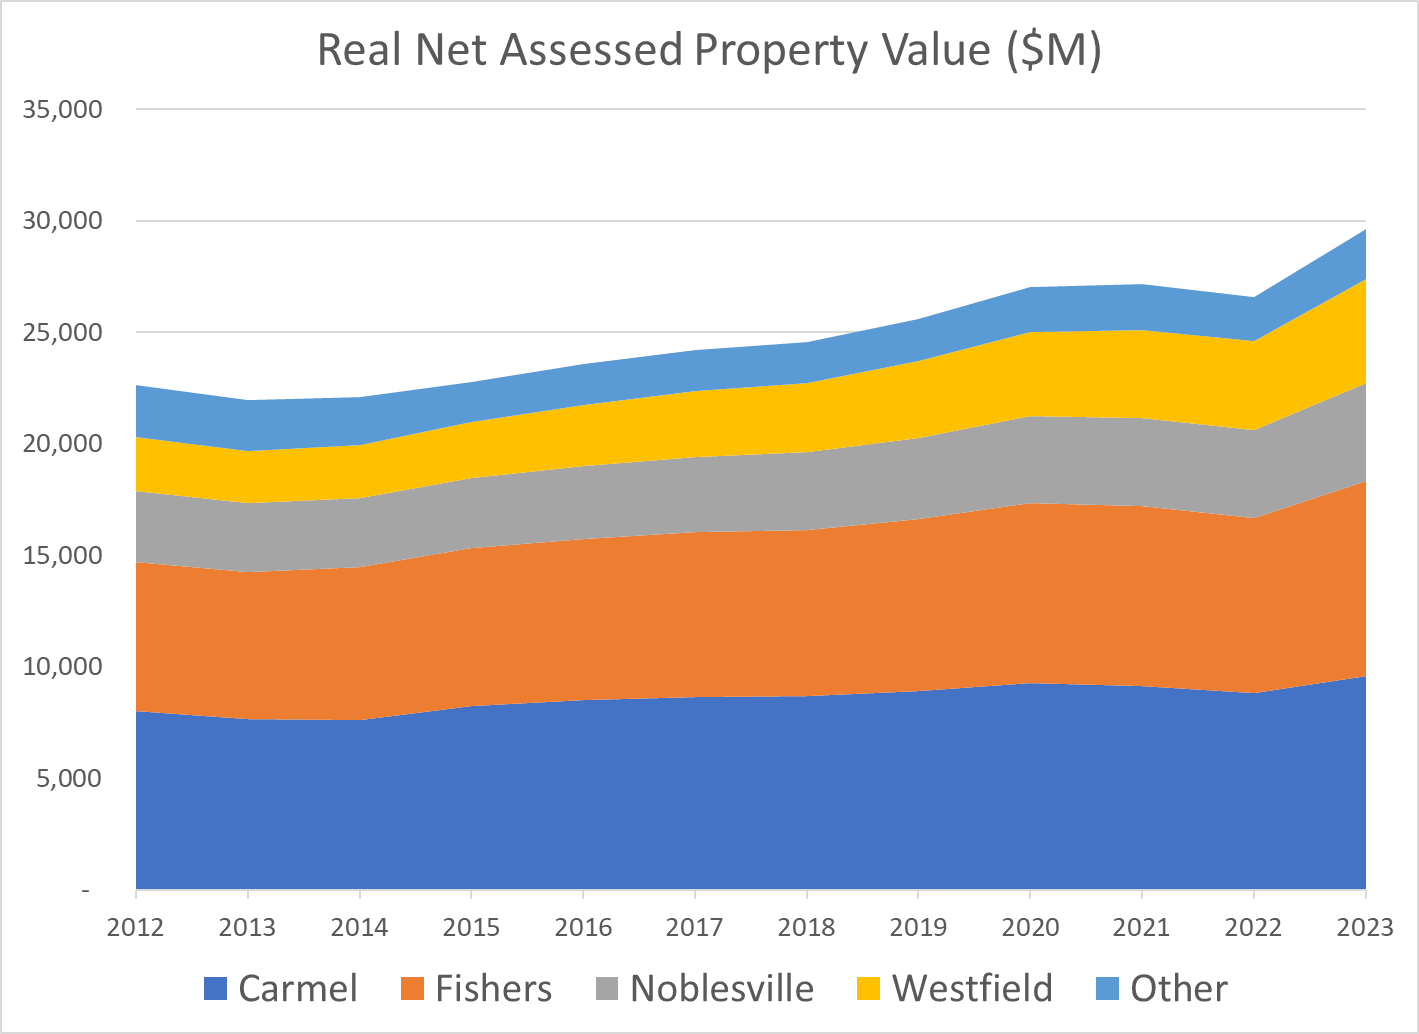
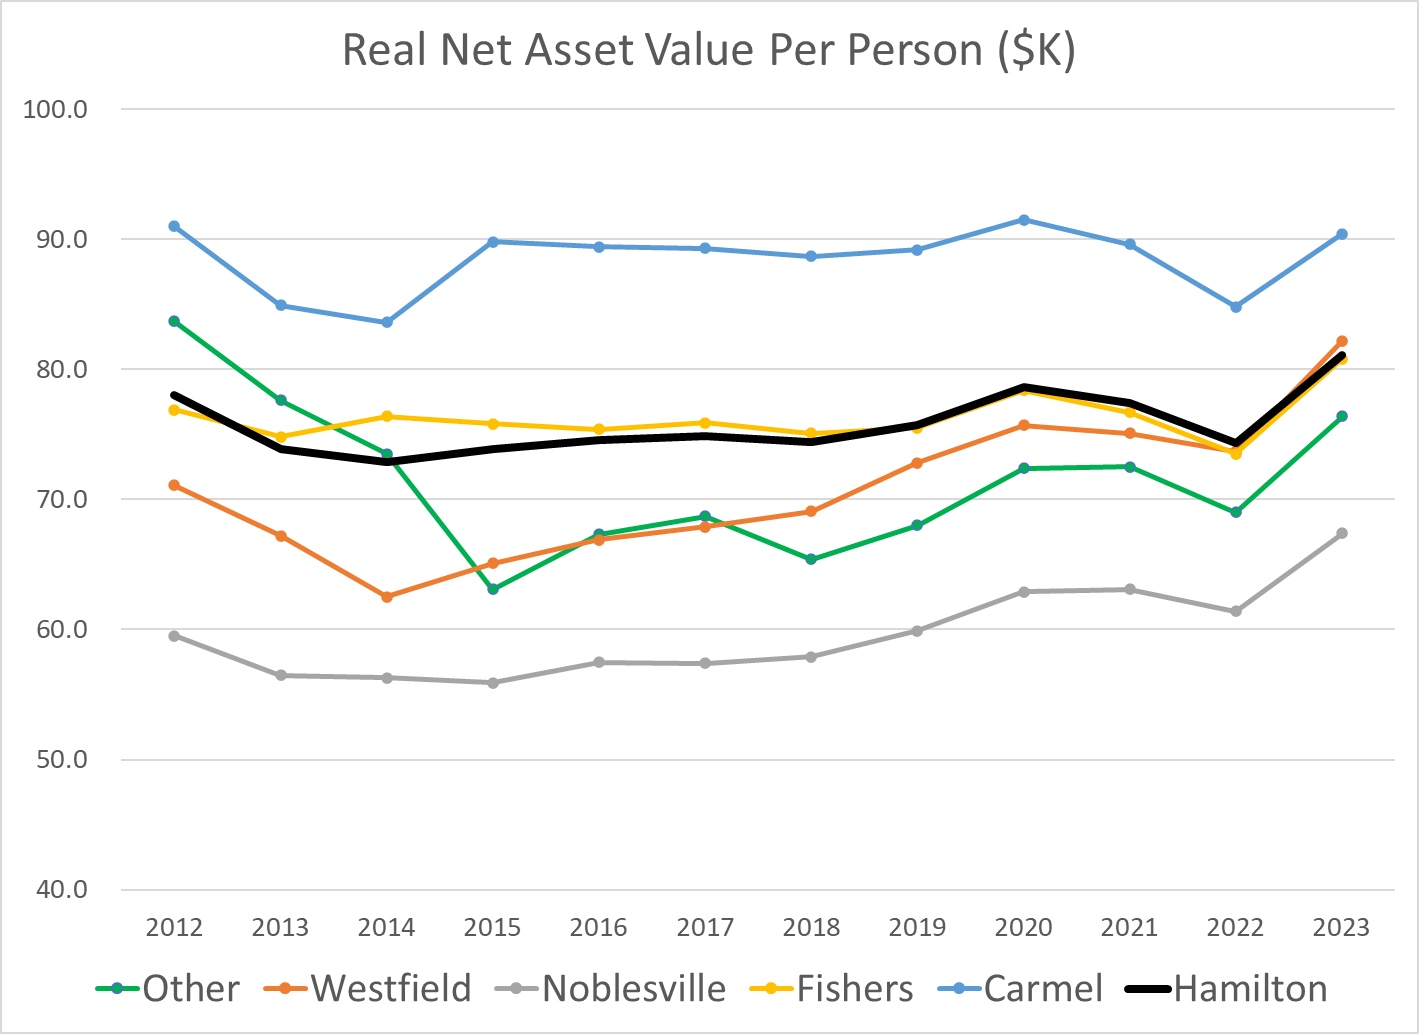
The real property value per person has remained roughly flat as the county has grown during the last decade. Carmel has higher real estate values and Noblesville has lower real estate values.
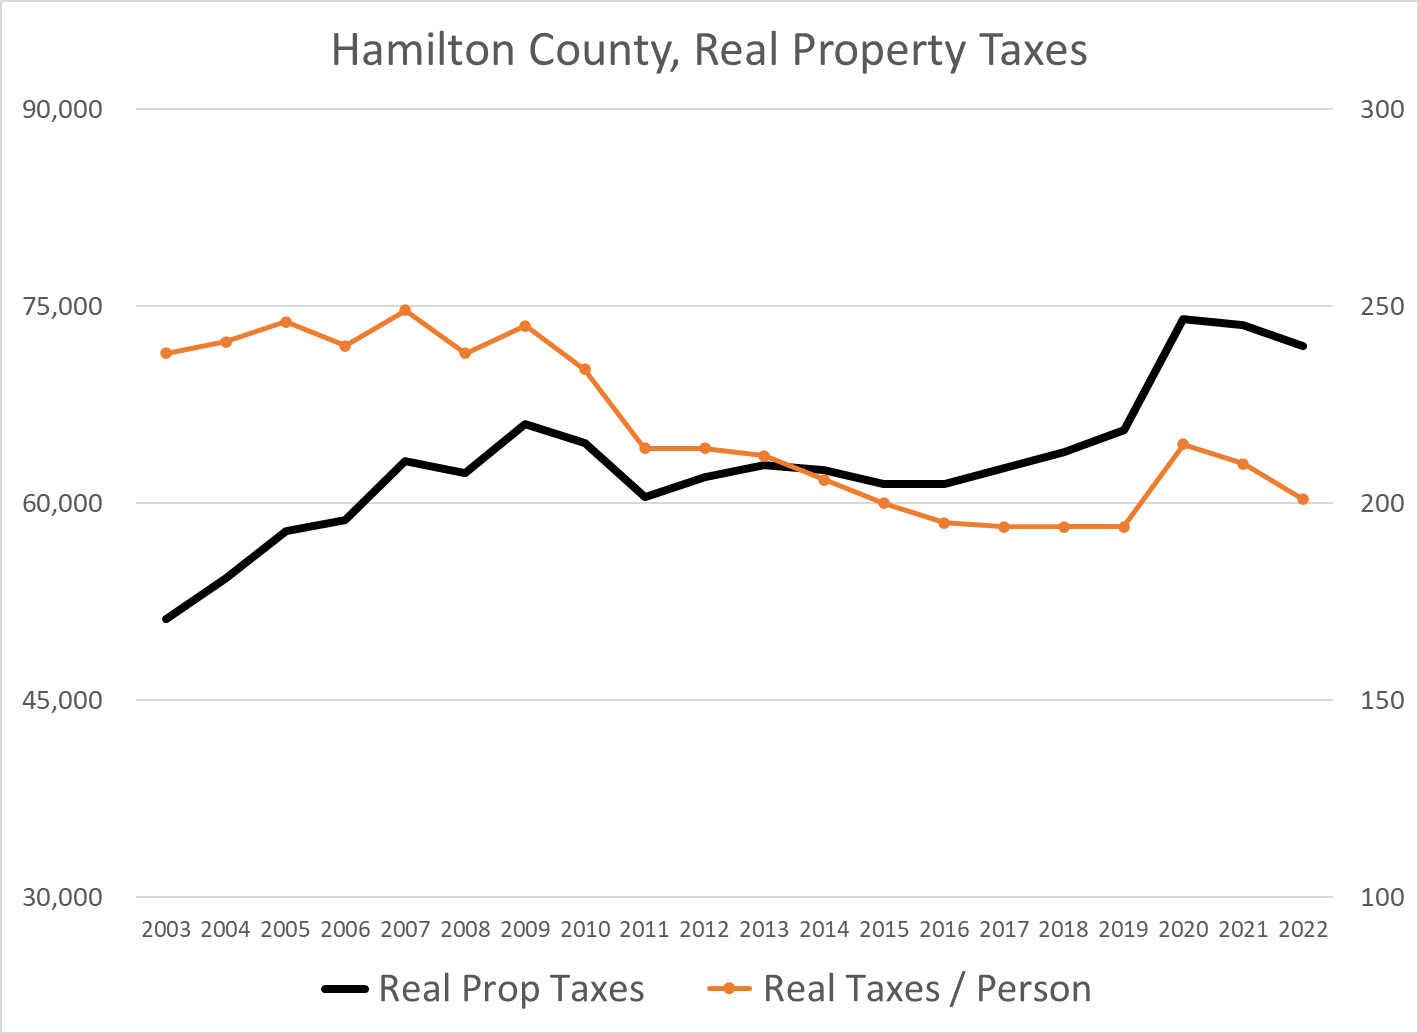
Real estate taxes levied by the county itself increased for payments due in 2020, but the real taxes per person remain 20% lower than they were in the “teens”. The county consolidated the provision of certain “emergency” services from the towns and cities in 2020.