Congregational Strategy: Target Market

https://www.farmersweekly.co.nz/people/calling-central-districts-top-young-shepherds/

Target Market Defined

What is your church’s target audience?

The brands that are growing the fastest in the world all have this in common: they have a target audience that serves as their guide to build their brand around. These brands are able to see tremendous growth as they focus on the right community of people.

Too many churches don’t take the time to take aim before they take action with their marketing efforts and this creates waste with their resources. Don’t let this happen to you.

Get focused.

A target community allows church leaders to be effective as they build their brand because they are able to focus on those people they are good at reaching.

Let me first say this: As a church, you should welcome anyone that is breathing, because that is what God’s love compels us to do.

The point I’m making is simply that you need to have a strategic target in your approach to marketing and advertising because focus allows you to be most effective in attracting people. I like to say that confusion is the enemy of your vision.

Each church is equipped to reach certain types of people based on the leadership that is in place, the location it is in, the type of ministry it offers and the resources it has. The more clarity a church has on it’s primary people group the more effective it will be in reaching people as the brand is built around this community.

https://churchbrandguide.com/how-to-define-your-churchs-target-audience

I want to let you in on a little secret: you have a target audience, whether you know it or not. Everything your church does or says is going to appeal to one group more than another. It just is. People don’t all enjoy the same kind of theology, music, decor, or preaching style. Some people like communion to come in little plastic cups. Others prefer intinction.

The choices you make are excluding people who would prefer something else. If they don’t like drums in the worship service, and your church uses drums in some fashion, you’re excluding them. If they don’t like drums but stay anyway, of course you’ll welcome them. It’s not like you’re putting a sign on the front door that says, “If you don’t like drums, go away!” But some of the choices you make will potentially turn some people off — and that’s okay.

One thing stagnant churches haven’t realized yet is that by not choosing who they intend to appeal to, the choice is being made for them. Everything from the interior design to the music is being chosen by different people using their own preferences as criteria. What you often end up with is a strange quilt of elements that might not necessarily appeal to anyone.

Your Church Is NOT For Everyone

Wait, isn’t the Church for everyone? No, the Gospel is.

This is the number one mistake we see churches making. They assume that because the Gospel is for all people, their church is too. When in reality every Church is called to a specific group of people, like Paul was called to the Gentiles and Peter to the Jews. So your local church is called reach and minister to a certain, defined, group of people.

https://www.digitalchurchtoolkit.com/blog/how-churches-define-their-target-audience

JESUS LOVES EVERYONE, SO DON’T WE WANT TO TARGET EVERYONE WITH OUR MARKETING?

Every single person in your city, within a fifty-mile radius… that’s your target audience. Right? If that is your mindset, you have an uphill battle in front of you. Don’t get me wrong, you certainly want to see every man, woman, and child come to know Jesus through your church. As Christians, we love everyone! But here is the crazy truth: to reach more people, focus on fewer people. Your church is going to make a much deeper impact on your community if you tailor the entire experience to a specific demographic. It seems counterintuitive, I know.

While reaching the whole world with the gospel is the mission of the Christian faith, life-giving churches recognize that the world is made up of many different audiences. Since different groups of people have quite different cultures, needs, and methods of communication, a church that intentionally tries to reach a specific group with the message of Christ, will normally be much more effective than one that tries to reach everyone with a general attempt. Every church should have a sign that says, “Everyone Welcome,” but a deliberate strategy must be in place or they will only see accidental growth.

https://www.churchgrowthnetwork.com/freebies2/2020/6/5/v45avm7cmccyhlkyeub2hlbmw7svyc

As Christians, we want to reach and include everyone. This is our ultimate goal as disciples. However, from a specific ministry standpoint, this approach ends up reducing the relevancy of the message and spreads efforts too thin for significant impact. Afterall, a standard marketing rule of thumb states:  

If you try to reach everyone all the time, you’ll end up 
REACHING NO ONE.

​Each person, ministry, and local church is uniquely equipped and positioned to reach different types of people. Therefore, it is vital to understand who your audience is before you create content, write a single social media post, or spend any money on social advertisements. This section will help you learn how to effectively shape your messages and content to match your audience’s needs and reach them effectively, no matter their age, gender, ethnicity, location, or situation. 

https://www.sdadata.org/digital-evangelism-blog/understanding-your-target-audience-for-effective-communication

There’s a marketing axiom that says if you try and market to everyone, you market to no one.

It works that way in the church too. When a church tries to reach “everyone,” it effectively reaches no one. That doesn’t mean everyone isn’t welcome … if everyone isn’t welcome, you’re not running a church, you’re a private member’s club.

But just because everyone’s welcome, it doesn’t mean you should (or even can) accommodate everyone.

Target Audience

Defining a target audience is a marketing concept where you describe a person who is the ideal customer for a product. It helps to shape branding decisions such as colors and fonts so the designs hit the mark.

A church can use a target audience to provide clarity in the experience it provides online and in person. It creates alignment which builds trust so people decide to be part of your church.

https://churchbrandguide.com/how-a-church-defines-its-target-audience-to-reach-more-people

Quick Comment on the Need for a Target Market

Different groups of people have different felt needs. American firms started to cater to these groups with truly “differentiated products” in the 1960’s, 1970’s and 1980’s. American religious denominations have increasingly offered creeds, worship and experiences to meet diverse needs. By the 1990’s individual congregations began to refine their offerings and messages to match the needs of their congregations. Today, American consumers are spoiled. They expect to be served.

On the universal customer needs dimensions of QSFVIP, “I want it all and I want it now”. Quality: relevant, meaningful and entertaining sermons, worship and program experience. Speed: 45 minutes, on-line, recorded. Flexibility: multiple times and delivery channels. ”Call me”. Value: programs and message directly touch me where I live. No pledge commitment. Ala carte funding of programs. Information: no transaction costs. 6 ways to give. No pledge commitment. Personal: monitor my needs and follow-up.

In a world of such expectations, congregations cannot easily meet the expectations of everyone that visits or becomes a member. They must welcome everyone, but they are unable to serve everyone.

The marketing folks emphasize that effective organizations refine their services so that they clearly meet the needs of a target audience. This allows the marketing machine to do its magic. 

Benefits of Defining a Target Market

Much more effective marketing to attract new members and retain existing members.

A consistently defined and executed set of programs, brand image and messages is more effective.

The process of defining a target market forces staff, volunteers and elders to more deeply consider the priority needs of the congregation and community.

A clear target market helps to identify, define and prioritize local mission investments.

Congregations struggle with resource allocation decisions. A clearly defined target market helps to prioritize worship, outreach, youth, children, adult, local mission and global mission efforts.

Prioritization within ministry areas is easier to do.

Able to evaluate and justify investments in marketing and outreach.

Helps to focus all programs to deliver specific benefits to meet the perceived needs of the target market communities.

A target market is needed to do effective marketing. It can also help to shape worship, facilities, programs, outreach, events, music and mission activities to better serve the congregation and the community.

Safeguards When Defining a Target Market

But wait, there is good news. Even though you focus on one demographic, that doesn’t mean you will only reach that one person type. Other demographics will also be served by and attracted to your church. I am constantly amazed by how many people don’t fit into our cultural norms. I see people that don’t fit certain stereotypes—wearing brands, attending events, or watching shows that I would have never guessed that they would like. You don’t have to worry that your church will end up only serving a specific type of person, or that everyone else will feel out of place. This is just about making your marketing specific. You will still have a well-rounded congregation, and people will still feel like they belong, even if they are outside of your defined target audience. Don’t be all things to all people, but find who you truly are and go all in with that.

Targeting a specific demographic as a strategy for church growth is problematic. It can create needless obstacles for any church wanting to have an open door. If you say you are interested in ministering to any and all people, shaping your ministry to fit just one group is contradictory.

People who are not the aim of your reach efforts will feel left out or overlooked. For instance, if you decide that your congregation will be a “family church,” focusing on children’s ministry, marriage sermon series, and small groups for couples, then singles will feel unwanted. Creating a youthful vibe that only interests millennials will make older people feel unneeded or unwanted. In targeting one group, you’ve eliminated any space for other groups.

This is one of the worst unintended consequences of the church growth movement. Many have written solid critiques of the movement and have much to say about other consequences. The most grievous is the contextualization of the gospel. And focusing on one demographic to the exclusion of others can lead down that same slippery slope.

When you direct your ministries toward one group, you run the risk of forcing every message into a one-size-fits-all box. You base every decision on that one demographic you’re trying to reach. You adapt your sermon applications to fit a perceived felt need, rather than letting the Word of God speak for itself and leaving space for application to every life situation.

There is a difference between reflecting your immediate community and targeting a specific demographic. Ultimately, your congregation will likely start to resemble the makeup of the surrounding neighborhoods. If they are homogenous, then your church will probably be the same.

https://influencemagazine.com/practice/should-churches-target-a-defined-demographic-as-a-strategy-for-church-growth

Church marketing won’t work unless:
We focus less on what we say and more on how we act.
We realize that louder isn’t better.
We look at it as relationship-building and stop viewing it as information-sharing.
We talk less about how great we are (“organization-focused”) and instead deliver a message and ministry that leads to life change (“people-focused”).
We realize we can’t force what we think people need until they know they need it.
We reduce the number of competing messages we are trying to communicate.
We know who we are trying to reach and we’ve acknowledged we can’t reach everyone.
We deliver on what we promise.

https://theunstuckgroup.com/church-marketing-tactics/

https://www.christianitytoday.com/karl-vaters/2019/august/church-targeting-demographic-group-stop.html

https://au.thegospelcoalition.org/article/the-problem-with-target-audience-churches/

https://www.christianstudylibrary.org/article/target-audience

Target Market Dimensions and Examples

Here are some mindset examples of people a church can focus on:

  • A church may focus on people who love music and they build an experience that is excellent around a worship experience. The church then attracts musicians and those who love to worship by coming to a corporate gathering.
  • Another church may focus on people who are doers and love to make things happen. They build an experience around outreach to the local community and equipping people to make an impact with their lives. They might have an emphasis on missions work around the globe so the people are able to do the most good with their resources.
  • Yet another church may focus on people that are business professionals. Their experience may be in line with teaching principles and having opportunities to build projects that make a large impact.

Here are a few more mindsets that a church may target:

  • Young parents who are in need of a guide to help them do it right
  • Those who desire to make a difference with their lives
  • Young adults who are seeking a place to belong with others who are like-minded

https://churchbrandguide.com/how-to-define-your-churchs-target-audience/

When churches begin going down this road, they’ll often decide that their church demographic is something like “young families.” This is a good place to start, but isn’t quite as dialed in as you would like. If you can be even more specific and say, “young families with infants” or “families with elementary-aged kids,” it’s much easier to understand how things could change to be more welcoming for them.

Some churches have had great success focusing on groups like unchurched men, musicians, cowboys, military families, etc.

Here are a few examples of a well-defined target audience:
– Young couples with children under ten years old
– Men between the ages of twenty-one and thirty who have a worldly past
– Established professionals in their forties
– Local college-aged students

When it comes to outreach and evangelism, most churches have a “target market”- an ideal audience for their services and ministry programs. Frequently, that tends to be young families, and the key decision maker for church attendance is often  the mom/wife. Understanding how women communicate and make decisions regarding church visits can help you create a website designed to appeal to them. If you know women in their 30s are your target audience, don’t design a website that appeals to men in their 50s.

https://exponential.org/evangelism-capacity-starts-online/

Millennials, broadly speaking

Nearby Elementary School parents.

Local 20-35 year old apartment renters

Nearest neighborhood residents (within 2 miles)

Nearby residents (within 3 miles)

Nearby residents, homes built since 2000 (within 3 miles)

New city homeowners

Office corridor employees

Senior citizen center members

Adult children of church members

Local government and schools’ employees 

Local hospital/medical employees

Parents of preschool enrollees.

Former members of the church.

People attending a “civility” meeting.

Parents of on-site and off-site youth sports participants

Parents of cub scouts

Local retail and restaurant employees

Young Republicans and Young Democrats

Determine Your Target Audience

The first step in reaching your audience is to develop a clear picture of who you are talking to. Begin with surface-level demographic information. Use the criteria below and fill in the information for your ministry’s target audience.

Surface-Level Demographic Information:

  • Location
  • Age
  • Gender
  • Ethnicity/Language
  • Interests

Deep Level Characteristics:

  • Needs
  • Core Values
  • Shared Experiences
  • Motivations
  • Additional Insights

hese cultures are potentially endless in variety, but can include:

  • Platform
  • Age groups or generations
  • Gender
  • Language(s)
  • People groups: race, ethnic, immigrant v. first generation, etc.
  • Current location: city/suburbs/country
  • In school vs. out of school
  • Lived in a specific geolocation their whole life vs. transplant
  • Faith groups, life-long Adventists vs. converts vs. former Adventists/Christians
  • Professional groups vs. homemakers vs. working mothers
  • College educated vs. blue-collar workers
  • Offline social clubs vs. online identities and groups
  • Poverty vs. middle-class vs. wealthy

https://www.sdadata.org/digital-evangelism-blog/understanding-your-target-audience-for-effective-communication

To be honest, most churches today have opted to try and target a shrinking audience … adults who have some history in the church. Lapsed church-goers. The Dones. But almost every church is trying to target all of them all at the same time.

The graduated-from-college but not-yet-married group

Transitioning into the real world is hard enough for young people, so make it easy for them to get plugged in at your church. There is a lot of pressure for this group to land a good job, get their own place and possibly even find a spouse. This group needs support, so be there for them.

Married couples that, for one reason or another, do not have children

Getting married is one of the most exciting times in someone’s life. But afterward, where exactly do married couples without children fit in at church? There seems to be an abundance of ministries for families, but the church lacks in ministering to couples of all ages who don’t (or maybe can’t) have children. Don’t neglect this group.

30- to 40-year-old singles

I think from this short list, this could be the most neglected group. Maybe these people have never married, or maybe they’re divorced. Regardless, they are generally more mature in their faith (and life in general) than younger singles. And because of this, the last thing they want to do is join a small group of 20-year-old singles whom they can’t relate to at all. Men and women who fit into this group can be such an asset to a church. Hmm … and isn’t there a single guy in the New Testament who modern-day churches frequently study? Yeah, his name is Paul. Don’t ignore this group; they could be the “Pauls” of your church.

Process to Determine Target Market

Still trying to figure out who will find your church’s “target audience” is? Start by asking the questions below:

  1. Who do we appeal to right now? Why?
  2. Who do the other churches in our city appeal to?
  3. Is there an underserved demographic in our community? Who are they?
  4. What does our community look like?
  5. What is the average income in our community?
  6. What is the average educational level in our community?
  7. What kinds of jobs are represented in our community? White collar? Blue collar? Artists? Medical professionals? Young entrepreneurs?
  8. What kind of lifestyles are represented in our community? Outdoorsy? Runners? Sports fans?
  9. What kind of worship experiences aren’t represented in our community?
  10. What are our strengths?

5 STEPS TO FIND YOUR TARGET AUDIENCE

Discovering your church’s target audience can seem daunting. Still, with a few simple steps, you can clearly define and communicate with the people most likely to engage with your church digitally.

  1. Consider the typical characteristics of the people that attend physical services.
  2. Look at outside influences like location and demographics to determine who could be interested in your message.
  3. Research their motivations, their relationship status, and any other vital details.
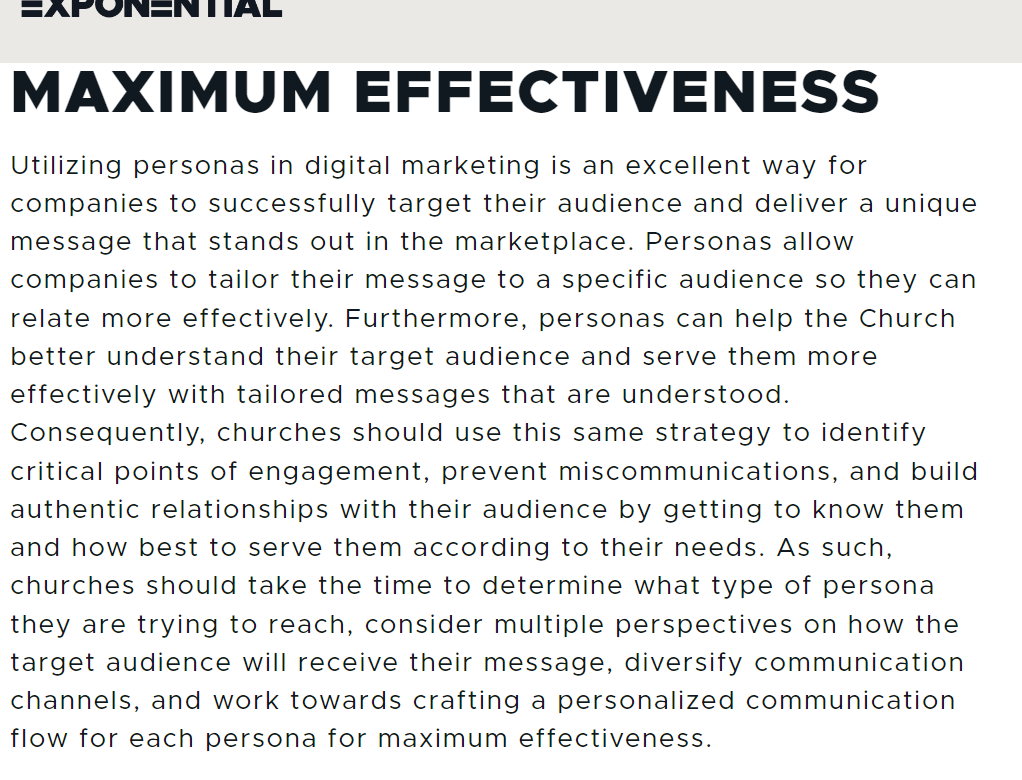
  4. Then, create a persona for each segment of your target audience—a living representation of your ideal members.
  5. Finally, create marketing strategies that make use of these personas and help to keep churches on-mission in spreading their message.

https://exponential.org/why-churches-should-utilize-personas-and-target-audiences-on-the-digital-mission-field/

Start with the Existing Congregation

3. Define your audience

For most churches, the most important audience to market to is going to be your existing congregation. That’s because word of mouth is a powerful tool when marketing your church. unSeminary reports, “The fastest-growing churches in the country consistently encourage their people to invite friends and family to be a part of their church. It really is that simple.”

Think of it this way: when your friend recommends something to you, how likely are you to take their advice over the advice of someone you may not know as well? Most of us tend to trust the recommendations of people we love and enjoy spending time with.

For most churches, the primary target market is actually their current congregation. Though it may seem a bit backward, word-of-mouth advertising for churches is one of the most effective. Think about it: Most of us tend to believe the advice of those we cherish and value our time with.

https://www.playlister.app/blog/church-marketing-strategies-to-help-grow-your-church

Define Your Audience: Current vs Aspirational

When defining who makes up your church, it’s good to start by differentiating between who is your current audience and who is your aspirational audience. Your current audience is those who your services and events are actually attracting, so it’s a good idea to focus your efforts on people from this demographic. Have a look around your church, you may even have data already. What type of areas do these people live in? What’s their average age? Are they mostly families? 

Your Aspirational audience is those your church want to be attending. Is your Church is is called to a specific community or neighbourhood, what are the demographics of the people? 

https://www.digitalchurchtoolkit.com/blog/how-churches-define-their-target-audience

LOOK AT WHO IS ALREADY ATTENDING YOUR CHURCH

Take a good hard look at your church and ask, “What kinds of people already attend here?” It helped me to understand people and churches immensely when I discovered the homogeneous principle. “A ‘homogeneous unit’ is simply a group of people who consider each other to be ‘our kind of people.’ They have many areas of mutual interest. They share the same culture. They socialize freely. When they are together they are comfortable and they all feel at home.” 2 People are attracted to those who are like themselves. This does not mean that you are not going to minister to those who don’t fit your desired target audience.

https://www.ministrymagazine.org/archive/1995/12/targeting-your-audience

Focus on “Felt Needs” and Culture, Not Just Demographics

DETERMINE THE FELT NEEDS

Paul did this in his ministry. His preaching met the needs of people. Listen to him: “Though I am free and belong to no man, I make myself a slave to everyone, to win as many as possible.

“To the Jews I became like a Jew, to win the Jews. … To the weak I be came weak, to win the weak. I have become all things to all men so that by all possible means I might save some. I do all this for the sake of the gospel, that I may share in its blessings” (1 Cor. 9:19-23, NIV).

We can do no less. Unless our preaching and ministry meets the felt needs of people, we cannot succeed.

“This is the only known way to open closed minds. Gearing your message to the felt needs of any audience is the key to unlocking closed filters. In fact, extensive research and documentation confirm that ‘people will not listen to the gospel message and respond unless it speaks to felt needs.'”4

We must do whatever it takes (within the confines of biblical principles) to win the lost around us. If you live in a retirement area, you must have programs for the retired. If you live in a Spanish-speaking community, your services should be in Spanish so those coming will under stand the gospel. If you live in a baby boomer community, your worship service must speak the language and meet the needs of the baby boomers.

Jesus used this approach 2,000 years ago. “Christ’s method alone will give true success in reaching the people. The Saviour mingled with men as one who desired their good. He showed sympathy for them, ministered to their needs, and won their confidence. Then He bade them, ‘Follow Me.'” 5 Every ministry in the church should be examined to see if it is meeting the needs of the people you are trying to reach.

https://www.ministrymagazine.org/archive/1995/12/targeting-your-audience

https://clickmill.co/church-marketing/#9

People no longer fit into neat categories, so we must connect with them on a more profound level, transcending the standard marketing demographics of age, ethnicity, gender, language, location, and interests. If you can dig deeper, your audience will be loyal to your brand because you resonate with them at their core.

The best way to do that is to investigate their needs, experiences, values, and perceptions. Conducting surveys and interviews is one key way to collect more information. Then start asking yourself questions that will help you to get inside the minds of your audience members. What motivates their actions? What makes them who they are? What do they have in common? How can I speak and write in a way that my audience will find relatable? What do they value? What do they actually need?

Examples of needs may include: a spiritually supportive community, affordable education, employment, affordable medical care, safe spaces for their children, mentorship opportunities, a better future, healthier relationships, self-improvement, Christian guidance on real-life issues, food security, or practical life-skills training.

https://www.sdadata.org/digital-evangelism-blog/understanding-your-target-audience-for-effective-communication

Target Audience Profile or Persona

https://exponential.org/why-churches-should-utilize-personas-and-target-audiences-on-the-digital-mission-field/

https://clickmill.co/church-marketing/#10
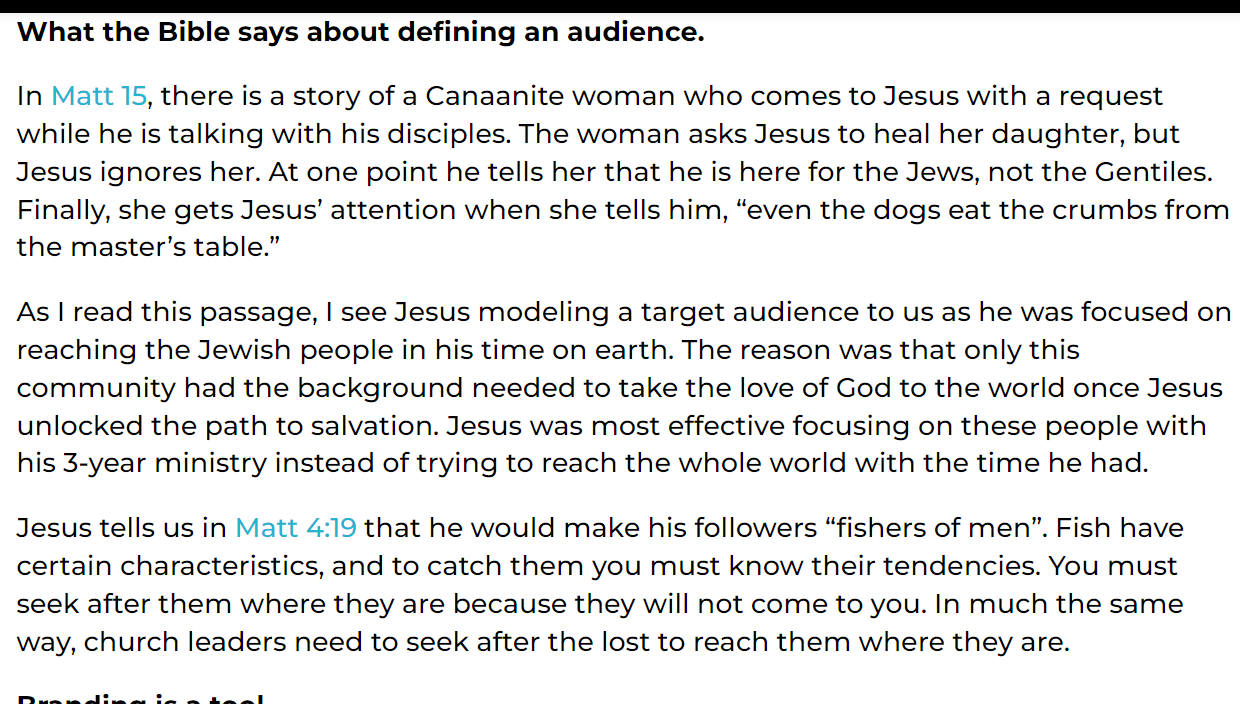
https://www.sdadata.org/digital-evangelism-blog/understanding-your-target-audience-for-effective-communication

Scripture Passages

https://churchbrandguide.com/how-to-define-your-churchs-target-audience

https://exponential.org/why-churches-should-utilize-personas-and-target-audiences-on-the-digital-mission-field/

https://www.churchgrowthnetwork.com/freebies2/2020/6/5/v45avm7cmccyhlkyeub2hlbmw7svyc

https://clickmill.co/church-social-media-marketing

Good News: Golden Age for US Jobs Growth (21st Century)

Economists prefer to measure data at business cycle peaks and troughs. After the Millenium Y2K scare, we endured a mini recession. Employment peaked at 132.8 million jobs in March, 2001. Today, in October, 2023, we have 156.9 million jobs, an increase of 24 million jobs in 22 1/2 years, almost 1.1 million new jobs created each year! This is despite the job destroying effects of the Great Recession and the Pandemic.

The longest business expansion in US history ended after 10 years in February, 2020. The pandemic eliminated almost 22 million jobs in 2 months, leaving the economy with just 130.4 million employed, barely above the trough of 129.7 million in February, 2010.

The economy replaced those jobs in just 26 months when the June, 2022 figures were reported! In addition to replacing the first 22 million jobs, the economy has added another 4.5 million jobs in the last 16 months, averaging 280,000 per month or 3.4 million per year! At the same period after the Y2K recession, the economy averaged 2.6 million new jobs per year. At the same period after the Great Recession, the economy averaged 2.8 million new jobs per year. Our economy averages 1 million new jobs per year and can accelerate to 3 million per year when recovering from a recession. The current recovery is stronger than either of the last two.

Another way to gauge progress is to measure jobs added from peak to peak. The economy added 5.6 million net new jobs by December, 2007, or 836K per year. In the 13 years until February, 2020 the economy added 22.7 million jobs, or 1.141M per year. Since then, the economy has added 4.5 million jobs, or 1.240 per year, a very solid result.

Where are the extra 4.5 million jobs? 38 states exceed their pre-Pandemic totals. Texas (1.1M), Florida (750K), California (500K), North Carolina (300K) and Georgia (250K) lead the way. Arizona, Utah, Tennessee, Nevada, South Carolina, Washington, New Jersey and Indiana each added at least 100K, for a total of 4 million by these 13 states. On the downside, New York remains 125K short and Vermont, DC, Hawaii and Rhode Island are more than 2% below February, 2020.

The post-pandemic economy is creating jobs slightly faster than the post-Great Recession economy. 17 states are growing at least 2% faster than their pre-Pandemic trend rate. Idaho, Nevada, Montana, Utah and Florida are growing at least 4% faster than before. 9 states trail their prior growth rates by at least 2%. North Dakota, Hawaii, New York and DC trail their prior growth rates by 4% or more, for various reasons.

During the full 23 years, Texas (4.5M), California (3.3M), Florida (2.7M), New York (1.1M) and North Carolina (1.0M) added the most jobs. Washington, Nevada, Arizona, Utah, Colorado, Tennessee, Georgia and Virginia each added more than one-half million, for a total of 18 million in the 13 leading states. While the nation added 18% more jobs during this period, 9 states grew by 3% or less: Louisiana, Mississippi, Illinois, Michigan, Ohio, West Virginia, Rhode Island, Connecticut and Vermont. These states accounted for more than one in six citizens in 2001, so their weak performances limited the overall economy.

Summary

The economy started the 21st century slowly with a small recession and weak jobs growth during the Bush years. Obama started his first 2 years with a 9 million job deficit before starting a very strong and long 10-year recovery that added 23 million jobs. Economists did not expect the recovery to last during the Trump administration but almost 9 million net jobs were added on his watch before the pandemic. Biden refilled the 22 million lost jobs in 26 months and has added 4.5 million more in the next 16 months. With the Fed’s higher interest rates, job growth is slowing but is generally expected to exceed 1.25 million in 2024. The US economy continues to outperform.

https://www.bls.gov/web/laus/statewide_otm_oty_change.htm

https://www.cbpp.org/research/economy/tracking-the-recovery-from-the-pandemic-recession

https://www.stlouisfed.org/publications/regional-economist/2023/nov/slower-gdp-growth-falling-inflation-us-economic-outlook-2024

https://www.forbes.com/sites/jackkelly/2023/11/18/heres-why-the-job-market-will-improve-in-2024/?sh=eedb8d139ead

https://www.morningstar.com/markets/why-we-expect-job-market-slow-2024

Our Hamilton County: Peer Counties

In 1970, Hamilton County was home to just 55,000 people. It has grown 6-fold since then to more than 330,000. One percent of the nation’s 3,143 counties have experienced similar growth in this 50-year period. These 32 counties combined have grown more than 5-fold from 2.2M (1.1% of US) in 1970 to 11.8M (3.6% of US) in 2020.

8 of the counties are Sunbelt retirement areas. 4 are smaller urban areas. 20 are suburban/exurban counties within larger metropolitan areas.

Each county remains fast growing, issuing an average of 5,000 building permits in 2022 versus an average of 500 per county nationally. Hamilton County’s 5,800 permits is above average.

As a group the counties average 16% of residents aged 65+, ranging from 11% to 25-29% in retirement counties. Hamilton County’s 14% makes it a little younger than the national average of 17%.

The percentage of adults working averages 66% versus 64% for the US as a whole, ranging from 48-54% in retirement communities up to 74%. Hamilton County’s 71% ties for second place.

Median household income at $85,000 for this group is 13% higher than the national average. Hamilton County’s $115,000 is sixth highest. 5 of the retirement counties average less than $70,000. Loudon County records a stunning $170,000.

Poverty rates are the mirror image, at 9% for the group versus 12% nationally. Rates range from 3-16%. Four retirement areas have poverty rates above the national average. Hamilton County’s 4% is tied for second lowest.

The group records 38% of adults with college degrees versus 34% for the nation. 7 retirement counties and Henry County south of Atlanta report 28% or less. Hamilton County’s 61% is second to Loudon County’s 64%.

Average home values are $345,000 for this subset, a solid 22% higher than the $282,000 national average. 10 counties reported prices below the national average, 5 in retirement areas, 4 in suburban counties and Bentonville, AR. 4 suburban counties listed their median home prices above $600K: DC, Sacramento, Nashville and Denver. Hamilton County’s $351,000 was average for the high growth group.

The group averaged 68% non-Hispanic White versus 59% for the nation as a whole. 4 counties had more minorities than non-Hispanic Whites: Ocala, FL, Henry/Atlanta, Prince William/DC and Brazoria/Houston. St. Charles County in the St. Louis Metro area had the highest non-Hispanic White share at 85%. Hamilton County’s 81% was 6th highest.

These 32 counties averaged 10% foreign born, much below the 14% national average. St. Charles County recorded only 3% foreign born. 5 counties reported 20% or higher foreign born: Forsyth/Atlanta, Ocala and Naples, FL, and Loudon and Prince William/DC. Hamilton County’s 9% is a little below the group average.

Summary

Hamilton County is one of 32 counties that have recorded tremendous growth across 50 years. It is relatively young and less diverse than most. It has higher incomes and average housing costs compared with its peers.

Our Hamilton County: Job Growth Is Even Faster than Population Growth

https://www.indystar.com/picture-gallery/news/local/hamilton-county/2023/02/28/inside-republic-airways-new-aviation-campus-carmel/11282362002/

Hamilton County’s employment has grown 16-fold since 1970 from 15,000 to 243,000. This is a 52-year compounded 5.5% growth rate. You aren’t likely to find that growth rate in your stock or mutual fund portfolio!

This growth started from a low base of 1,500 new jobs per year and accelerated to 5,000 new jobs per year by 2000. Hamilton County has maintained this growth rate for 2 decades with some extra results recently!

Hamilton County’s population doubled from 1970 to 1990. Metro Indy, excluding Hamilton County, grew by the same 50,000 people. In the next 30 years, Hamilton County added more than 250,000 people and the rest of metro Indy added a very solid 475,000 people (almost 2X). Hamilton County benefits from the Midwest leading growth of metro Indy.

Hamilton County employment growth has been a little faster than population growth.

Metro US population has grown by 1% annually and employment has grown by 1.6% annually. The Indy metro area has grown at similar rates. Hamilton County has grown 3-4 times faster.

As Hamilton County has grown, its annual growth rate has declined from 7% to 4%, still far above the 1.5-2% baseline growth rate.

Hamilton County has grown from 1/3,000 US people and 1/5,000 US employees to 1/800 citizens and workers. (4-6X growth).

Metro Indianapolis has been a solid job creator. Hamilton County has grown alongside the metro area.

Hamilton County was a “bedroom suburb” in its early days but reached the national level of jobs to population by 1992 and tracked the national average thereafter.

Good News: Metro Indy is a Midwest Jobs Leader, 1990-22

Between 1990 and 2008 US jobs grew by 22% but trailed in Midwest metro areas, increasing by only 14%. US jobs have grown by 9% since the Great Recession, with the Midwest trailing slightly at 8%. Metro Indianapolis has been a percentage growth leader in both periods, at 27% and 18%. Columbus and Kansas City show similar figures. Minneapolis has higher actual jobs added but slightly lower percentage growth on its twice as large base.

Chicago has added more total jobs, but its 18% growth is far behind Indy’s 49% and most of its growth took place back in the 1990’s. Nashville is typically grouped with the Southeastern states but if it was included in the Midwest, it would be the clear winner, nearly doubling its job base in 3 decades.

Really Big Changes in the USA: 1776 – 2026

Population Growth

The US population has grown from 2.5 million in 1776 to 76.3 million in 1900 to 158.8 million in 1950 to 329.5 million in 2020. More than a 100-fold increase, 2+ orders of magnitude.

28 individual metro areas today EACH have a population (2020) equal to or greater than the WHOLE USA in 1776. Pittsburgh, Portland, San Antonio, Austin and Sacramento each have the same 2.5 million residents. Charlotte, Orlando, Baltimore and St. Louis each have a slightly greater 2.8 million citizens. 19 other metro areas today have a significantly larger population.

Declining Rural Population

The US began as 100% rural. By 1900, cities (2,500+) accounted for 40% of the total population. By 1950, city populations were the majority at 60%. In 2020, cities contained 80% of the US population.

Urbanization

In 1776, the US had 5 cities of 10,000 people, led by Philadelphia with 30,000.

By 1900 the nation had 11 major cities with a half-million people or more, led by New York with 5 million and Chicago, Philadelphia and Boston near 2 million. Baltimore on the east coast and San Francisco on the west coast were joined by the Midwest cities of Pittsburgh, St. Louis, Cleveland, Cincinnati and Buffalo to round out this group of early leaders. These 11 exceptions to the still largely rural landscape accounted for one-half of the urban population, 20% of the national population.

By 1950 there were 15 metro areas with a million people or more, up from just 5 in 1900. San Francisco, St. Louis, Cleveland, Baltimore and Buffalo exceeded 1 million as did newcomers to the major city list: Los Angeles (4.4M), Detroit (3.0M), DC, Seattle and Dallas-Ft. Worth. Kansas City, Minneapolis-St. Paul and Houston joined Cincinnati as “major cities” defined as greater than 750K residents. These 19 metro areas contained 50 million people, 31% of the nation’s total and a little more than half of all urban residents. Led by New York’s 13M, the east coast metros totaled 22 million people. Led by Chicago’s 5M, the Midwest metros were close behind with 18 million people. The 3 west coast cities combined for 8 million while the Sunbelt’s 3 cities amounted to just 2.5 million people.

For 2020, we use 2 million as the minimum size for a major metropolitan area. New York (20M), Los Angeles (12M) and Chicago (9M) led the way. Dallas-Fort Worth, Houston, Washington, DC, Philadelphia, Atlanta and Miami all had at least 5 million citizens. 15 new metro areas joined the list, beginning with 6 on the west coast: Phoenix, Riverside-San Bernardino, San Diego, Portland, Sacramento and Las Vegas. The others are widely distributed across the country: Tampa, Orlando, San Antonio, Austin, Columbus, Indianapolis, Charlotte, Nashville and Denver. These 35 metro areas account for nearly one-half of the country’s total population of 330 million. The 4 major regions were relatively evenly balanced: east coast (40M), Midwest (37M), west coast (45M) and sunbelt (43M).

One-half of Americans now live in one of the 35 major metropolitan areas, amounting to 162 million people. That compares with 50 million people in 19 areas in 1950 and 15 million people in 11 areas in 1900. The character of American life has shifted from rural to urban to metropolitan.

https://www.skyscrapercity.com/threads/largest-us-metropolitan-areas-1900-1950.913696/

https://en.wikipedia.org/wiki/Metropolitan_statistical_area

Greatly Increased Diversity

https://en.wikipedia.org/wiki/Historical_racial_and_ethnic_demographics_of_the_United_States

https://www.npr.org/2021/08/13/1014710483/2020-census-data-us-race-ethnicity-diversity

The White, non-Hispanic population has typically been 80-89% of the total. It has fallen rapidly to 58% as Hispanic, Asian and multi-race claimers have increased their shares of the population.

The share of immigrants reached a high of 15% from 1870-1910, dropped to 5% in 1960-1970 before reclimbing back to 15% recently.

Amazing Real Economic Growth

The growth in the size of the US Gross Domestic Product (GDP), the value of goods and services produced in the country, from 1776 to today is essentially incomprehensible at 19,000 times its original size. The population has grown 132-fold, from 2.5M to 330M. Real, inflation-adjusted GDP per person has averaged 2.0% per year across long periods of time. Due to compounding, this 2% becomes 2.7 times in 50 years, 7.25 times in 100 years, 52.5 times in 200 years and 141 times in 250 years.

https://www.khanacademy.org/economics-finance-domain/macroeconomics/macro-economic-indicators-and-the-business-cycle/macro-business-cycles/a/tracking-real-gdp-over-time-cnx

https://fred.stlouisfed.org/series/GDPC1

Ag and Manufacturing Down, Services Up

https://www.stewart.com/en/insights/2020/07/08/u-s-supersector-employment-changes-from-1950-to-2020.html

Post-War Growth of Large Corporations

In 1955 the 11 corporations at the middle of the newly created Fortune 500 listing averaged $123 million of annual revenue. Adjusting for inflation (GDP deflator), they would have revenues of $939 million today. Comparable revenues in the latest Fortune 500 listing are $15.6 billion, a 16.6X increase.

https://money.cnn.com/magazines/fortune/fortune500_archive/snapshots/1984/3574.html

https://www.50pros.com/fortune500

Over this same period total national real GDP has increased from $3.1 trillion to $21.8 trillion; 7.1 times as large. Large US-based corporations have grown twice as fast as real US GDP.

Summary

Small annual percentage changes add up to become transformations through time.

We see this in population, race, immigration, occupations, industries, urbanization, productivity, output and concentration of businesses.

The population and production scale, complexity, trade, product innovation and diversity of the US is beyond any expectations of the founders of the country. The country and its social, political and economic institutions have survived and adapted to allow the country to thrive for almost 250 years. Further adaptations may be needed to support such continued growth and success.

Indiana Population Growth: 1970-2050

https://www.colts.com/game-day/stadium/

The last official forecast of Indiana’s population was made in 2012, estimating growth from 6.5M in 2010 to 7.5M in 2050. The actual population was a little higher than this forecast in 2020. My forecast is for 7.7M in 2050.

https://www.ibrc.indiana.edu/ibr/2012/spring/article1.html

Indiana was and is an agriculture and manufacturing intensive state. Population growth slowed in the 1970’s and 1980’s before recovering in the 1990’s. Indiana added 1.2M people in the 30 years from 1990 to 2020, growing by 7% per decade, about one-half of the national average, but faster than its neighbors.

I expect the 2010-2020 growth levels to continue for the next 3 decades.

Indianapolis (Marion County) is the only major city in Indiana. It was also manufacturing intensive at the end of the 20th century. Its population growth stagnated in the 1980’s and 1990’s before recovering.

Indy’s suburbs were immaterial in 1970, but have grown to be nearly as large as the main city in 2020.

The total Indy metro area grew by 80% from 1990 to 2020 and is expected to grow at the same rate for the next few decades.

Like metro areas across the country, Indianapolis has grown much faster than the rural counties of Indiana.

Lake County (Gary) in the northwest corner of Indiana is the second largest metro area of Indiana. Its population dropped drastically from 1970 to 1990 and has slowly recovered. This manufacturing intensive area is not considered a highly attractive Chicago suburb, but it has found sources of growth.

The four counties east of Lake County are a separate economic area and have grown since 1970 at a reasonable pace.

The I-90 corridor’s population was the same size as metro Indianapolis from 1970-1990, but their growth paths diverged afterwards.

Historically, Ft Wayne has been the third largest Indiana city. It was also a manufacturing leader, which slowed its growth in the 1980’s and 1990’s. It has since recovered and established a strong growth rate.

Indiana has 6 other minor cities that have collectively accelerated their growth since 1990. Tippecanoe and Monroe Counties benefit from their state universities. Columbus (Bartholomew) is a manufacturing leader supported by its proximity to IU and Indianapolis. Clark County is a suburb of Louisville. Evansville (Vanderburgh) has struggled to find a new economic engine due to its small size and remote location, despite the extension of I-69. Terre Haute (Vigo) has also been slow to find new engines of growth to replace its historic manufacturing strengths.

These 18 larger counties (of 92) have collectively driven almost all of the population growth in Indiana for the last 30 years. These trends are expected to continue for the next 30 years.

A broad swath of 13 counties north, east and northeast of Indianapolis have seen population declines in the last half century and will likely experience further declines. The natural gas boom, Wabash River transportation advantage and national road (US 40, I-70) advantage drove manufacturing in these areas in the early twentieth century. General Motors grew and then declined. The Ball Corporation grew and declined. Muncie was the subject of the famous Middletown sociology studies of the typical American community and this area, and the greater Indianapolis area have remained targets of marketing and political research studies. Logansport, Peru and Wabash along the river. Marion, Anderson and Muncie. Hartford City, Portland, Randolph, Richmond, Connersville, Newcastle and Rushville. The 61 other Indiana agricultural counties managed to grow slowly from 1970 to 2000 but found their limits afterwards.

In the modern world, local economies must find “critical mass” in order to succeed. Metro Indy is doing well. The I-90 corridor near Notre Dame is surviving as are the other mini-metro areas. The other 74 counties are stagnant.

50 Greatest Technical Inventions of All Time

15/50 Started 2 Millennia Ago

Beer and wine.

Brass, iron, nails, steel; steel alloys, Bessemer process.

Bricks, cement, concrete, asphalt; reinforced concrete.

Compass; marine chronometer.

Domesticated horses and animals.

Farming.

Fire; fire extinguishers.

Language, writing, alphabet.

Paper.

Plow; steel plow.

Ships, sailboats.

Swords, weapons, gunpowder, matches; gatling gun.

Tools.

Waterpower, water control, indoor plumbing, toilets, drainage, aqueducts.

Wheel, chariot, water wheel; pneumatic tires.

Circa 1000 – 1500

Mechanical clocks and watches.

Paper currency; ATM (1950).

Printing press, movable type, linotype, typewriter.

Lenses, mirror, microscope, telescope, magnifying glass.

Circa 1800

Electricity generation, turbines, batteries, electric motors.

Steam engine, turbine.

Internal combustion engine, automobile, tractor.

Railroad, locomotive.

Anesthesia.

Distilled oil products, diesel, kerosene and gasoline.

Telephone.

Circa 1900

Airplane

Automobile

Camera; digital camera

Electric light bulb; fluorescent, LCD, LED

Moving pictures

Phonograph

Radio

Refrigeration

Vaccines

Medical diagnostics: X-Ray; MRI, CT scan

Antibiotics, penicillin

Circa 1950

Electronic computer, Turing machine, personal computer; after arithmetical machines, abacus and slide rule.

Contraceptives

Geographical positioning system, (GPS) and mapping.

Vacuum tubes, integrated circuits, semiconductors and microprocessors.

Nuclear fission, fusion, power and bombs.

Television.

Circa 2000

Genetics, gene editing, DNA.

Mobile phone networks, infrastructure and personal devices.

Internet communications network.

World wide web addressing structure.

Artificial intelligence.

Smartphones.

Summary

The greatest technical innovations of humanity cover a broad range of life: food/cooking, construction, travel, transport, household, finance, science, power, medicine, entertainment and calculation.

We have a dozen major inventions in both of the 19th and 20th centuries. Change appears to be accelerating…

https://ehistory.osu.edu/articles/greatest-inventions-past-1000-years

https://startupguide.com/the-40-greatest-innovations-of-all-time

https://www.livescience.com/33749-top-10-inventions-changed-world.html

https://bigthink.com/the-present/inventions/

https://www.cadcrowd.com/blog/top-100-famous-inventions-and-greatest-ideas-of-all-time/

https://www.history.com/news/11-innovations-that-changed-history

https://www.scientificamerican.com/article/inventions-what-are-the-10-greatest-of-our-time/

https://interestingengineering.com/lists/19-great-inventions-that-revolutionized-history

https://interestingengineering.com/lists/35-inventions-that-changed-the-world

https://pickvisa.com/blog/best-inventions-in-the-world

https://www.inc.com/paul-grossinger/what-are-the-25-greatest-inventions-of-all-time.html

https://techengage.com/top-tech-innovations-in-history/#2-pascaline-1642

https://www.visualcapitalist.com/wp-content/uploads/2015/04/worlds-greatest-inventions.html

https://creativepool.com/magazine/inspiration/top-25-most-inspiring-creative-inventions-and-products-of-all-time.25588

How Hamilton County, Indiana Grows

Hamilton County, Indiana is north of Marion County and Indianapolis. It has grown seven-fold since 1970, from 54,000 to more than 365,000 people. It now ranks in the top 7% as the 209th largest county of the 3,142 in the US. It is the fourth largest of Indiana’s 92 counties, trailing Marion (Indianapolis), Chicago’s suburban Lake County and Allen County (Ft. Wayne) which it will surpass for third place in 2029.

The county has averaged a 7,800 person annual increase since 1990 and has maintained a 7,500-person annual increase in the last decade.

Growth reached a peak of 12,000 per year prior to the Great Recession, dropped back to 7,000 per year and has slowly grown to 8,000 per year.

As a growing suburban area, the county has benefitted from a younger population with relatively more births and less deaths. This demographic advantage has decreased through time.

On average, this natural increase advantage has provided 2,000 additional people each year for the last two decades. The net in-migration level was over 8,000 before the Great Recession, dropped in half to 4,000 before recovering to about 6,000 people per year.

The US Census Bureau’s American Community Survey (ACS) attempts to measure the annual migration flows between all 3,142 counties! It’s survey techniques generally require a 3-5 year sampling period to have statistical reliability. The US Census Data and the Indiana Vital Statistics Data (Births and Deaths) show an implicit net in-migration to Hamilton County from 2011-20 of 4,575 annually. The ACS reports just 3,124. The actual increase is 144% of the surveyed increase.

https://www.census.gov/topics/population/migration/guidance/county-to-county-migration-flows.html

https://www.stats.indiana.edu/vitals/

https://wonder.cdc.gov/controller/datarequest/D158

Cross-County Migration

Hamilton County’s population ranged from 283-346,000 between 2011-20, for an average of 314,000. Inbound migration averaged 23,600 per year or 7.6% of the population. Outbound migration averaged 20,400 per year or 6.6% of the population. On average, the county’s population turns over every 15 years. The net in-migration in the ACS survey was 3,100, a little more than two-thirds of the implicit 4,600 net in-migration per year. I compared the 2011-2015 and 2016-2020 data and found that they were generally consistent. I believe that the proportions reported are generally accurate.

International In-Migration

ACS reports an annual average of 1,800 international immigrants. This is 59% of the net 3,100 figure; quite material. On an annual basis, this is just 0.6% of the county population, but for a decade it is 6%. 61% of Hamilton County’s international immigrants report Asia as their home continent.

Total US Migration

Net in-migration to Hamilton County from the US is a positive 1,300 per year in the ACS survey, perhaps 1,900 including the 1.46X factor. Net domestic net in-migration is two-thirds the size of international net in-migration; 0.4% annually or 4% per decade.

48 States Aside from Indiana and Illinois

Net in-migration to Hamilton County from the other 91 counties in Indiana plus Illinois averages 3,004 per year, essentially equal to all of the total net in-migration. Net in-migration to Hamilton County from the other 48 states is a negative 1,700 per year, roughly one-half of the positive overall net in-migration figure. Hamilton County receives minor positive inflows from the adjacent states of Ohio, Michigan and Kentucky. It sends 1,000 residents to Texas each year and receives just 400 in return. Texas accounts for one-third of Hamilton County’s net out-migration aside from Indiana and Illinois. Hamilton County exports 1,200 residents annually to Florida but an equal 1,200 return each year.

Chicago, Illinois

In the last decade 1,500 people annually moved to Hamilton County from Illinois (Chicago) and just 700 returned the favor. Hamilton County received a net 800 residents from Illinois each year in the past decade. This is one-fourth of the net in-migration to Hamilton County. Many Hamilton County college graduates make Illinois their first professional home, so the flow of experienced professionals from Chicago to Hamilton County is probably more than 1,500 per year.

Marion County, Indiana (Indianapolis)

Hamilton County’s Carmel, Fishers, Westfield and Noblesville claim that they are “edge cities” somewhat independent of Indianapolis. In the last decade a net 3,300 migrants from Marion County chose to make Hamilton County their home each year, accounting for more than ALL of the ACS survey’s 3,100 annual increase. Marion County has nearly 1 million people and continues to grow slowly despite this 0.3% annual leakage to Hamilton County.

College Students

Hamilton County school graduates have very high college attendance rates. Hamilton County exports 2,600 students each year to IU, Purdue and Ball State and receives 1,000 back, for a net out-migration of 1,600 per year, about one-half of the net in-migration figure.

Indiana

Hamilton County has a minor net in-migration from sparsely populated Boone County to its west (300/year). It’s net in-migration with the 8 nearby counties, including Boone, is a 500 loss. Hamilton County is an attractive suburban destination, but net net it loses 500 residents annually to nearby counties other than Marion.

Setting aside Marion County and the 3 university counties, Hamilton County attracts 500 new residents annually from the other 87 Indiana counties.

Summary

Hamilton County enjoys a 2,000-person annual natural population increase due to its relatively young age profile. Half of its 6,000-person annual net in-migration is driven by international immigrants attracted to its schools, amenities, services and culture. Most of its remaining growth is driven by nearby Marion County residents who are seeking the same results. Hamilton County is attracting residents from Chicago as retirees, commuting residents or transplants. Hamilton County loses about 2,000 college students each year who migrate into a national labor market. This is an opportunity for further population growth. It also shows that the net 3,100 growth per year figure understates the attractiveness of this county to all potential migrants.

Mostly Good News Since the 2008 Great Recession

https://content.time.com/time/specials/2007/article/0,28804,1733748_1733756_1735278,00.html

Real, after inflation, Gross Domestic Product is up by one-third, despite the pandemic. That’s 2% annually, despite the Great Recession and the pandemic. The US economy is very solid.

A 21% increase in per capita income during this time. Quite solid and constant growth.

Inflation averaged a bit less than 2% before the pandemic, spiked to 8%, and has since declined to 4%. Experts disagree on whether it will return to 2% soon.

Gas prices are the most obvious component of inflation. They are largely driven by global supply and demand. Prices today are the same as in 2011-14, despite the general inflation increase of more than 20% since then.

Despite the pandemic, US unemployment is at a 50 year low!

Job seekers today encounter 3 times as many job openings.

Core age labor force participation has snapped back after the pandemic.

Investment values have doubled.

The number of millionaires and billionaires in the US has continued to increase.

Personal savings rates rose from 6% to 9% before the pandemic, shot up and fell back down to just 4% recently.

Housing values have doubled since the Great Recession.

Mortgage rates averaged 4% after the Great Recession, dropped to 3% and then increased to 6%+ as the Federal Reserve raised interest rates.

US exports have nearly doubled in 14 years.

Despite the Trump tariffs, which Biden has maintained, imports have also nearly doubled.

Despite historically slower growth rates, higher budget deficits and looser monetary policies, the US dollar is more highly valued today than in 2008.

Foreign countries still see the US as a positive ally, despite their concerns during the Trump era.

Obama returned the budget deficit to a “reasonable” 3% by 2016. Trump expanded it to 5% and then 15% as the pandemic struck. Biden drove some recovery to 5% by 2022, but has not driven further reductions.

US coal production is in a long-term decline.

Natural gas production has nearly doubled in 14 years.

Net farm income has been significantly above the base for 6 of the last 14 years, despite lavish Trump farm subsidies.

Manufacturing employment has continued to rise slowly in the last 14 years against the headwinds of international competition.

It’s difficult to put the pandemic in perspective, but here we see a 2-year reduction in expected lifespans. Opioid deaths and so-called “deaths of despair”, alcohol, drugs, suicide, also play a role.

Birth rates continue to drift lower as seen in all regions of the world.

The number of retirees has increased by more than 50%.

Retiree incomes are up by one-third, matching inflation.

Prospective retirees have doubled their cumulative savings.

The abortion rate has continued to fall in the last 30 years.

Church attendance has dropped from 40% to 30%.

Summary

The US economy recovered slowly after the Great Recession and then very quickly after the pandemic. Real, after inflation, output and per capita output increased. The labor market became very tight. Asset prices (investments and housing) rose for intrinsic and monetary reasons. The US remained a competitive international producer. The federal budget deficit was better at the end of the Obama period but worse for Trump and Biden. The pandemic reduced life expectancy and households had fewer children. Successful retirements grew and will grow. Social trends continue, uninterrupted by political positioning and policies.

Perceptions of the country and the economy are increasingly shaped by partisan political party views. Nonetheless, the US economy continues to grow and thrive.