Economy: Solid Landing

https://aviationweek.com/defense-space/sticking-landing-us-navy-software-eases-aircraft-carrier-landings

It’s time to revisit the state of the US economy. The media and stock market are overreacting to the positive news today that the US economy added about 250,000 jobs in September. Pundits and investors deem this as a “too hot” labor market which will drive higher inflation and force the Federal Reserve Board to further increase interest rates to slow the economy. We need to look at history, components of the economy and specific measures carefully to evaluate our position.

In a nutshell, the US Congress and President spent so much to offset the pandemic that we have classic inflation from higher demand and lower supply. At the same time, the Fed increased the money supply and lowered interest rates to zero to ensure that the banking sector did not provide a “credit crunch” to businesses or households. Foreign governments and banks acted similarly. This allowed the world economy to work through the pandemic with minor negative effects. However, the boost to the economy was too much and governments and central bankers were slow to reduce the stimulus they provided. The world was tightly focused on “recovering” to the pre-pandemic GDP and employment levels during 2021, so major changes in government spending and the money supply were not implemented until near the end of 2021. By the start of 2022, it was clear that growth was unsustainable and inflation was rising quickly, so policy makers needed to adjust. They have now done so and the impacts can be seen. So far, the economy is slowing, official recession or not, to low/zero growth and looks to remain at that level through the end of 2022 with low/slow growth expected in the first half of 2023.

We can call this a “soft landing”. We can call this a “growth recession”. We can call this a “recession” or a “recessionette”. There is no evidence of a “major recession” with 2% GDP declines or 3% unemployment rate increases or “50% declines” in housing starts or bank lending freezes or massive industry balances to liquidate or … Inflation is high and seems to have peaked. It is not coming down as quickly as most experts (or me) predicted during the first half of 2022, but many factors indicate that we are not in a self-perpetuating inflationary spiral.
https://fred.stlouisfed.org/series/GDPC1

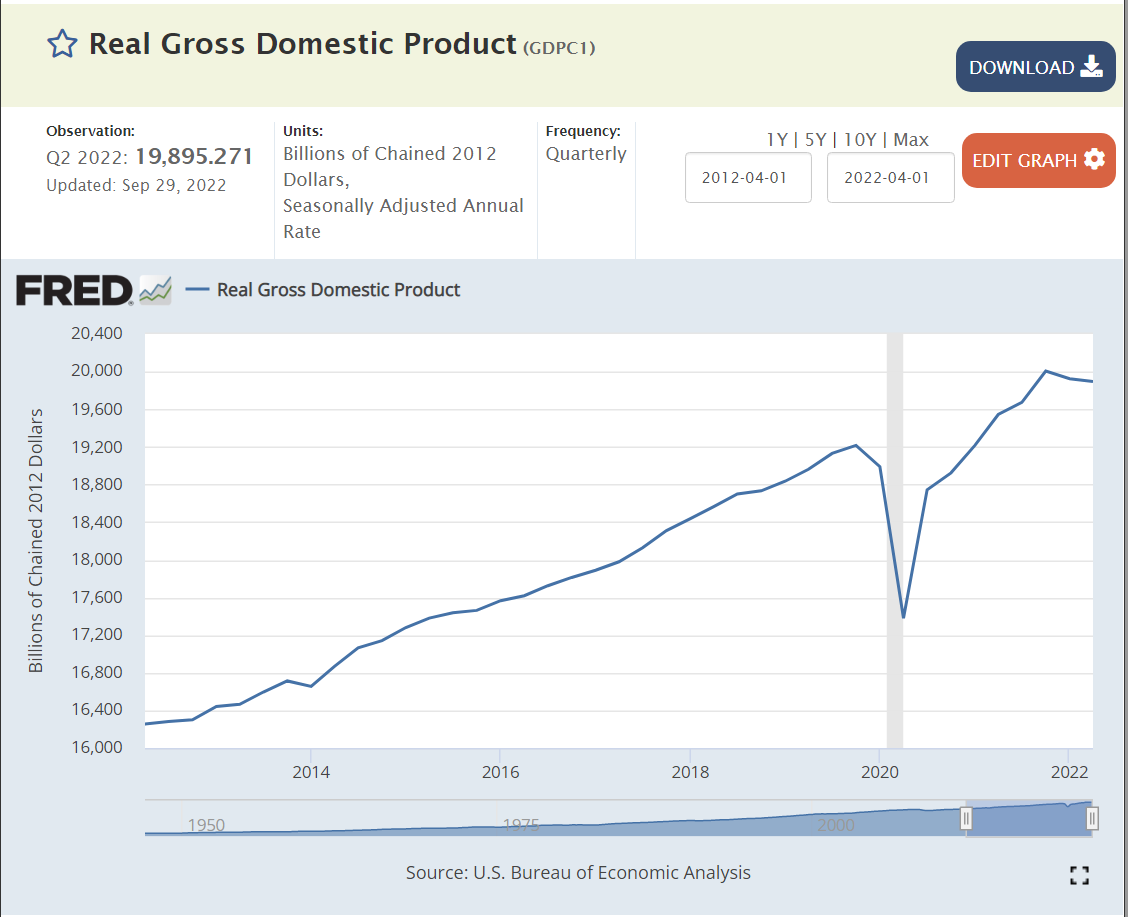
With the benefit of hindsight, real GDP growth during 2018-19 was somewhat above trend and unsustainable. A 2% excess output doesn’t seem like much, but it does matter. The economy at the end of 2021 was in roughly the same place with 3.5% style unemployment. 4Q, 2021 was more than $1 trillion higher (5%) than 4Q, 2020. 5% real annual economic growth is very rare for a large, modern, developed economy. This was after the immediate pandemic bounce. The 3rd and 4th quarters of 2022 are likely to be reported as essentially flat with the 2nd quarter. Consensus forecast is near zero growth in the first half of 2023, returning to 2-3% growth in the second half.

https://www.conference-board.org/research/us-forecast#:~:text=This%20outlook%20is%20associated%20with,percent%20year%2Dover%2Dyear.

https://seekingalpha.com/article/4514734-soft-landing-in-economics

https://www.npr.org/2022/07/24/1112770581/inflation-recession-soft-landing-rates-jobs-fed

https://www.washingtonpost.com/business/energy/why-fed-aim-is-growth-recession-a-not-soft-landing/2022/09/01/c85e9eb8-29c3-11ed-a90a-fce4015dfc8f_story.html

https://www.cnn.com/2022/09/26/investing/premarket-stocks-trading

https://www.bloomberg.com/news/articles/2022-09-13/jpmorgan-says-soft-landing-not-recession-base-case-for-markets

https://fred.stlouisfed.org/series/FYFSD

Federal spending added $2 trillion to aggregate demand in each of the first two pandemic years. In retrospect, too much extra demand.

https://www.cbo.gov/publication/58416

US government budget deficit will be $2 trillion lower in the fiscal year ending September, 2022. This is good news. The “excess” spending was capped more than one year ago, so the trend rate is part of the current core economy. “Excess government spending” is not driving inflation today. It contributed to the inflationary build-up during 2021 into the first half of 2022 (economic stimulus works with a lag effect).
https://fred.stlouisfed.org/series/PCEDG
https://fred.stlouisfed.org/series/CUSR0000SAD

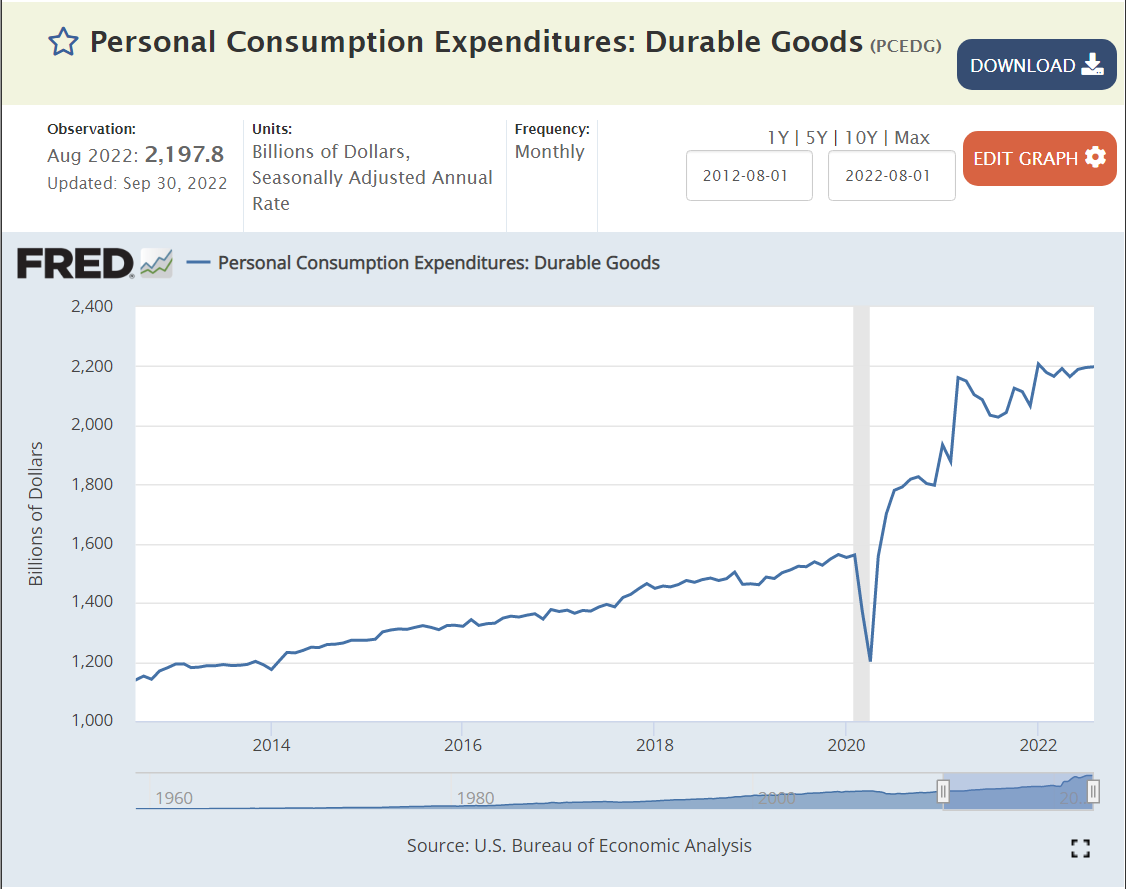
The increased money in consumers’ pockets lead to a 30% increase in purchases of durable goods. Consumers had money. They were afraid to consume in-person services. They bought stuff. They’re still buying stuff. The transition from buying goods to buying services has been slower than expected. This has led to extended supply chain disruptions (globally), higher demand for many commodities and increased goods prices which feed higher inflation and higher demand for labor. The total demand for durable goods has flattened and prices have stopped increasing. This is a much-improved situation from late 2021.

https://fred.stlouisfed.org/series/PSAVERT

Consumers did save some of their extra earnings during 2020 and the first half of 2021, but as prices increased and services became available, consumers chose to spend more and reduce their savings rate down to just 4% of income, well below the 7-8% of the prior expansion period. So, part of the “excess demand” in late 2021 was the drawdown of savings. That cannot happen again. It’s possible that low consumer confidence will reduce spending in the next year, but flat spending is more likely.
https://fred.stlouisfed.org/series/ISRATIO

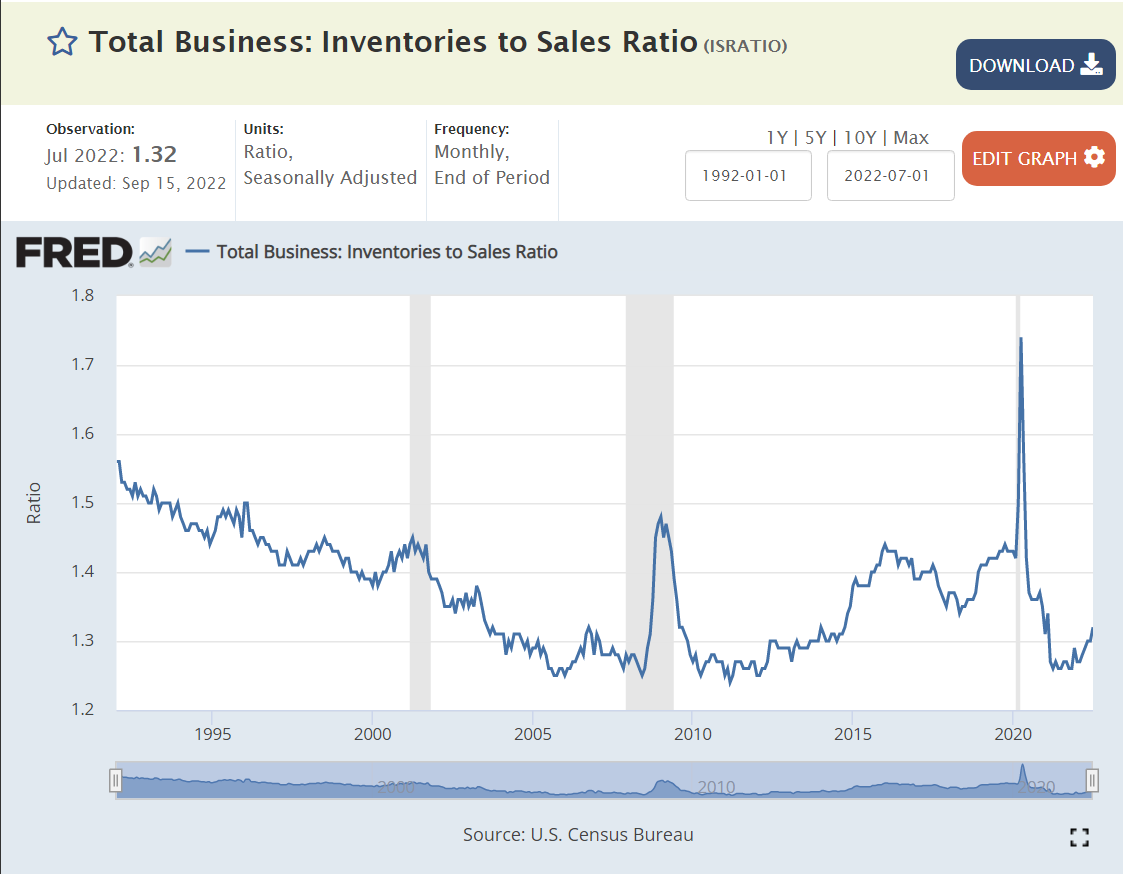
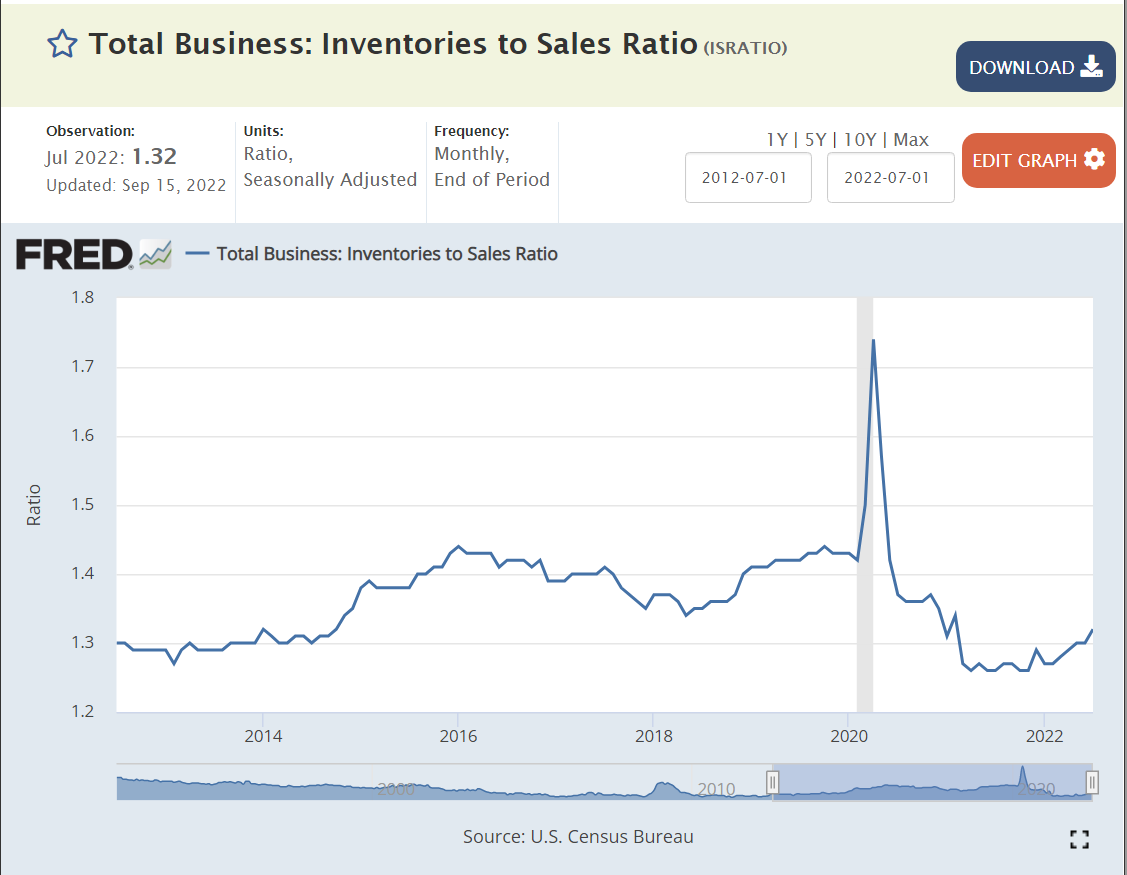
Most business cycle recessions show a clear build-up and subsequent liquidation of business inventories. Inventories were reduced (involuntarily) in the recovery from the pandemic and have increased a bit since then. There is no current indication of a pending “inventory recession”. In a “zero growth” retail holiday sales season, there will be some eternally optimistic retailers that have to cut prices to move goods, but this happens nearly every year.
https://fred.stlouisfed.org/series/WM2NS

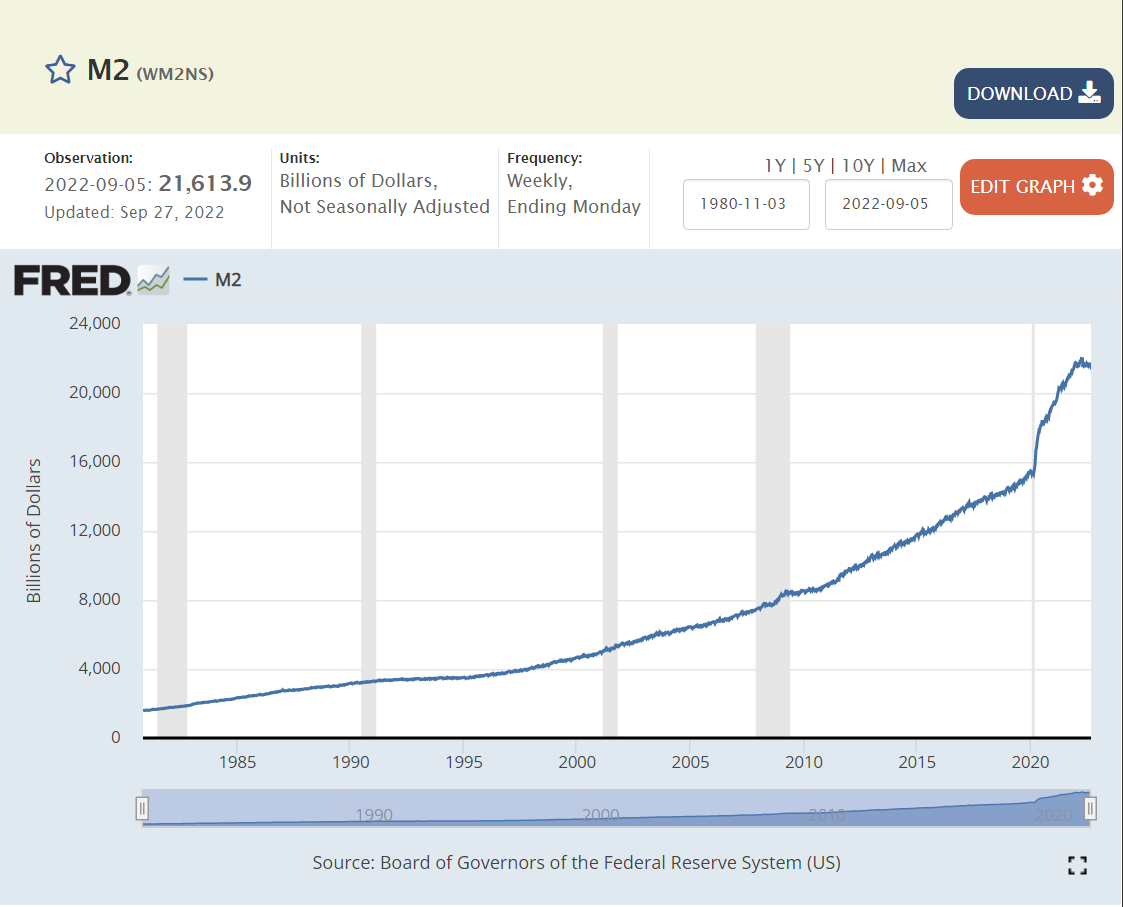
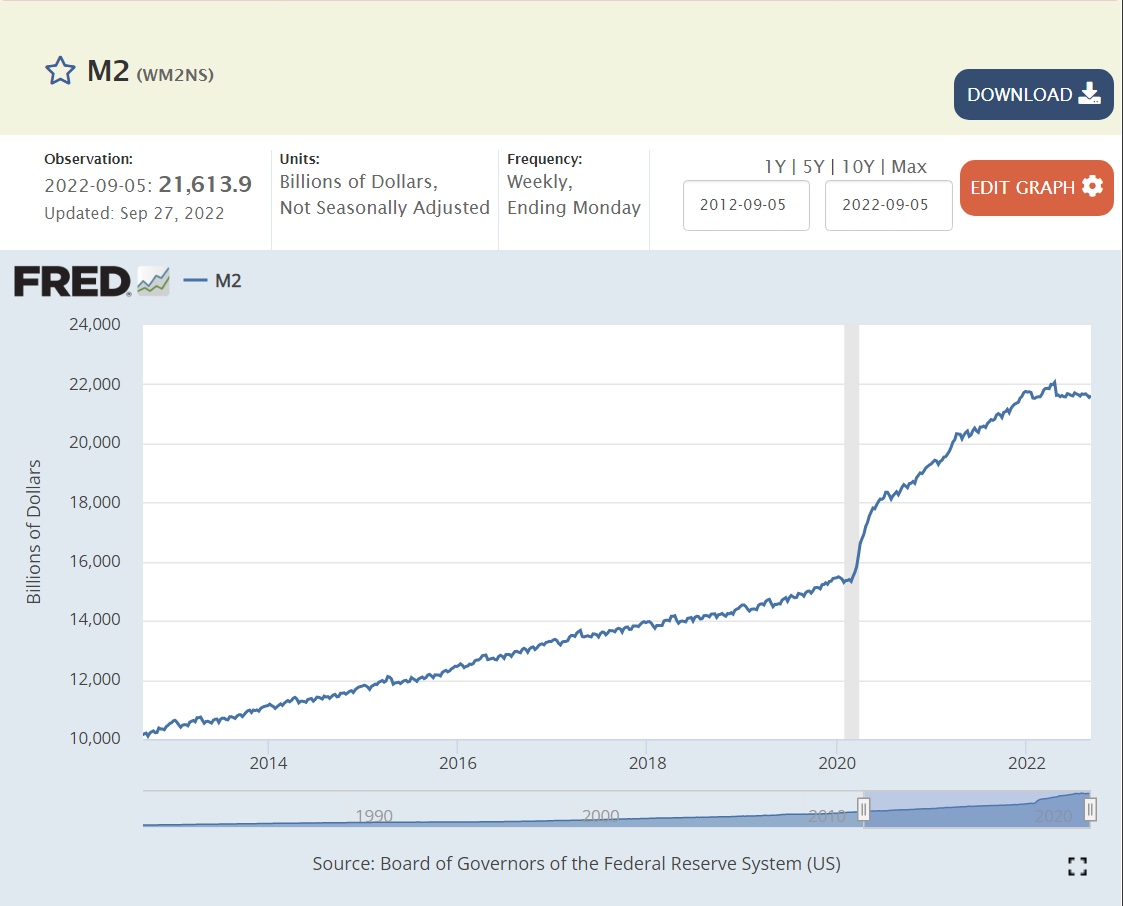
The Fed increased the money supply by an historically unprecedented 25% in response to the pandemic. And then by another 10% during 2021. In hindsight, the 25% was too much and the extra 10% was irresponsible. Fortunately, the money supply growth ended by the fourth quarter of 2021 and has remained flat.
https://fred.stlouisfed.org/series/MORTGAGE30US

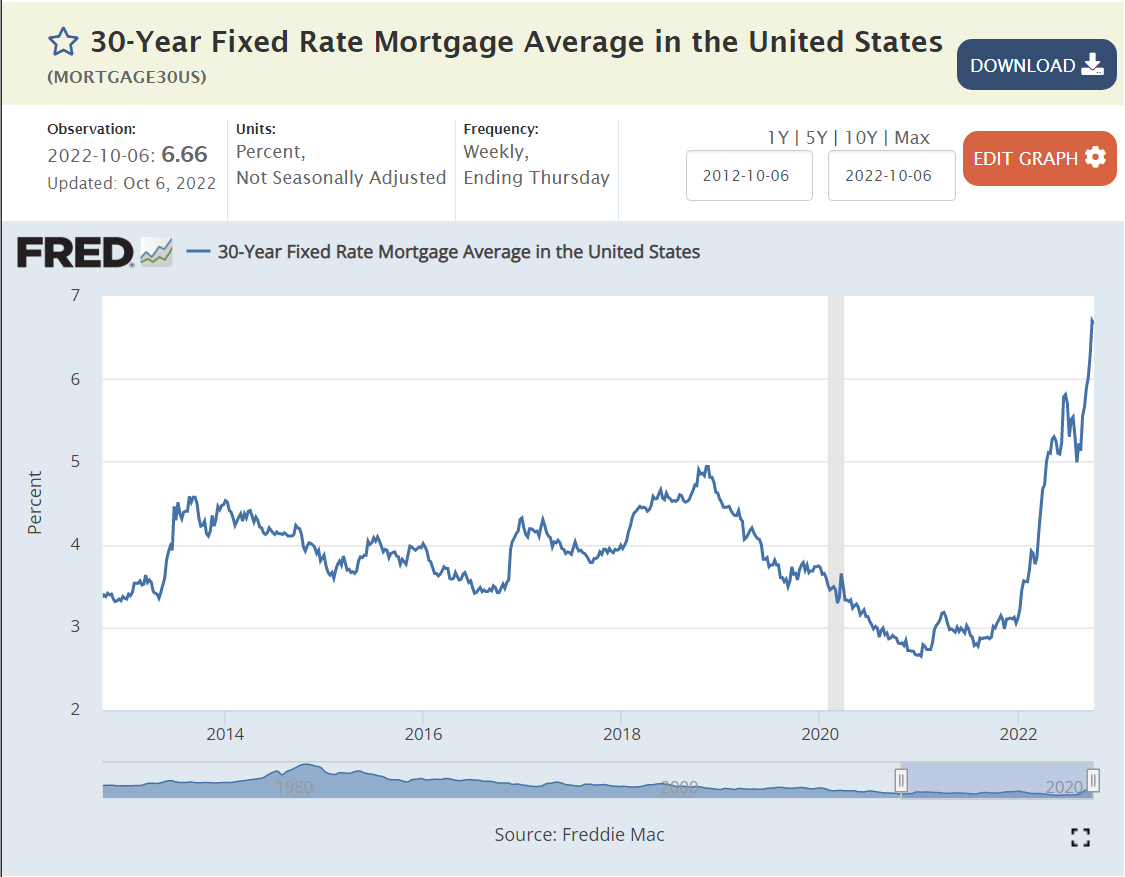
Mortgage rates were held to less than 3% for 2 years to support the recovering economy. They have now more than doubled, in excess of 6%. These higher interest rates will slow economic activity in many dimensions: lending, home buying, consumer credit, consumer spending, business investment, risk taking, stock prices, etc. Higher interest rates work with a lag to slow economic activity. They were still at “crazy low” rates at the end of 2021. The impact of higher rates is now being felt.

https://fred.stlouisfed.org/series/MSPUS
https://fred.stlouisfed.org/series/MSPNHSUS

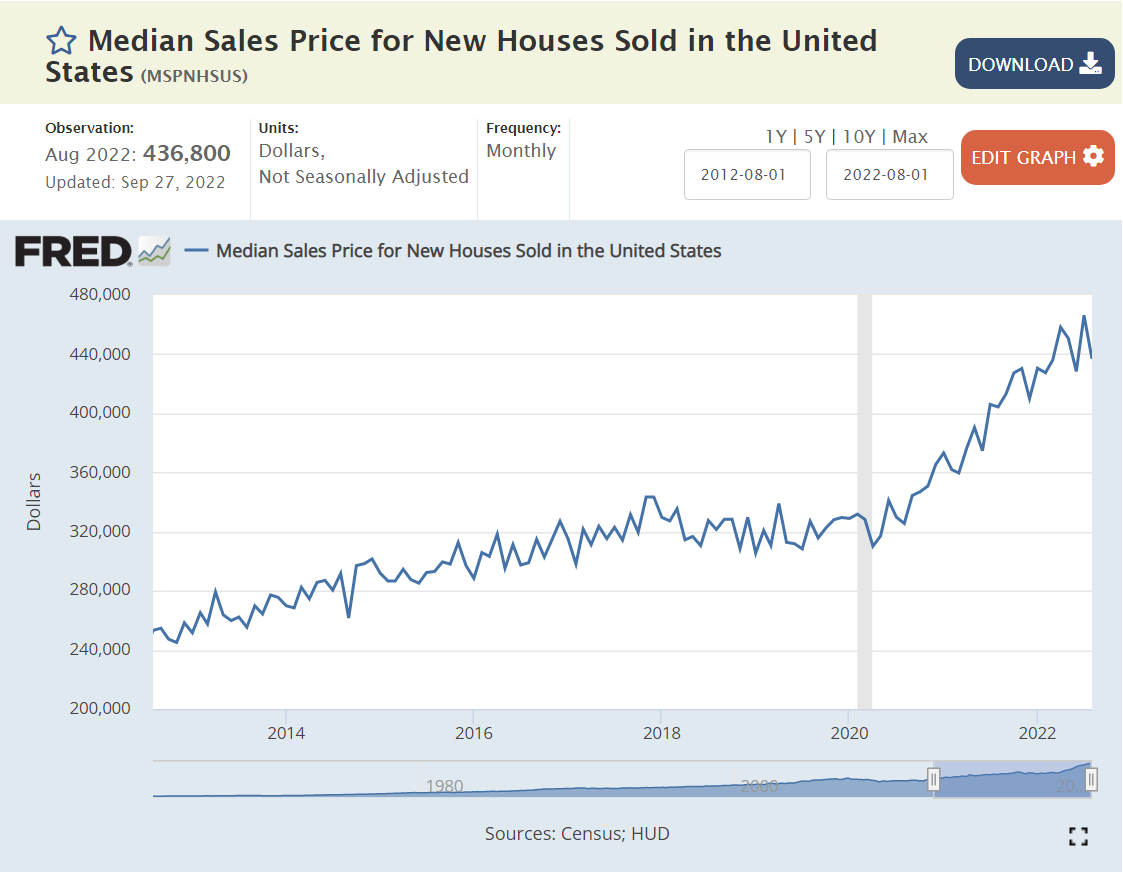
With extra savings, higher earnings, lower unemployment, restricted services available and historically low mortgage rates, consumer demand for housing grew rapidly while supply increased marginally. Housing prices (and rents) grew by 30%. Demand has now slowed. Housing inflation has slowed, perhaps to zero. This is a major channel through which GDP is decreased and inflation is reduced. Home purchases usually trigger thousands of dollars of additional move-in and fix-up expenditures.

https://www.nar.realtor/blogs/economists-outlook/existing-home-sales-decline-5-4-as-home-prices-continue-to-rise-in-june-2022
https://fred.stlouisfed.org/series/HOUST

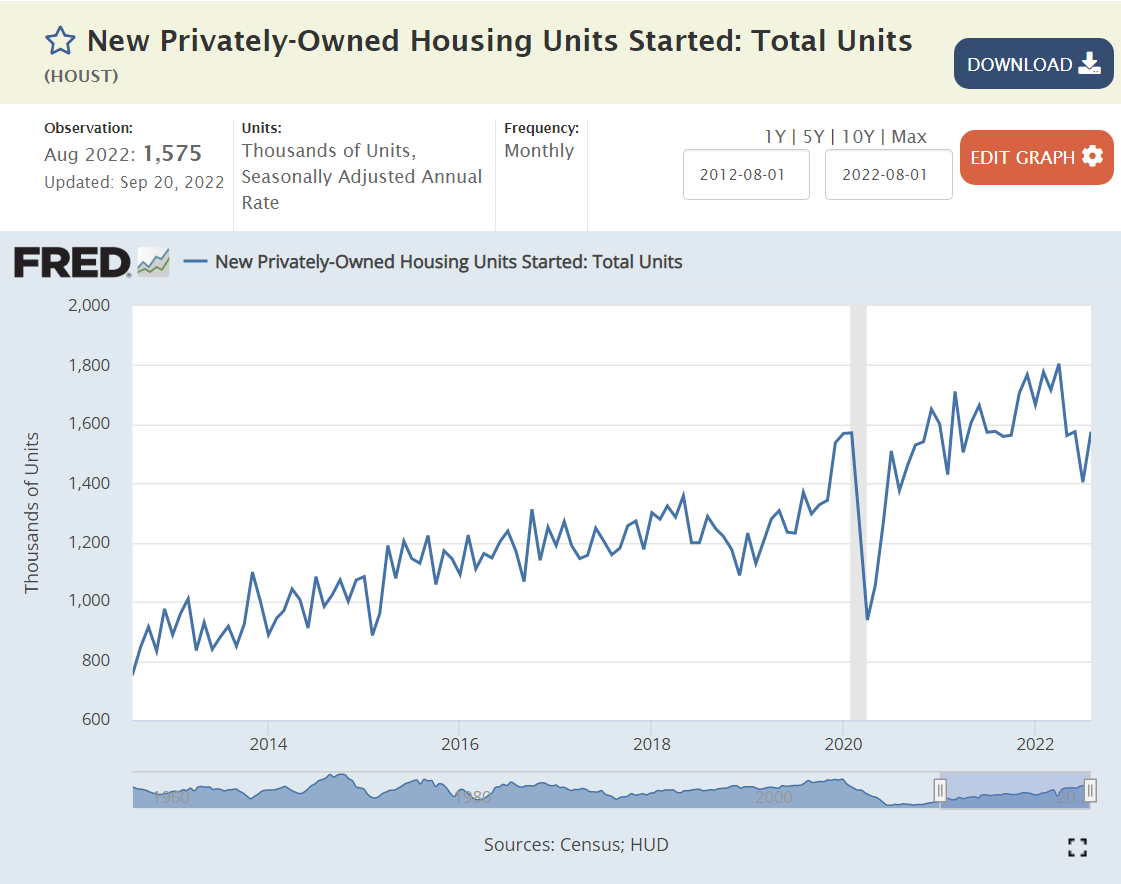
Housing sales and new housing starts have adjusted to the new interest rate environment. Note that the level of new housing starts remains above the pre-pandemic level, so some further decline is possible in the second half of 2022.

https://fred.stlouisfed.org/series/CP
https://fred.stlouisfed.org/series/SP500

The US and global stock markets very quickly rebounded from the initial pandemic fear levels (-25%) back to the pre-pandemic levels which were more than 10% above the 2018-19 trend line. Stock markets increased after the initial pandemic recovery by 50% in line with growing profits. They have since dropped by one-quarter, a combination of lower expected future profits and higher interest rates increasing corporate financing costs and the cost of equity investors’ funds. Lower stock market prices usually have a negative “wealth” effect, with nominally poorer investors spending less in the current economy.

https://fred.stlouisfed.org/series/CPIAUCSL#0

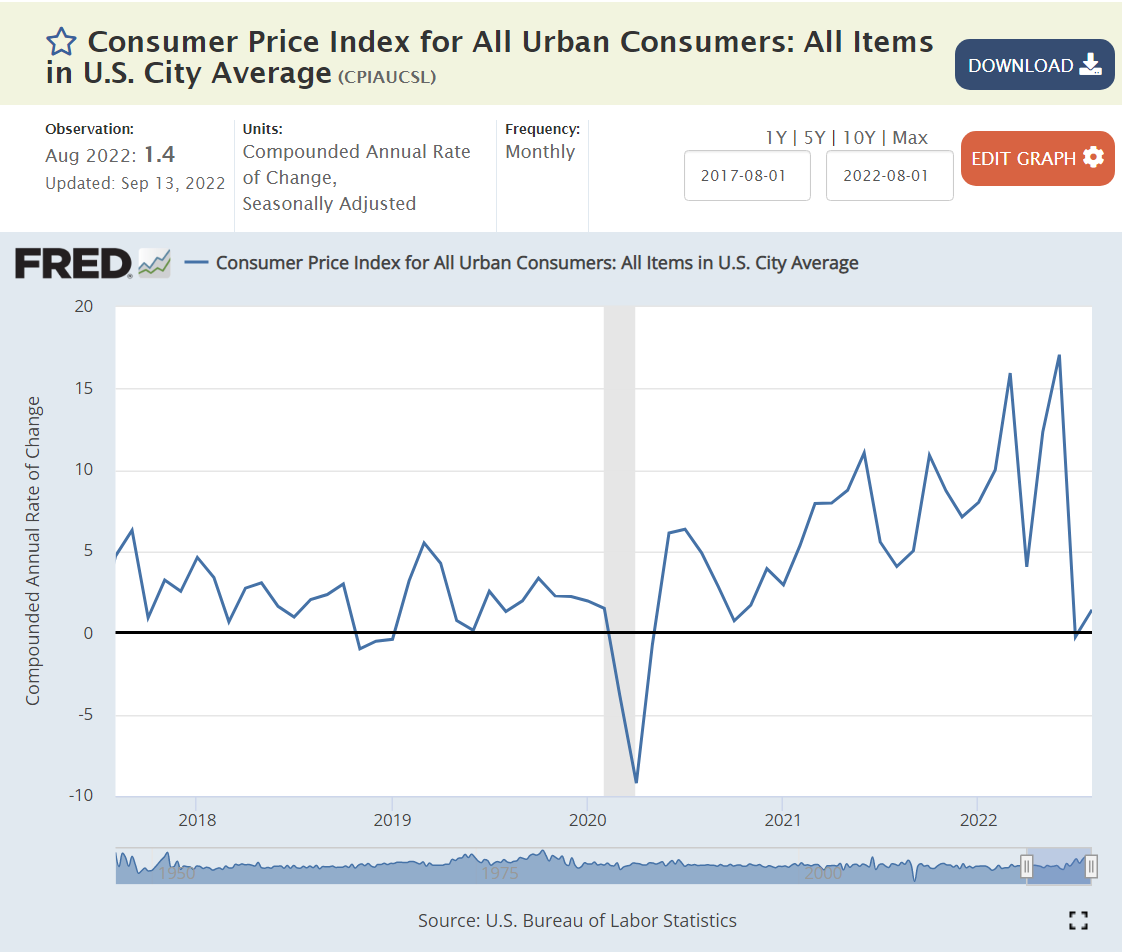
By the second quarter of 2021 we started to see 7-10% annual inflation rates. Increases finally slowed (or stopped) in the last 2 months. Reported inflation on a 12 months apart basis will remain above the 2% target level for the next 9 months, as high monthly inflation during the end of 2021 and the first half of 2022 remains in the measurements. Experts have a wide range of inflation forecasts for the first half of 2023, ranging from 3% to 8%. Most expect inflation to be close to the 2% target by the second half of 2023.

https://fred.stlouisfed.org/series/PPIFIS
https://fred.stlouisfed.org/series/PALLFNFINDEXQ

Producer price increases followed the same general pattern as consumer prices. They appear to have reached their peak. Producer prices better reflect global prices, especially the higher price of most commodities. Note the 30% increase in US demand for durable goods.

https://fred.stlouisfed.org/series/DCOILWTICO
https://fred.stlouisfed.org/series/DCOILBRENTEU

Global energy prices played a significant role in recent inflation. The last few months displayed an easing of prices, but recent OPEC+ decisions to reduce output indicate oil prices rising some again.

https://www.atlantafed.org/chcs/wage-growth-tracker

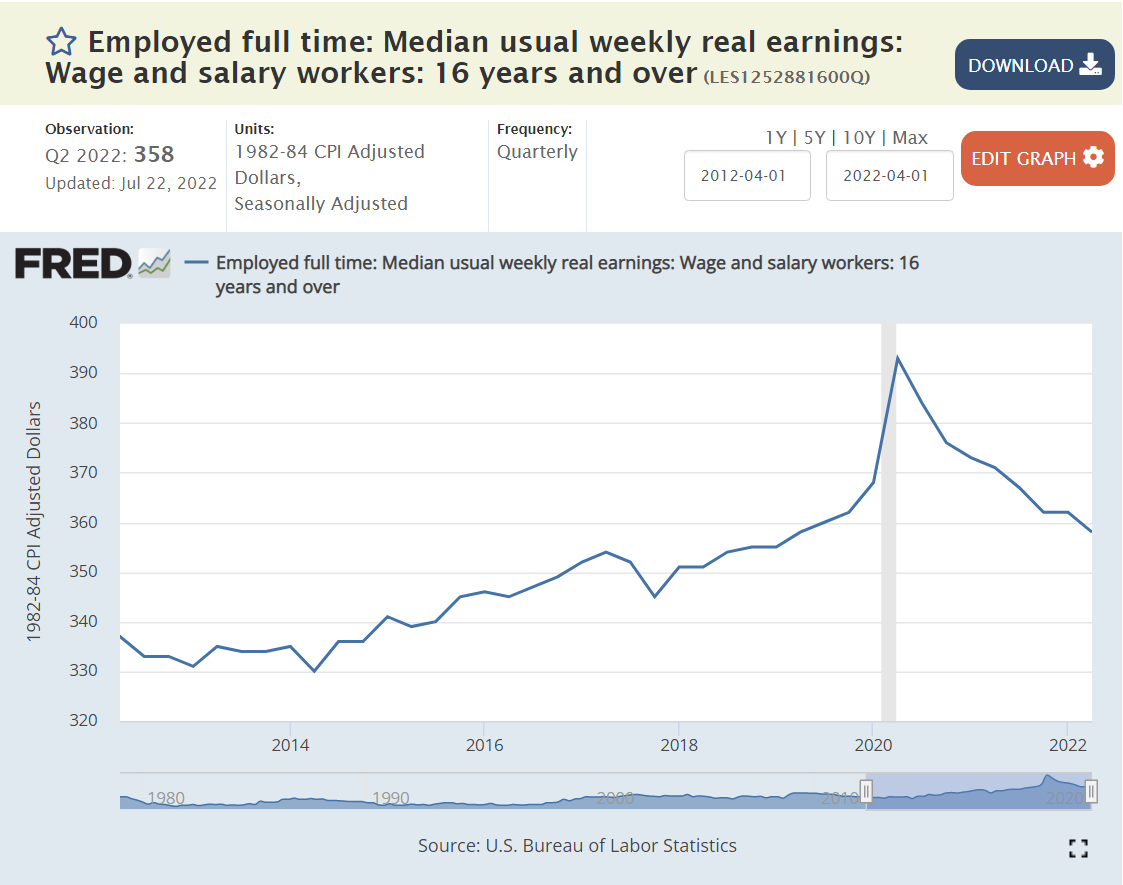
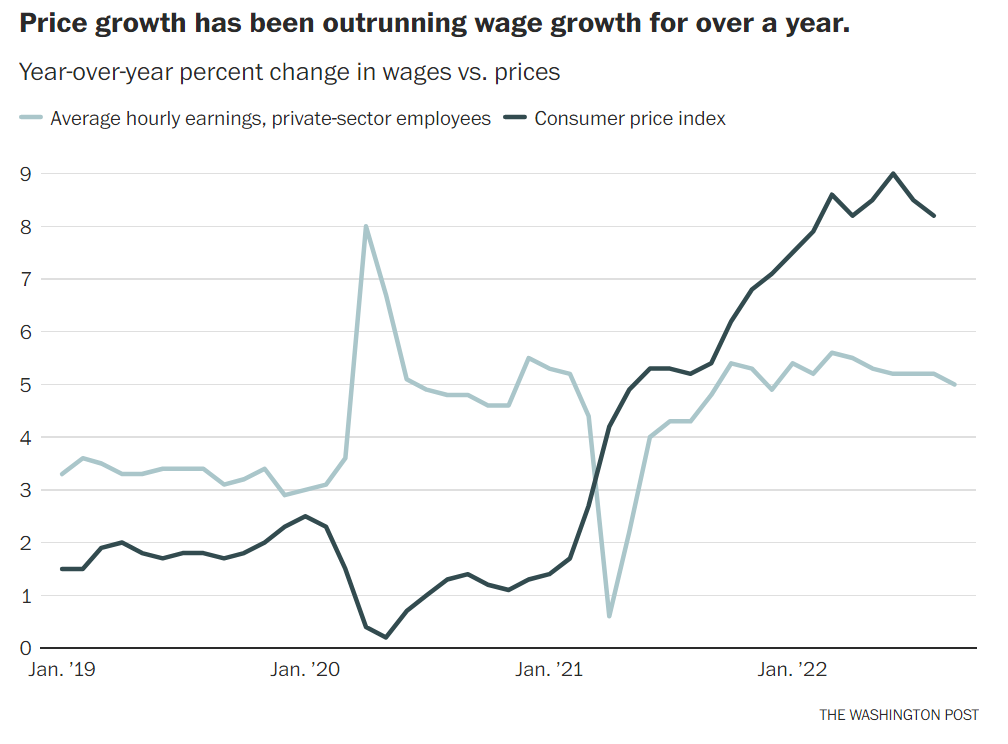
Nominal wages accelerated during 2022, perhaps peaking at 7% annual growth.
https://fred.stlouisfed.org/series/LES1252881600Q

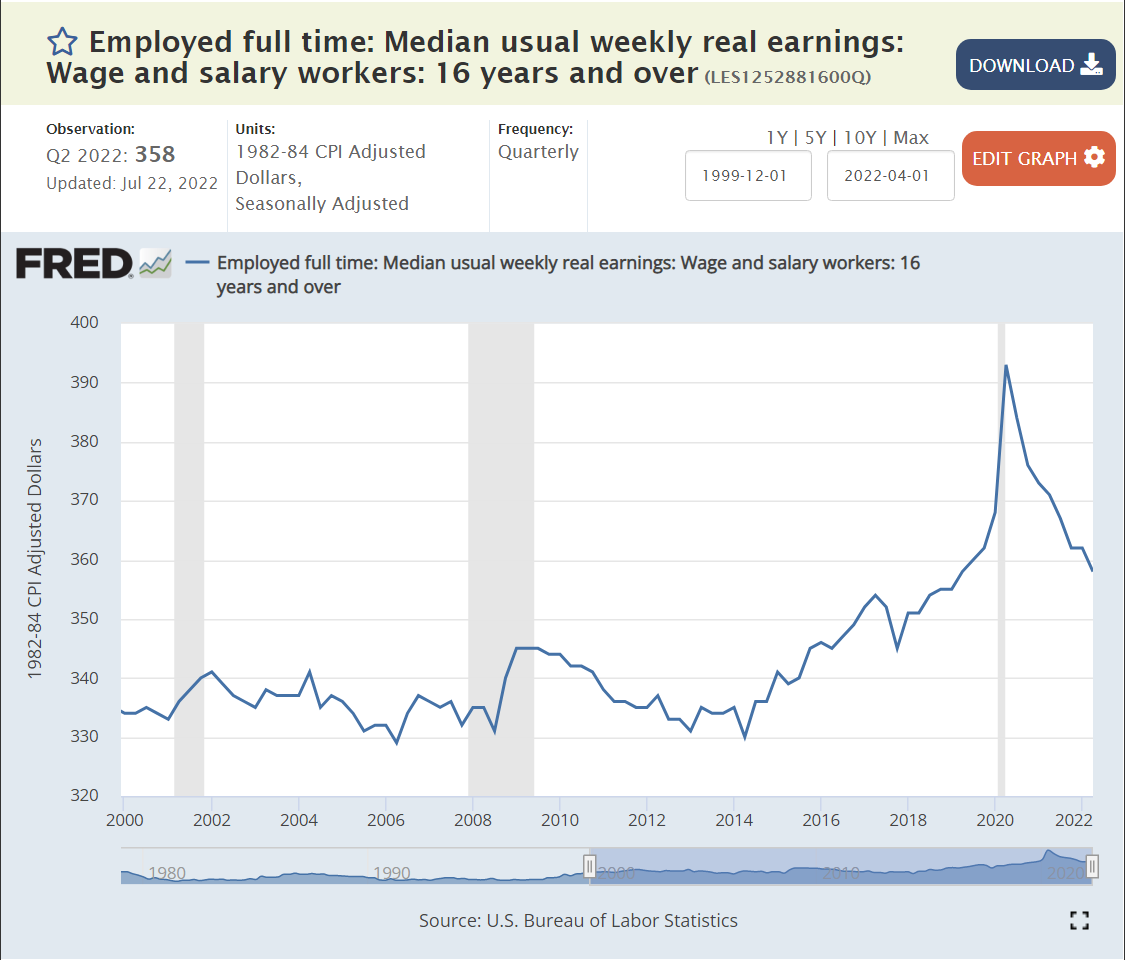
Yet, real wages have been falling for 2 years. We do not have a 1960’s style wage-price spiral.
https://www.washingtonpost.com/opinions/2022/10/07/september-jobs-report-analysis-no-recession-yet/
https://fred.stlouisfed.org/series/JTSJOL

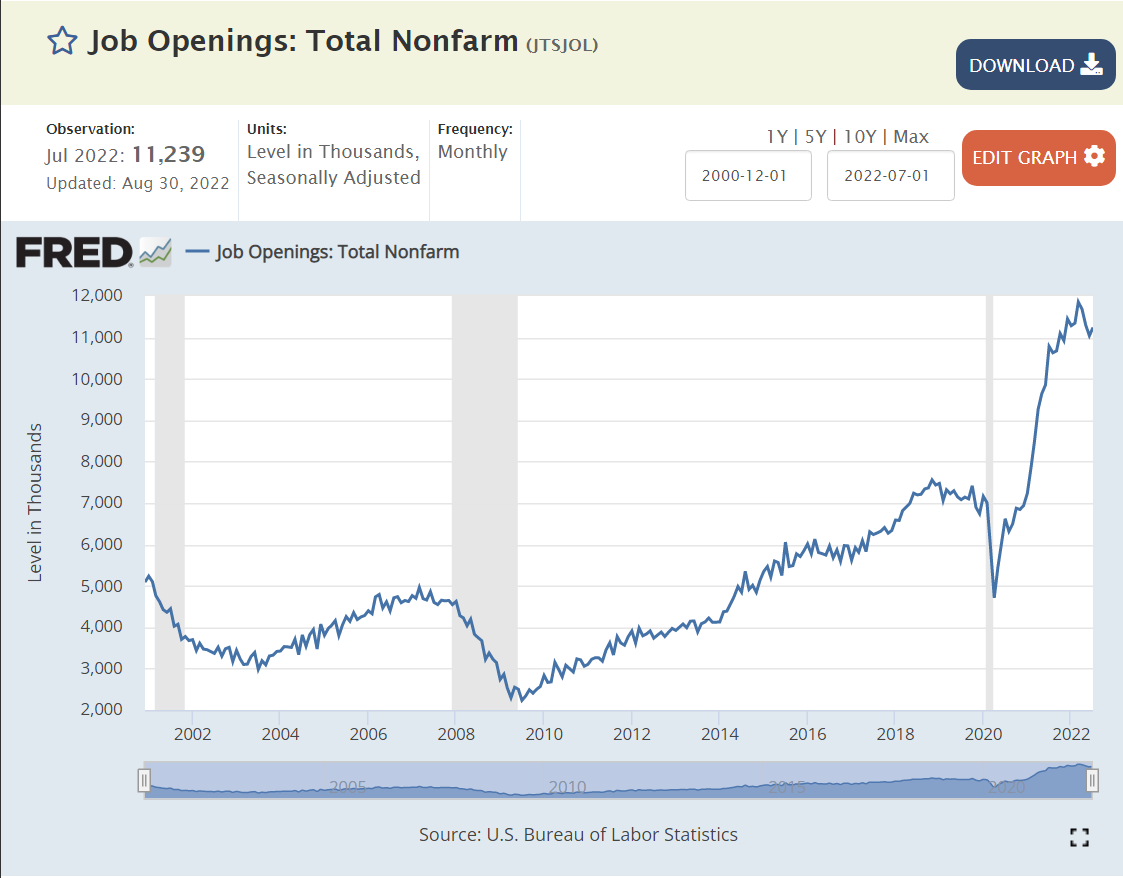
Job openings were at a historical high before the pandemic and quickly returned to that level by the end of 2020 and then nearly doubled in the next year+ as businesses saw opportunities to profit from the expanding economy, but could not find workers at the somewhat elevated prevailing wage rates. The number of unfilled jobs has dropped by nearly 2 million recently, from 12 to 10 million. The labor market is returning towards “normal”, but with 10 million open positions, the number of net new positions added is likely to increase throughout the fourth quarter, even as the Fed attempts to slow the overall economy.

https://fred.stlouisfed.org/series/CIVPART

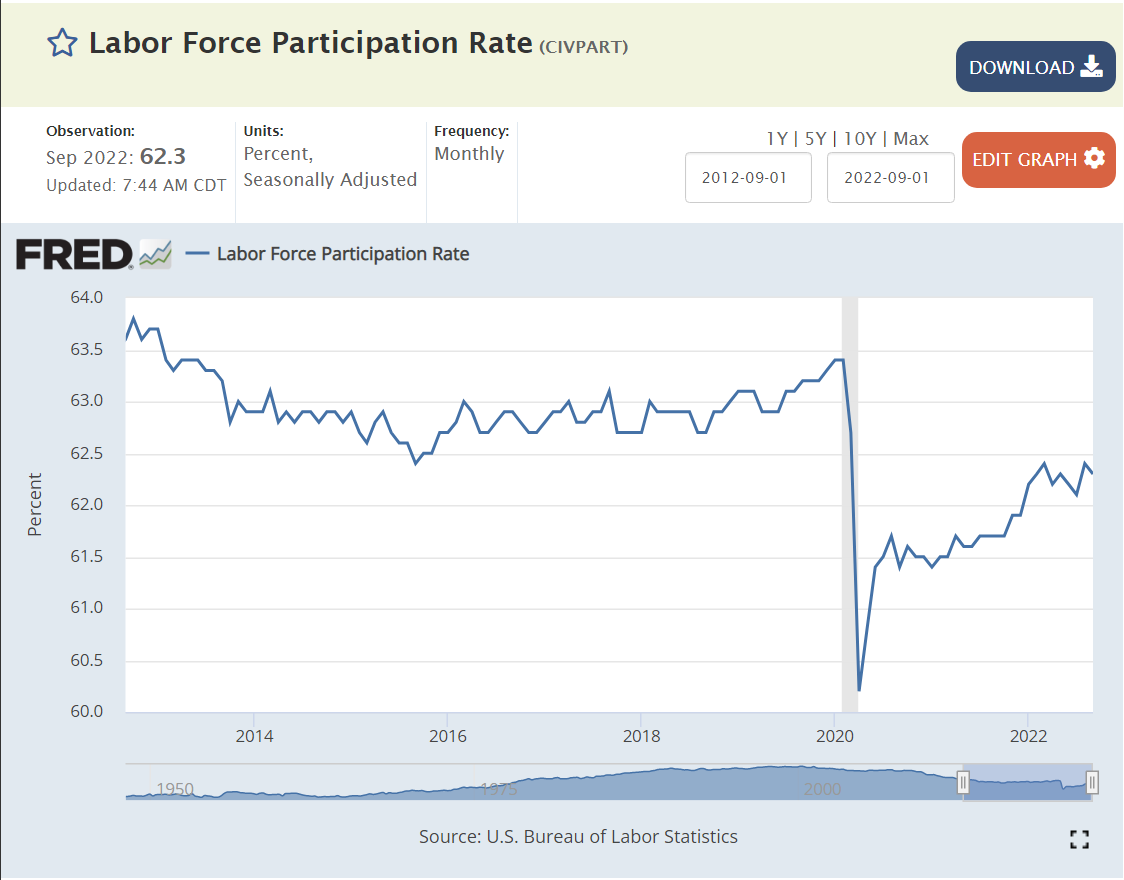
The US labor force participation rate slid from 67% to 66% to 63% from 2000 to 2009 to 2015. It dropped by 1.5% due to the pandemic (61.5%) and has since partially recovered to 62.3%, still a full 1% below the recent peak rate just before the pandemic. The labor market recovery has been good, but not great.

https://fred.stlouisfed.org/series/LNU01300060

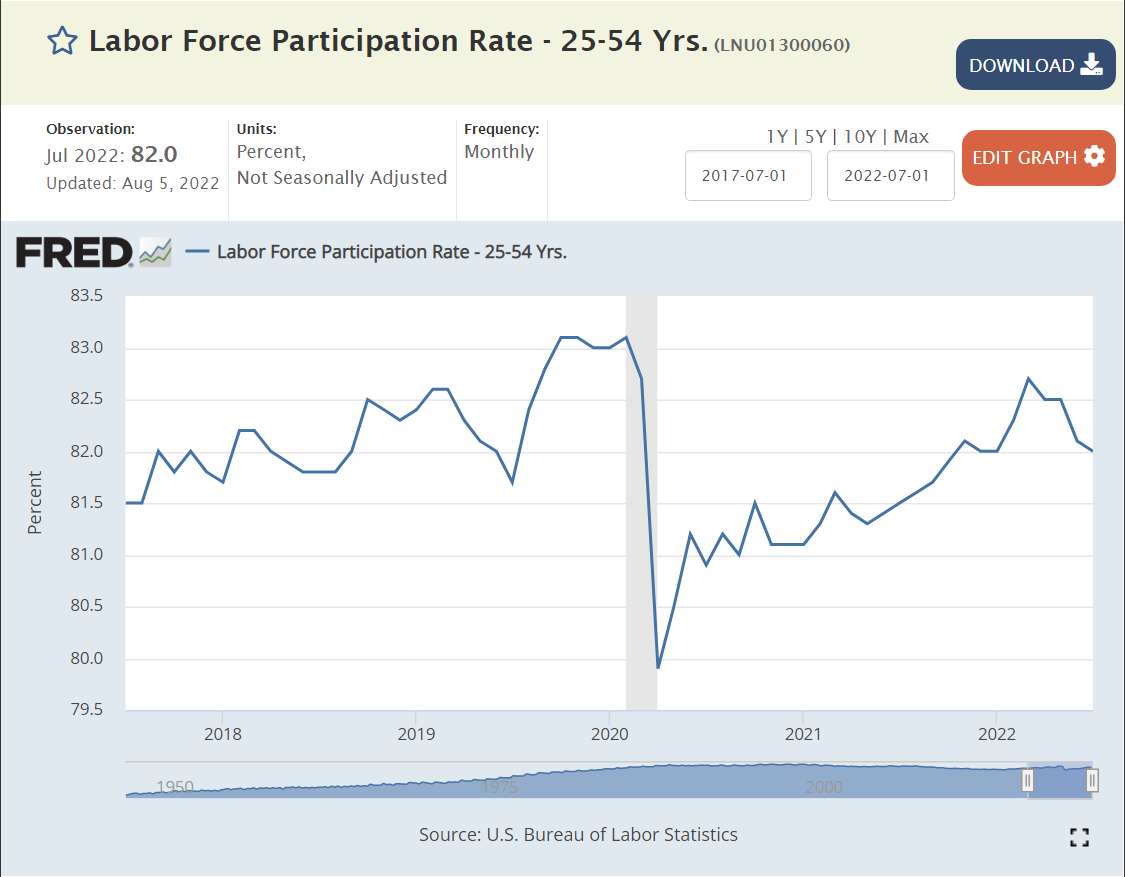
The core, 25-54 year old labor force participation rate has increased by 1.5% since the pandemic to more than 82.5%, less than one-half percent below the recent high of 83% before the pandemic. By this measure, the labor market is recovering nicely, but not completely.

https://fred.stlouisfed.org/series/LNS11324230

Retirement age workers have not returned to the work force, with more than 1.5% of potential workers choosing to not join the labor market. Employers will need to be more innovative to attract workers back into the labor market.

Summary

The economy is slowing down, inflationary pressures are easing, but the labor market still looks strong. Slow to zero growth for the prior (3rd) and next 3 quarters is likely as inflation falls from 7-8% to 2-4%. Unemployment rates may increase, but it appears that the total number of employees will increase slowly during this low/zero growth period.
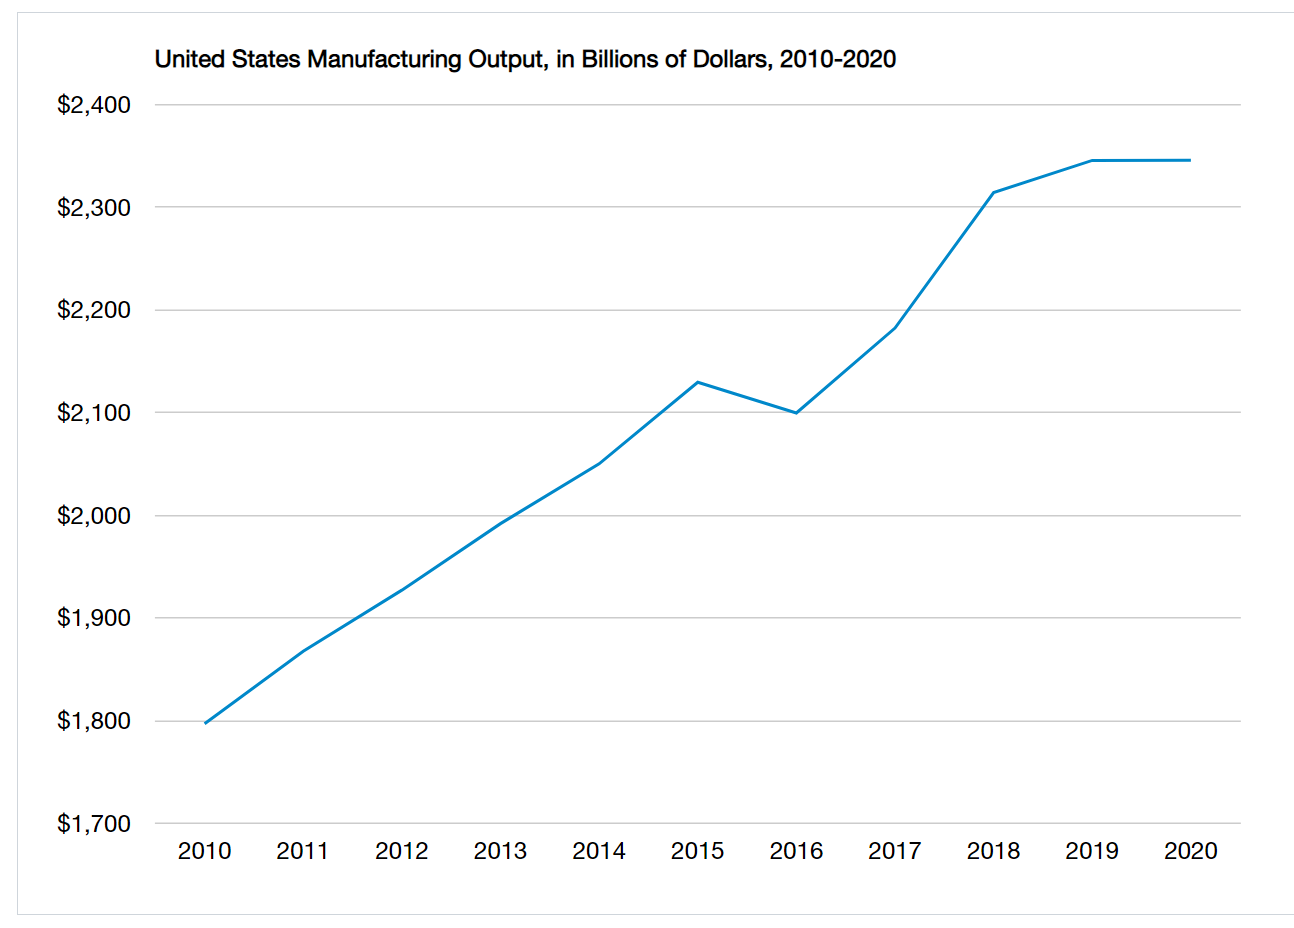
Good News: US Manufacturing Output Continues to Grow

https://www.nam.org/state-manufacturing-data/2021-united-states-manufacturing-facts/
https://en.wikipedia.org/wiki/Manufacturing_in_the_United_States#/media/File:Manufacturing_GDP_(nominal_and_real)_and_Manufacturing_Employment.png
https://fred.stlouisfed.org/series/OUTMS
https://www.nam.org/state-manufacturing-data/2021-united-states-manufacturing-facts/
https://www.brookings.edu/research/global-manufacturing-scorecard-how-the-us-compares-to-18-other-nations/

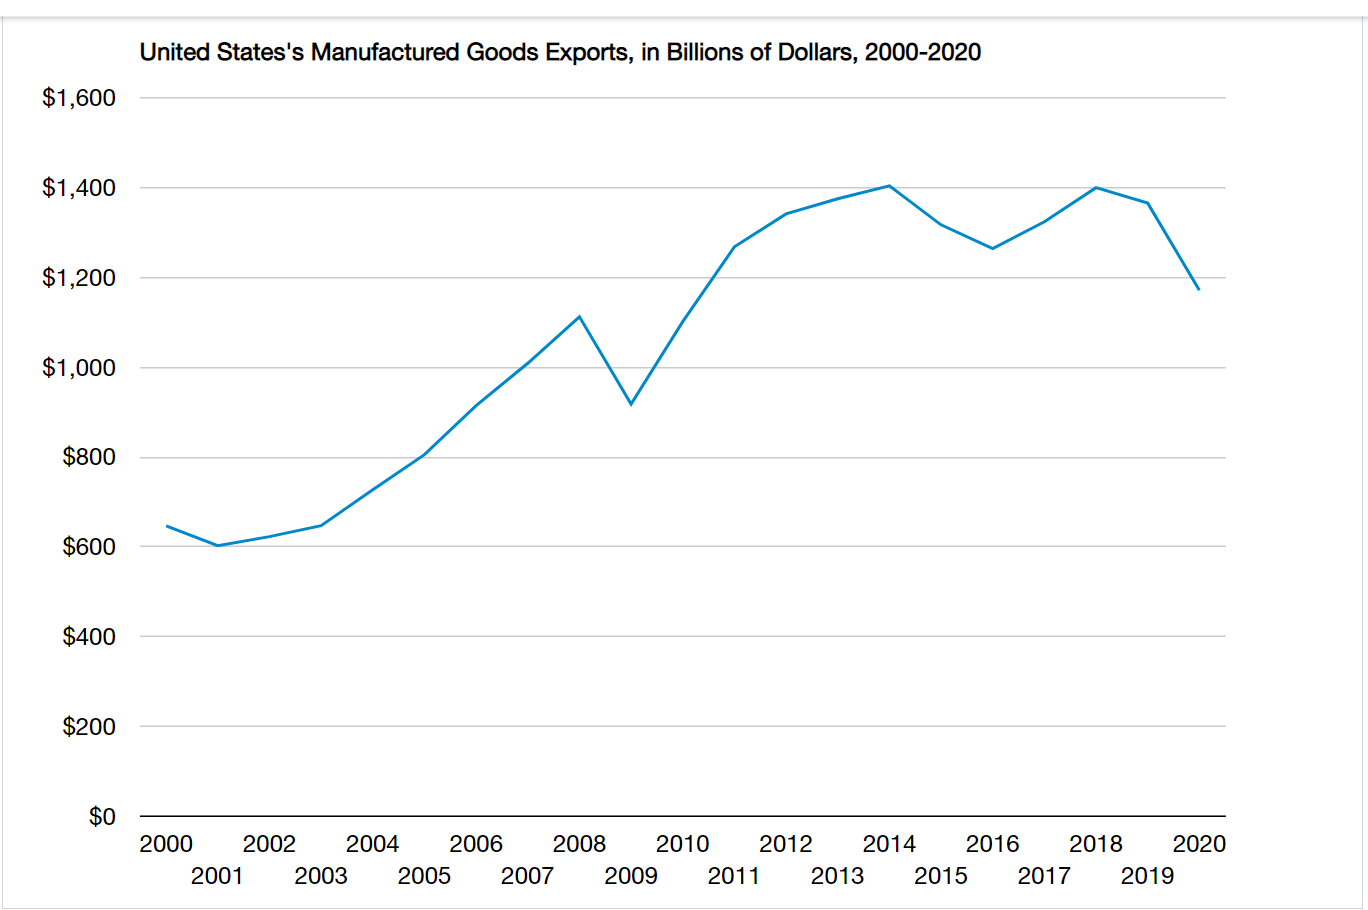
US manufacturing output continues to increase year over year, despite the reduction in employment.

Good News: Weather Forecast Accuracy Is Much Better

Everyone complains about “the weather” and the “weather forecast”, but forecasting accuracy has improved markedly since 1980, which was already at least twice as accurate of the best (pre-computer) forecasts of the 1940’s and 1950’s.

Unfortunately, there is no really simple intuitive way to gauge the improving accuracy, but scientists have provided a variety of measures to indicate the relative improvement.

Improved Accuracy

https://www.iweathernet.com/educational/history-weather-forecasting

36 hour and 72 hour forecast accuracy doubled in the 40 years between 1975 and 2015.

https://public.wmo.int/en/bulletin/weather-and-climate-forecasting-chronicle-revolution

The same level of forecast accuracy was available 8 days out in 2010 as it was 5.5 days out in 1980.

https://dspace.mit.edu/bitstream/handle/1721.1/126785/aav7274_CombinedPDF_v1.pdf?sequenc#:~:text=leading%20numerical%20weather%20prediction%20centers,now%20reach%209%2D10%20days

The correlation between forecast and actual weather has improved consistently between 1981 and 2019 for 3-5-7-10 day forecasts. A 5-day forecast today is as accurate as a 1 day forecast in 1980. 9-10 day forecasts are useful today.

A seven-day forecast can accurately predict the weather about 80 percent of the time and a five-day forecast can accurately predict the weather approximately 90 percent of the time. However, a 10-day—or longer—forecast is only right about half the time.

https://scijinks.gov/forecast-reliability/

a five-day forecast is accurate about 80% (link resides outside ibm) of the time. A one-day temperature forecast is typically accurate within 2.5 degrees. 

https://www.ibm.com/weather/industries/broadcast-media/complete-guide-accurate-weather-forcasting

Short-term five-day forecasts are nearly as accurate as two-day projections were three decades ago. 

The forecast error rate has dropped by anywhere from about 70% (for a 24-hour forecast) to about 90% (for a 72-hour forecast) since 1970. To put that in perspective, the average error for a 72-hour forecast was about 450 miles off in 1970. Today, it’s about 50 miles off.

https://www.cnn.com/2022/06/25/health/weather-forecasting-future-scn/index.html#:~:text=The%20forecast%20error%20rate%20has,it%27s%20about%2050%20miles%20off.

History of Weather Forecasting

https://www.britannica.com/science/weather-forecasting/Long-range-forecasting

https://www.foxweather.com/earth-space/46-years-of-goes-how-a-history-of-achievements-has-changed-weather-forecasting

https://www.newyorker.com/magazine/2019/07/01/why-weather-forecasting-keeps-getting-better

https://celebrating200years.noaa.gov/foundations/numerical_wx_pred/welcome.html#intro

https://public.wmo.int/en/bulletin/weather-and-climate-forecasting-chronicle-revolution

Glorious Weather Forecasting Future

https://www.ibm.com/weather/industries/broadcast-media/complete-guide-accurate-weather-forcasting

https://www.nae.edu/244878/Future-of-Weather-Forecasting

https://celebrating200years.noaa.gov/foundations/numerical_wx_pred/welcome.html#ahead

https://www.wired.com/story/weather-forecasting-artifical-intelligence/

https://www.washington.edu/news/2020/12/15/a-i-model-shows-promise-to-generate-faster-more-accurate-weather-forecasts/

Hamilton County Growth Continues

https://www.chacompanies.com/news/chas-96th-street-and-keystone-parkway-project-awarded-indy-chamber-monumental-award/

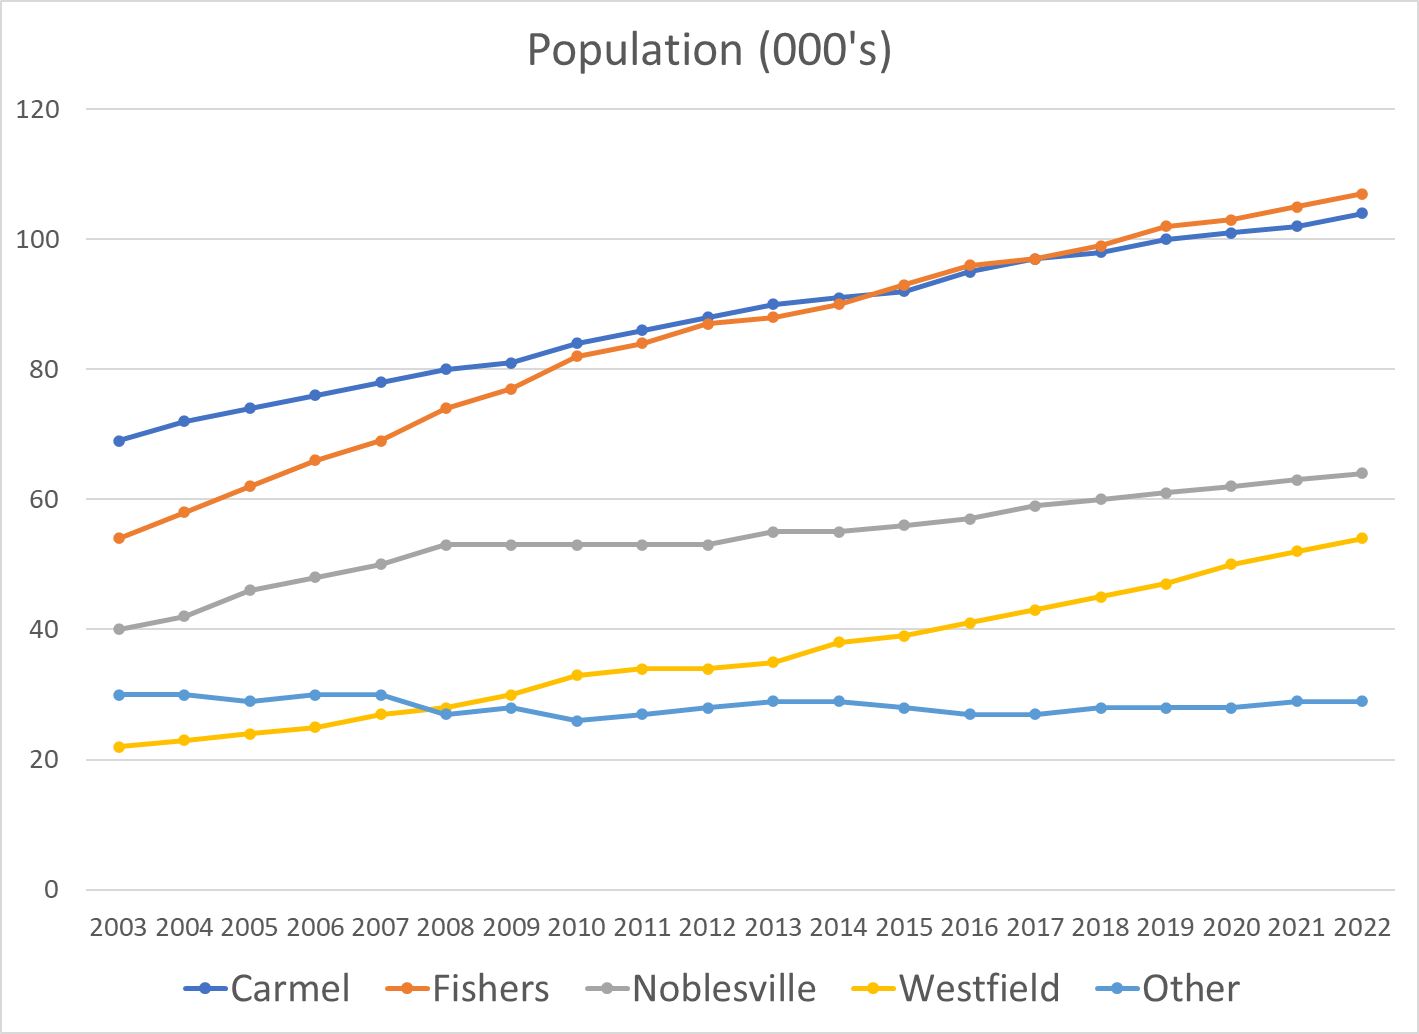
Fishers has overtaken Carmel to become the largest city. Westfield is growing at the fastest percentage rate, with Noblesville close behind.
The county continues to add about 7,000 people each year to its base of 360,000, the fourth largest county in Indiana.
https://www.census.gov/data/datasets/time-series/demo/popest/intercensal-2000-2010-cities-and-towns.html

https://www.stats.indiana.edu/population/sub_cnty_estimates/2020/e2020_townships.asp

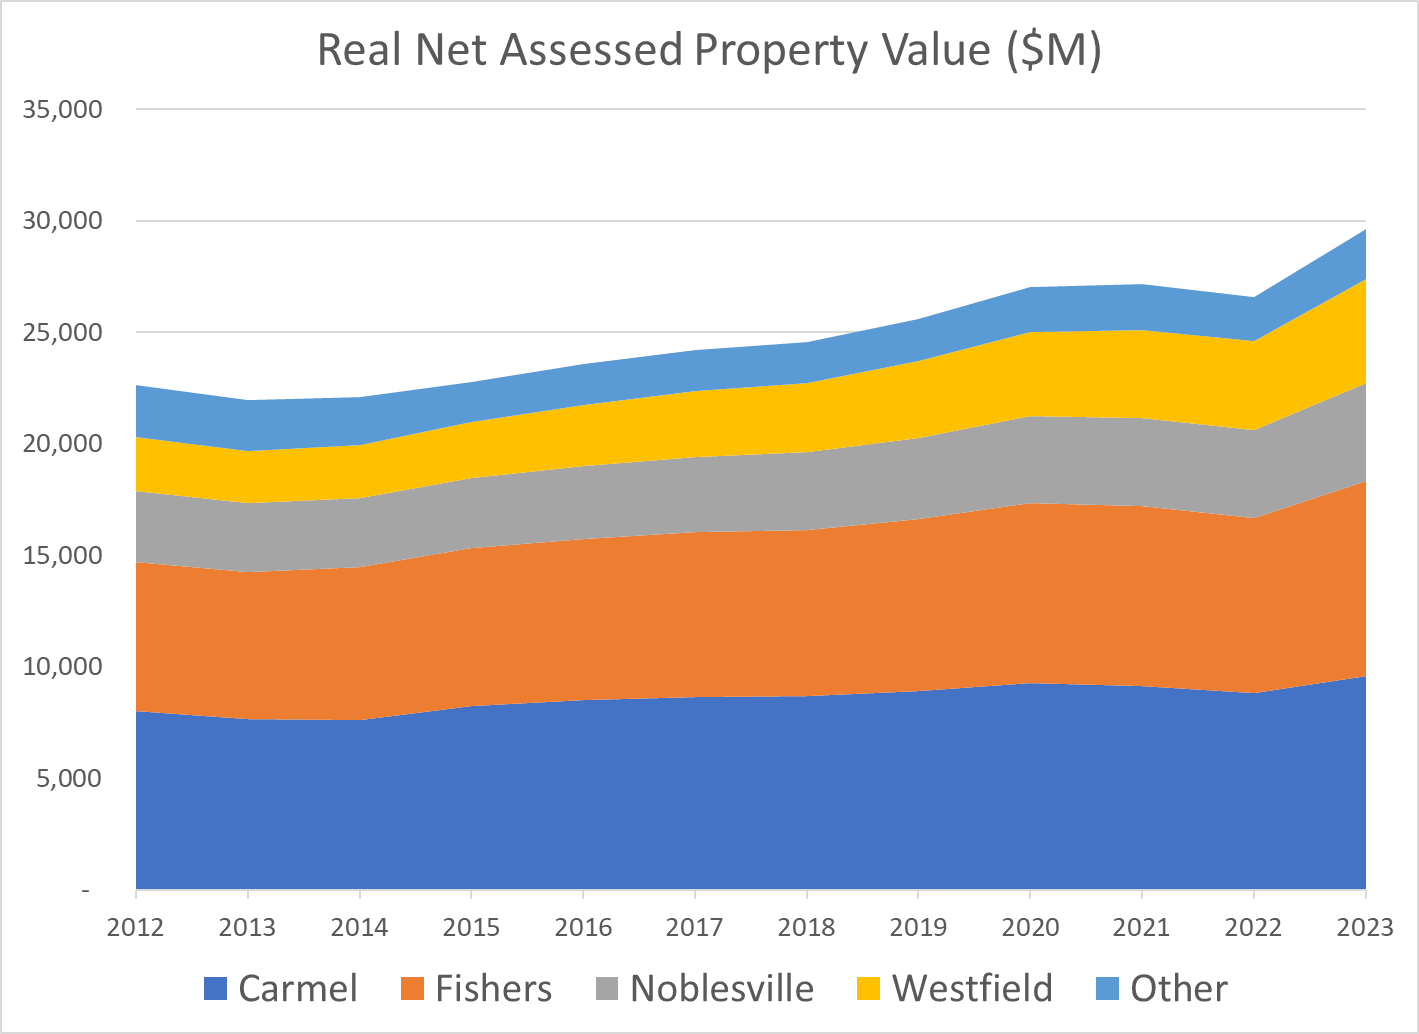
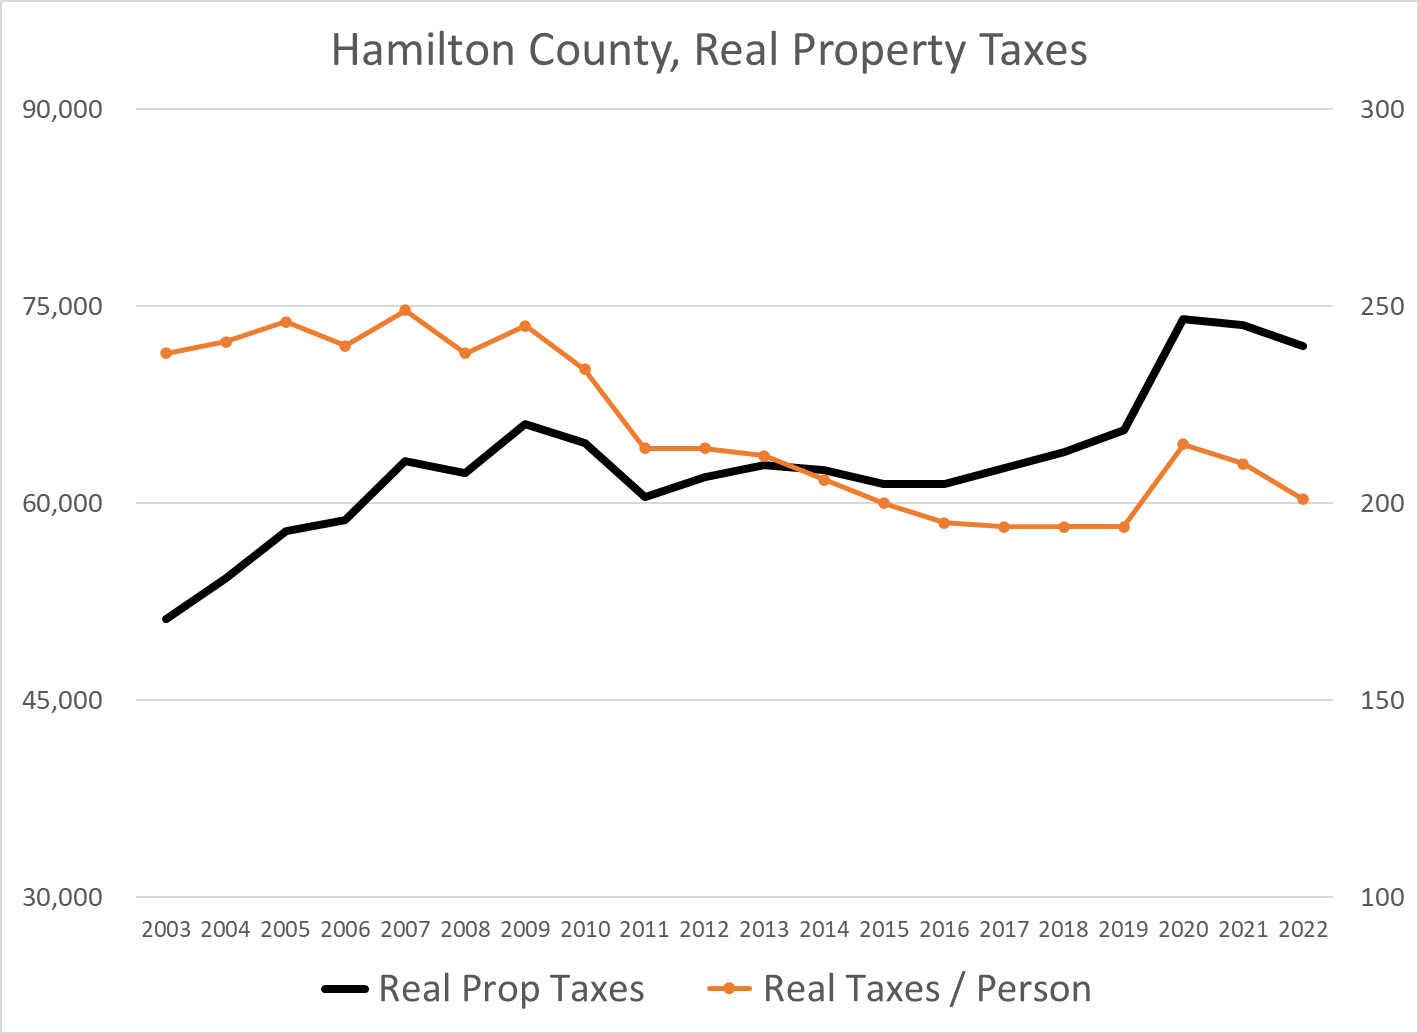
The net assessed valuation for property taxes has grown in line with the population, with faster growth in the last 5 years.

Property values have grown less rapidly, but still significantly, on an inflation adjusted basis.

https://fred.stlouisfed.org/series/CPIAUCSL#0

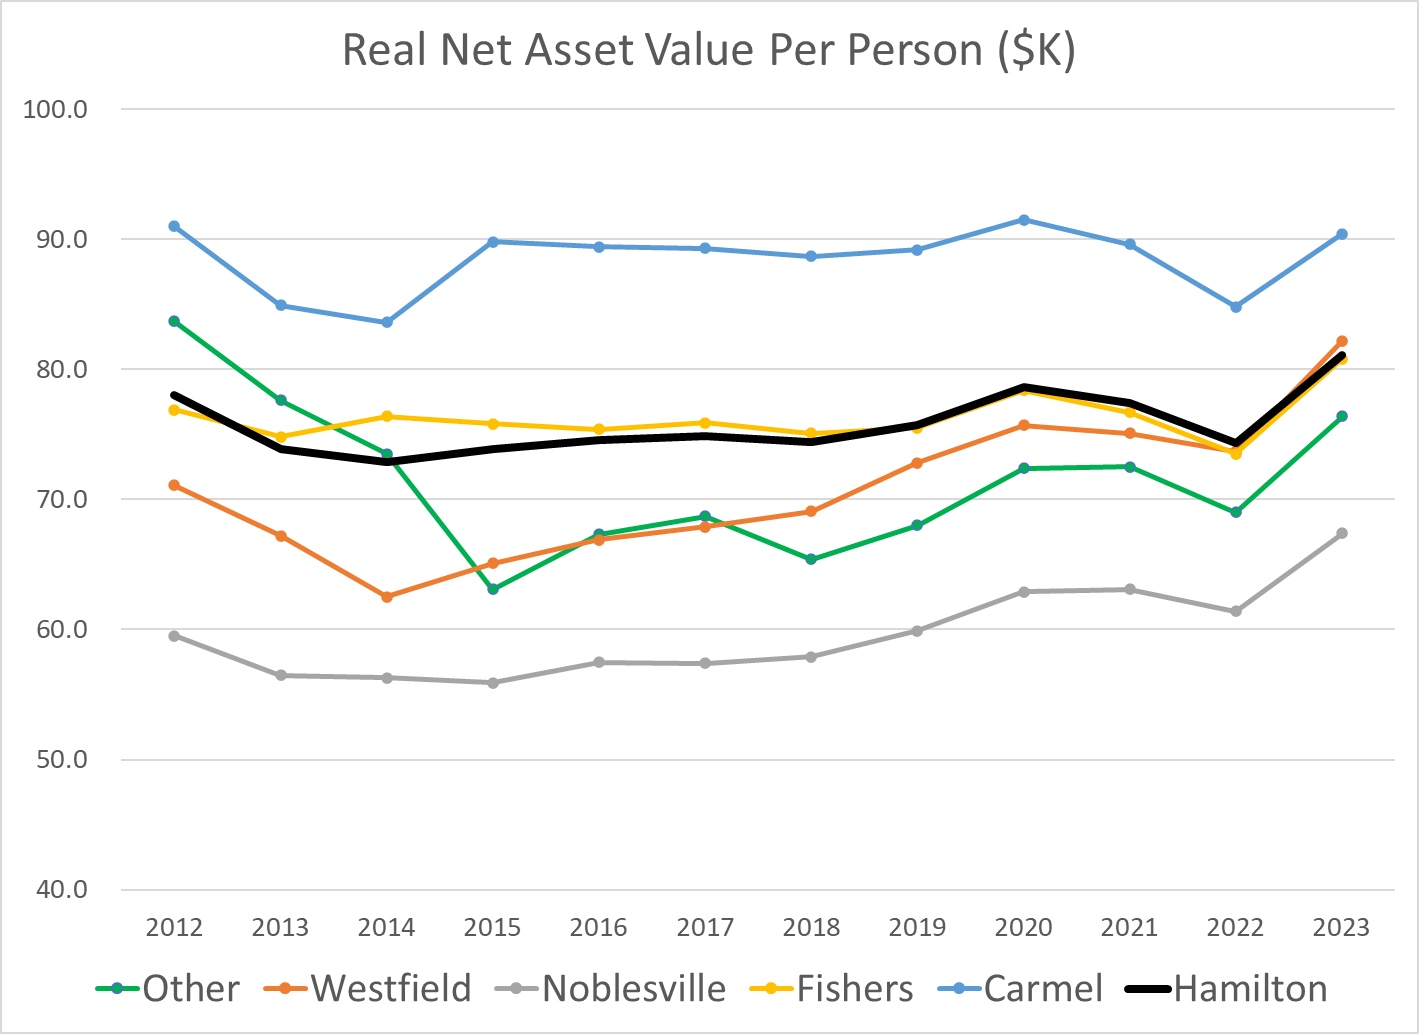
The real property value per person has remained roughly flat as the county has grown during the last decade. Carmel has higher real estate values and Noblesville has lower real estate values.

Real estate taxes levied by the county itself increased for payments due in 2020, but the real taxes per person remain 20% lower than they were in the “teens”. The county consolidated the provision of certain “emergency” services from the towns and cities in 2020.

https://www.hamiltoncounty.in.gov/ArchiveCenter/ViewFile/Item/214

https://www.hamiltoncounty.in.gov/ArchiveCenter/ViewFile/Item/95

https://gateway.ifionline.org/public/pts/pts-overview.aspx

Summary

Hamilton County’s growth looks to continue at a sustainable rate, with open land in Fall Creek, Westfield, Noblesville available for development.

Good News: Election Fraud is Not a Fact-Based Issue in the US

Claims of election fraud have a long history in the US. They exist for 3 reasons. Losers hate to lose. Fraud claims support efforts to restrict voting by opponents. Fraud claims undermine the legitimacy of US democratic processes (Russia).

TRUTH

Historically, without “checks and balances” or other controls, political parties and machines had taken advantage to ensure that they won. We’re mostly talking about 1820-1900. Even in the 20th century, there were states and cities where one party had control and could “deliver” votes at the city, state or national level. This kind of fraud largely ended by the 1960’s based on journalists, lawyers, political opponents and activists overturning this corruption of democracy. Then and now, the numbers of fraudulent votes were very small as a percentage of the votes cast, less than 1%. Fraudulent votes are effective in a democracy only when their small share can tip the election. Most claims of voter fraud are based on a misunderstanding of voting, statistics or logic.

History

In 2007, before the partisan push for photo-ID’s and Trump’s 2016 and 2020 pre-emptive and post-emptive claims of fraud, the Brennan Institute consolidated the research and concluded that voter fraud was statistically irrelevant, 1 in 10,000 or 1 in 1,000 at the most.

file:///C:/Users/tkapo/Downloads/Report_Truth-About-Voter-Fraud.pdf

https://www.brennancenter.org/issues/ensure-every-american-can-vote/vote-suppression/myth-voter-fraud

NO MATERIAL VOTER FRAUD (Even McConnell)

https://www.brennancenter.org/our-work/research-reports/debunking-voter-fraud-myth

https://www.reuters.com/article/usa-election-voter-fraud-facts-explainer-idINKBN2601H5

https://www.reuters.com/article/factcheck-fraud-elections/fact-check-re-examining-how-and-why-voter-fraud-is-exceedingly-rare-in-the-u-s-ahead-of-the-2022-midterms-idUSL1N2XP2AI

https://www.washingtonpost.com/news/wonk/wp/2014/08/06/a-comprehensive-investigation-of-voter-impersonation-finds-31-credible-incidents-out-of-one-billion-ballots-cast/

https://www.cnn.com/factsfirst/politics/factcheck_8b1382ba-4b0e-4d9c-b933-adcbced94e98

https://www.pbs.org/newshour/politics/ap-review-finds-far-too-little-vote-fraud-to-tip-2020-election-to-trump

https://www.pbs.org/newshour/show/exhaustive-fact-check-finds-little-evidence-of-voter-fraud-but-2020s-big-lie-lives-on

https://www.pnas.org/doi/10.1073/pnas.2103619118

https://www.npr.org/2022/09/04/1120904265/claims-voter-fraud-donald-trump

https://apnews.com/article/barr-no-widespread-election-fraud-b1f1488796c9a98c4b1a9061a6c7f49d

https://www.cisa.gov/rumorcontrol

https://www.voanews.com/a/2020-usa-votes_how-widespread-voter-fraud-us/6195819.html

https://www.nbcnews.com/politics/congress/mcconnell-says-voter-fraud-rare-isnt-worried-threats-democracy-rcna44301

https://www.usatoday.com/story/news/factcheck/2021/08/10/fact-check-8-million-excess-biden-votes-werent-counted-2020/5512962001/

https://www.washingtonpost.com/politics/minuscule-number-of-potentially-fraudulent-ballots-in-states-with-universal-mail-voting-undercuts-trump-claims-about-election-risks/2020/06/08/1e78aa26-a5c5-11ea-bb20-ebf0921f3bbd_story.html

https://www.snopes.com/tag/voter-fraud-rumors/

https://apnews.com/article/north-america-donald-trump-us-news-ap-top-news-elections-f5f6a73b2af546ee97816bb35e82c18d

YES, Material Fraud

https://www.heritage.org/voterfraud

https://www.foxnews.com/category/politics/elections/voter-fraud-concerns

Summary

We are blessed with an incredibly low level of election fraud in the US for the last 50 years. With a simple two-party system, partisans from both sides have ensured that fraudulent voting is difficult to do, highly punished if discovered and easy to discover (and therefor highly disincentivized). US voting is largely managed at the lowest levels: counties, cities, precincts, where citizens know their neighbors. It is effective because enough Americans of various political beliefs today believe in this process and volunteer their time to make it effective.

Analysis

Republicans generally take a negative view of human nature, expecting individuals to actively pursue their self-interest. Hence, they expect that Democrats, with influence over the election process in some venues, will take steps to optimize their results. In an earlier age this was partially true. But, in the modern world (post 1920’s), several factors work against this direct pursuit of self-interest. The country’s laws make voting fraud a felony with significant penalties. Local election officials are elected. In a two-party system it is relatively easy to engage both parties to monitor the election process. The US has very many lawyers ready to assist their preferred party. Election results are public. Statistically improbable results are very easy to identify today. Each precinct has a historical preference which is unlikely to change materially in any single election, so any fraudulent voting is easily identified.

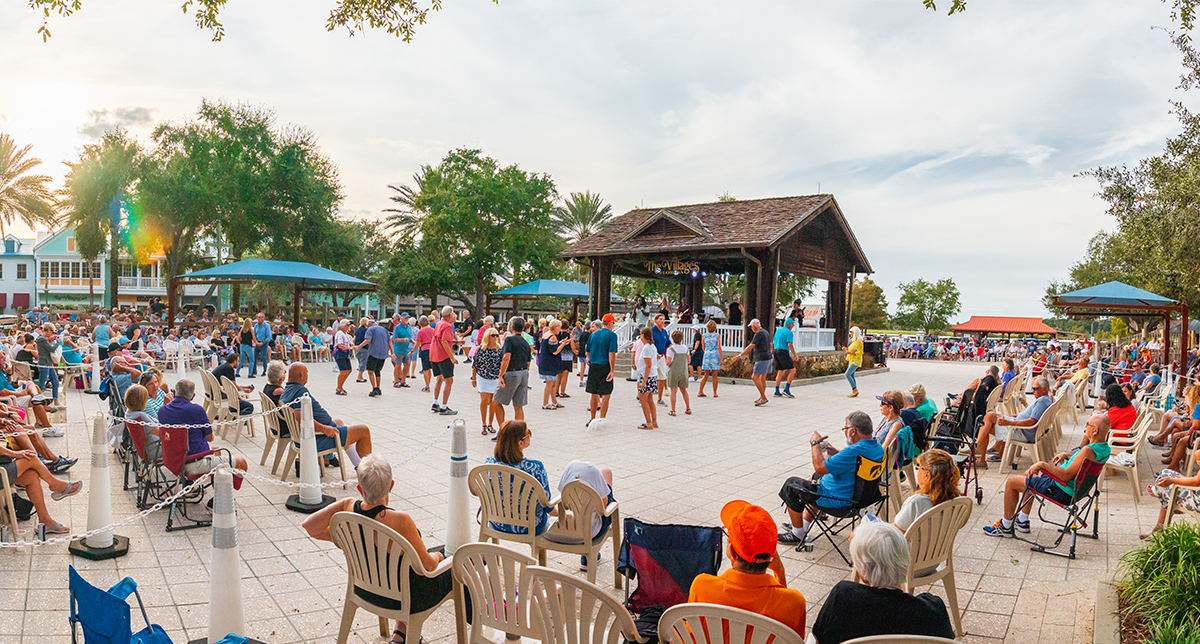
Good News: More Retirees

https://www.thevillages.com/

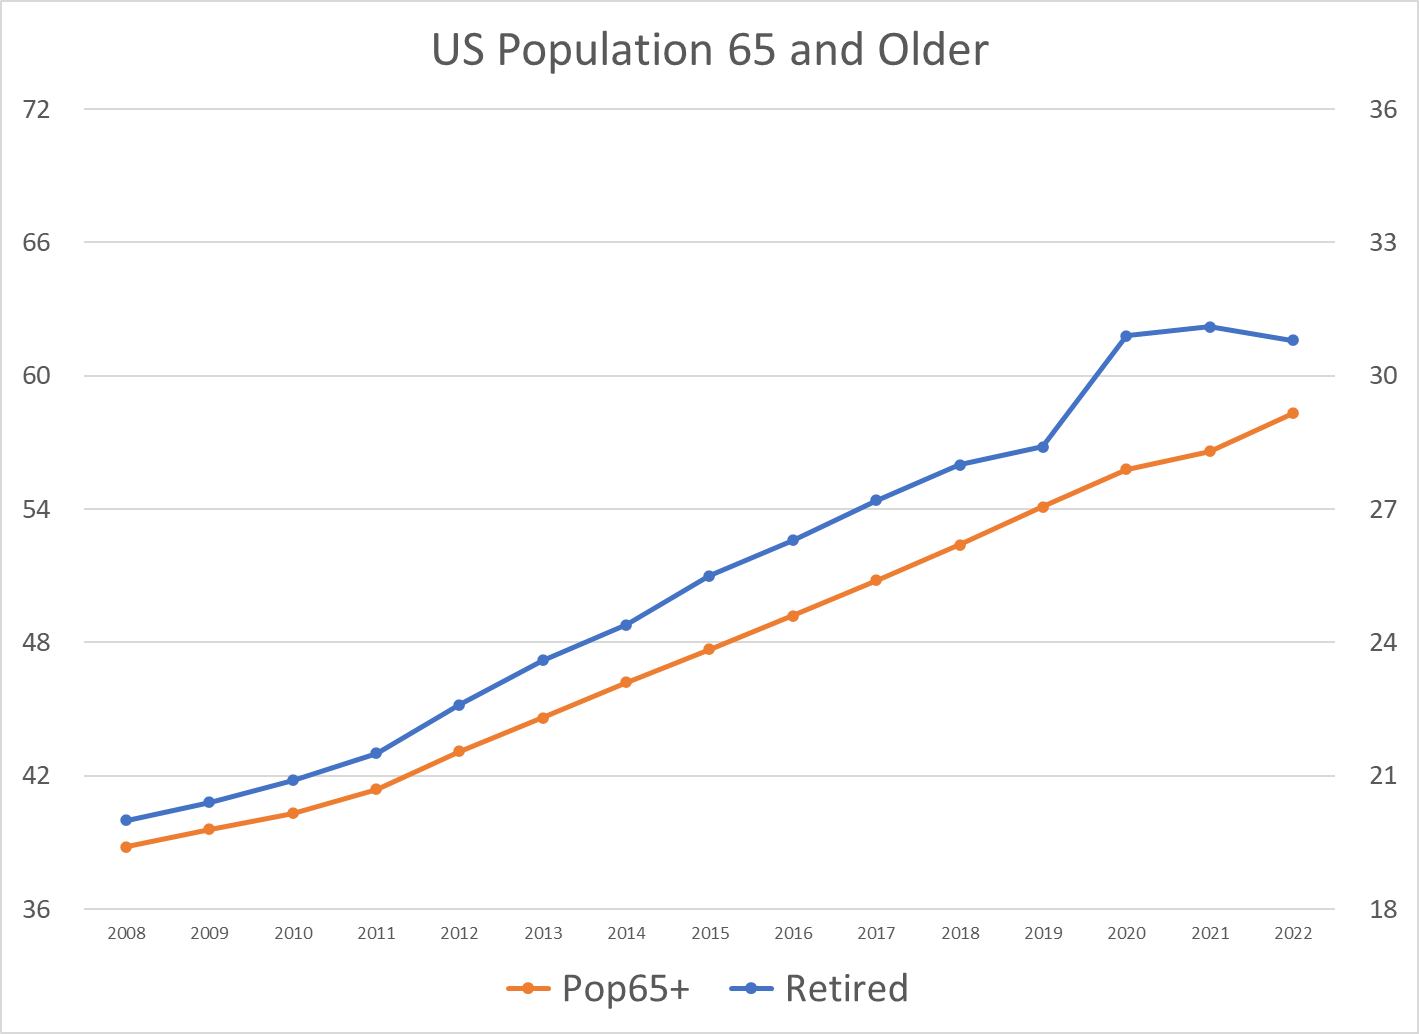
The number of retirees, aged 65+, has increased by more than 50% since 2008, from 20M to almost 31M.

The retirement age population has grown by 4% of the total population in the last 14 years.

The retired 65+ population has grown a little faster than the total 65+ age group. The initial pandemic impact in 2020 was a 5% increase in the retirement rate, indicating about a 2.6M increase in early retirements in 2020.

The retirement rate in 2020 was about 2% higher than the trend, indicating an extra 1.2M extra retirees. The percentage of retired individuals has since fallen back below the trend line.

https://fred.stlouisfed.org/series/LNU05075379#0

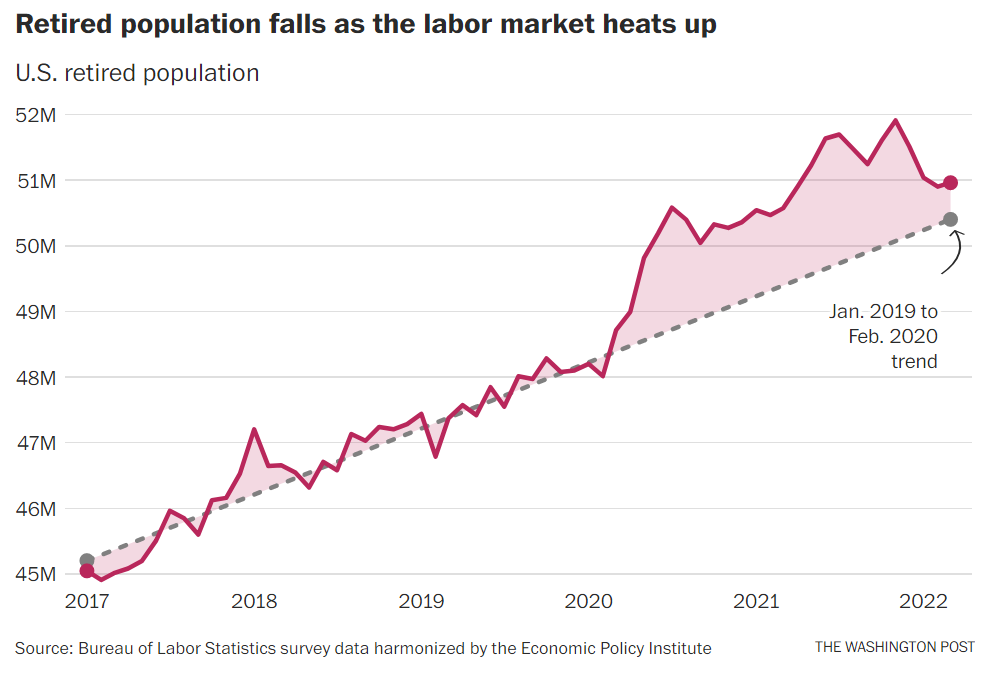
The “retired” measure returned (close) to its trend line by June, 2022.

Early estimates of the impact of the pandemic on retirement age workers indicated 2-3 million “extra” workers retired during this time.

https://www.cnn.com/2021/12/18/business/labor-shortage-boomers-millennials-nightcap/index.html

https://www.cbsnews.com/news/retirement-covid-pandemic-unretire-labor-shortage/

https://research.stlouisfed.org/publications/economic-synopses/2021/10/15/the-covid-retirement-boom

https://www.stlouisfed.org/on-the-economy/2021/december/excess-retirements-covid-19-pandemic

https://www.axios.com/2021/10/29/millions-of-baby-boomers-retired-early-during-the-pandemic

Later estimates indicated about 1M early retirements, and then a reversal in late 2021 – 22 as individuals chose to defer their retirements due to the uncertain economic conditions.

https://www.pewresearch.org/fact-tank/2021/11/04/amid-the-pandemic-a-rising-share-of-older-u-s-adults-are-now-retired/

https://www.plansponsor.com/study-shows-baby-boomers-pushed-workforce/

Bloomberg noted that new Social Security filings did not increase, so even though there were some retirement candidates with adequate resources to delay claiming Social Security benefits, it was unlikely that there were 3M extra early retirees.

CNBC documented the late Pandemic swing towards more potential retirees deferring this step.

https://www.cnbc.com/2022/07/09/economic-fears-further-retirees-pandemic-era-plans-to-keep-working.html

The Washington Post documented the early retirees returning to work and the variability of retirement choices versus the long-term trend lines.

https://www.washingtonpost.com/business/2022/05/05/retirement-jobs-work-inflation-medicare/

The Washington Post’s approach shows a peak of 2 million extra retirees, falling back to about one-half million in 2022.

Summary

The US economy, political system and social norms have supported the number of aged 65+ retirees growing from 20 million to more than 30 million since 2008. Some of the increase in “retirees” at the start of the pandemic was not voluntary and some retirees have returned to work in the last year as the labor market remains tight and workers worry more about economic conditions. However, overall, an extra 10 million individuals have chosen to retire from active employment and enjoy their retirement years.

11 Million Open Jobs! 2 Jobs for Every Applicant

Available Positions

Industry2007 Pos2019 Pos2022 PosAdds
Govt12.212.511.8-.4
Other5.45.95.6.2
Construct7.77.57.6-.1
Manufacturing14.212.812.7-1.5
Mining.7.7.6-.1
Logistics5.06.16.91.9
Education3.03.83.7.7
Health15.320.320.45.1
Leisure13.316.515.11.8
State/Local Educn10.210.410.20
Finance8.48.78.9.5
Information3.02.82.9-.1
Profl Svcs17.820.921.84.0
Retail15.715.615.8.1
Wholesale5.95.85.8-.1
Total137.8150.3149.812.0
https://www.bls.gov/jlt/

Industry2007 Open2019 Open2022 OpenMore Open
Government.3.5.7.4
Other.2.2.4.3
Construction.2.3.4.2
Manufacturing.3.5.9.5
Mining0000
Logistics.1.3.5.4
Education.1.1.2.1
Health.71.21.91.2
Leisure.61.01.61.0
State/Local Ed.1.2.3.2
Finance.3.4.5.2
IT.1.1.2.1
Profl Svcs.91.32.01.2
Retail.5.91.10,6
Wholesale.2.2.3.1
Total3.67.111.26.6
https://www.bls.gov/jlt/

Open Positions as a Percent of Jobs Available

Industry2007 Rate2019 Rate2022 Rate
Government2.43.65.4
Other3.14.07.3
Construction2.23.84.8
Manufacturing2.33.46.4
Mining2.13.85.6
Logistics2.74.87.4
Education Svcs2.42.94.9
Health4.35.48.6
Leisure4.35.79.8
State/Local Ed1.32.03.2
Finance3.54.25.4
IT4.64.76.7
Profl Svcs4.85.78.6
Retail3.05.26.4
Wholesale2.93.55.0
Total3.34.57.0
https://www.bls.gov/jlt/

Open Positions by Industry, 2021-22

The Department of Labor’s monthly survey provides various measures by industry. I’ve broken down the data into 15 industry segments. Eight (8) of these segments account for 5/6ths of all positions and I’ll focus on these 8.

The number of open jobs in the last year, July, 2021 – July 2022, is lead by Professional Services (2.0), Health (1.9), Leisure (1.6), Retail (1.1), Manufacturing (0.9), Government (0.7), Logistics (0.5) and Finance (0.5).

Seven industries accounted for 5/6ths of the increase from 4.6M openings in 2006-7 to 11.2M open jobs today. Health (1.2), Profl Svcs (1.2), Leisure (1.0), Retail (0.6), Manufacturing (0.5), Government (0.4) and Logistics (0.4) are the open job gainers.

The pre-pandemic increase averaged 40% of the total 15-year increase for most industries. The Manufacturing industry showed job declines between 2006 and before the Pandemic, so 80% of it’s openings increase has been since the pre-Pandemic peak. The Business and Professional Services industry has also grown faster since the Pandemic, with 68% of its job growth in recent years. The Retail industry shows an opposite pattern, with 60% of it’s job growth before the Pandemic and a relatively weaker 40% post-Pandemic (on-line sales growth impact).

Total Positions Available by Industry

Total positions increased by 12M, from 138M in 2006-7 to 150M in the last year. Just 4 industries account for all of the growth, lead by Health (5.1), Profl Svcs (4.0), Logistics (1.9) and Leisure/Hospitality (1.8). The migration from ag/extraction to manufacturing to pure services is accelerating.

Open Positions Rate by Industry

The open positions rate more than doubled, from 3.3% in 2006-7 to 4.5% in 2018-19 to 7.0% in the last year. Unfortunately, the larger and growing industry sectors have above average open position rates. Leisure and hospitality shows an incredible/unsustainable 9.8% job openings rate. Professional and business services and Health Care report nearly as high 8.6% vacancy rates. The Logistics industry has a higher than usual rate of 7.4% as it adds jobs at a faster rate in the home delivery era. The Retail and Manufacturing industries show elevated 6.4% open jobs rates. The Government and Finance industries exhibit 5.4% openings rates.

Changes in the Job Openings Rate

The overall job openings rate more than doubled from 2006-7 to the last year, from 3.3% to 7.0%. Keep in mind that 2006-7 was the peak of that business cycle with job openings at a cyclical low point. The Leisure and Hospitality industry had the largest increase, from its usually relatively high 4.3% to an “other worldly” 9.8%. The pandemic drove down travel and it has slowly recovered. The Logistics industry displayed the second highest increase, from 2.7% (it’s usual Manufacturing-like rate) to 7.4% as the Pandemic drove individual shipments to consumers. The Health Care industry continued its labor intensive growth, doubling from 4.3% to 8.6% of open positions. The Manufacturing industry evolved from its usual low 2.3% all the way up to 6.4% as labor demand in other industries grew and attracted its workers. The Professional and Business Services industry kept growing, resulting in a 3.8% increase in unfilled roles, from a typically high 4.8% to a very high 8.6%. The Retail and Government sectors had lower increases at 3%. The Finance sector had a lower than average 2% increase in open jobs.

Just a “Mix” Variance?

The US economy is very dynamic. Industries with low, medium and high job openings rates in 2006-7 each employed about 45M people. The low job openings rate industries (Govt, Manufacturing, Mining, and Educn Svcs) actually LOST 1.4M positions between 2007 and 2022. The middle rate of job openings industries (Logistics, finance, trade, other) added 2.6% net new jobs (1.7M). The high job openings rate industries (Health, Leisure, IT and Profl/Bus Svcs) added an incredible 10.8M jobs (22%)! The US has moved from agriculture to extractive to manufacturing to services employment. The personal and professional services industries are both the fastest growing and the most difficult to staff today.

What Happens During a Mild Recession?

Business and Professional Services openings drop by 3% of the total or 600K people. Health industry jobs decline by a smaller 1% as they are less sensitive to the business cycle, falling by 100K. Leisure and Hospitality are very understaffed and this is harming their growth. They might trim their employment by 2% or 300K positions. The Retail industry is in a long-run decline, so a 2% decline is likely, eliminating 300K jobs. Manufacturing is more cyclical than other industries, so its labor demand will fall more sharply, 3%, removing 400K job postings. The Government sector is somewhat buffered from recession pressures, so job openings might fall just 1% or 100K. Logistics firms are struggling to deliver, so a 2% job decline is the most I see, cutting another 100K positions. The Finance sector has been less volatile, so I estimate a 1% decline and 100K dip.. The remaining industries are likely to fall in tandem, requiring an additional 400K open jobs decline to meet budgets. This total 2.4M open position trim reduces the balance to 8.8M, far above the 7.1M pre-Pandemic level in 2018-19. I don’t think that the labor market will play its usual role in transmitting/amplifying negative finance, banking, housing, international trade, energy and other disruptions through the American economy.

Summary

The US economy was at “full employment” in 2006-7 with just 4.6M unfilled positions. The extended recovery after the Great Recession delivered an even lower unemployment rate, but it also delivered a much increased 7.1M open positions. The post-Pandemic economy has returned to an amazing 3.5% unemployment rate, but the unfilled position count has climbed to a much higher 11.2M and stayed there. The current 7% vacancy rate is largely driven by 6 of the 15 industries with the highest rates: Leisure (9.8%), Health (8.6%), Profl Svcs (8.6%), Logistics (7.4%), Manufacturing (6.4%) and Retail (6.4%). American business is slowly learning to manage with a tight labor very market. Demand for labor should fall significantly in the future as firms employ greater technology, processes, capital goods and imports.

NOT.

US Labor Market: Just Like Living in Paradise

https://fred.stlouisfed.org/series/CE16OV

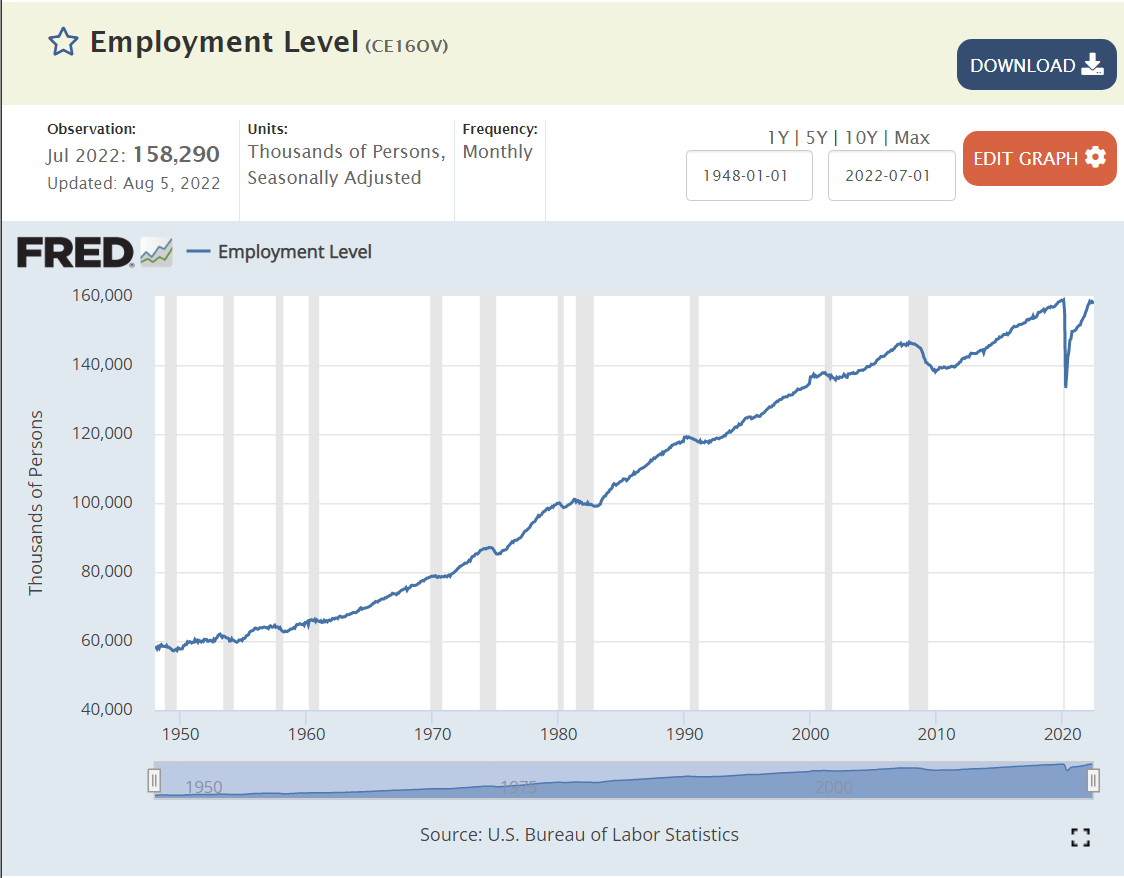
US labor force employment grows and grows. 60M employed in the very glorious 1950’s. 80M by the end of the dynamic 1960’s. 100M by the end of the transforming 1970’s. 120M by the end of the conforming 1980’s. Not quite 140M by the turn of the millennium (2M shy). Just 140M at the end of the “oughts” decade. 158M before the pandemic, resuming the 20M new jobs per decade record of the sixties, seventies, eighties and nineties in the teens decade.

That is 100 million net new jobs added in my lifetime. 160M, up from 60M.

https://fred.stlouisfed.org/series/PAYEMS

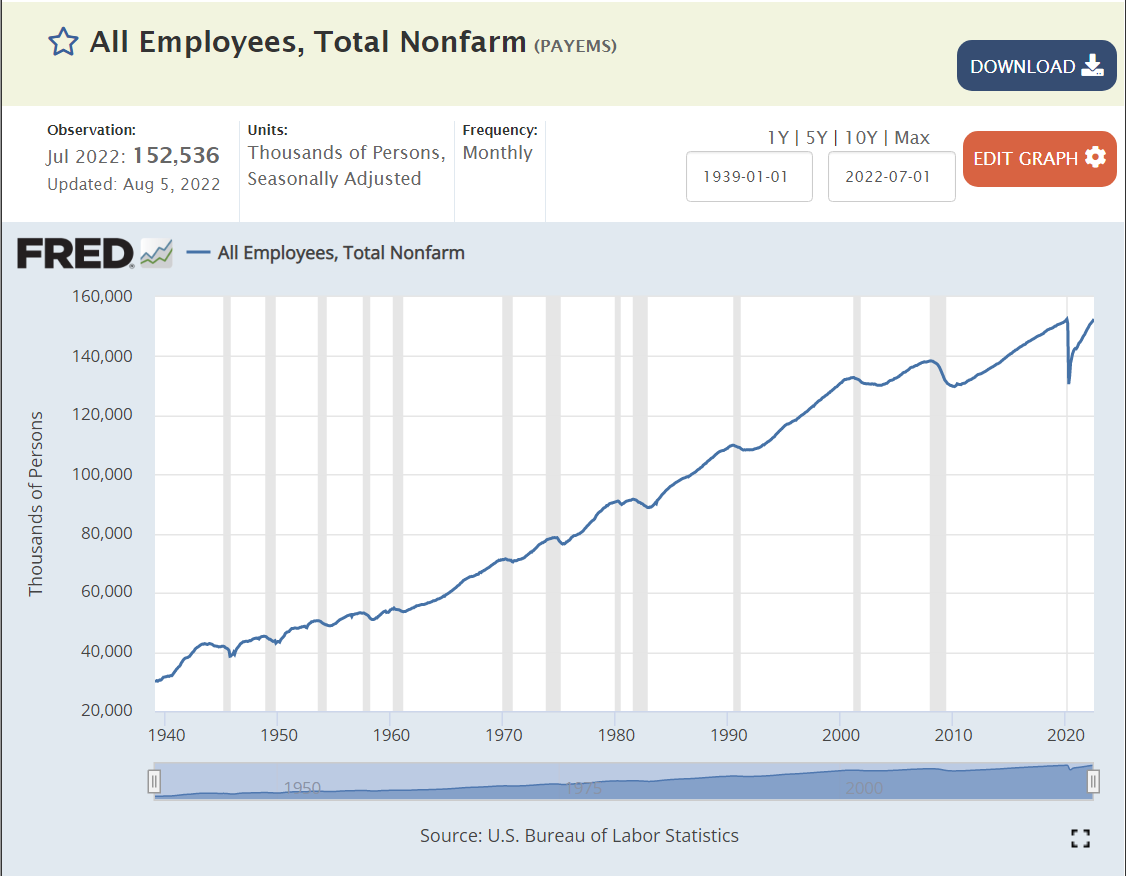
We have two sources, a payroll survey and a household survey. They both tell the same story.

https://fred.stlouisfed.org/series/PAYEMS

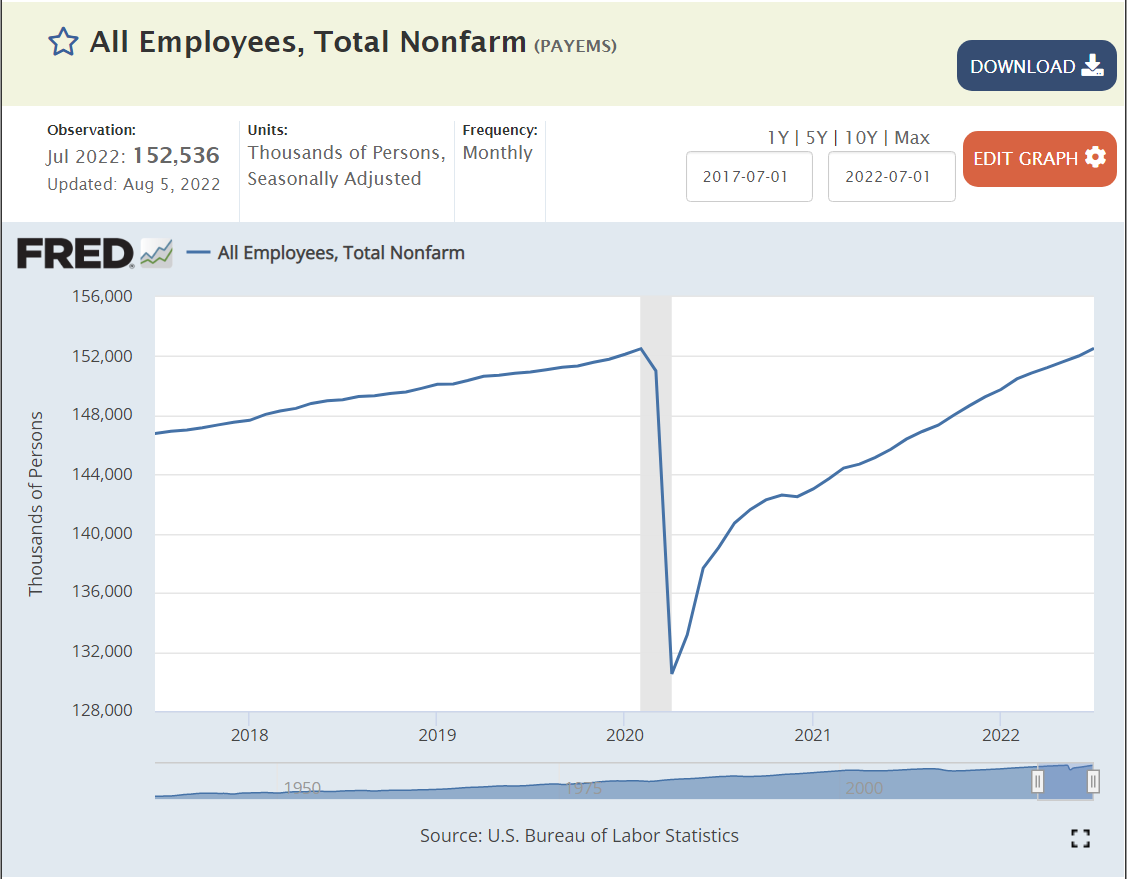
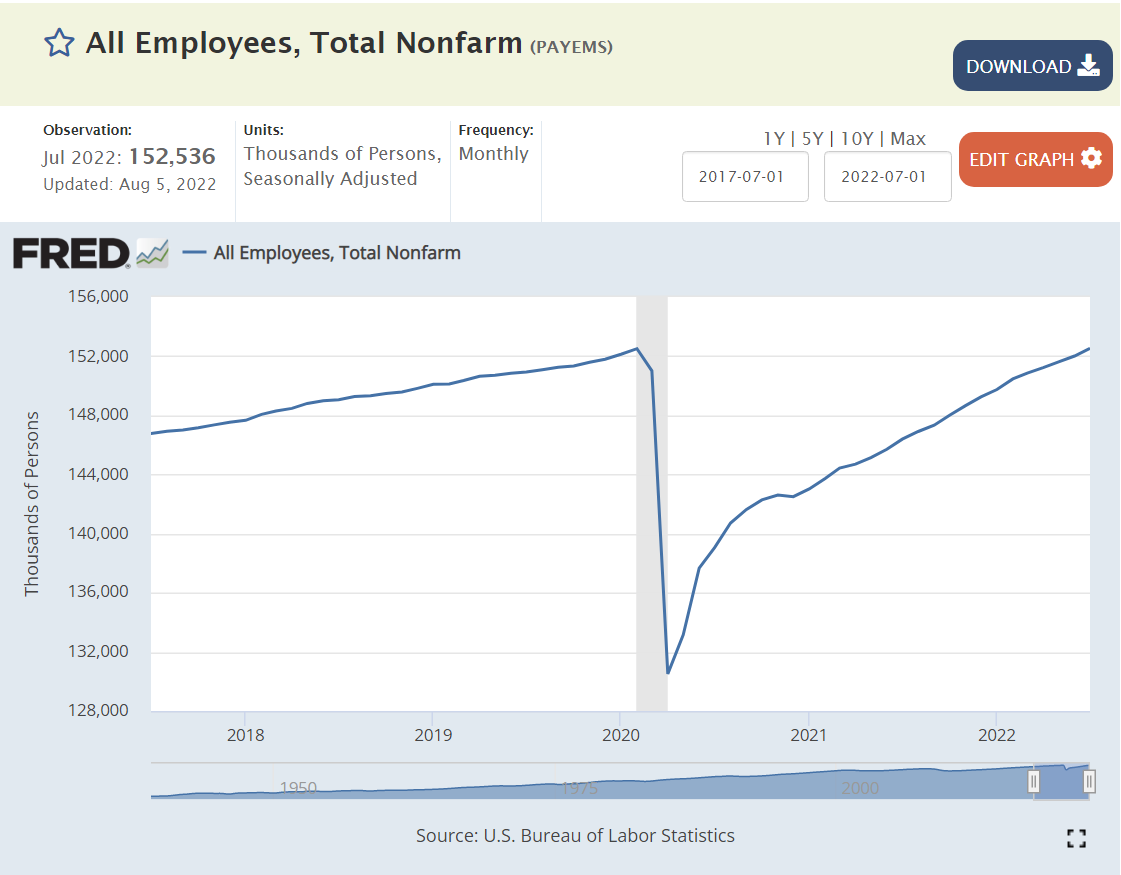
A once in a century pandemic? No problem. 27 months later, total employment has been recovered, despite a 20M worker decline! Set aside politics. This is an amazing result for the US labor market, businesses and citizens.

https://www.nytimes.com/live/2022/08/05/business/jobs-report-july-economy

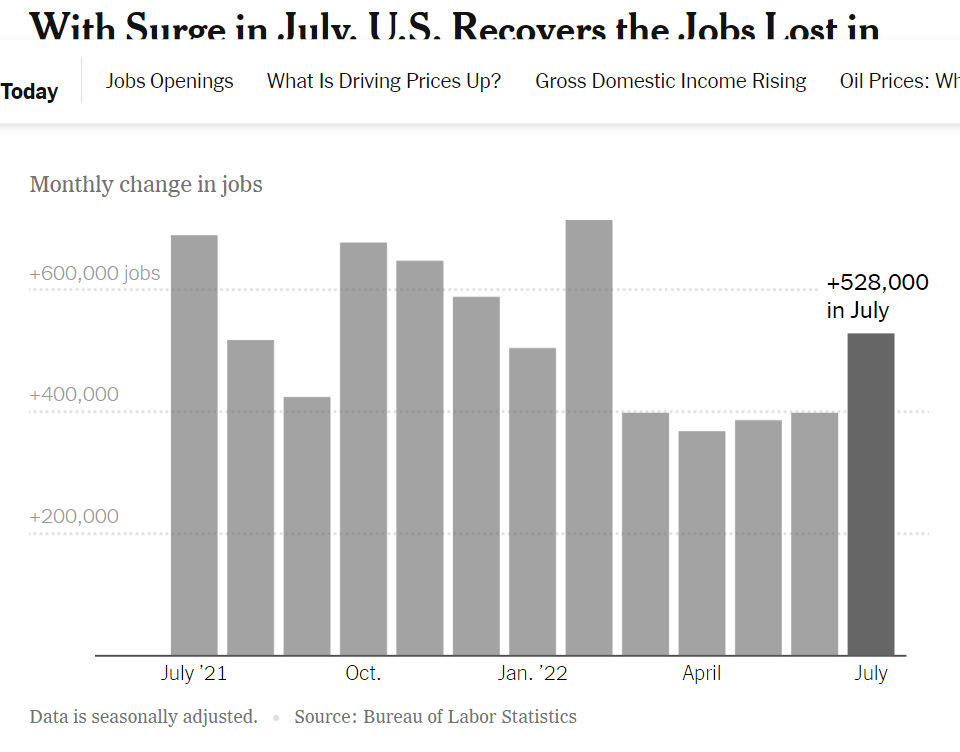
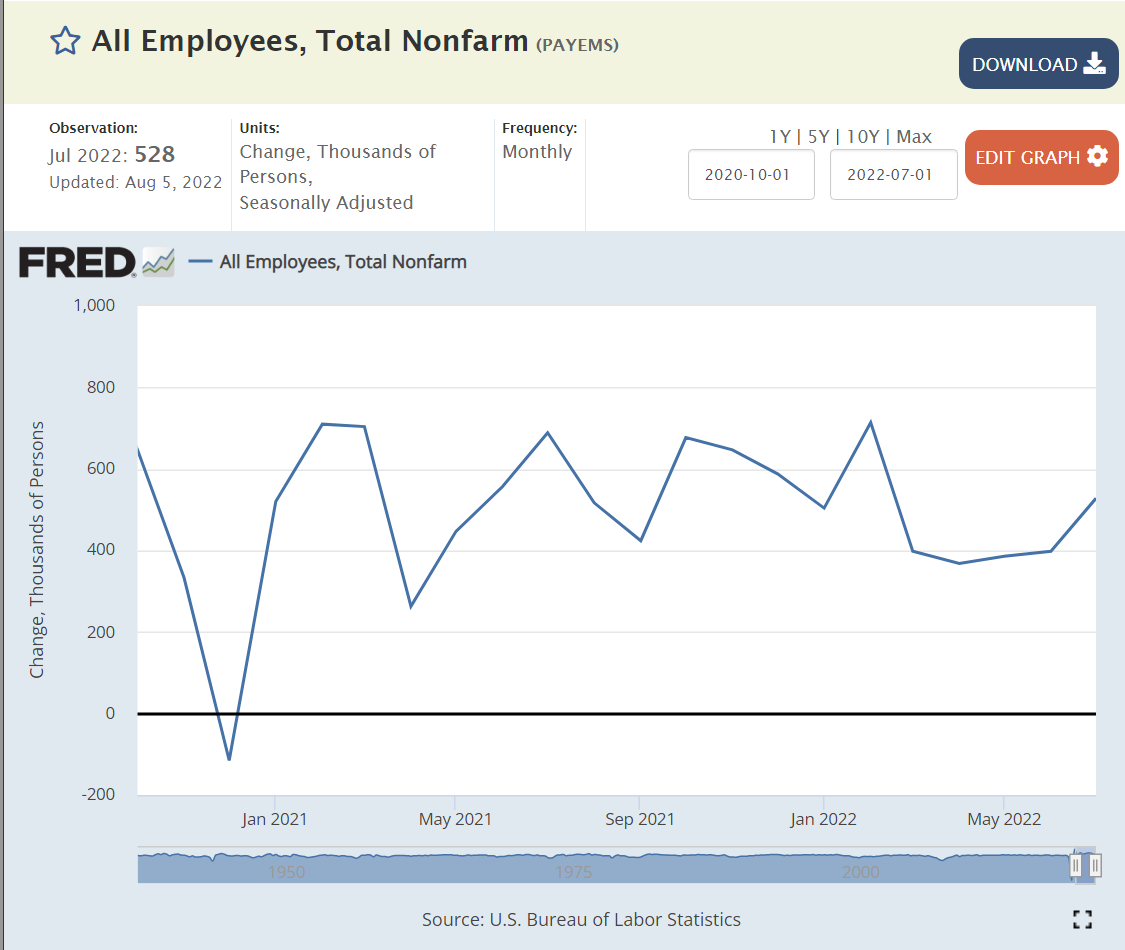
US economy continues to add about 400,000 jobs each month. This is almost 5M jobs per year, more than twice as fast as the usual 2M jobs per year in recent history.

https://fred.stlouisfed.org/series/LNU01300060

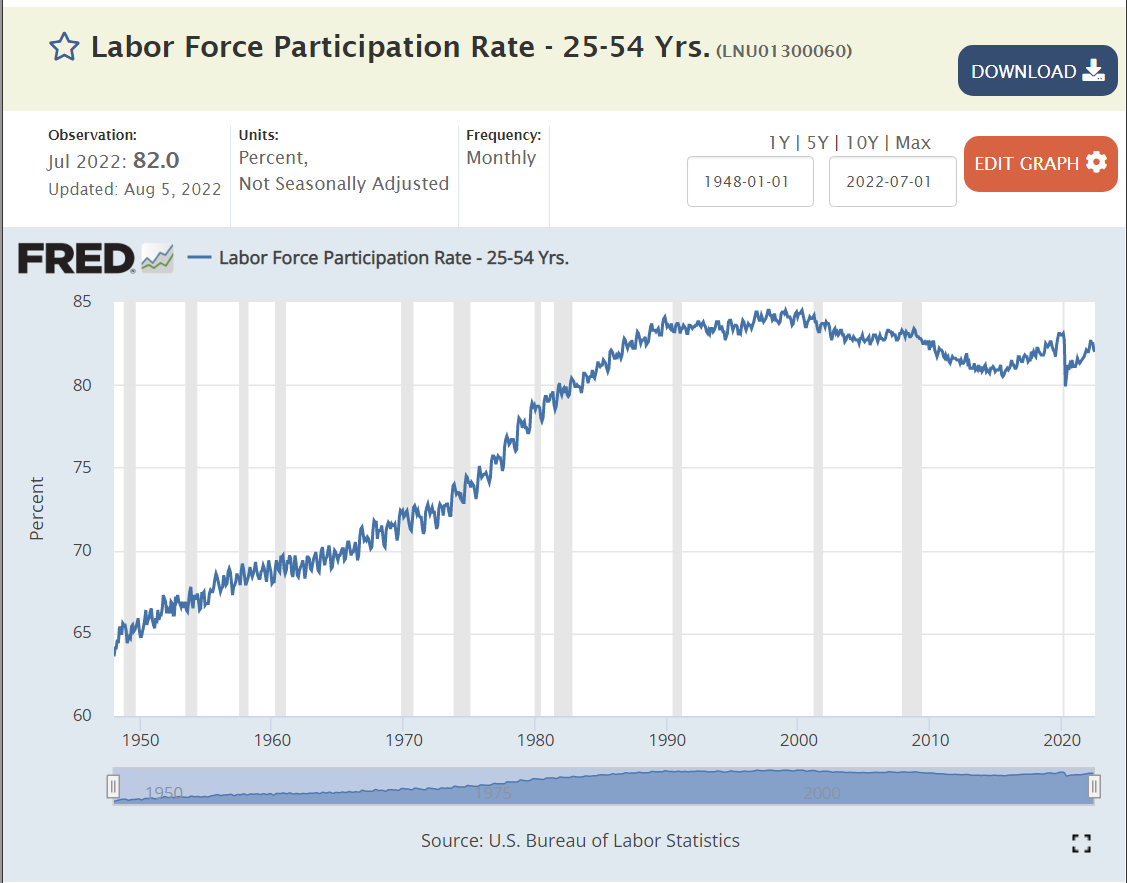
The labor force participation rate for prime aged individuals (25-54) increased from 65% to 84% between 1950 and 1990 as women were accepted into the labor force. 84% was maintained for a decade and 83% for the next decade. The teens decade saw a decline to 81%. The market has remained in the 81-82% participation rate range.

https://fred.stlouisfed.org/series/JTSHIL

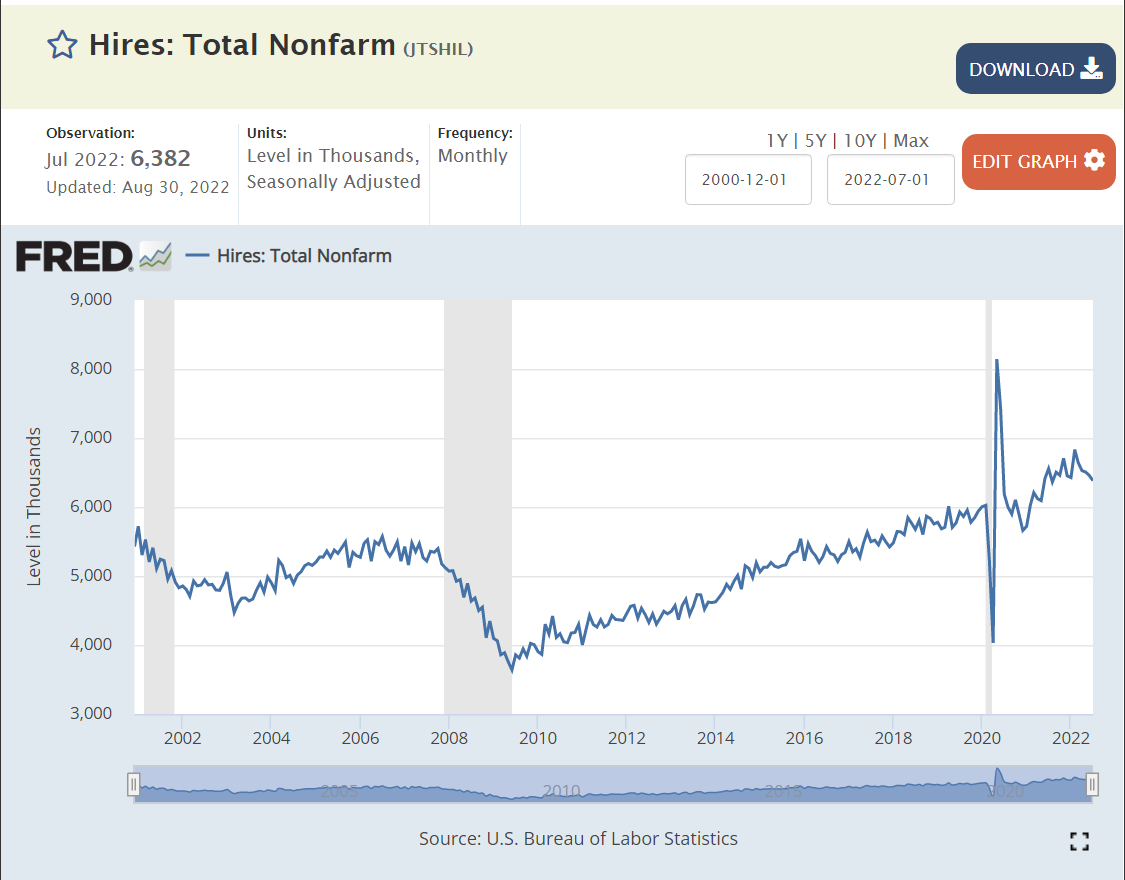
New hires averaged 5M per month in the slower growth “oughts”. New hires dropped further to just 4M per month after the Great Recession. New hires slowly built up to a new record level of 6M per month before the pandemic arrived. The pandemic had just a minor impact on new hires, with a record 6.5M new employees being hired each month in late 2021 and 2022.

https://fred.stlouisfed.org/series/JTSQUR

Voluntary quits averaged 2%, 1 in 50 employees, during the first decade of the 21st century. Quits dropped sharply to just 1.4%, just 1 in 70 employees, in the 3 years afterwards. The quit rate slowly returned to “normal” by 2016 and climbed further to 2.3% as the economic recovery continued for a full decade.

By October, 2021 quits had returned to the solid pre-pandemic rate of 2.3%. The quit rate jumped up to 2.8% by April, 2021 and has remained at this historically high rate.

https://fred.stlouisfed.org/series/JTSJOL

Job openings averaged 4M before the Great Recession. They dropped below 3M during 2009-13. They increased to 5M in 2014 and to 6M by 2016. They remained at the 6M level during 2017, before climbing to 7M for 2018-19. By Jan, 2021 job openings had recovered to 7.2M. By October, job openings had increased to a historic 11M and have remained at this unprecedented level.

This is a greater than 50% increase in open positions since before the pandemic, just 29 months ago. This is 120% more than the peak level before the Great Recession.

Most Important Measure

Profit maximizing businesses, managers and HR departments work through internal processes to list/post a job opening only when:

  1. It’s within the annual financial and headcount budget.
  2. Hiring managers conclude that current staff are unable to serve current demands from internal and external customers.
  3. Hiring managers and financial analysts believe that the incremental hired employees will generate incremental measurable profits.
  4. Hiring managers believe that they can hire new staff using existing processes to fill well defined positions.
  5. Hiring managers believe that it is worth their time to go through the firm’s hiring process.
  6. Hiring managers cannot find an “adequate” labor source through stretching existing staff or using temporary, contract, supplier or agent work forces.

11M job openings means that firms believe that they can generate material incremental profits by hiring up to 11M new employees.

https://www.bls.gov/charts/job-openings-and-labor-turnover/unemp-per-job-opening.htm

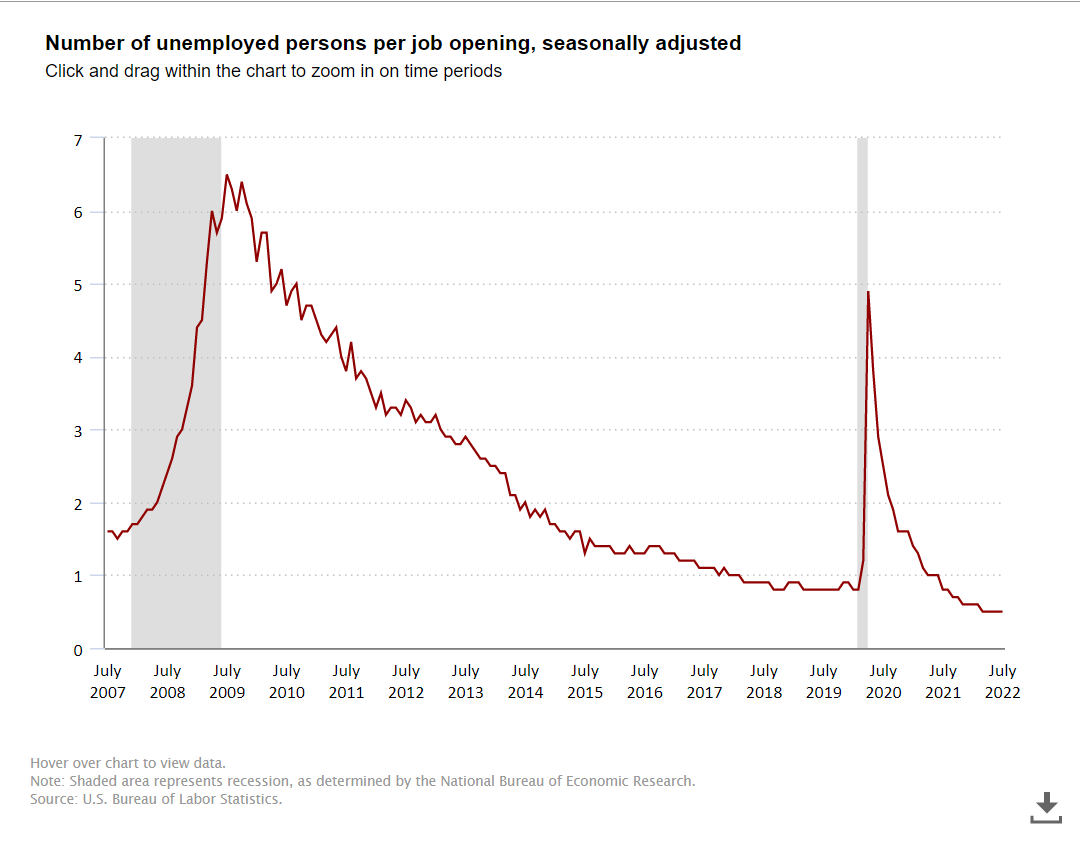
11M open jobs is a startling number, but the ratio of unemployed persons to open positions is much more important. The Great Recession created a 6 applicants per job market. This declined to 2:1 in 2014. During the historic extended expansion it declined to just below 1:1, an unprecedented low number. The ratio fell below 1:1 in 2021 to the current 0.5 level. Two open positions for every unemployed job seeker.

https://fred.stlouisfed.org/series/UNRATE

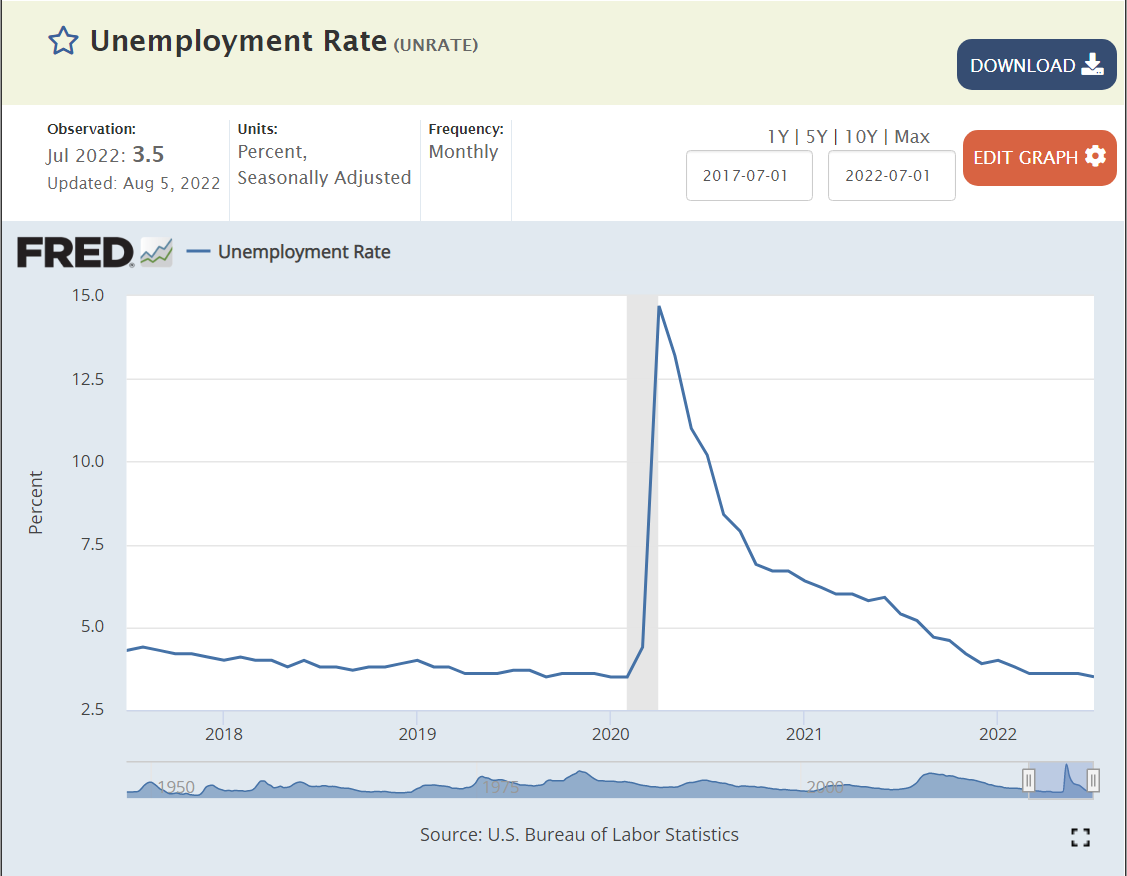
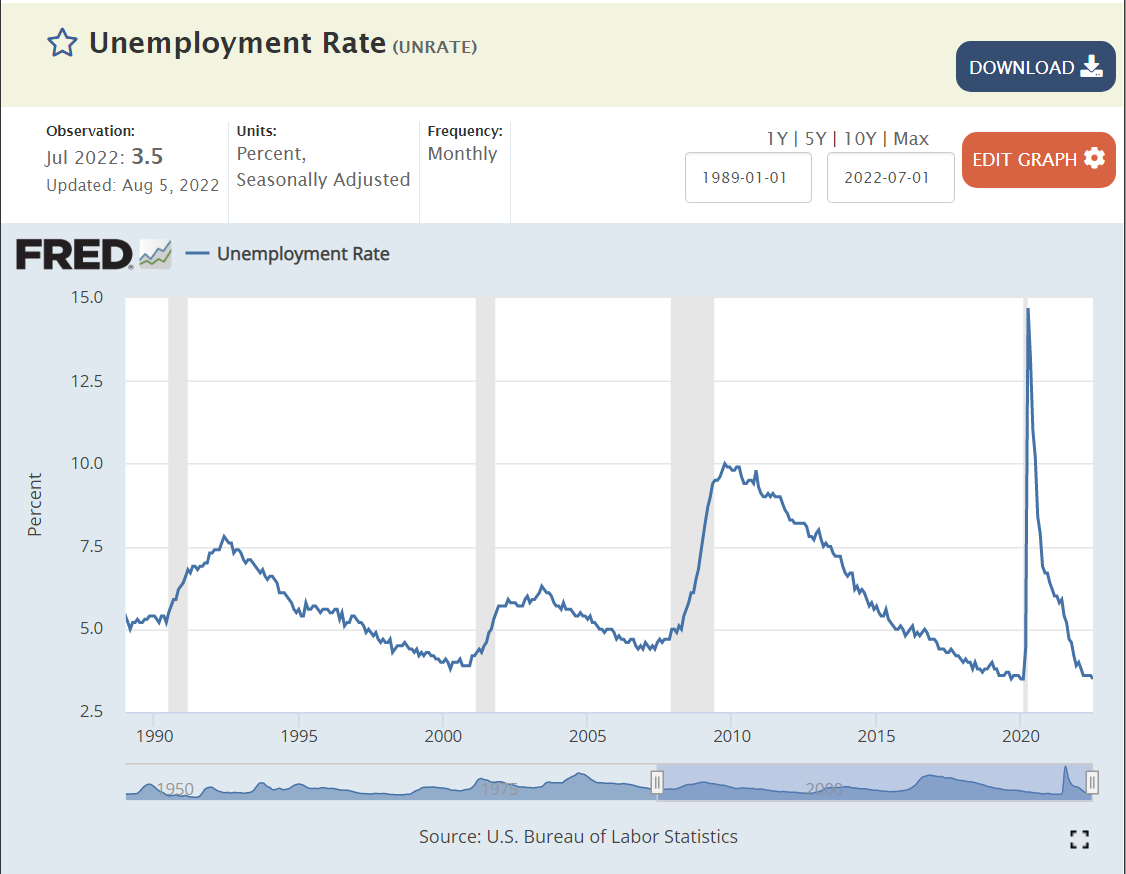
Unemployment was quickly driven to the pre-pandemic record low of 3.5% this summer. Unemployment was below its usual minimum of 5% for 5 years just before the pandemic, leading most economists to recalibrate the “non-accelerating inflation rate of unemployment” (NAIRU) down to 4% or slightly below. This is a very efficient labor market.

https://fred.stlouisfed.org/series/LES1252881600Q#

Real (inflation-adjusted) wages have reflected this labor market situation. They remained at the $335/week level from 2000 through 2014, reflecting the slow growth of employment and GDP. Wages began to raise in real terms in 2015, reaching $360 by 2019, a 7.5% real increase. Wages were growing rapidly just before the pandemic and climbed to $390/week in the second quarter of 2020, an additional 8% increase in a few months. Real wages have since declined back to the $360 per week level as high inflation has offset higher than usual nominal wage increases. Firms have chosen to live with 11 million open positions rather than increase real wages.

Summary

Firms have 11M open positions that they believe will help them to make greater profits. Real wages are the same as they were just before the pandemic started. Firms have chosen to not increase hiring and regular wages any faster because they judge that this will cost them more profits than allowing 11M positions to remain unfilled. This is the first time in at least 50 years that firms have had to manage a labor market where employees and applicants have some market power. Despite this “standoff” in the labor market, total employment is back to the pre-pandemic level, firms are hiring record numbers of employees and labor force participation is recovering towards the pre-pandemic level, which was at a 10-year high. The overall economy has clearly slowed its growth rate to near zero, but the labor market remains in a very positive state for workers.

Good News: The US Economy is a Job Creating Machine

https://www.copelandintl.com/blog/oilfield-equipment/the-best-allison-transmission-models-for-your-industry/

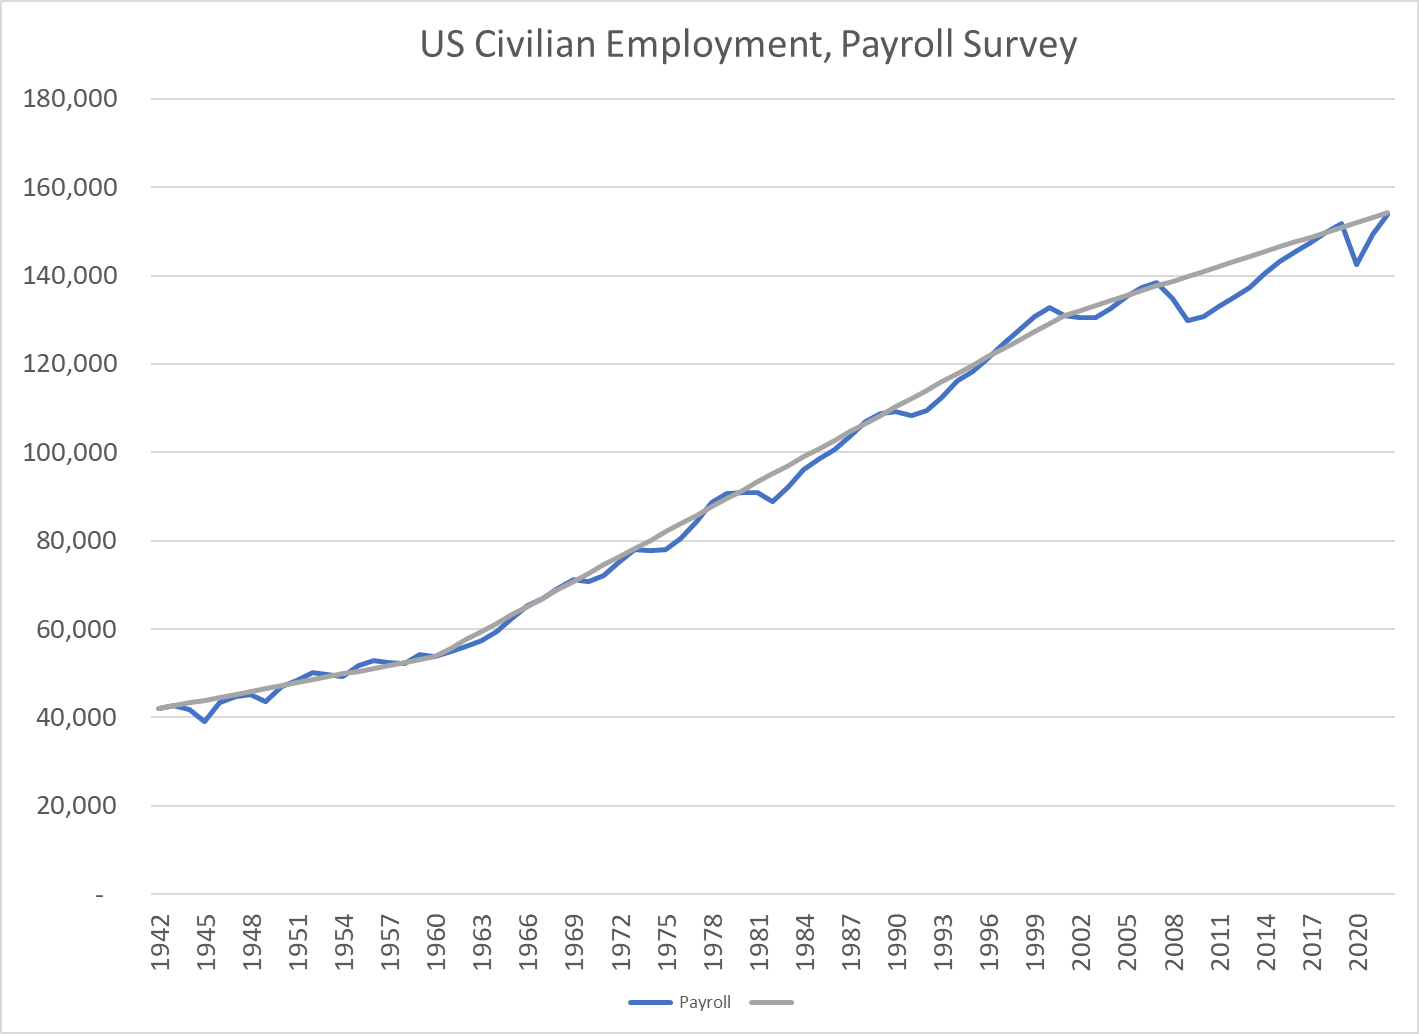
In 1942, the US economy employed 41.9 million people in firms. At the end of 2022, the number will be 153.8 million, an increase of 267%. Yes, for very 3 jobs in 1942, we have 11 today. Yes again, almost 4 times as many in 2022 versus 1942, despite the 9 million jobs lost in 2008-9 and the 9 million jobs lost in 2020.

https://fred.stlouisfed.org/series/PAYEMS#0

The US economy added 12 million jobs between 1942 and 1960, growing from 42 to 54 million positions. Job growth averaged nearly 700,000 per year or 1.4% annually. This was a period of solid growth, despite the 4 recessions.

https://fred.stlouisfed.org/series/PAYEMS#0

The period from 1960 through 2001 showed truly remarkable job growth. The economy added 78 million jobs, almost 1.9 million each year or 2.2% annually. STOP and think about this. The Greatest Generation, WW II saving the planet team was just 40 million employees in the US. The immediate post-war boom increased employment to 55 million when the US was the only advanced economy running at full speed. But employment growth accelerated from 1960 to 200. These 4 decades essentially tripled the size of the US economy.

https://fred.stlouisfed.org/series/PAYEMS#0

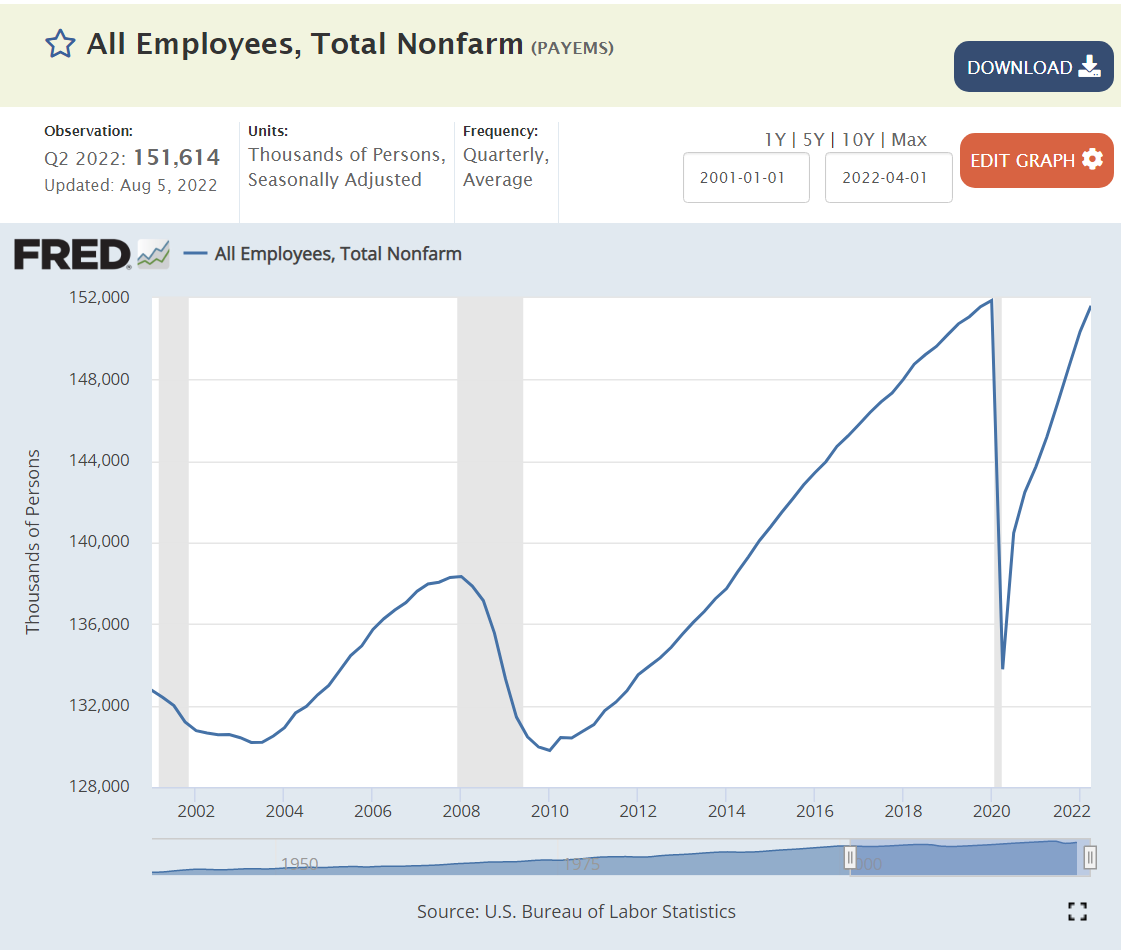
Overall, the last two decades have delivered much slower job growth. Using 2019 as an ending measure, the economy grew by 21 million jobs, from 131 to 152 million since 2001. This is just 1.1 million per year, or a growth rate of 0.8%, far below the 2% plus rate of 1960-2000. Or, the 21 million added jobs is one-half of the jobs in 1942 in the heart of WW II.

But, these two decades experienced the post-millennium downturn, the great recession and the covid pandemic.

The economic recovery from the millennium (Y2K) was quite slow. The recovery from the Great Recession was slow but strong and extended, allowing unemployment rates to eventually reach 3.5%. The recovery from the pandemic situation was much faster than expected, reaching pre-pandemic levels of GDP and employment within 2 years.

The economy has been adding 400,000 jobs each month since the beginning of 2021, almost an amazing 5 million jobs annually.

Million Jobs Added Per Year in Economic Recovery Periods

1948: 2.0

1952: 2.2

1956: 1.8

1959: 2.0

1969: 1.9

1973: 2.4

1980: 2.2

1990: 2.5

2000: 2.7

2007: 1.6

2019: 2.2

The US economy adds 2 million jobs each year when the economy is expanding. The percentage growth rate is slower through time, but the 2 million jobs added each year remains a solid capacity or capability.

Summary

The US economy added 1.4% new jobs annually from 1942-1960. The jobs growth rate averaged a very strong 2.2% from 1960-2021. It then slowed to just 0.8% annually while digesting the Great Recession and the COVID pandemic. The economy added more than 2 million jobs each year after the Great Recession, pushing unemployment to a very low 3.5%. The economy rebounded from the pandemic much faster than the consensus view,

https://fred.stlouisfed.org/series/PAYEMS#0

Despite

  1. increased international trade
  2. greater share of immigrants
  3. greater percentage of federal government spending
  4. fewer new businesses started
  5. declining shares for agriculture, mining and manufacturing
  6. greater outsourcing of corporate functions
  7. greater share of contracting, non-traditional employment, part-time employment
  8. lower rates of geographic mobility
  9. lower rates of economic upward mobility
  10. greatly increased political polarization at the state and local level
  11. decreased labor force participation rates
  12. increased opioid and drug damage rates
  13. lower community service participation rates
  14. lower church attendance and membership rates
  15. lower male college attendance and graduation rates

Despite the very many headwinds, the US economy is still able to add 2 million jobs annually during economic recovery periods. It added 9 million positions in 2021 and looks to add almost 5 million positions in 2022 despite the weakening business cycle. Even with a slowing economy, the US is likely to add 2 million new positions in 2023 and 2024.