https://www.friendsofnotredamedeparis.org/the-stained-glass-of-notre-dame-de-paris/

https://www.misoenergy.org/about/
One of the “control centers” at MISO Energy in Hamilton County.

Hamilton County’s unemployment rate has averaged 3.1% since 1990, a little more than one-half of the nation’s 5.8% average. The Indy metro area has averaged 4.6%. In the last decade, Hamilton County has still averaged 2.0% lower than the national average of 5.3%.
https://fred.stlouisfed.org/series/UNRATE#0
https://www.advancedsciencenews.com/what-are-mrna-vaccines/
Since WW II, the US and the world have been on a tear, inventing at a pace never seen before. We have dozens of breakthroughs in basic science/materials, medicine/biotechnology, space, electronics, computers, networks, the internet and artificial intelligence. I’ve set aside advances in business processes and pure science, math, social sciences, philosophy and the humanities. I’m not addressing the potential costs and risks of a more technologically advanced civilization. I just want to briefly outline the major technical innovations of the last 75 years. I have grouped them into 3 buckets: traditional industries, medicine and computers.
The computer advances account for 54 of the 115 items, a little less than one-half. There are 21 hardware and network items, about one-sixth of the total (18%). Software broadly defined to include the internet and artificial intelligence sum to 33 items, a solid 3 out of 10 (29%). The 22 medical innovations represent roughly one-sixth of the total (19%). The 39 traditional, historical areas combine for one-third of the inventions.
I won’t describe the innovations in detail. I’ll append web links at the bottom which provide thumbnail sketches of this history and its importance. I expect that my readers know and use these innovations. I’m attempting to summarize then in order to provide perspective. The dominance of computer and communications advances is the biggest takeaway. I expect to see both incremental advances in each category and innovative combinations of computer software, communications, medicine and basic science in the next 25 years.
The green revolution, high yield varieties of rice and other crops
Genetically modified organisms (GMO)
Radial tires, power steering, fuel injection
Electronic ignition, transmission controls, anti-lock brakes
Traction and cruise control, lane warnings
Hybrid and fully electric powered cars
Commercial jet engines and aircraft, 747, SST.
Manned space flight
Communications and weather satellites
Drones and unmanned aerial vehicles (UAV)
International space station
Hubble and Webb space telescopes
Reusable rockets
Nuclear powered electricity production
Photovoltaic solar energy cells
UPC, bar codes, scanning and RFID tags
Fiber optic communication cables
Carbon fiber composites, Kevlar, Teflon, and plastics
LED lights
LCD displays
Lithium-ion batteries
Biofuels
Large wind turbines
3D metal printing
Credit card networks
Lasers
Microwave ovens
Automated teller machines (ATM)
Cable television
Robots
Scanning/tunneling microscopes
Portable GPS tracking
Color TV, remote controls
Electric guitar and music synthesizer
Video tape/cassette recorders
Video games, consoles, controllers
Transistor radios, music players, and handheld calculators
Voice mail, answering machine, caller ID, 911
E-readers
Virtual/augmented reality
Heart surgery, open-heart, bypass, stents, balloons, heart-lung machine
Organ transplants: heart, lung, liver and kidney
Minimally invasive surgery, endoscopy, laparoscopy
Contact lenses, laser eye surgery
Kidney dialysis machines
Internal pacemaker, artificial heart
Fetal ultrasound monitor
Magnetic Resonance Imaging (MRI), Computed Tomography (CT)
Oral contraceptives
Darvon, valium, tetracycline, Prozac
Chemotherapy
Statins, ACE inhibitors, beta-blockers
HIV protease inhibitors
DNA structure
Diphtheria, pertussis, tetanus, polio, whooping cough vaccines
DNA sequencing tools
Gene editing
In vitro fertilization
Cloning
Human genome sequenced
Personal DNA testing
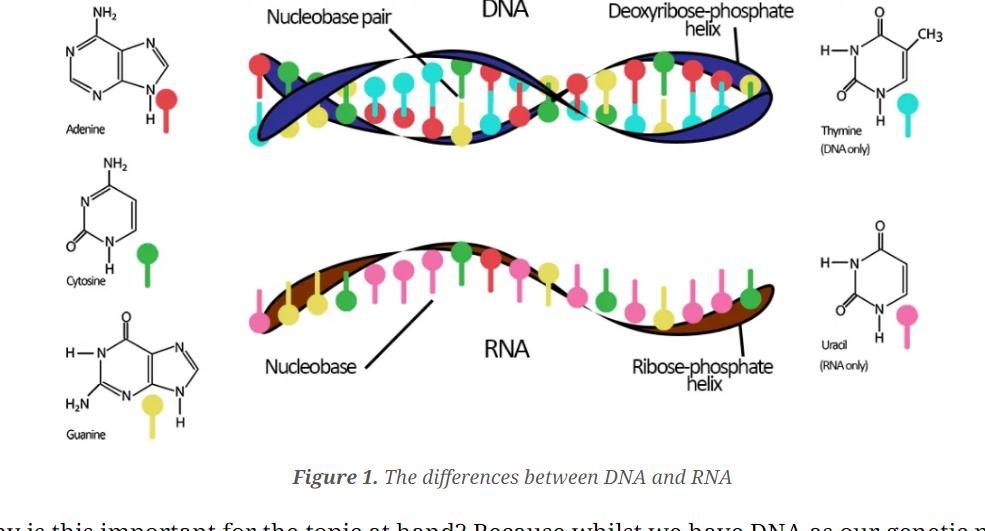
Malaria, shingles, meningitis, covid-19, mRNA vaccines
Integrated circuits
Microprocessor chips
Dynamic Random Access Memory (DRAM) chips
First commercial computer, UNIVAC
Standard layered computer architecture, integrated computer system
Graphical user interface – screen, keyboard, mouse, software
Personal computer, microcomputer, laptop
Supercomputer, quantum computer
Mouse controller
Laser printer, ink jet printer
Palm pilot, smart phone, iPhone
Hard drive
Floppy disk
Compact disc
DVD
Arpanet, packet communications
Wired ethernet, local area network (LAN)
Mobile phone networks: CDMA, GSM, 4G, 5G
Wi-Fi
Bluetooth
Metro wide area: IEEE 802.16
Cell phone, digital cell phone … smart phone
Programming languages: COBLOL, Fortran, Basic
Operating systems: UNIX, Linux, DOS
Windows, multiple app interface
Relational database architecture
Database, query, report writing
Word processing, desktop publishing, blogs
Standard email, calendars
Text messaging
Spreadsheets, graphics, database
CAD/CAM, Photoshop
EDI, e-commerce, Amazon
Enterprise Resource Planning (ERP) systems
Google maps
Digital camera, pictures, storage
Digital music, MP3 standard, Napster sharing
Digital voice, VOIP
Digitial video recording, YouTube
Streaming of music and video
Decentralized network model
WWW addresses, domains, HTML language, URL
Web browsers
Search engine, Google
Peer to peer large file transfers
Open-source software: Wiki, Linux
Social media networking – Facebook
Video conferencing/Zoom
Internet of things (IOT)
Blockchain, bitcoin, crypto currency
Language translation
Voice to text translation
Facial recognition
Digital/personal/voice assistant
Autonomous driving vehicles
Artificial intelligence
https://www.cnet.com/tech/tech-industry/25-technologies-that-have-changed-the-world/
‘https://www.theclever.com/15-incredible-internet-innovations-that-changed-everything/
https://www.cnbc.com/2011/09/19/15-Influential-Innovations-of-the-Past-50-Years.html
https://smallbusiness.chron.com/10-greatest-technological-inventions-40511.html
https://www.popularmechanics.com/technology/g24668233/best-inventions/
https://thebossmagazine.com/21st-century-inventions/
https://www.thoughtco.com/fifties-to-nineties-inventions-4144741
https://www.techwalla.com/articles/famous-inventions-of-the-1960s
https://www.tti.com/content/ttiinc/en/resources/blog/10-best-electronic-inventions-from-the-70.html
https://orgs.wku.edu/ttas/anniversary/anniv-70s-inventions.php
https://www.zdnet.com/article/technology-that-changed-us-the-1970s/
https://www.zdnet.com/article/technology-that-changed-us-the-1980s/
https://www.zdnet.com/article/technology-that-changed-us-the-1990s/
https://hms.harvard.edu/about-hms/history-hms/timeline-discovery

Beer and wine.
Brass, iron, nails, steel; steel alloys, Bessemer process.
Bricks, cement, concrete, asphalt; reinforced concrete.
Compass; marine chronometer.
Domesticated horses and animals.
Farming.
Fire; fire extinguishers.
Language, writing, alphabet.
Paper.
Plow; steel plow.
Ships, sailboats.
Swords, weapons, gunpowder, matches; gatling gun.
Tools.
Waterpower, water control, indoor plumbing, toilets, drainage, aqueducts.
Wheel, chariot, water wheel; pneumatic tires.
Mechanical clocks and watches.
Paper currency; ATM (1950).
Printing press, movable type, linotype, typewriter.
Lenses, mirror, microscope, telescope, magnifying glass.
Electricity generation, turbines, batteries, electric motors.
Steam engine, turbine.
Internal combustion engine, automobile, tractor.
Railroad, locomotive.
Anesthesia.
Distilled oil products, diesel, kerosene and gasoline.
Telephone.
Airplane
Automobile
Camera; digital camera
Electric light bulb; fluorescent, LCD, LED
Moving pictures
Phonograph
Radio
Refrigeration
Vaccines
Medical diagnostics: X-Ray; MRI, CT scan
Antibiotics, penicillin
Electronic computer, Turing machine, personal computer; after arithmetical machines, abacus and slide rule.
Contraceptives
Geographical positioning system, (GPS) and mapping.
Vacuum tubes, integrated circuits, semiconductors and microprocessors.
Nuclear fission, fusion, power and bombs.
Television.
Genetics, gene editing, DNA.
Mobile phone networks, infrastructure and personal devices.
Internet communications network.
World wide web addressing structure.
Artificial intelligence.
Smartphones.
The greatest technical innovations of humanity cover a broad range of life: food/cooking, construction, travel, transport, household, finance, science, power, medicine, entertainment and calculation.
We have a dozen major inventions in both of the 19th and 20th centuries. Change appears to be accelerating…
https://ehistory.osu.edu/articles/greatest-inventions-past-1000-years
https://startupguide.com/the-40-greatest-innovations-of-all-time
https://www.livescience.com/33749-top-10-inventions-changed-world.html
https://bigthink.com/the-present/inventions/
‘https://www.cadcrowd.com/blog/top-100-famous-inventions-and-greatest-ideas-of-all-time/
https://www.history.com/news/11-innovations-that-changed-history
https://www.scientificamerican.com/article/inventions-what-are-the-10-greatest-of-our-time/
https://interestingengineering.com/lists/19-great-inventions-that-revolutionized-history
https://interestingengineering.com/lists/35-inventions-that-changed-the-world
https://pickvisa.com/blog/best-inventions-in-the-world
https://www.inc.com/paul-grossinger/what-are-the-25-greatest-inventions-of-all-time.html
‘https://techengage.com/top-tech-innovations-in-history/#2-pascaline-1642
https://www.visualcapitalist.com/wp-content/uploads/2015/04/worlds-greatest-inventions.html

Real mortage interest rates can be calculated as the difference between nominal mortage interest rates and the 10-year Treasury Bond interest rate. Although nominal interest rates have ranged from 3% to 16%, the real, after expected inflation, interest rates are remarkably consistent, averaging just 1.7% and ranging between 1.3% and 2.1% in 70% of the last 52 years. The peak real rate was 3.0% in 1982 following the unexpectedly high and remaining high nominal rates of the prior 4 years.
Banks, mortgage-backed securities investors and mortgage borrowers all take risks when they complete mortgage transactions. Lenders are betting that their present and future borrowing interest rates are and will be low enough to fund their mortgages at a profit. Each lender locks in funding commitments for a reasonable share of the loan life and counts on the consistency of interest rates over the business cycle to fund the remaining portion. Lenders that experience a mismatch put their stockholders’ equity at risk and face bankruptcy. Investors in mortgage-backed securities are subject to valuation change risks throughout the period in which they are invested. Most such investors hold diversified portfolios of mortgages (region, amount, riskiness, urban vs suburban vs rural) and non-mortgage assets to ensure that any investment decision will not be too damaging.
Fixed-rate mortgage borrowers are betting that inflation will not fall too much lower than the expected inflation rates when they borrowed. If so, they will be paying back the mortgage in higher real value dollars than expected. If inflation and mortgage rates drop by more than 2%, most borrowers will seek to refinance their mortgages at the new, lower market rates, paying another round of closing costs for this privilege. Fixed rate borrowers are also hoping that inflation will be higher than the expected inflation rates at the time they borrowed, allowing them to pay back their debt with cheaper real dollars. Mortgage originators do not generally have the legal right to “call” the debt and require a change in the rates and terms as many commercial lenders and bond issuers do.
The “good news” is that the US mortgage market is very efficient and the real interest rate premium for borrowing to own a home is just 2% more than what the US government pays for borrowing. Borrowers face interest rate change risks, especially being caught with a high interest rate mortgage when inflation rates fall if they are unable to refinance.
The market has been tested through 7 business cycles and held up very well. The “Great Recession” exposed excessive risk taking by mortgage originators and funders. They lost money and many went out of business. Riskier mortgages are rarely issued today, and government regulations provide some added protection against any future overreach.
For higher income households that itemize deduction on their federal tax returns, the nominal interest rate paid is a tax-deductible offset to earned income. These individuals typically pay 22%, 24% or 34% marginal tax rates. A 5% nominal tax rate can provide a 1%, 1.25% or 1.65% reduction in the effective interest rate, thereby making the 2% real mortgage rate less than 1%. Higher income households can benefit greatly from this tax benefit.

https://content.time.com/time/specials/2007/article/0,28804,1733748_1733756_1735278,00.html

Real, after inflation, Gross Domestic Product is up by one-third, despite the pandemic. That’s 2% annually, despite the Great Recession and the pandemic. The US economy is very solid.

A 21% increase in per capita income during this time. Quite solid and constant growth.
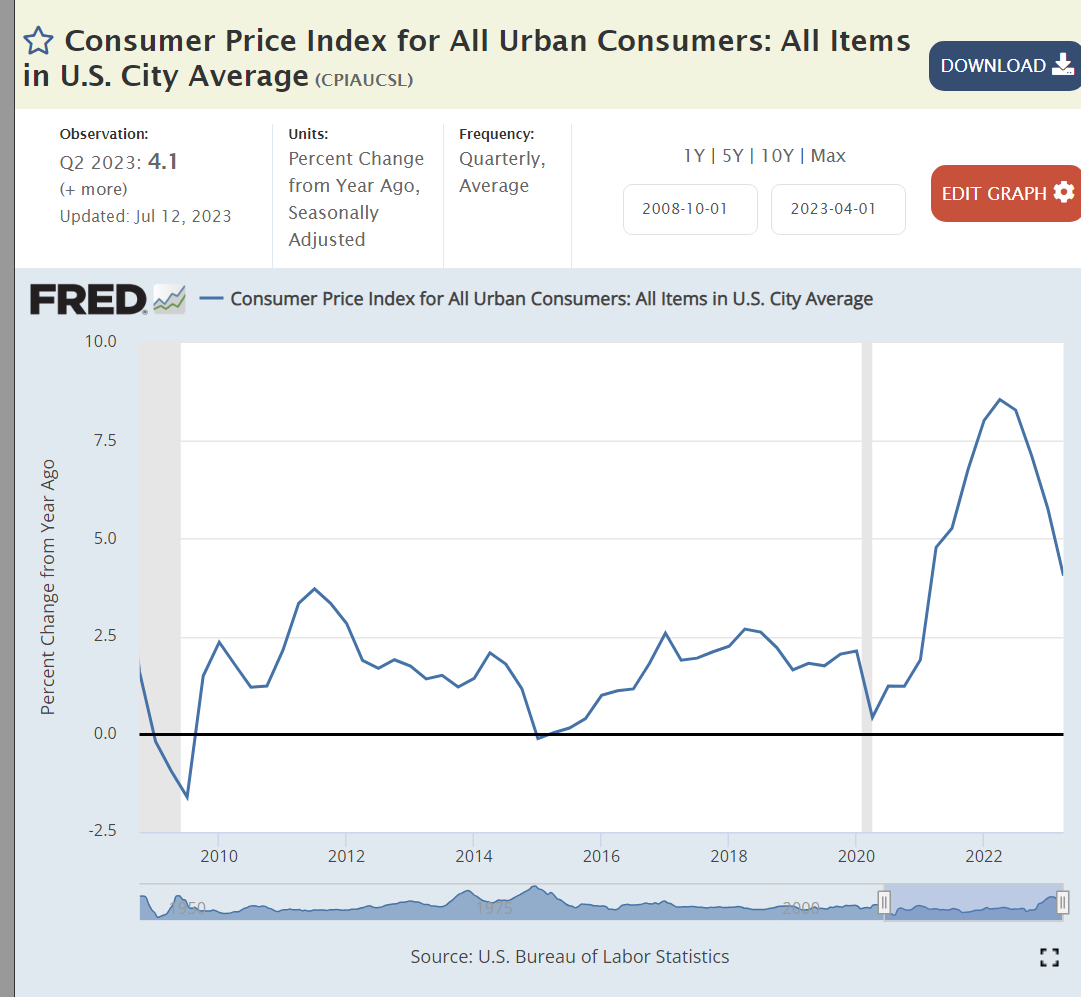
Inflation averaged a bit less than 2% before the pandemic, spiked to 8%, and has since declined to 4%. Experts disagree on whether it will return to 2% soon.

Gas prices are the most obvious component of inflation. They are largely driven by global supply and demand. Prices today are the same as in 2011-14, despite the general inflation increase of more than 20% since then.


Despite the pandemic, US unemployment is at a 50 year low!

Job seekers today encounter 3 times as many job openings.
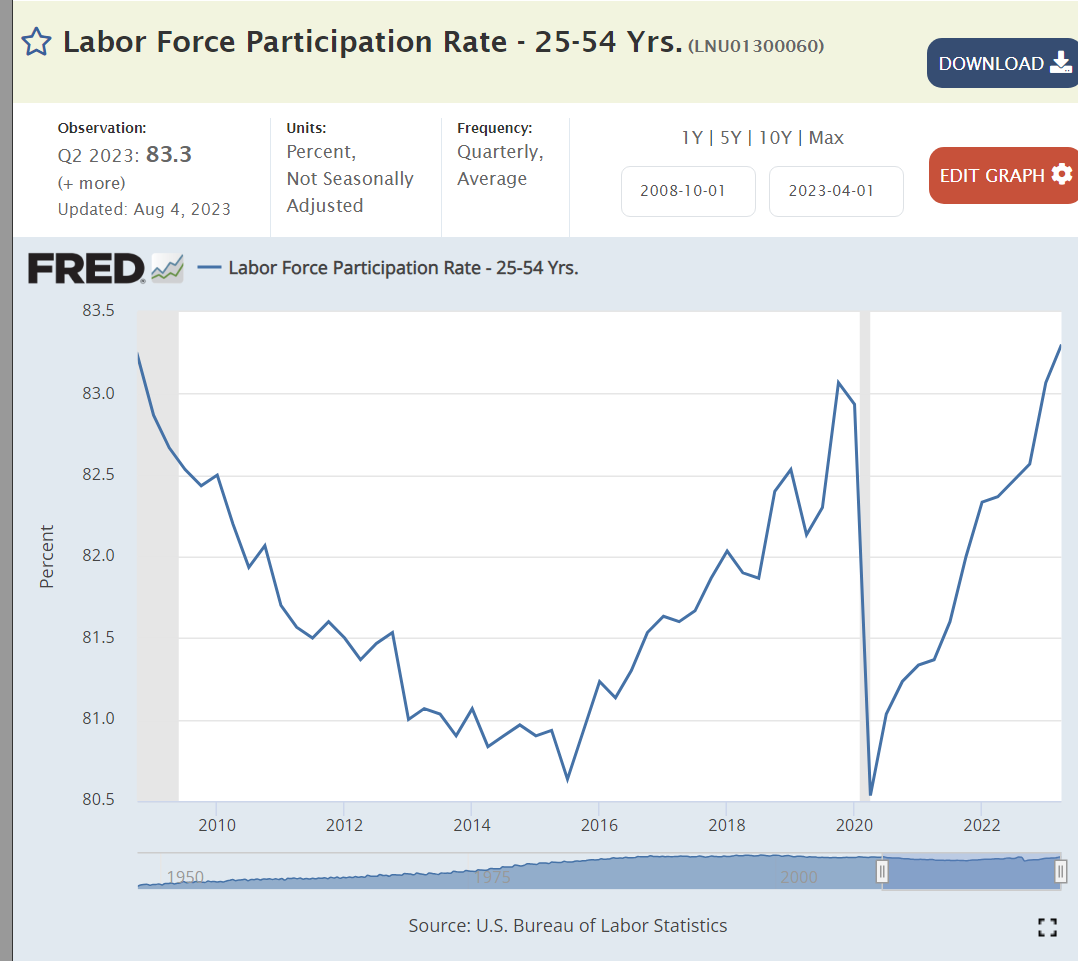
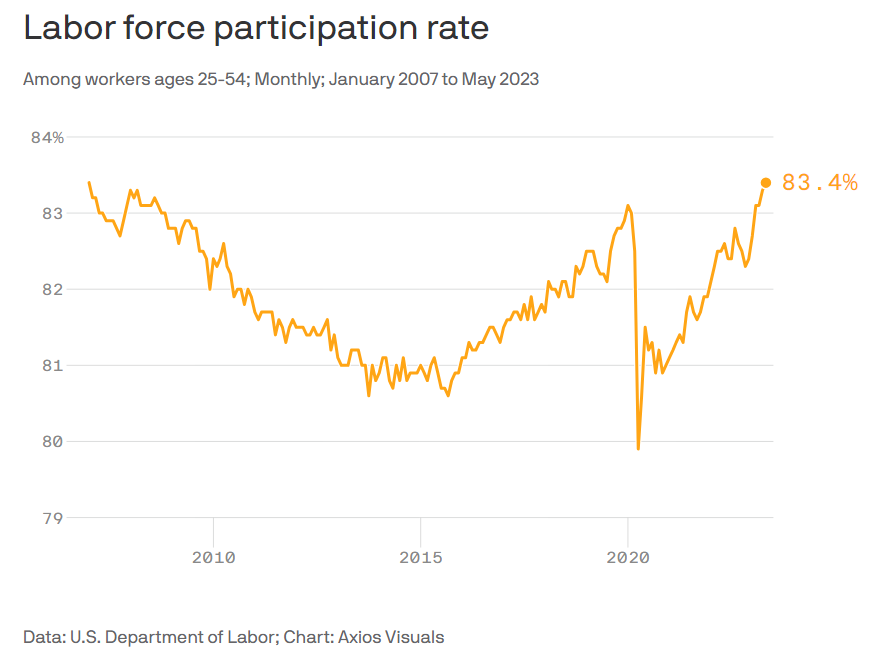
Core age labor force participation has snapped back after the pandemic.

Investment values have doubled.
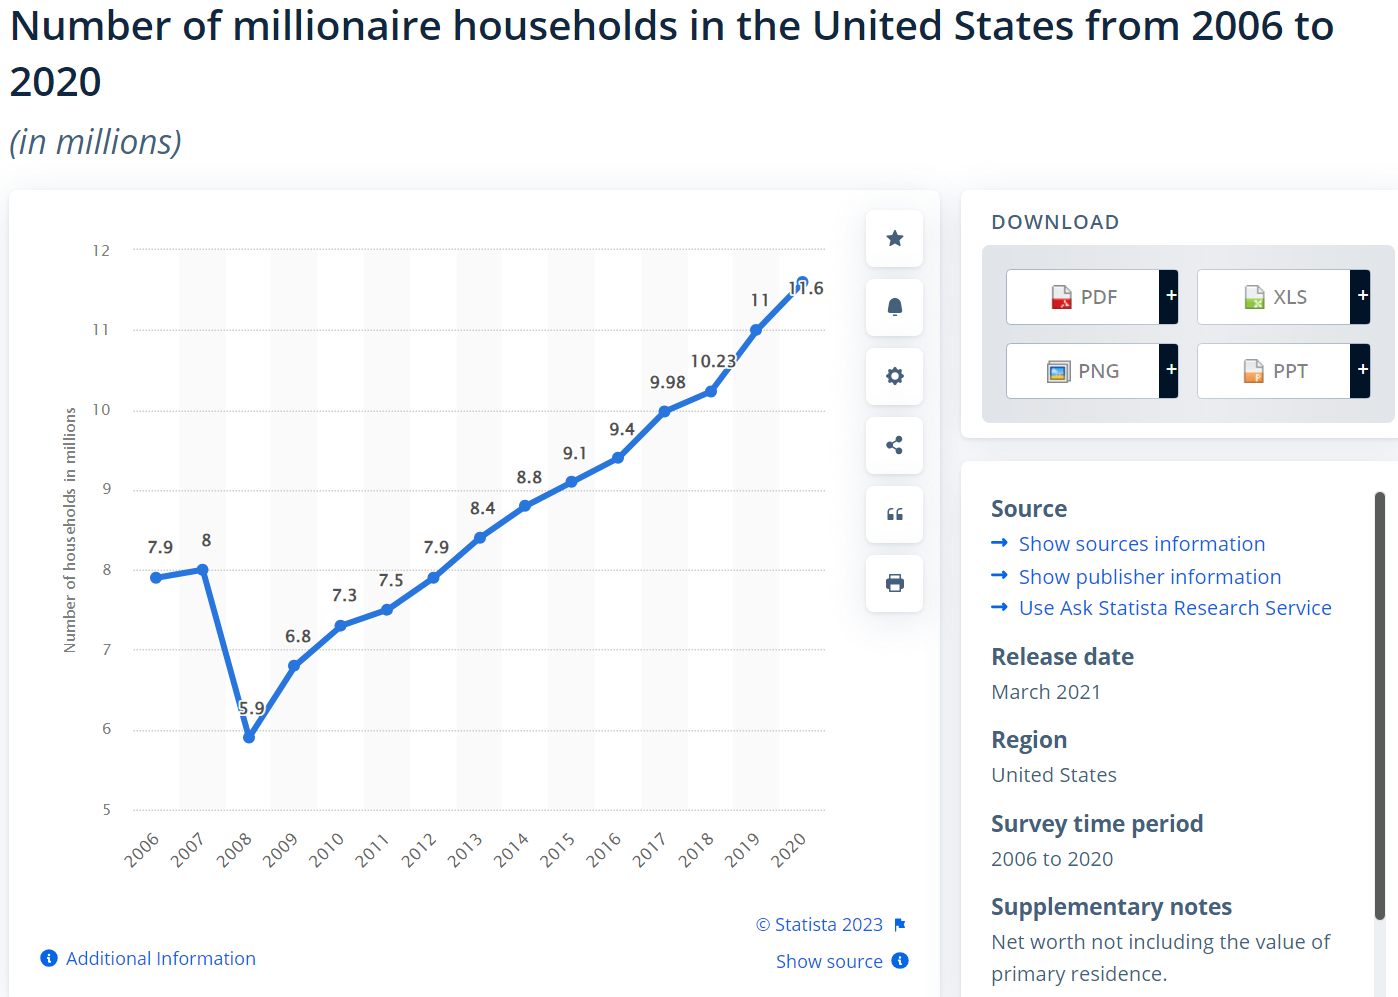

The number of millionaires and billionaires in the US has continued to increase.

Personal savings rates rose from 6% to 9% before the pandemic, shot up and fell back down to just 4% recently.

Housing values have doubled since the Great Recession.

Mortgage rates averaged 4% after the Great Recession, dropped to 3% and then increased to 6%+ as the Federal Reserve raised interest rates.
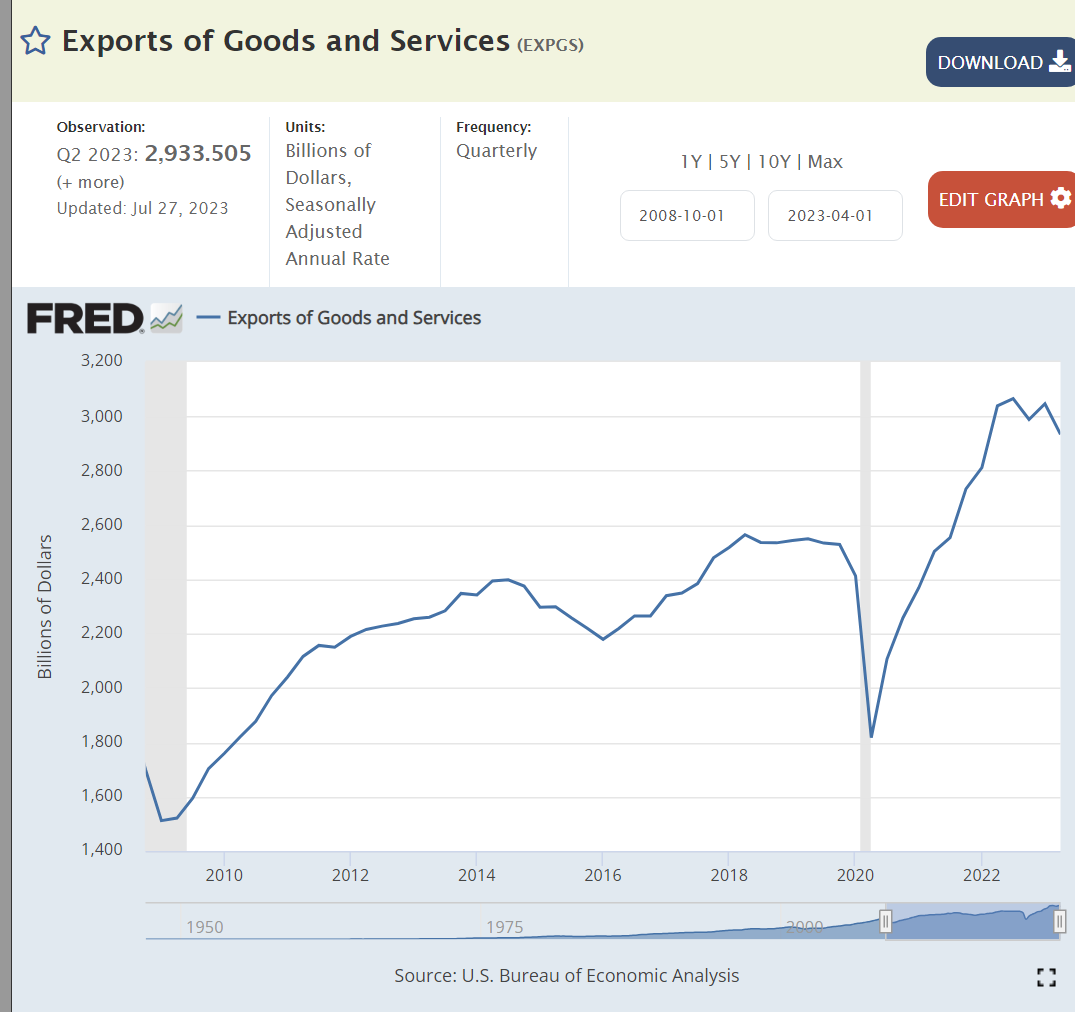
US exports have nearly doubled in 14 years.

Despite the Trump tariffs, which Biden has maintained, imports have also nearly doubled.

Despite historically slower growth rates, higher budget deficits and looser monetary policies, the US dollar is more highly valued today than in 2008.
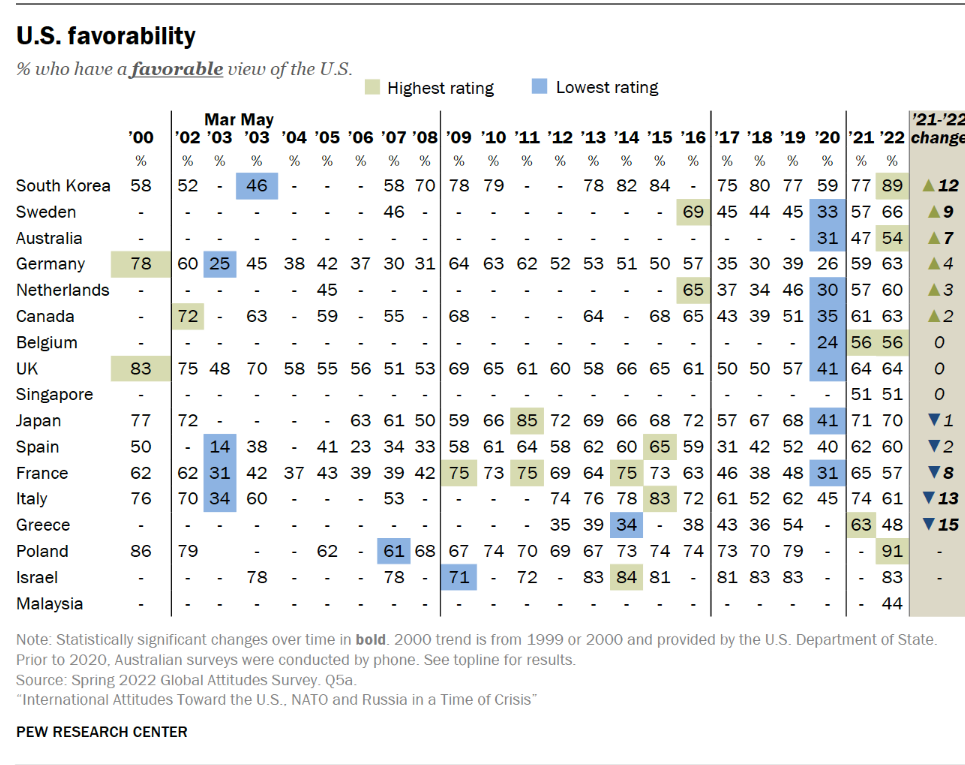
Foreign countries still see the US as a positive ally, despite their concerns during the Trump era.

Obama returned the budget deficit to a “reasonable” 3% by 2016. Trump expanded it to 5% and then 15% as the pandemic struck. Biden drove some recovery to 5% by 2022, but has not driven further reductions.

US coal production is in a long-term decline.
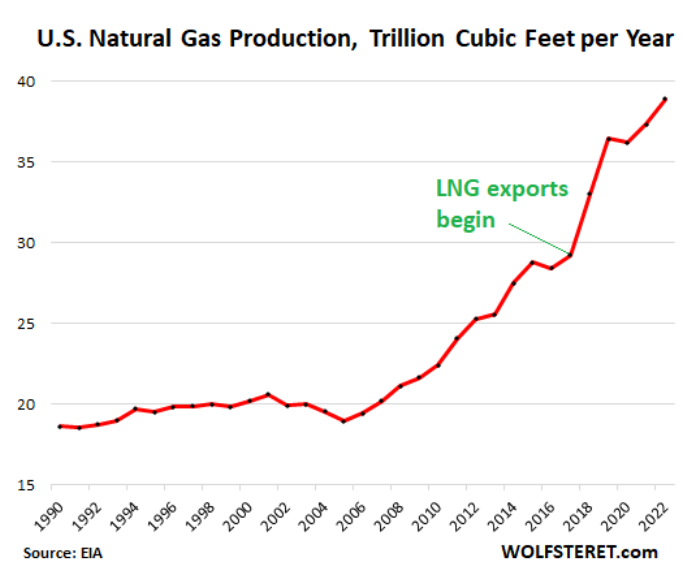
Natural gas production has nearly doubled in 14 years.
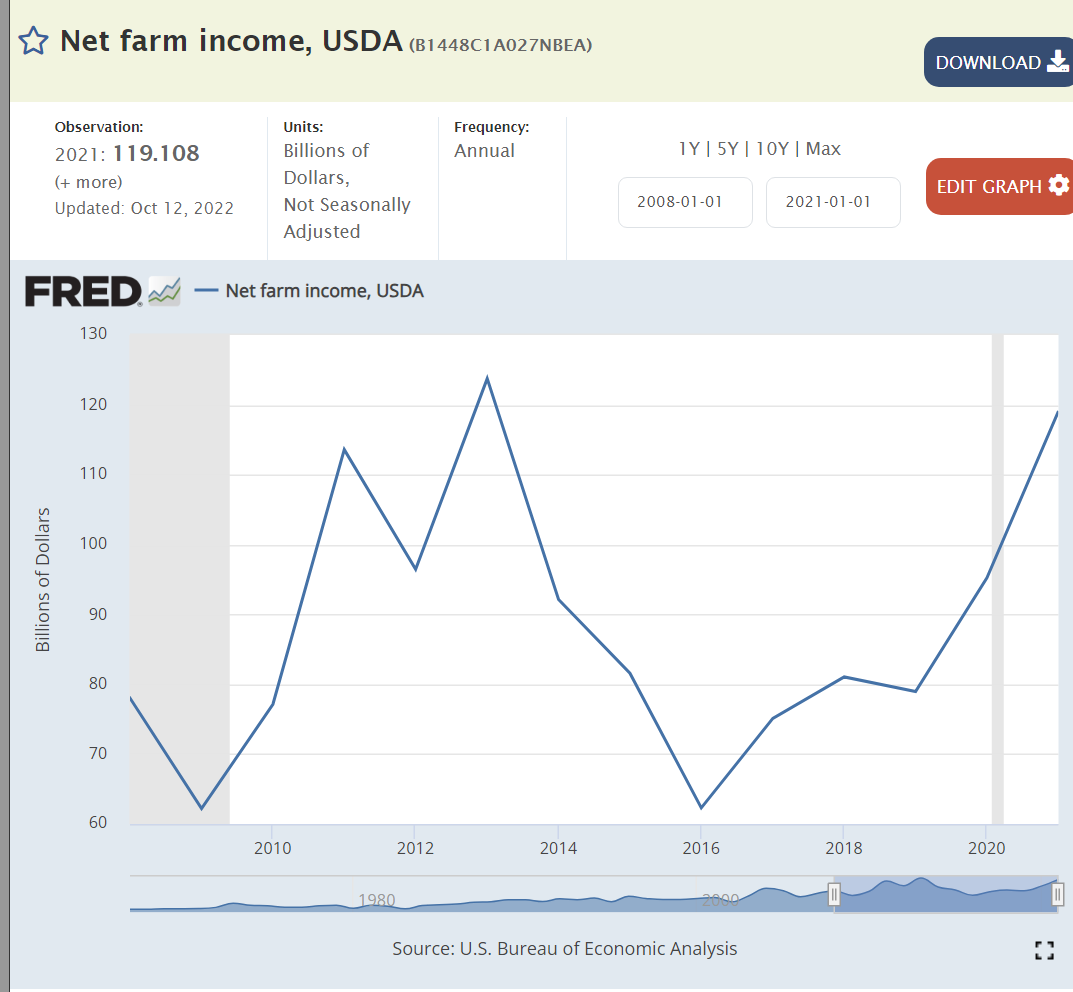
Net farm income has been significantly above the base for 6 of the last 14 years, despite lavish Trump farm subsidies.

Manufacturing employment has continued to rise slowly in the last 14 years against the headwinds of international competition.

It’s difficult to put the pandemic in perspective, but here we see a 2-year reduction in expected lifespans. Opioid deaths and so-called “deaths of despair”, alcohol, drugs, suicide, also play a role.
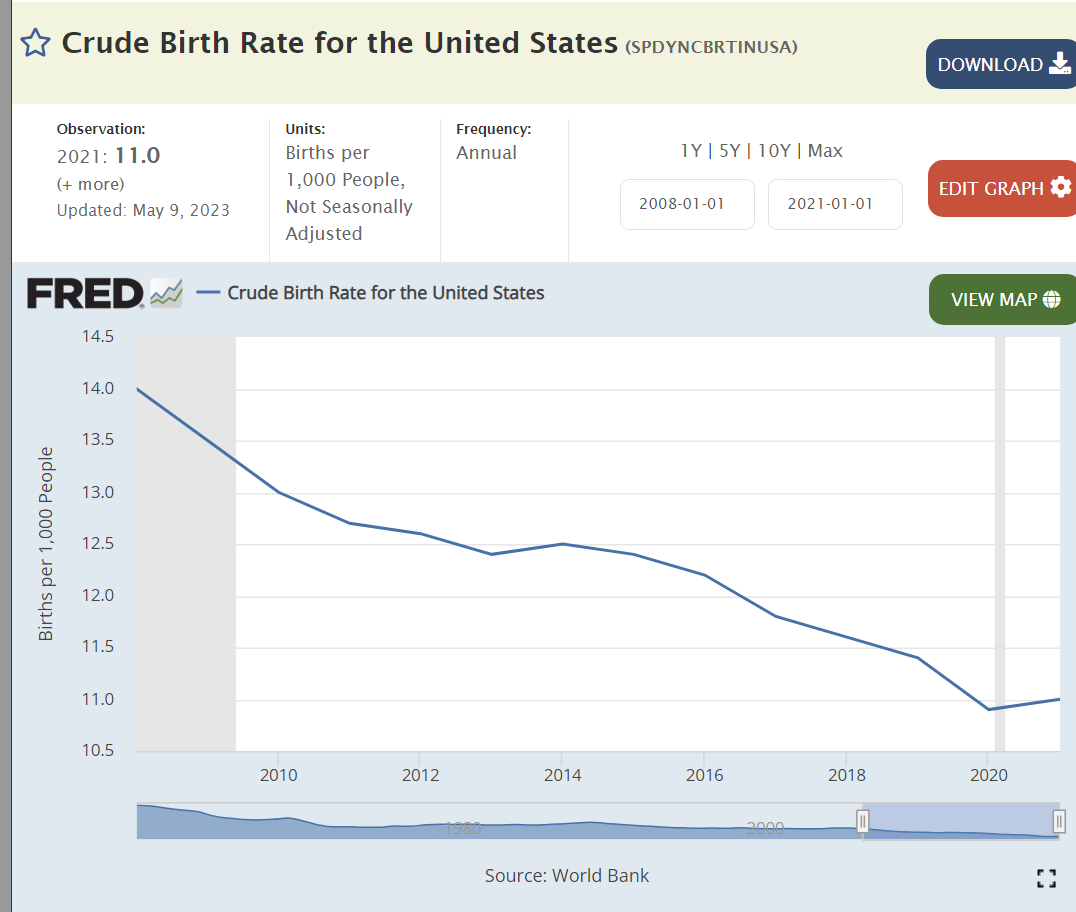
Birth rates continue to drift lower as seen in all regions of the world.
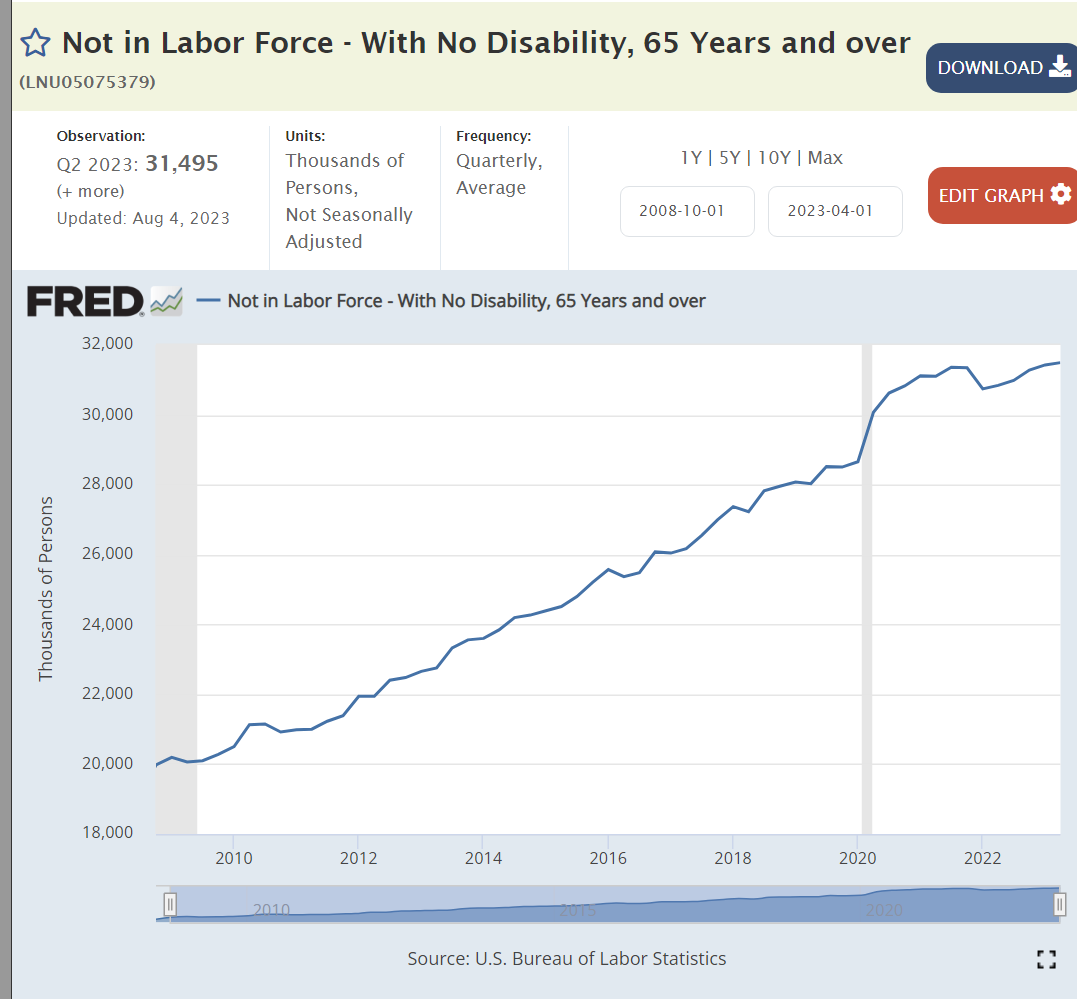
The number of retirees has increased by more than 50%.
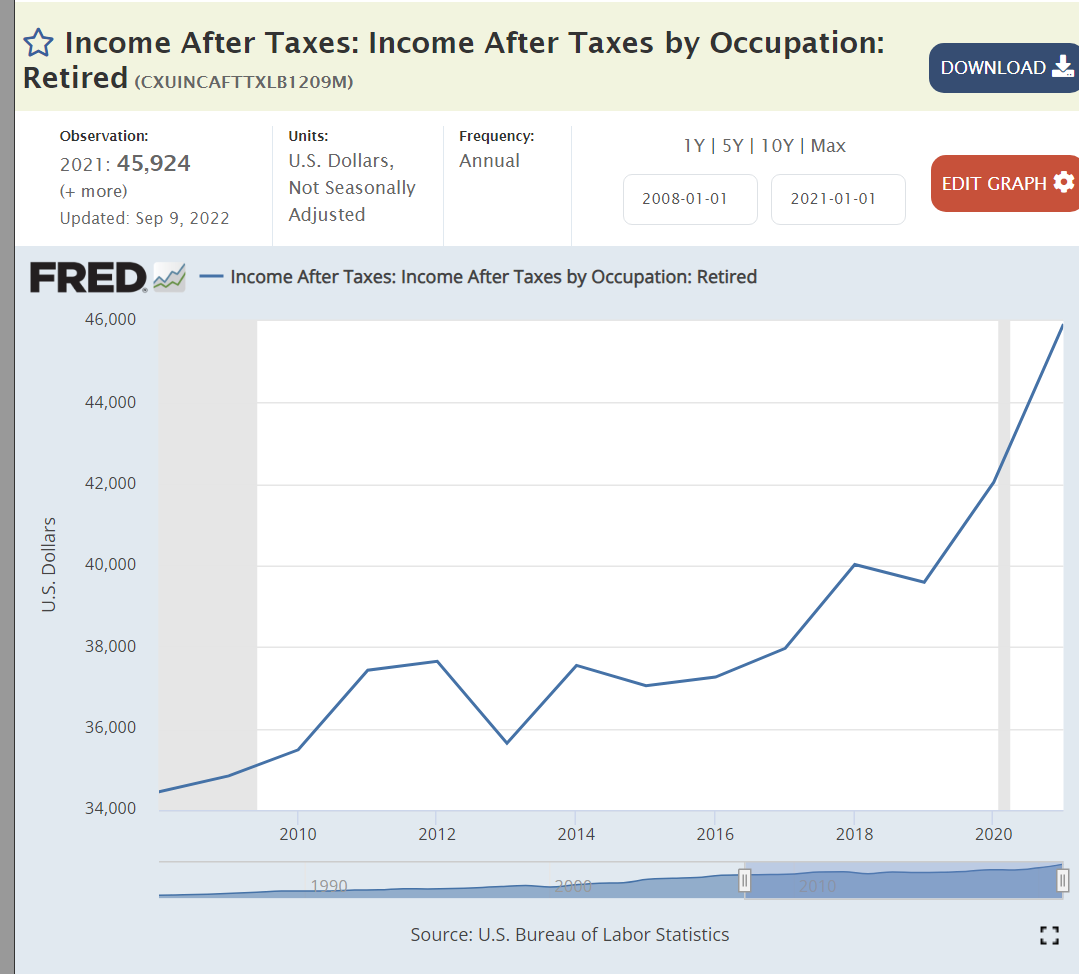
Retiree incomes are up by one-third, matching inflation.

Prospective retirees have doubled their cumulative savings.

The abortion rate has continued to fall in the last 30 years.

Church attendance has dropped from 40% to 30%.
The US economy recovered slowly after the Great Recession and then very quickly after the pandemic. Real, after inflation, output and per capita output increased. The labor market became very tight. Asset prices (investments and housing) rose for intrinsic and monetary reasons. The US remained a competitive international producer. The federal budget deficit was better at the end of the Obama period but worse for Trump and Biden. The pandemic reduced life expectancy and households had fewer children. Successful retirements grew and will grow. Social trends continue, uninterrupted by political positioning and policies.
Perceptions of the country and the economy are increasingly shaped by partisan political party views. Nonetheless, the US economy continues to grow and thrive.

https://chicago.suntimes.com/2022/6/10/23162642/best-photos-of-the-week-chicago
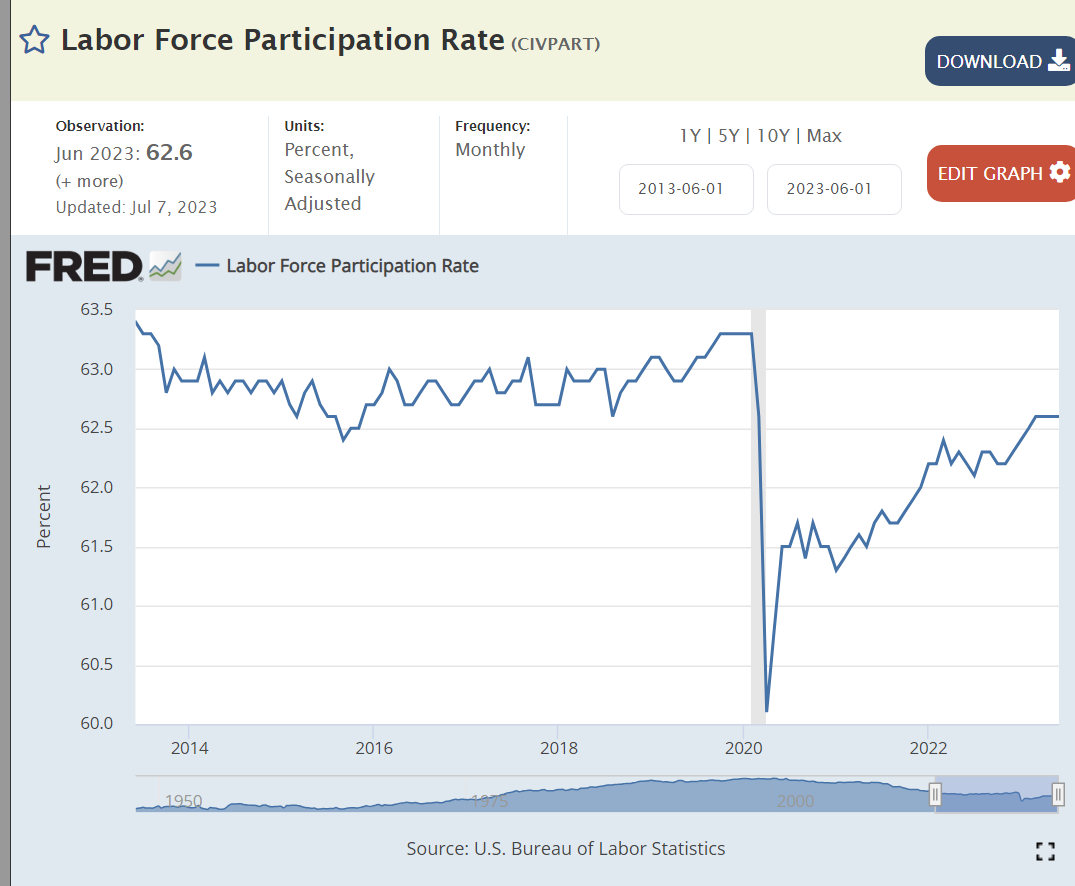
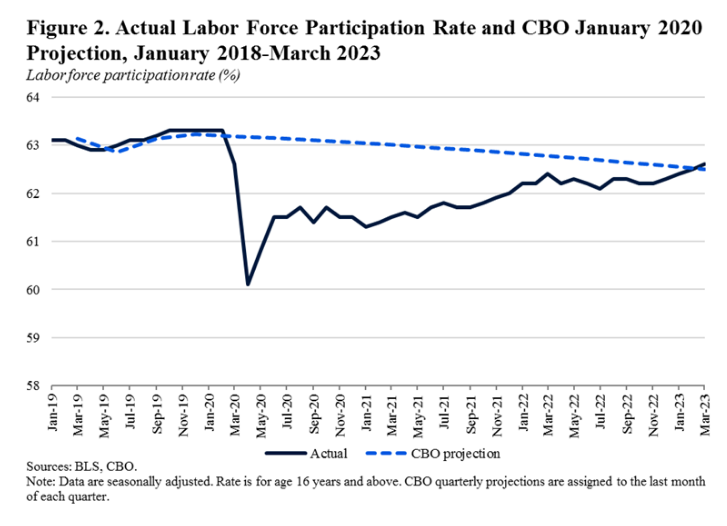
Overall labor force participation rate dropped by 1.5% in the pandemic and has recovered by 1%, still 0.5% below the recent history. However, the prime age category and several market segments no meet or exceed their pre-pandemic levels. Many details to consider.
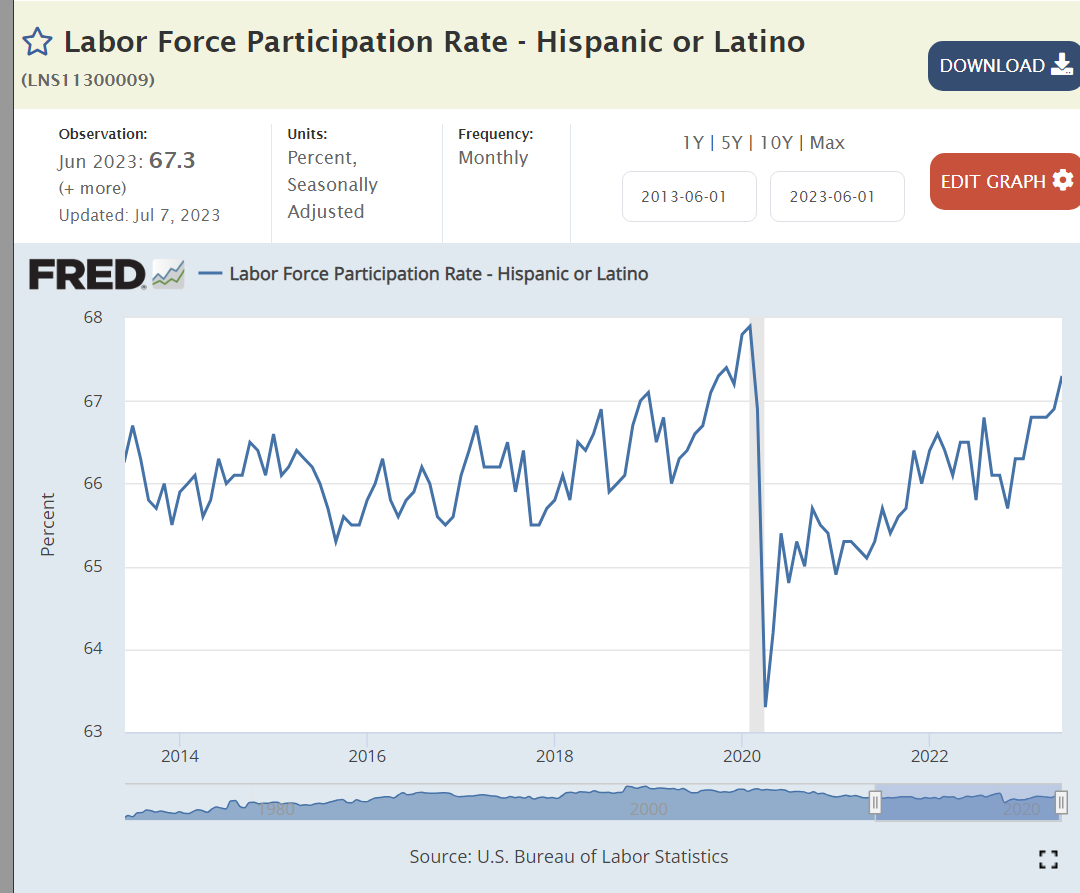
Hispanic participation is now 1% higher than the 2018-19 average before the pandemic.

The Asian participation rate is up 1%.

The Black participation rate is up 0.5%.

The White participation rate dropped by 1.5% and has recovered by half: 0.75% better but 0.75% below history.

The Women’s participation rate has essentially recovered to the 2018-19 average but is a half point lower than the peak levels seen just before the pandemic.

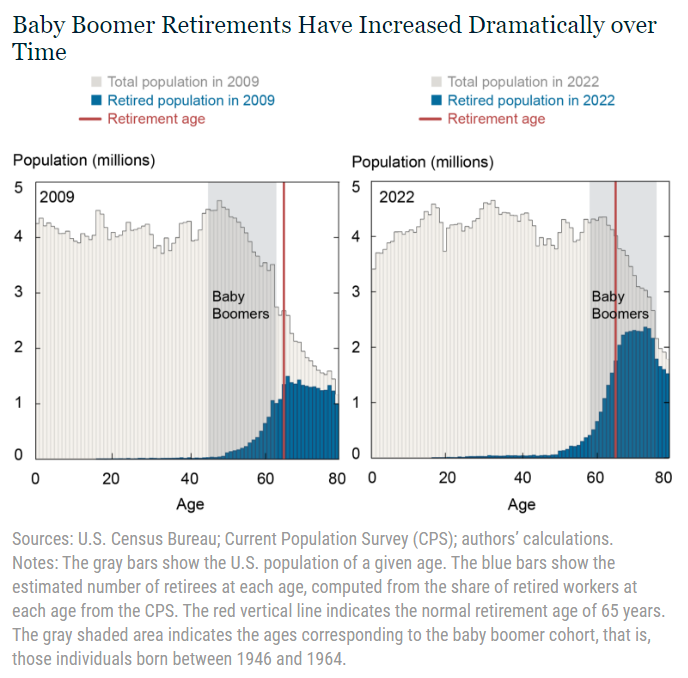
The male participation rate dropped by 1.5% but has only recovered by 0.5%, a major 1% below pre-pandemic times. Part of this is due to the long-term downward trend. Part of this is a “mix variance” driven by the very high number of “baby boomers” moving into normal retirement age or retiring early.


https://www.richmondfed.org/publications/research/econ_focus/2021/q1/district_digest
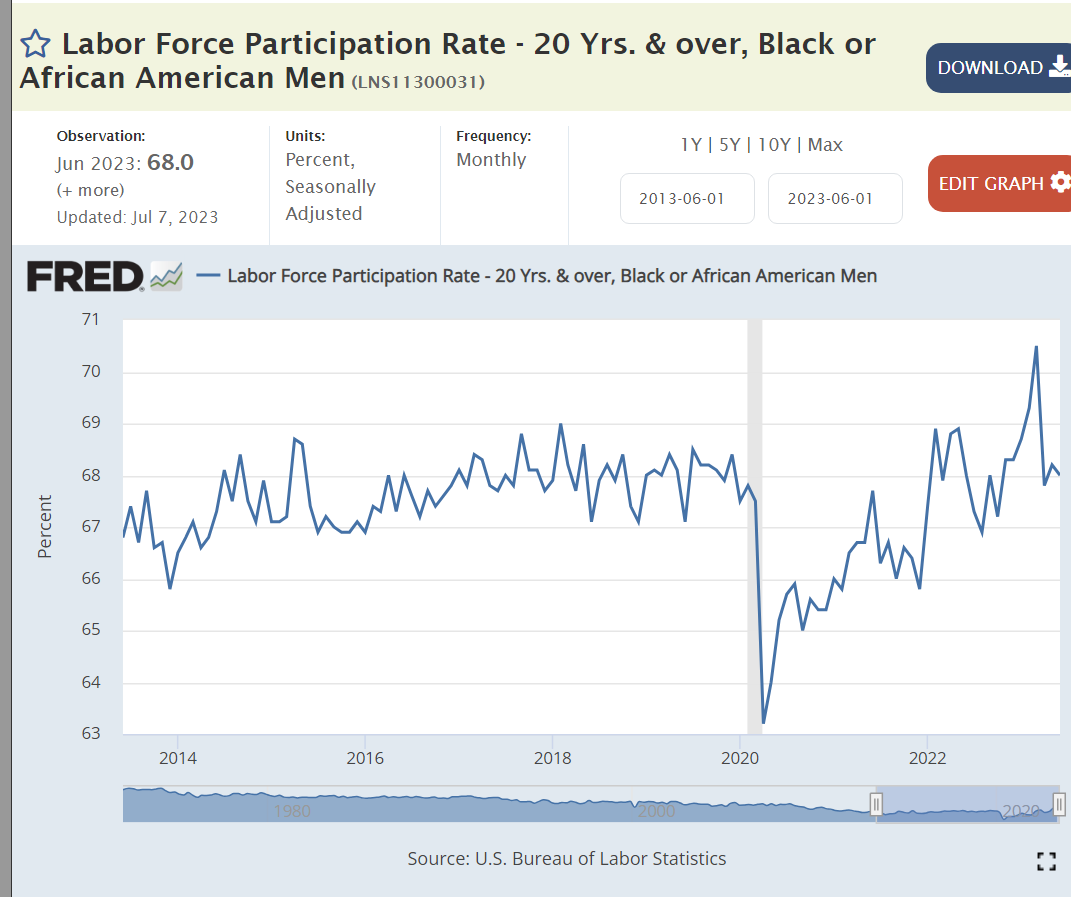
Black men are back to their pre-pandemic participation rate.

Black women are more active labor force participants.
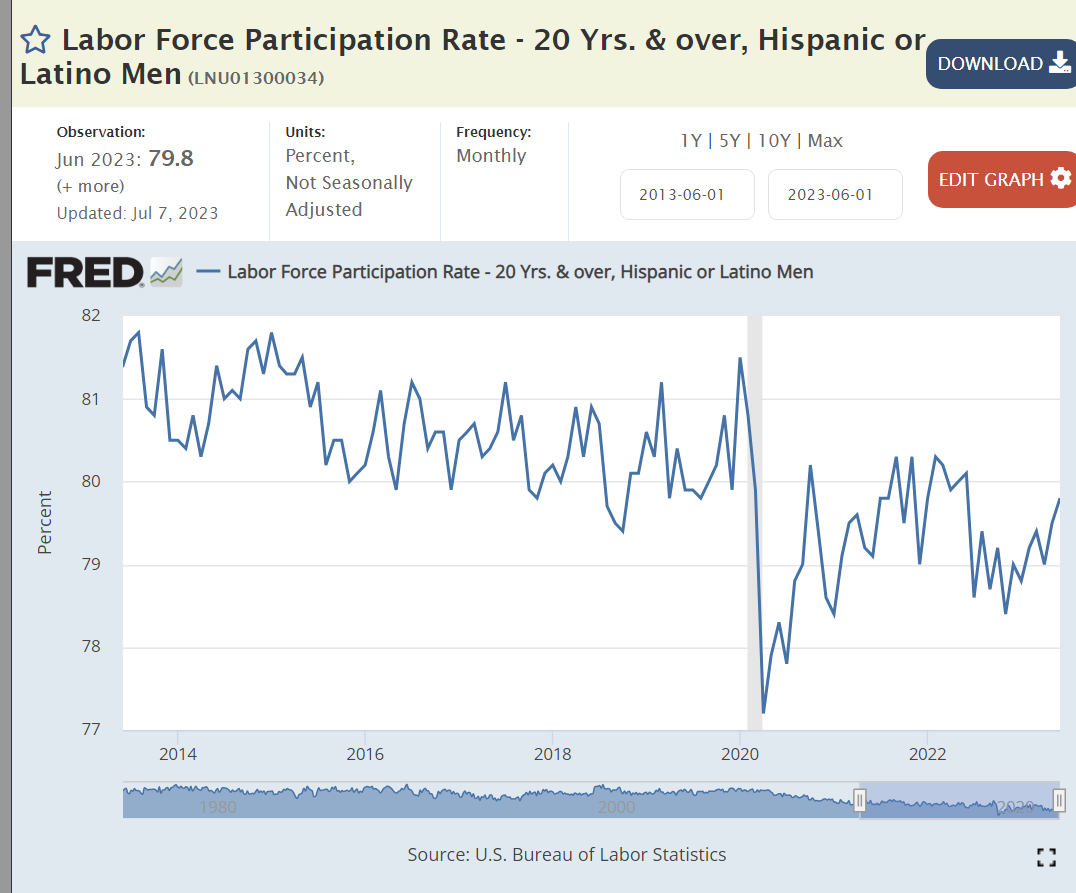
Hispanic men remain 1% below their pre-pandemic labor force participation rate.

Latino women have recovered to their historically high 61% participation ratio.

The White male participation rate dropped by 2% and has not recovered. Again, part is due to the long-run downward trend. Part is the aging of baby boomers into retirement. The remainder appears to be a response to the pandemic experience. “I’m not working unless you make it worth my while.”

White women remain a little below their 2018-19 average and three-quarters of a point behind their pre-pandemic peak level.

Teenage work participation has increased by 1.5% as entry level wages have risen.

College grad age participation rate has mostly recovered but remains 1% below the pre-pandemic high.

The retirement age workforce reduced its participation rate by 1.5% and has stayed there after a brief pseudo-recovery.


The prime age work force is now above even the elevated pre-pandemic level and a full one percent above the 2018-19 average. This is very good news, reflecting a strong economy an labor market.

Prime aged men have returned to the workforce.

Prime aged women are the “rock stars”, increasing their participation by 2% from 2019.

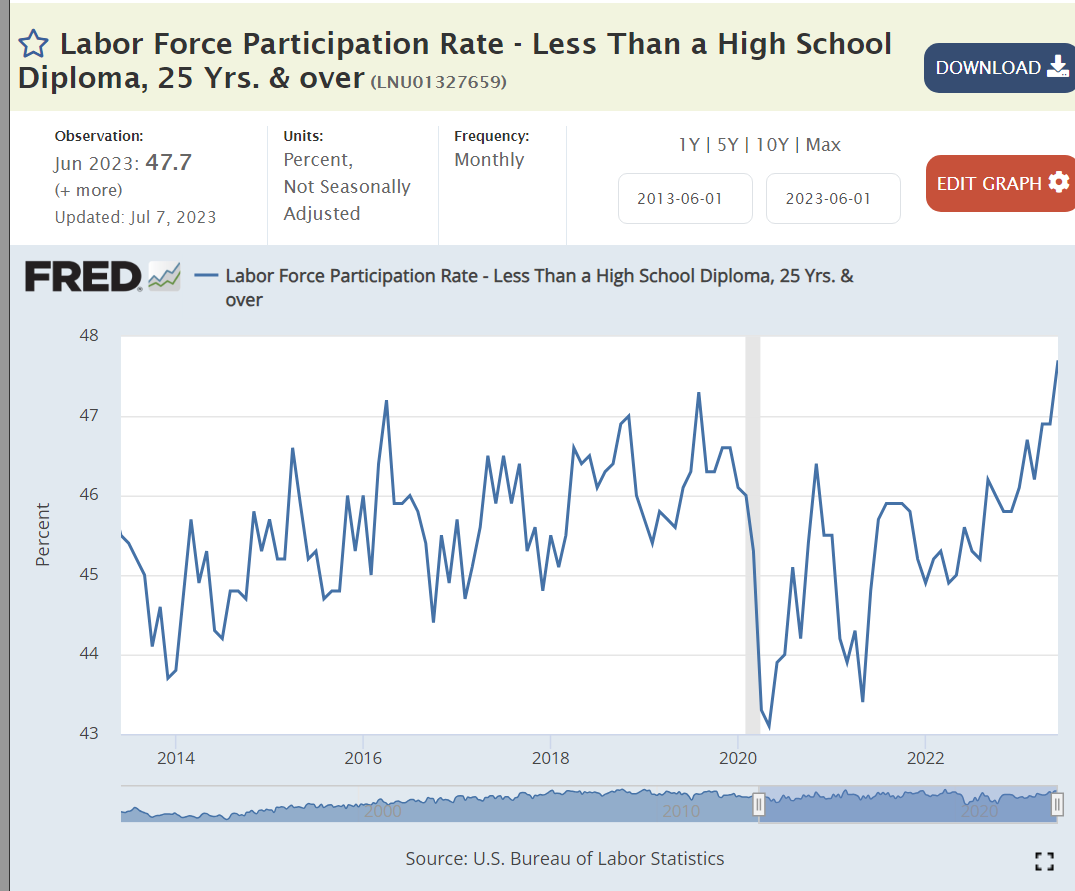
Non- high school graduates have added 1% to their labor force participation as real wages have increased.
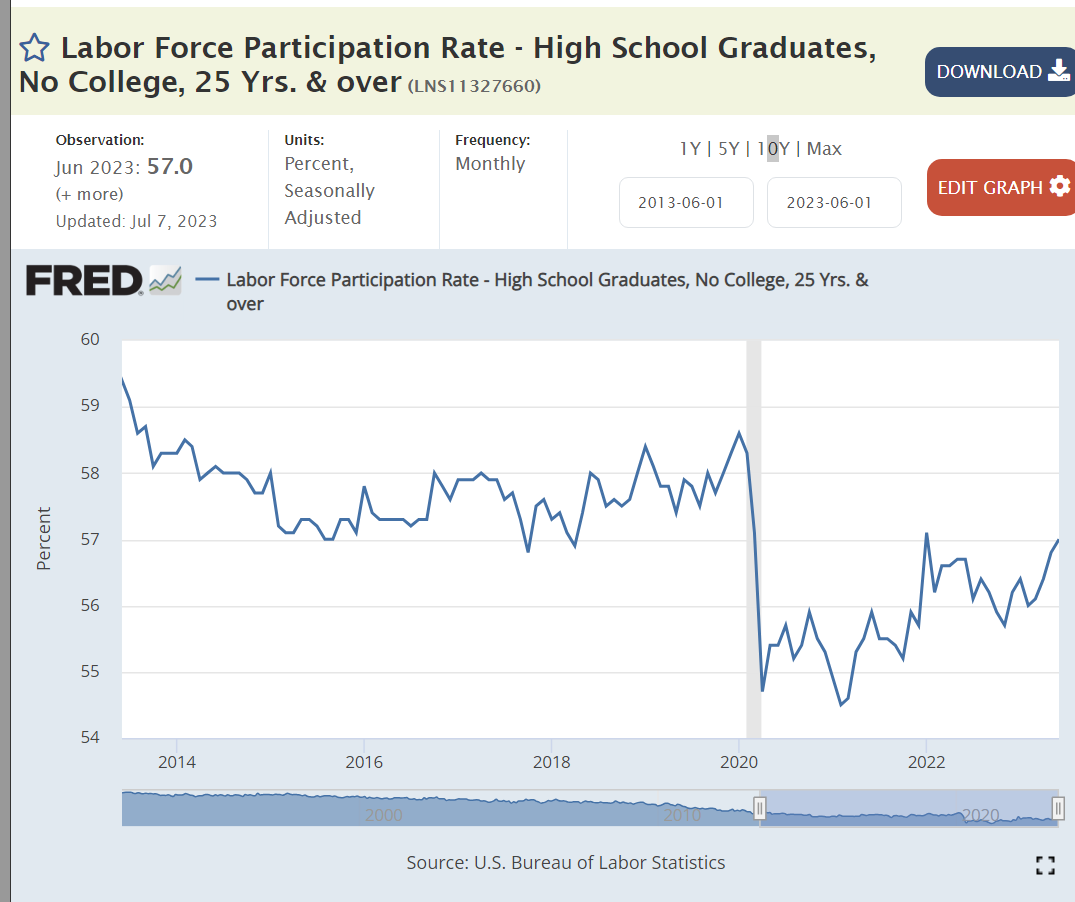
High school graduate participation dropped by three points before recovering by two points.
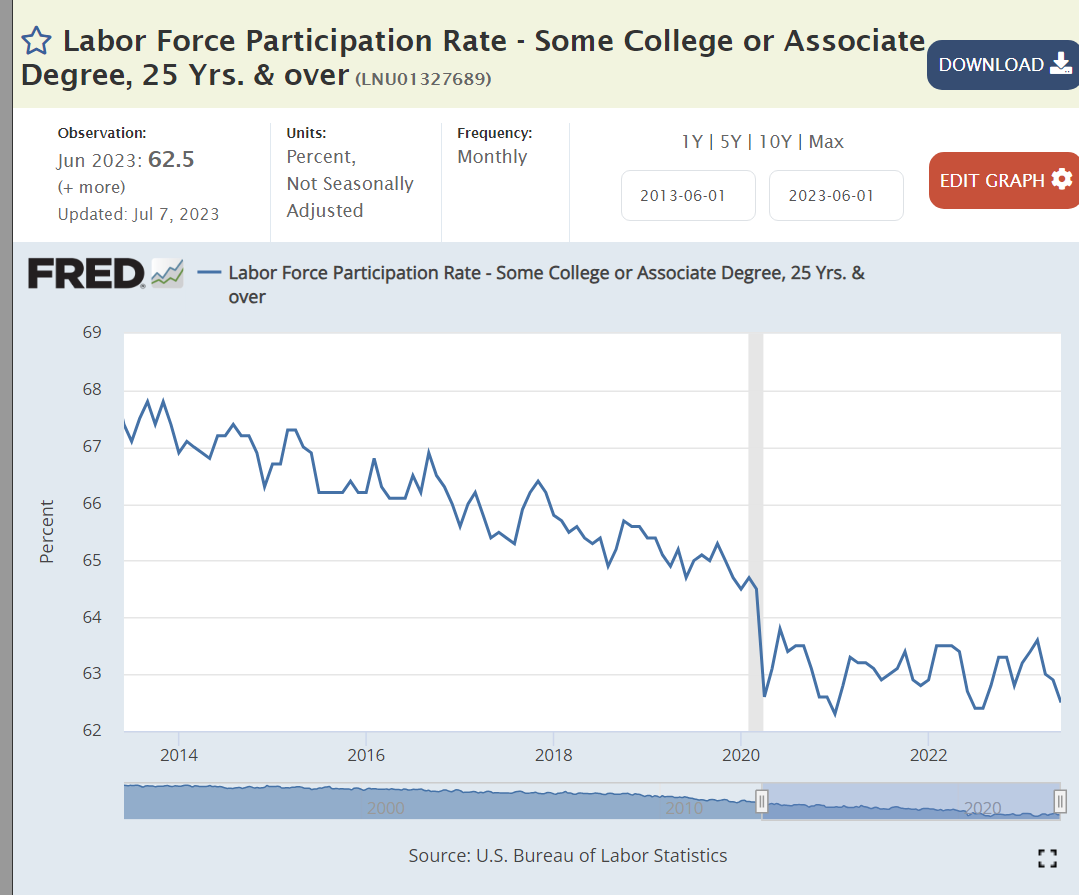
Individuals with some post-high school education, but not a bachelor’s degree, are in the middle range of US educational attainment. Their labor force participation rate had declined by almost 3 points in the 6 years before the pandemic, dropped by another 2 points during the pandemic and has not “recovered”.

Labor force participation by bachelor’s degree holders was stable before the pandemic, then dropped by 2 points and has since recovered by a little more than 1 point, remaining about one-half point below the prior average.
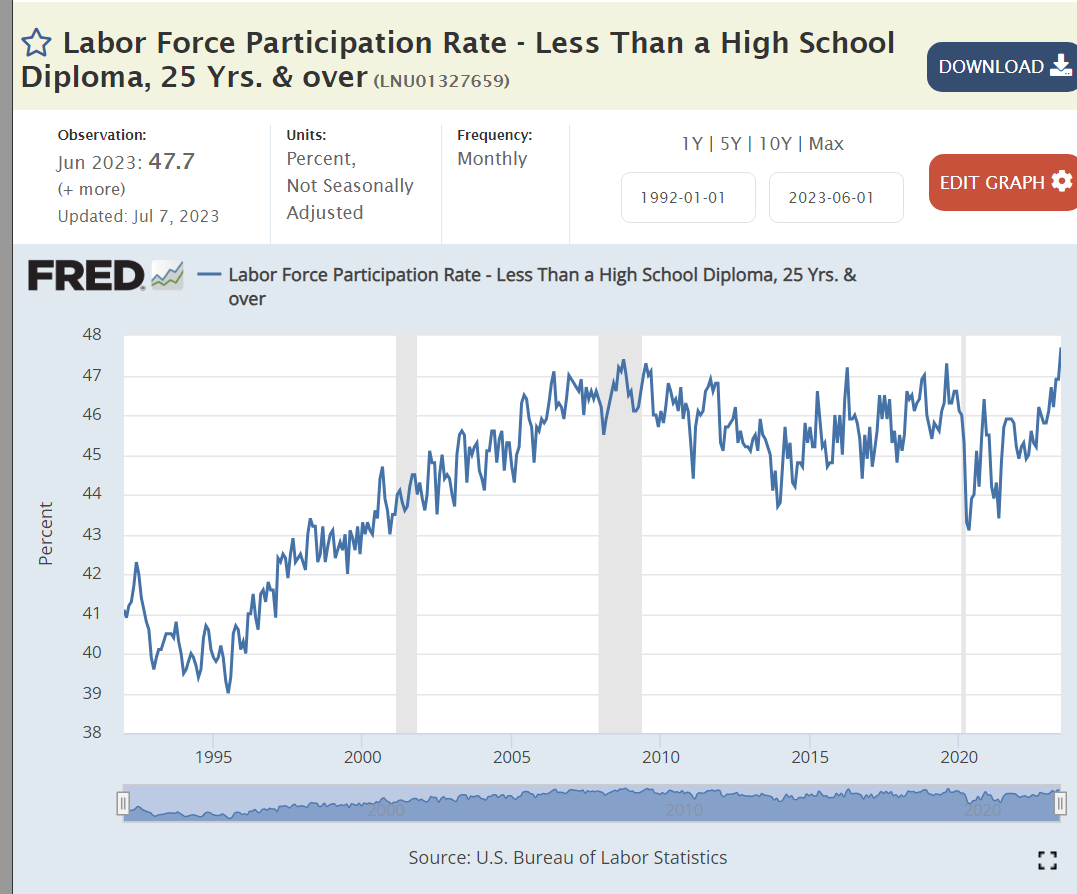


Individuals with a high school degree or higher have displayed drops of 10 points in labor force participation across the last 30 years. Most of this change is due to the “mix variance” of lower participation by an increasingly older and retired population, but some reflects other causes.
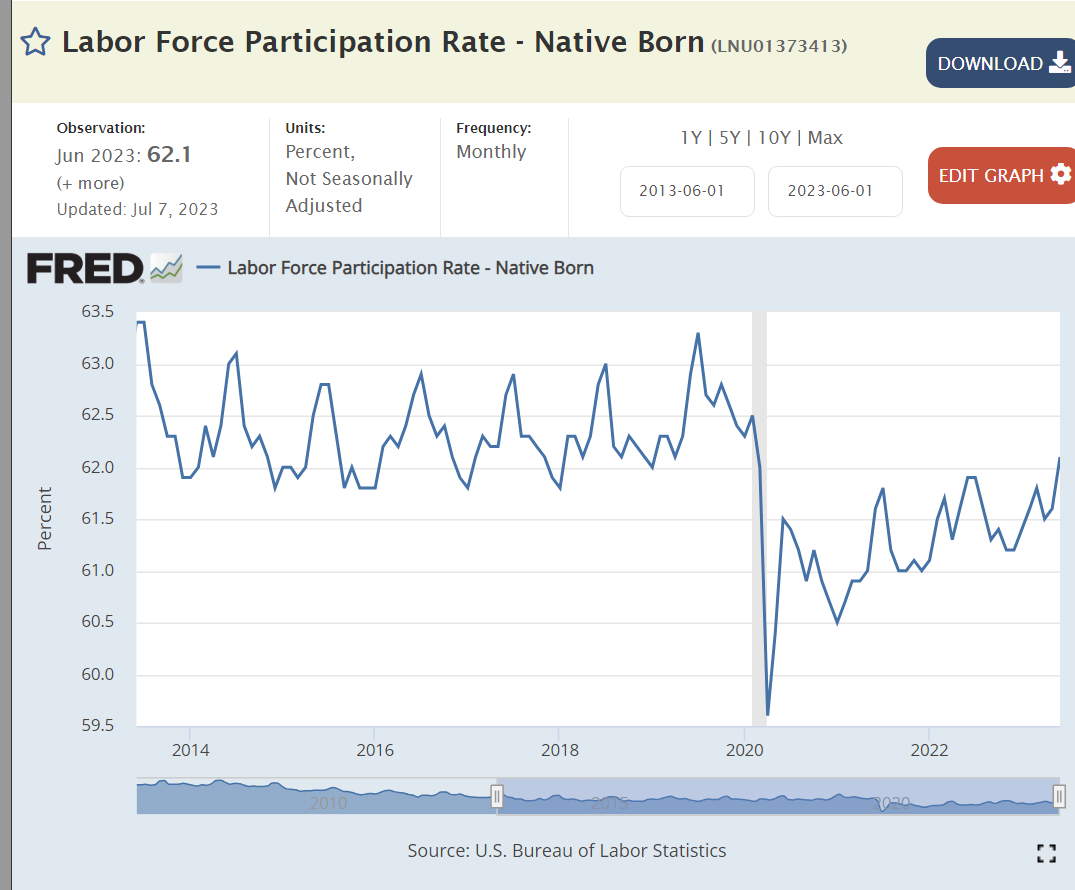

Foreign born members of the US labor force have fully “returned to work” after the pandemic.
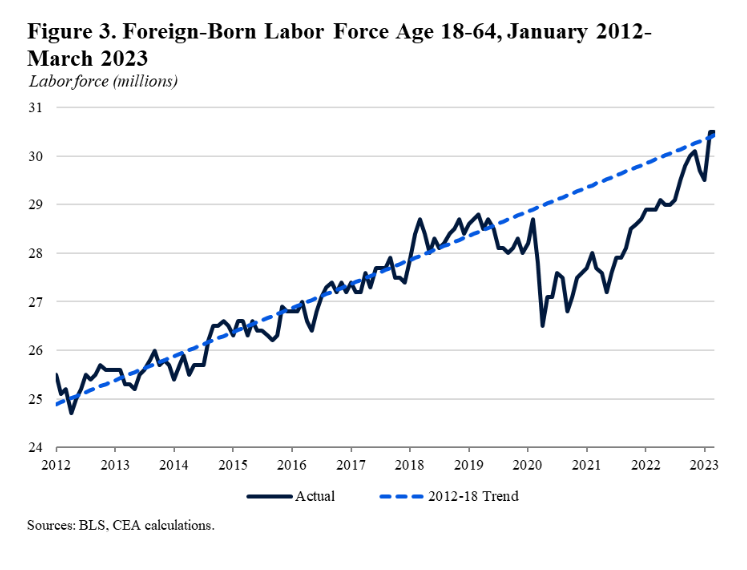
This participation growth improvement has taken place as the foreign-born population has increased to its trend growth rate.

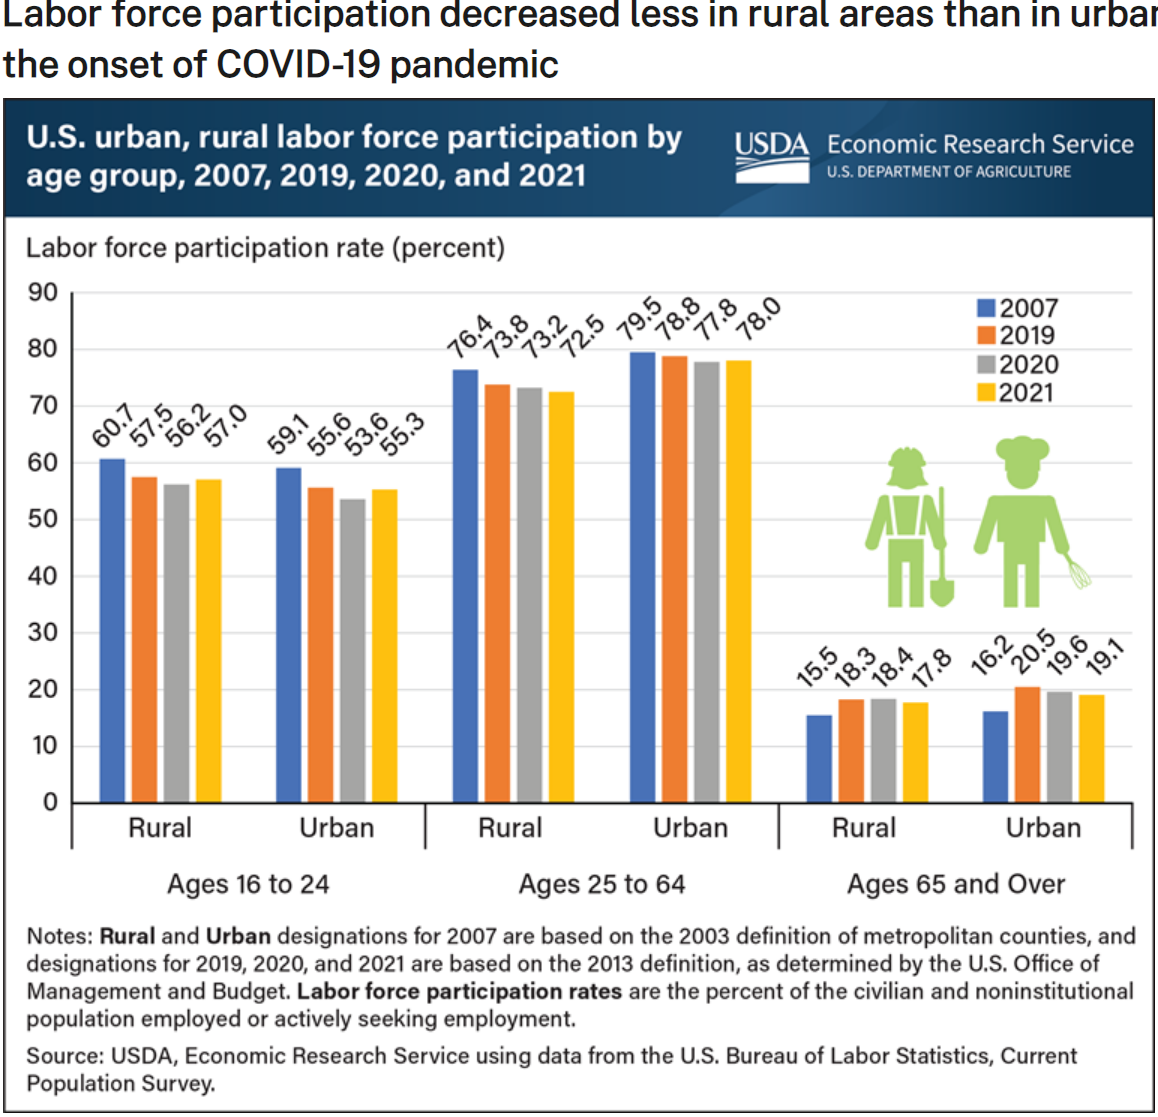
https://www.ers.usda.gov/data-products/chart-gallery/gallery/chart-detail/?chartId=103862
In general, rural labor markets have grown more slowly in the last 15 years and shown greater reductions in labor force participation. Some of the increased labor force participation in the last 2 years may reflect a recovery from these declines.



https://www.bostonfed.org/publications/new-england-economic-conditions/2023/april.aspx
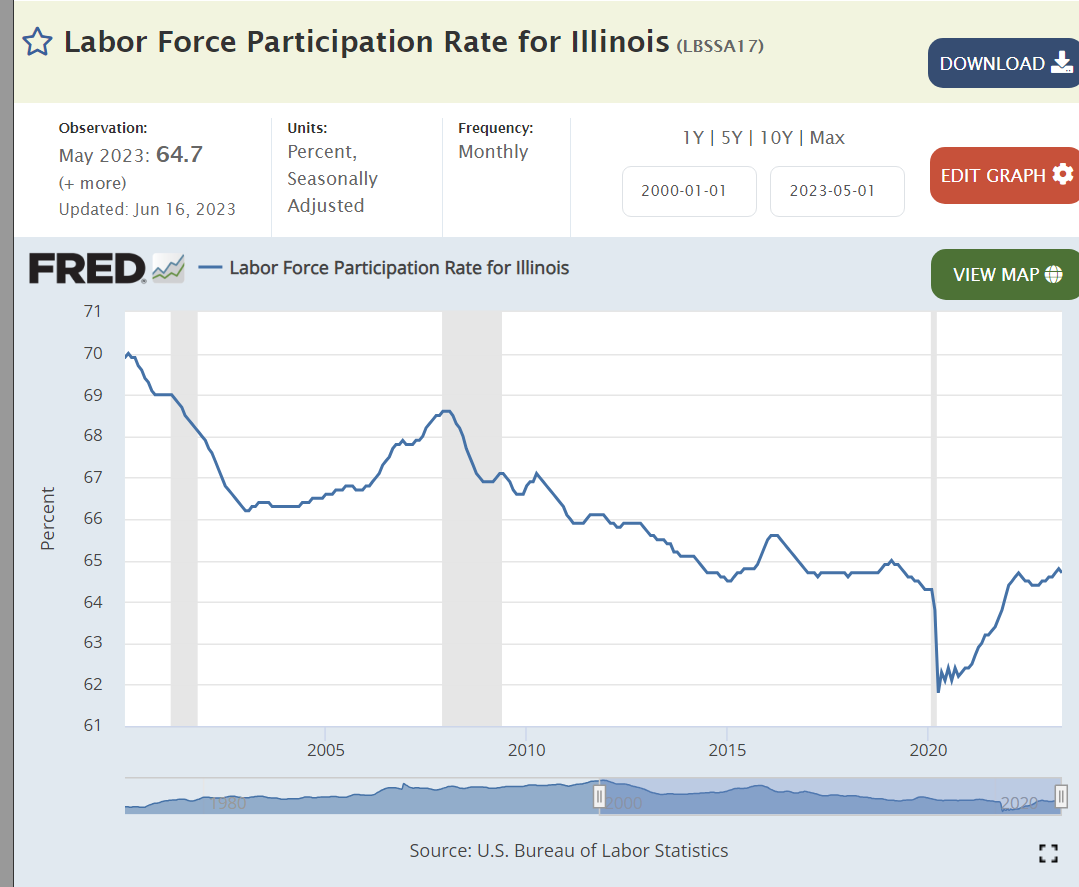
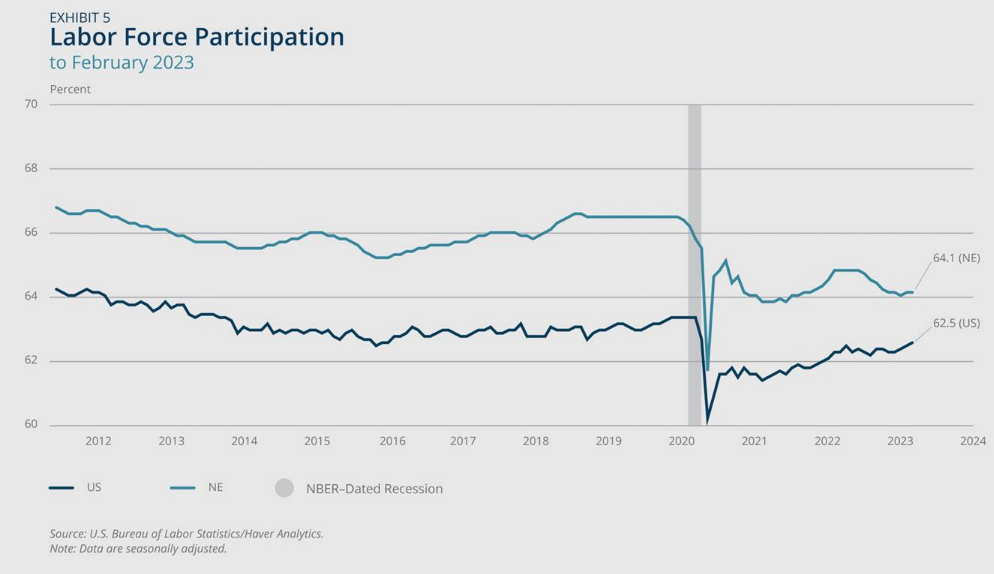
Most states show a similar pattern of labor force participation in the years before the pandemic, declining by 2-4% and afterwards recovering to their pre-pandemic level. California’s recovery has been slower. The New England states had an unusual increase in labor force participation before the pandemic and have not seen a major recovery after the pandemic.
Several sources decry the decline in the number of workers and the labor force participation rate, noting that it holds back the economic recovery and taints the 3.5% unemployment rate.
https://www.uschamber.com/workforce/understanding-americas-labor-shortage
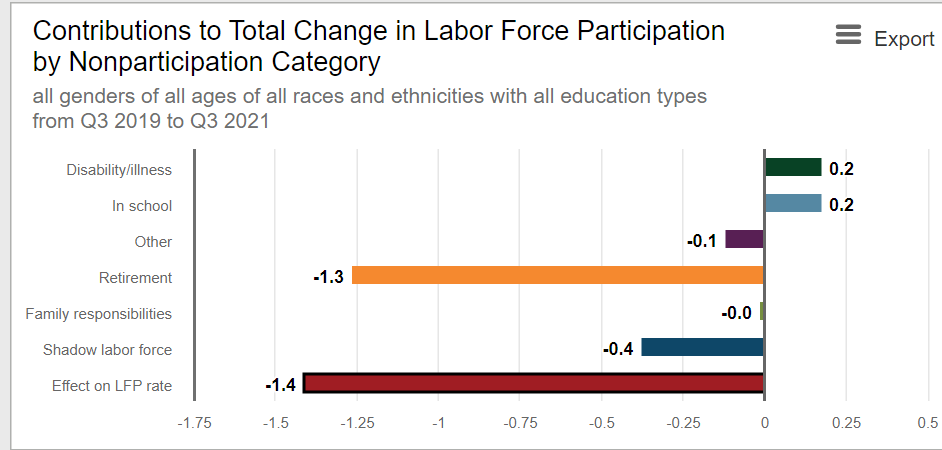
Other sources point to the long-term downward trends in participation as the biggest factor, mostly driven by an aging workforce and recent higher than normal retirement rates. Pre-pandemic forecasts showed a one-half point decline in participation, matching the actual 2023 data. Detailed analysis shows that the age adjusted participation rate is a little higher. The core group, aged 25-54 population, also shows labor force participation recovery to relatively high pre-pandemic levels. So … there are demographic, racial, education, birth country, rural/urban, location and state differences in participation. There are opportunities for higher participation in a strong economy and labor market. However, the recovery from the pandemic is complete, reflecting this strong economy and labor market.

https://www.axios.com/2023/06/02/jobs-report-workers-prime-age-labor-force-participation

https://www.atlantafed.org/chcs/labor-force-participation-dynamics

Today, 3,400 US franchisors support 800,000 franchisees with 9 million employees grossing $1.7 trillion of annual sales and 3% of US GDP.
https://www.franchisedirect.com/information/is-your-franchise-fit-for-the-us
Franchising provides an opportunity for qualified individuals to own a business and earn equity-like rewards, without outstanding industry expertise, with lower business failure risk, requiring relatively modest equity investments and the opportunity for advantageous bank and small business loans.
Franchising provides the owner of a product or service concept with the opportunity to expand using “other people’s money”. It facilitates geographic and international expansion leveraging locally knowledgeable managers/investors. It allows differentiated products, services and systems to be replicated quickly and consistently. It provides legal agreements that ensure that the franchisor’s brand is enhanced and not damaged by the franchisee’s operations. It provides a system that strongly aligns the interests of local managers/owners with those of the central business.
Franchising has experienced several “boom and bust” periods, fraudulent deals and changing relations between franchisors and franchisees through time. Initial growth began in the 1850-1920 period together with the growth of the manufacturing and transportation industries. Automobiles, farm equipment, sewing machines, service stations, auto parts, pharmacies, soft drinks and train stop/car hop restaurants lead the way originally using the product franchising model. The depression interrupted the growth of franchising. Automobile dealers, service stations and soft drink distributors accounted for 80% of franchising before the depression.
Franchising accelerated again after WWII with fast-food restaurants leading the way, accompanied by a diverse set of laundry, hotel, rental car, real estate and convenience stores. These businesses were often still tied to products or patented equipment. However, McDonalds (1955) offered the first business format franchises which provided greater opportunities in a growing, travelling society.
Business format franchising “includes not only the product, service, and trademark, but the entire business format itself: a marketing strategy and plan, operating manuals and standards, quality control, and a continuing process of assistance and guidance.”
With rapid growth came accounting fraud by franchisors, one-sided contracts, overlapping deals, pyramid schemes and conflicts between franchisors and franchisees. The Energy Crisis of the 1970’s bankrupted a large share of service stations. State and federal regulations enacted in the 1970’s ensured that standard disclosure agreements were used, allowing potential franchise owners to work with their lawyers to ensure that they understood the deals they were making.
https://www.entrepreneur.com/franchises/entrepreneur-franchising-the-big-bang/66000
https://en.wikipedia.org/wiki/Franchising
Data on the franchising industry is not standardized. Two industry associations and the US Census Bureau provide somewhat inconsistent data. Nonetheless, the growth of franchising after the “bust” in the 1970’s is amazing. The number of establishments has grown from 375,000 (1973) to 420,000 (1988) to 530,000 (1990) to 775,000 (2021). Total employment has grown more slowly, from 7 million (1988) to almost 10 million (2017). Sales has grown much faster from $160 billion (1975) to $350 billion (1980) to $530 billion (1985) to $1 trillion (2004) to $1.3 trillion (2007) to $1.5 trillion (2012) to $1.7 trillion (2017).
https://www.latimes.com/archives/la-xpm-1990-09-27-fi-1859-story.html
https://www.entrepreneur.com/franchises/entrepreneur-franchising-the-big-bang/66000


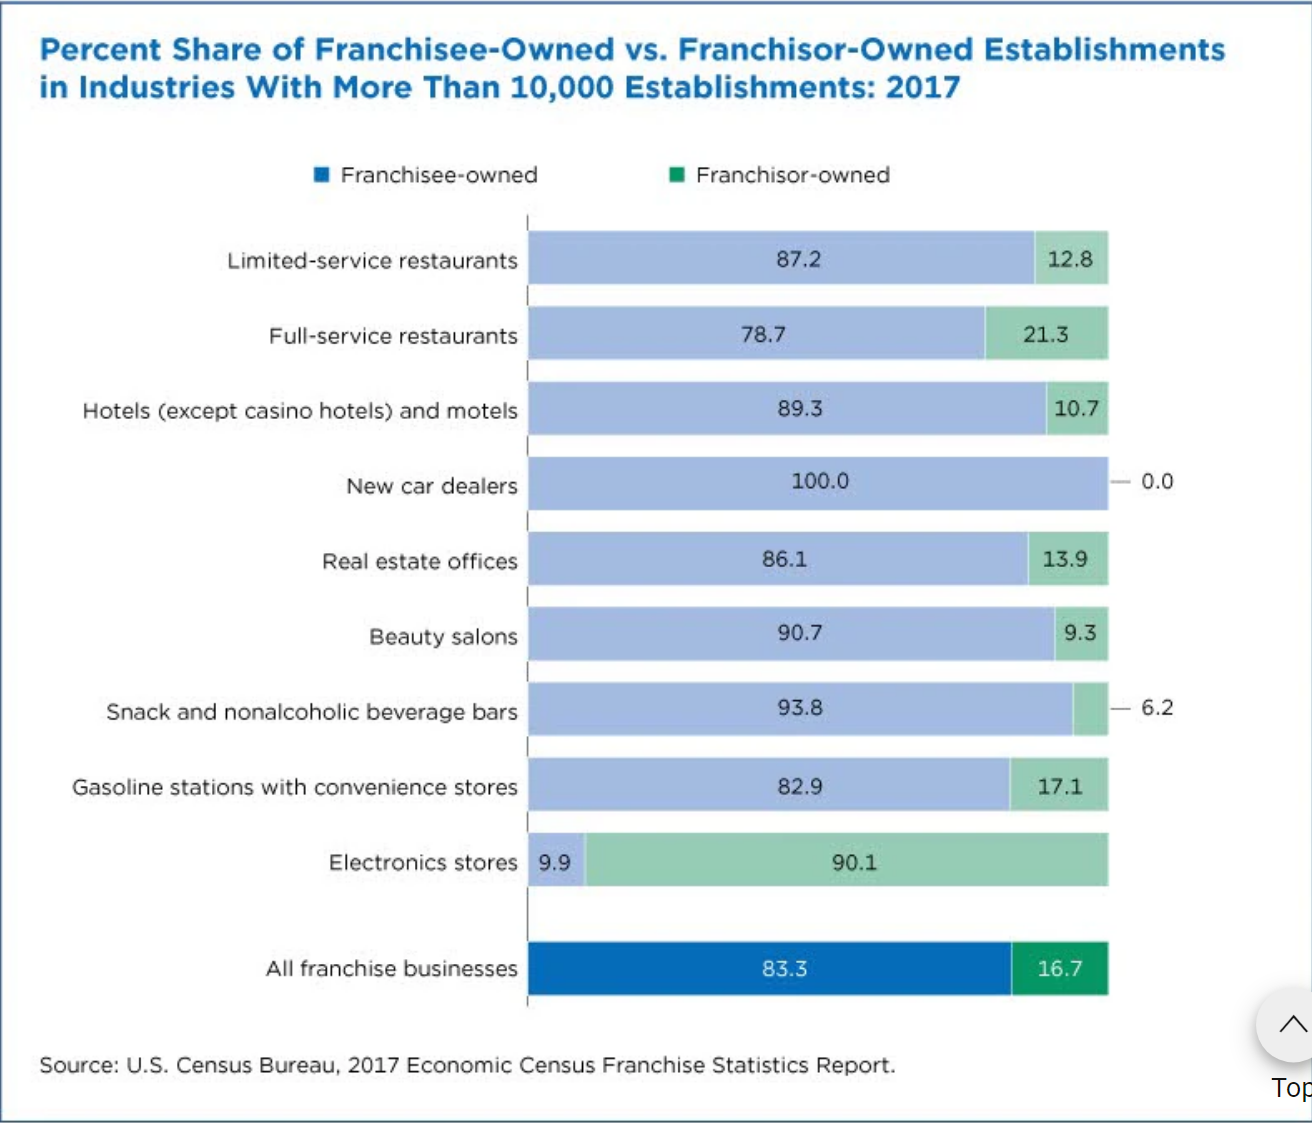
https://www.census.gov/library/stories/2021/12/franchising-is-more-than-just-fast-food.html
Leading sectors by annual earnings include senior care ($155K), real estate ($153K), personal services ($126K), business services ($122K) and pet services ($119K).
https://www.entrepreneur.com/franchises/the-highest-earning-franchise-categories-according-to/417572
Entrepreneur Magazine has been publishing its “Franchising 500” rankings since 1980.
https://www.entrepreneur.com/franchises/directory/franchise500-ranking
The fast-food restaurant industry remains the “killer app” for franchising.


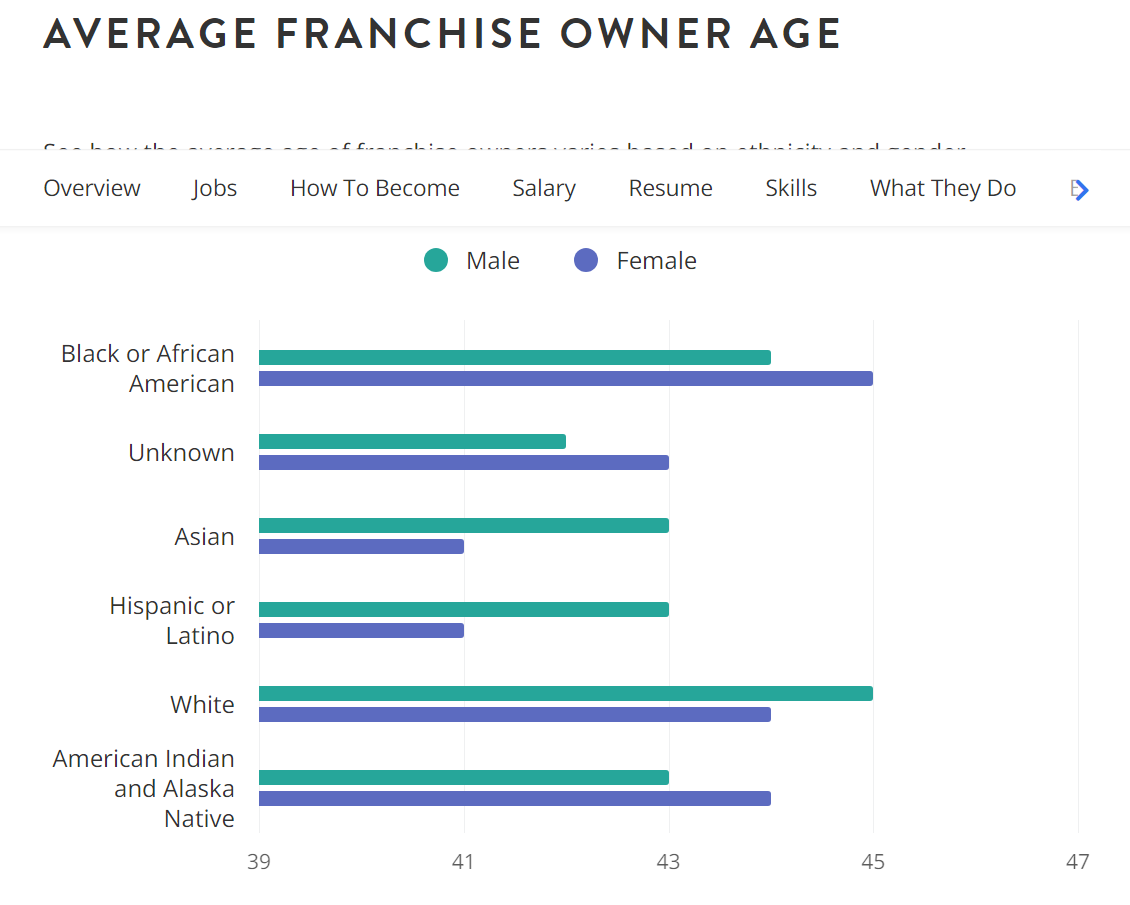


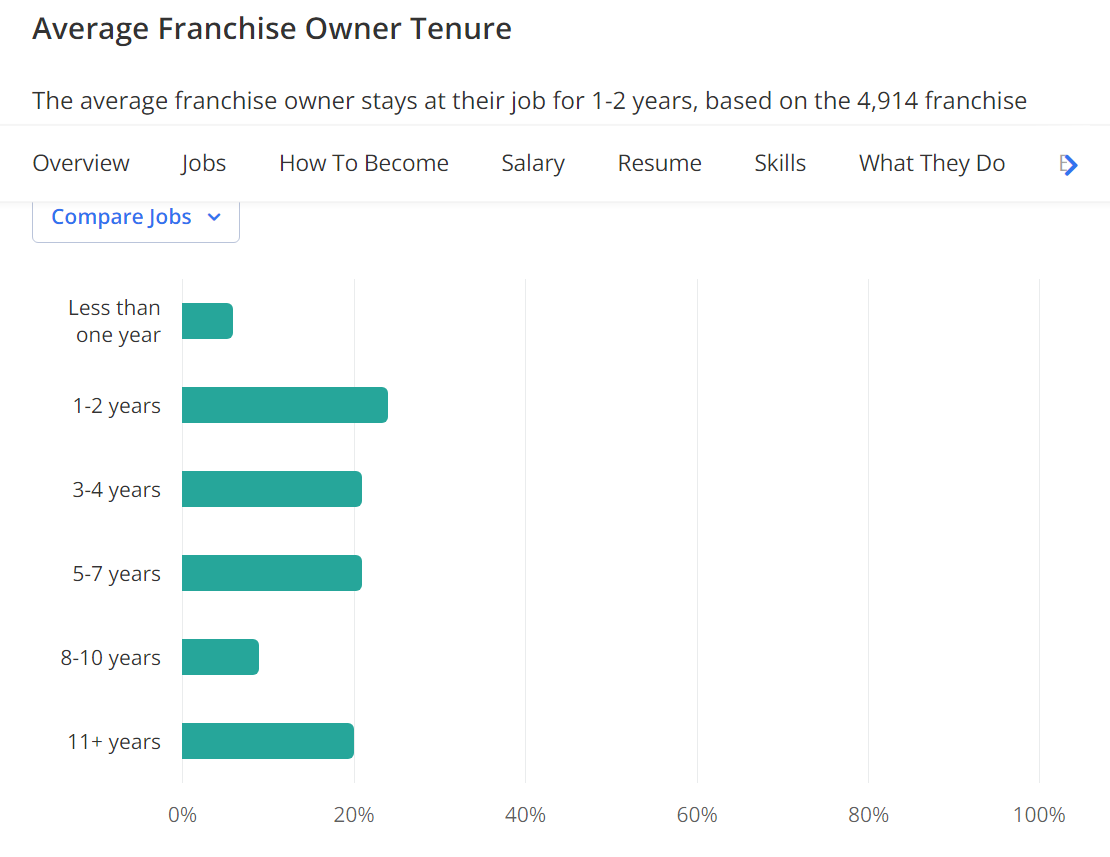
Sustainable resources; operations and marketing.
Nearer international and local supply chain sourcing.
Simpler operations and automation. Resilient, recession-proof.
Multiple brand retail locations.
Technology, digital operations.
Marketing/social media capabilities.
Home delivery services.
Personalized products and customer service.
Generation and minority group niche marketing and growth.
Fitness, health, and wellness services.
Home improvement services.
Food and restaurants recover.
Increasing role for multi-unit franchisees.
https://www.franchising.com/guides/current_trends_in_franchising.html
https://www.linkedin.com/pulse/6-franchise-trends-watch-2023-teri-barber/

The overall US unemployment rate at 3.6% remains at a 50-year low. The metropolitan area rate is a shade lower. I summarized metro area unemployment rates for those which have a city in the top 100 of population. Only 73 metro areas remain, since 27 cities are the second or smaller city in their metro areas. The average metro area unemployment rate for these top 100 areas is 3.4%. The median metro unemployment rate is 3.3%.
Democratic mayors led the main cities in two-thirds of the largest metro areas. Republicans, independents, nonpartisans or split results led in the remaining one-third (24/73).
Democratic mayor lead metro areas have median and average unemployment rates at 3.2%, significantly below the national 3.5-3.6% rate. The Republican+Other metro areas show 3.4% median and 3.9% average unemployment rates, just slightly higher.
The claim that Democrats are “bad” for the economy is not supported by this data.
Republicans and independents/nonpartisans/split mayors lead 8 metro areas with unemployment in the historically unheard of 2% range:
Denver, Colorado Springs, Omaha, Tulsa and Oklahoma City in the prairie states. Miami, Virginia Beach and Honolulu complete the set.
Non-Democratic mayors also lead 8 southwestern cities with higher-than-average unemployment (4%+): Reno, Las Vegas, Laredo, Corpus Christi, Riverside, Stockton, Fresno and Bakersfield.
Only 5 Democratic lead cities, versus 8 Republican/Other cities, had 4%+ unemployment rates in May, 2023: New York and Los Angeles, Houston, El Paso and New Orleans.
31Democratic mayor lead metro areas had strong 3% unemployment. 13 boasted amazing 2% unemployment rates: Boise, Lincoln, Nashville; Madison, Minneapolis-St Paul; Jacksonville, Tampa, Orlando; Richmond, DC, Boston, Baltimore.
Metro area unemployment is even lower than the 50-year low national average.
Democratic led metro areas have slightly lower unemployment rates.
We have 6 large metro areas with 2.5% or lower unemployment: Lincoln, Madison, Omaha, Boston, Baltimore and Miami.
Our very worst metro areas (of 100) are El Paso, Corpus Christi and Laredo at 4.5% and Las Vegas (5.6%), Stockton (5.9%), Fresno (7.5%) and Bakersfield (8.6%).
The American economy is delivering truly amazing results.
https://www.bls.gov/web/metro/laummtrk.htm
https://ballotpedia.org/List_of_current_mayors_of_the_top_100_cities_in_the_United_States