Really Big Changes in the USA: 1776 – 2026

Population Growth

The US population has grown from 2.5 million in 1776 to 76.3 million in 1900 to 158.8 million in 1950 to 329.5 million in 2020. More than a 100-fold increase, 2+ orders of magnitude.

28 individual metro areas today EACH have a population (2020) equal to or greater than the WHOLE USA in 1776. Pittsburgh, Portland, San Antonio, Austin and Sacramento each have the same 2.5 million residents. Charlotte, Orlando, Baltimore and St. Louis each have a slightly greater 2.8 million citizens. 19 other metro areas today have a significantly larger population.

Declining Rural Population

The US began as 100% rural. By 1900, cities (2,500+) accounted for 40% of the total population. By 1950, city populations were the majority at 60%. In 2020, cities contained 80% of the US population.

Urbanization

In 1776, the US had 5 cities of 10,000 people, led by Philadelphia with 30,000.

By 1900 the nation had 11 major cities with a half-million people or more, led by New York with 5 million and Chicago, Philadelphia and Boston near 2 million. Baltimore on the east coast and San Francisco on the west coast were joined by the Midwest cities of Pittsburgh, St. Louis, Cleveland, Cincinnati and Buffalo to round out this group of early leaders. These 11 exceptions to the still largely rural landscape accounted for one-half of the urban population, 20% of the national population.

By 1950 there were 15 metro areas with a million people or more, up from just 5 in 1900. San Francisco, St. Louis, Cleveland, Baltimore and Buffalo exceeded 1 million as did newcomers to the major city list: Los Angeles (4.4M), Detroit (3.0M), DC, Seattle and Dallas-Ft. Worth. Kansas City, Minneapolis-St. Paul and Houston joined Cincinnati as “major cities” defined as greater than 750K residents. These 19 metro areas contained 50 million people, 31% of the nation’s total and a little more than half of all urban residents. Led by New York’s 13M, the east coast metros totaled 22 million people. Led by Chicago’s 5M, the Midwest metros were close behind with 18 million people. The 3 west coast cities combined for 8 million while the Sunbelt’s 3 cities amounted to just 2.5 million people.

For 2020, we use 2 million as the minimum size for a major metropolitan area. New York (20M), Los Angeles (12M) and Chicago (9M) led the way. Dallas-Fort Worth, Houston, Washington, DC, Philadelphia, Atlanta and Miami all had at least 5 million citizens. 15 new metro areas joined the list, beginning with 6 on the west coast: Phoenix, Riverside-San Bernardino, San Diego, Portland, Sacramento and Las Vegas. The others are widely distributed across the country: Tampa, Orlando, San Antonio, Austin, Columbus, Indianapolis, Charlotte, Nashville and Denver. These 35 metro areas account for nearly one-half of the country’s total population of 330 million. The 4 major regions were relatively evenly balanced: east coast (40M), Midwest (37M), west coast (45M) and sunbelt (43M).

One-half of Americans now live in one of the 35 major metropolitan areas, amounting to 162 million people. That compares with 50 million people in 19 areas in 1950 and 15 million people in 11 areas in 1900. The character of American life has shifted from rural to urban to metropolitan.

https://www.skyscrapercity.com/threads/largest-us-metropolitan-areas-1900-1950.913696/

https://en.wikipedia.org/wiki/Metropolitan_statistical_area

Greatly Increased Diversity

https://en.wikipedia.org/wiki/Historical_racial_and_ethnic_demographics_of_the_United_States

https://www.npr.org/2021/08/13/1014710483/2020-census-data-us-race-ethnicity-diversity

The White, non-Hispanic population has typically been 80-89% of the total. It has fallen rapidly to 58% as Hispanic, Asian and multi-race claimers have increased their shares of the population.
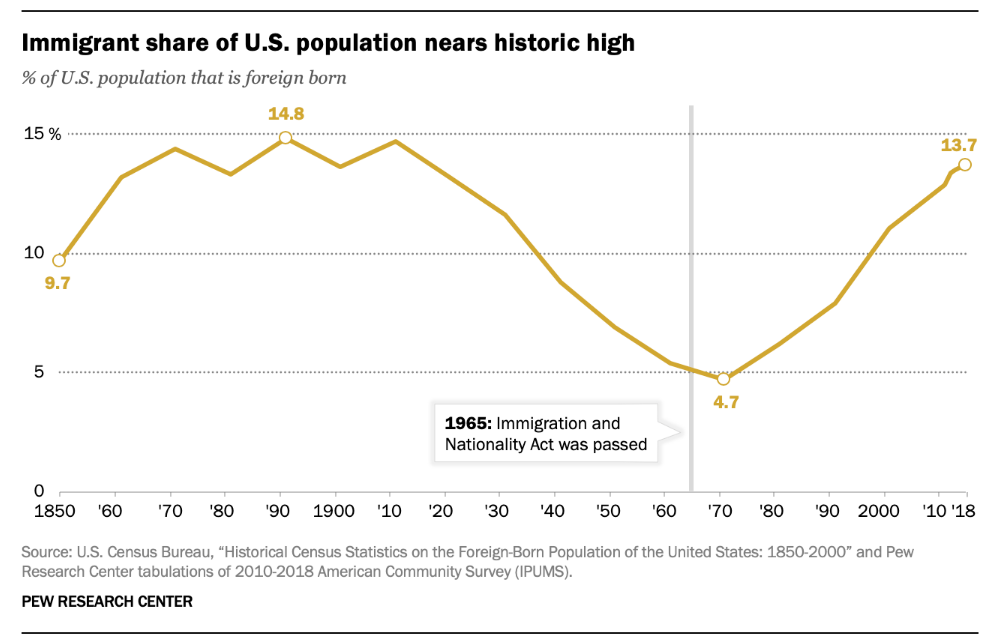
The share of immigrants reached a high of 15% from 1870-1910, dropped to 5% in 1960-1970 before reclimbing back to 15% recently.

Amazing Real Economic Growth

The growth in the size of the US Gross Domestic Product (GDP), the value of goods and services produced in the country, from 1776 to today is essentially incomprehensible at 19,000 times its original size. The population has grown 132-fold, from 2.5M to 330M. Real, inflation-adjusted GDP per person has averaged 2.0% per year across long periods of time. Due to compounding, this 2% becomes 2.7 times in 50 years, 7.25 times in 100 years, 52.5 times in 200 years and 141 times in 250 years.
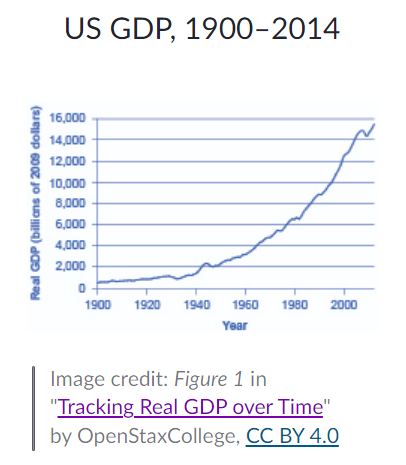
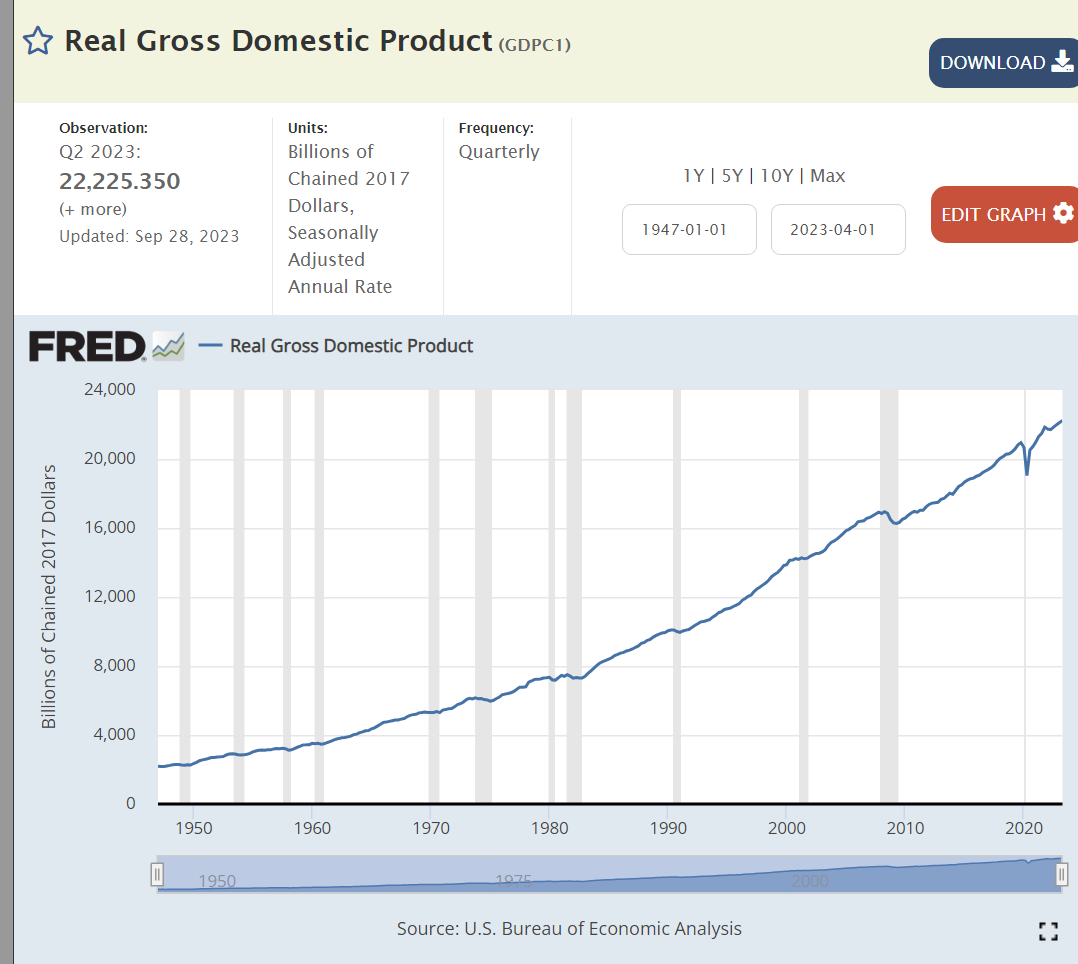
https://www.khanacademy.org/economics-finance-domain/macroeconomics/macro-economic-indicators-and-the-business-cycle/macro-business-cycles/a/tracking-real-gdp-over-time-cnx

https://fred.stlouisfed.org/series/GDPC1

Ag and Manufacturing Down, Services Up

https://www.stewart.com/en/insights/2020/07/08/u-s-supersector-employment-changes-from-1950-to-2020.html

Post-War Growth of Large Corporations

In 1955 the 11 corporations at the middle of the newly created Fortune 500 listing averaged $123 million of annual revenue. Adjusting for inflation (GDP deflator), they would have revenues of $939 million today. Comparable revenues in the latest Fortune 500 listing are $15.6 billion, a 16.6X increase.

https://money.cnn.com/magazines/fortune/fortune500_archive/snapshots/1984/3574.html

https://www.50pros.com/fortune500
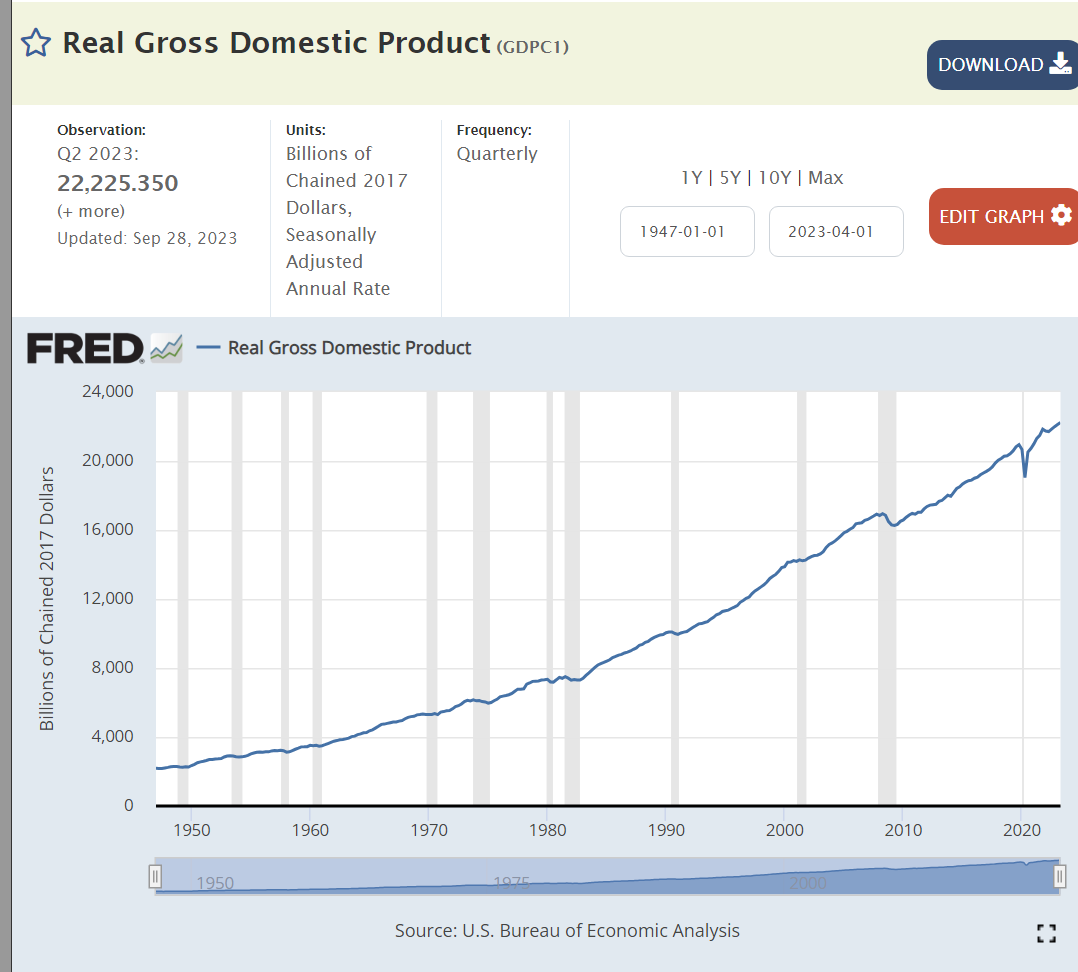
Over this same period total national real GDP has increased from $3.1 trillion to $21.8 trillion; 7.1 times as large. Large US-based corporations have grown twice as fast as real US GDP.

Summary

Small annual percentage changes add up to become transformations through time.

We see this in population, race, immigration, occupations, industries, urbanization, productivity, output and concentration of businesses.

The population and production scale, complexity, trade, product innovation and diversity of the US is beyond any expectations of the founders of the country. The country and its social, political and economic institutions have survived and adapted to allow the country to thrive for almost 250 years. Further adaptations may be needed to support such continued growth and success.
Our Hamilton County: Growing Population

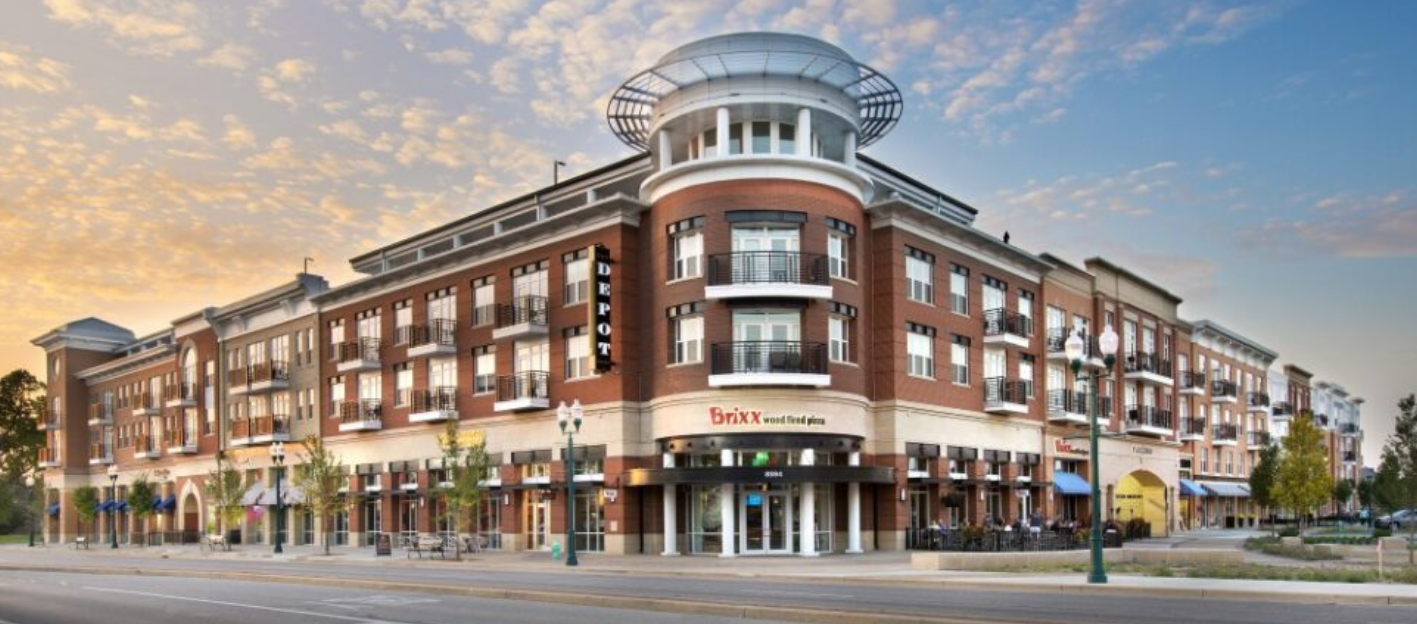
‘https://flco.com/company-properties/thedepot/

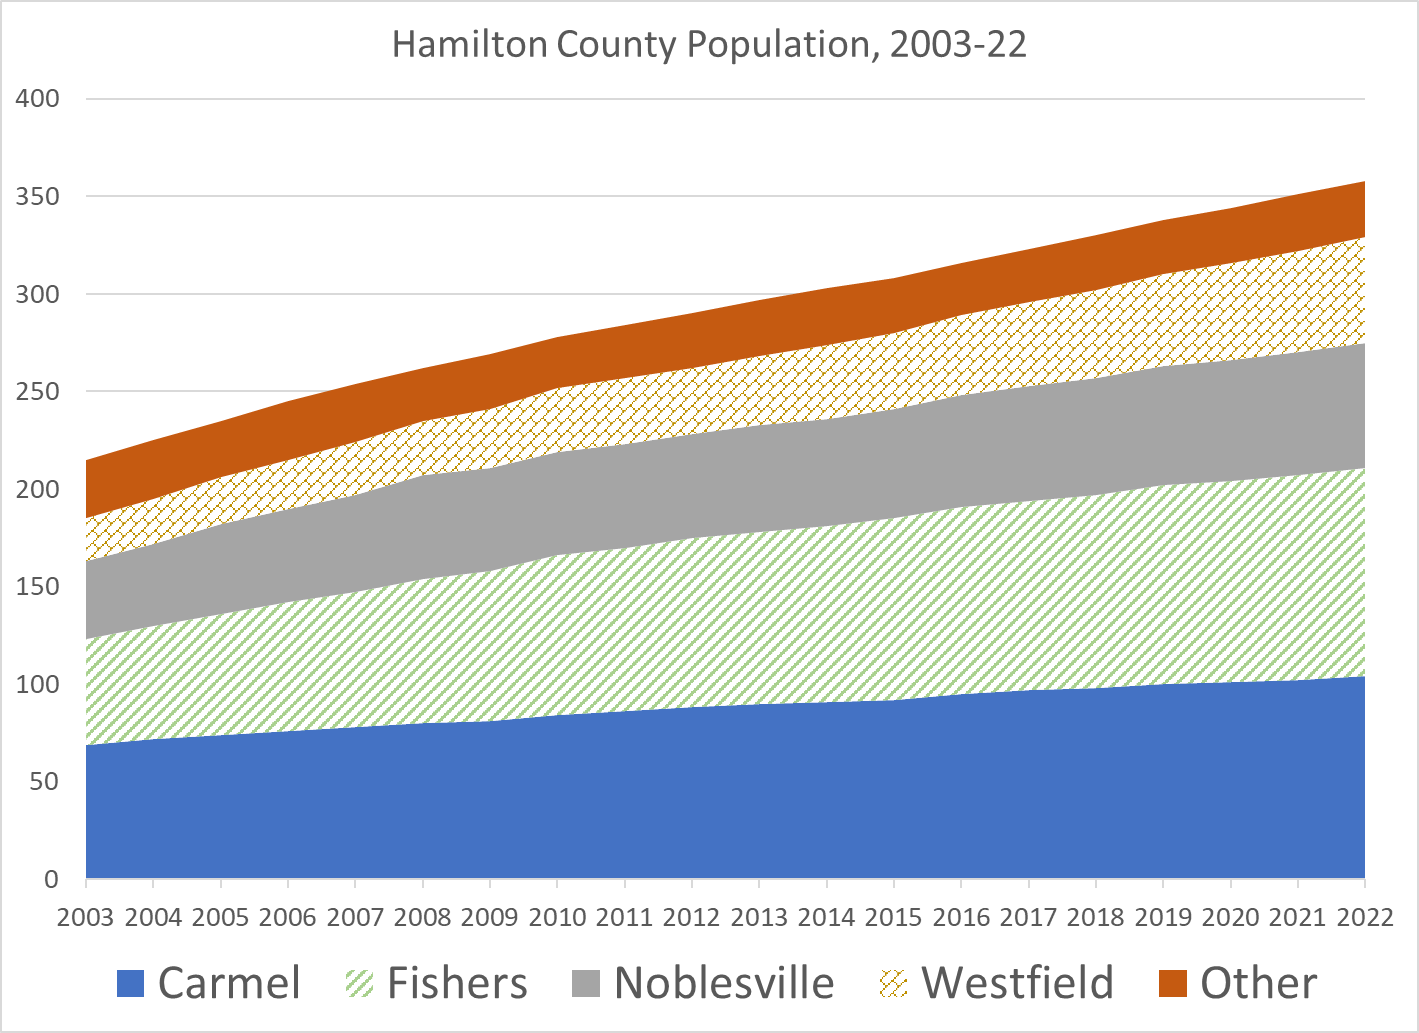
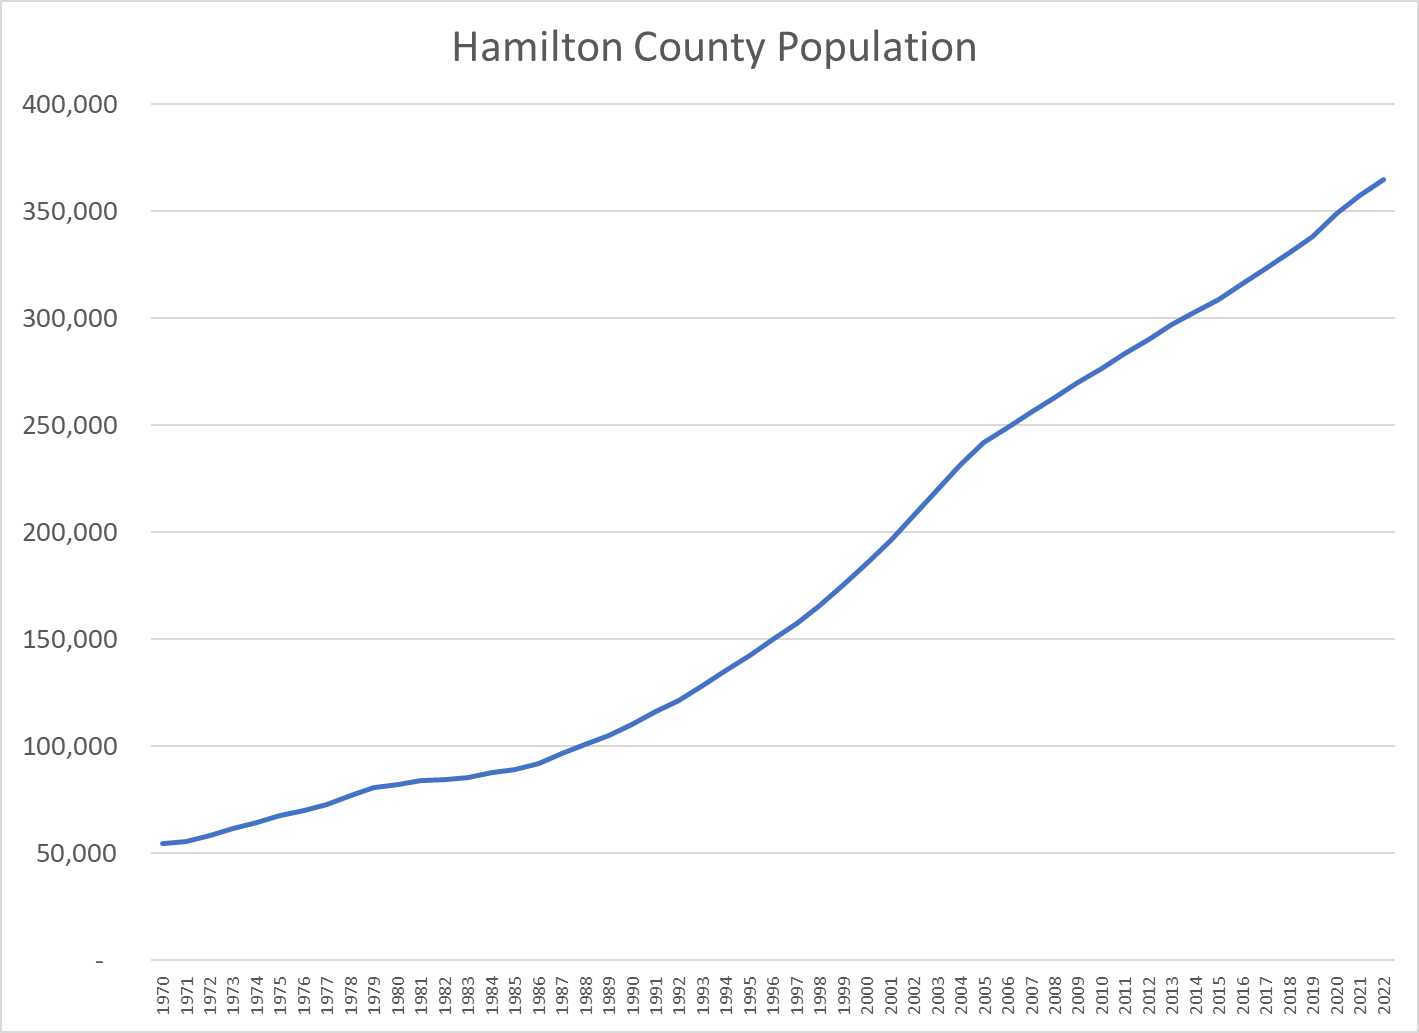
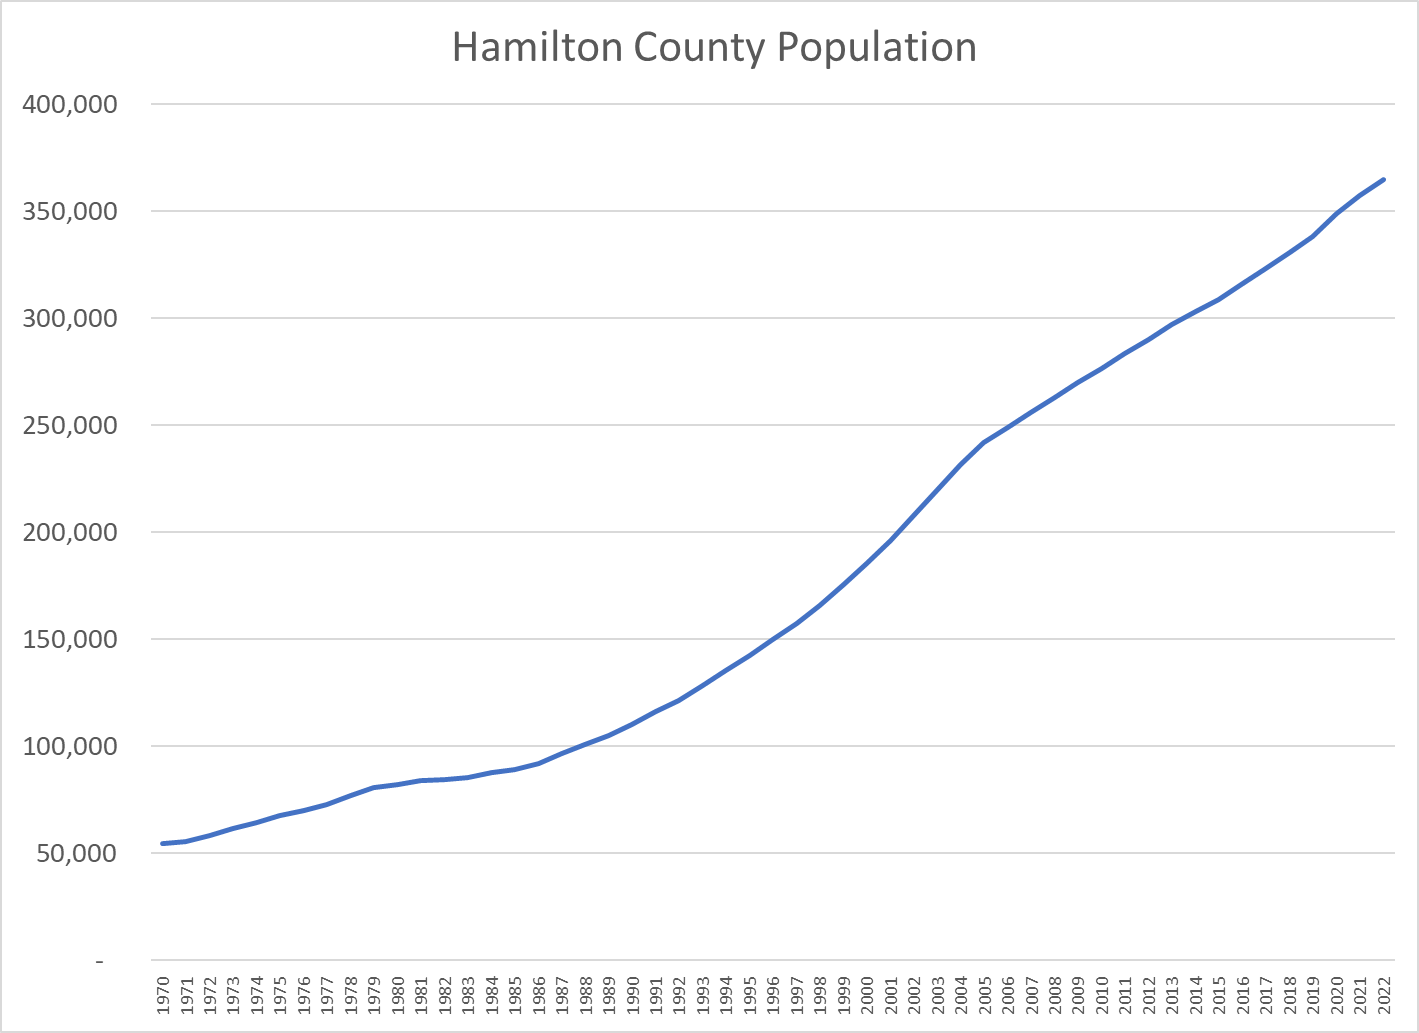
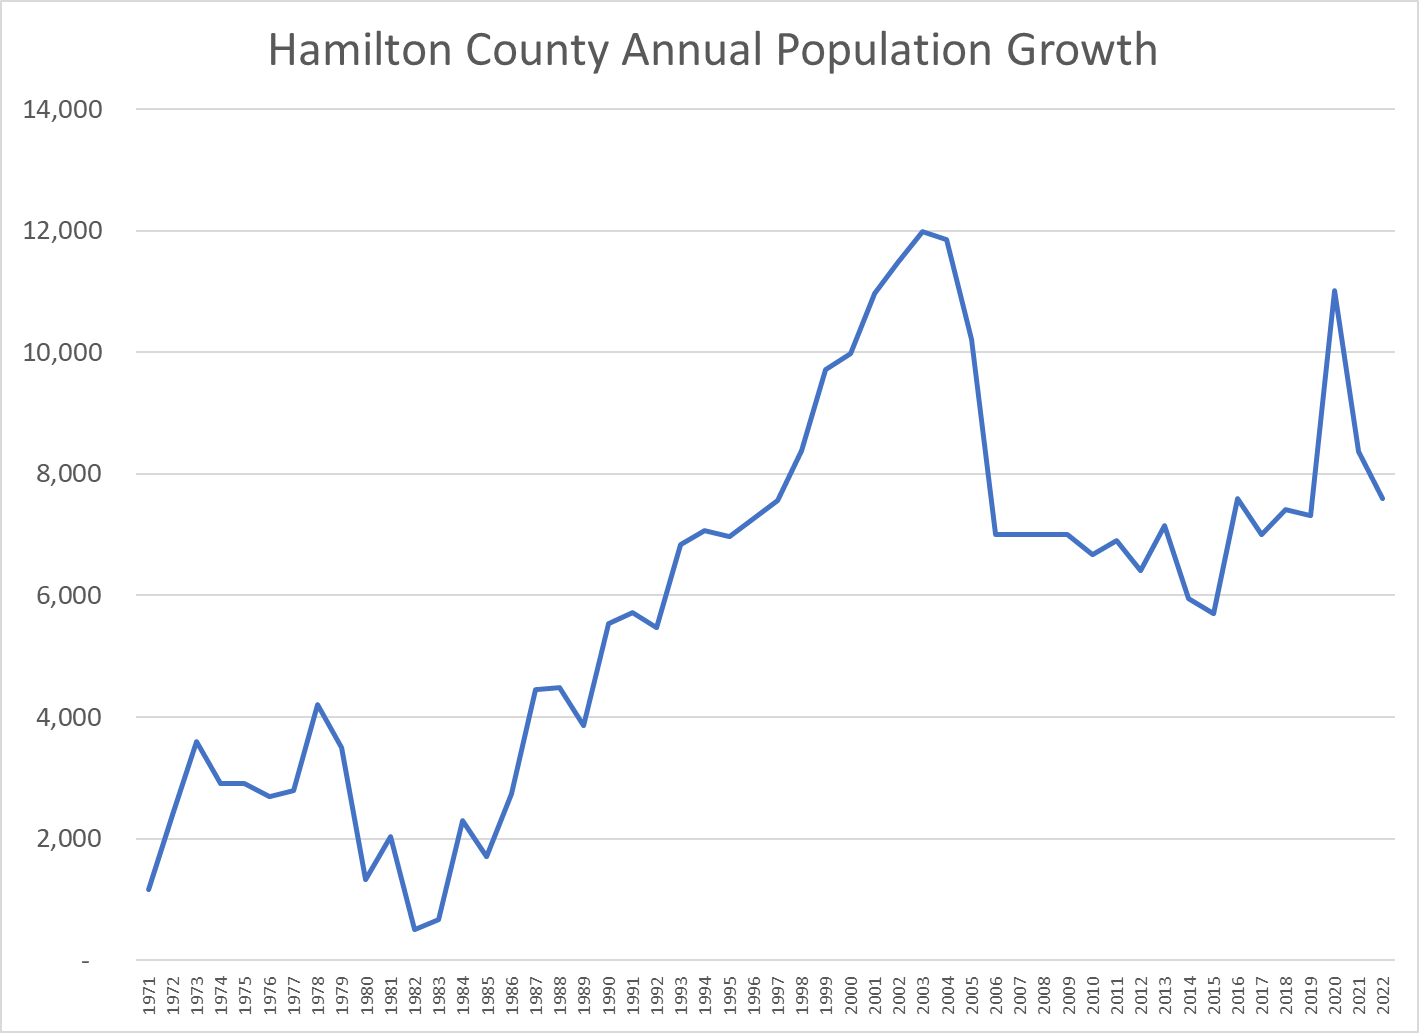
Hamilton County’s population has grown by at least 7,000 per year for 30 years. Growth peaked at 10,000 per year from 1999-2005, decreased to 7,000 in the aftermath of the Great Recession and has since increased to 8,000 per year.

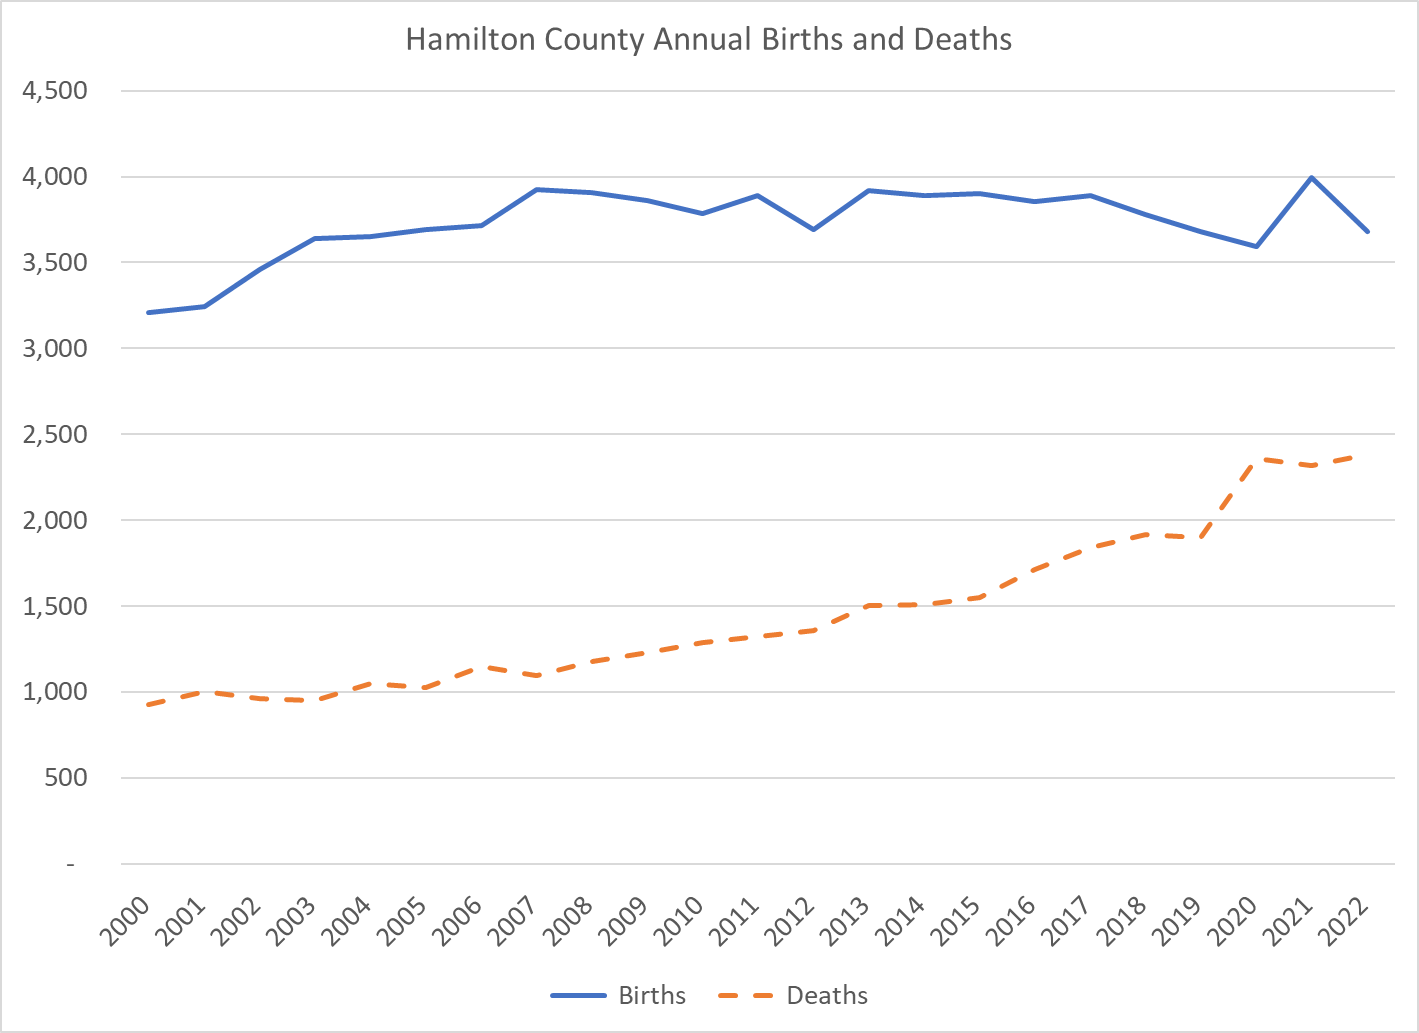
The county has enjoyed a natural increase of about 2,000 per year, with 4,000 births per year and 2,000 deaths per year. Annual net in-migration has averaged 6,000 in the last decade. Hamilton County loses roughly 3,000 residents to other states and 2,000 students to attend major universities. It gains about 4,000 international immigrants, 1,000 from Illinois, 1,000 from other Indiana counties and 5,000 from nearby Marion County.

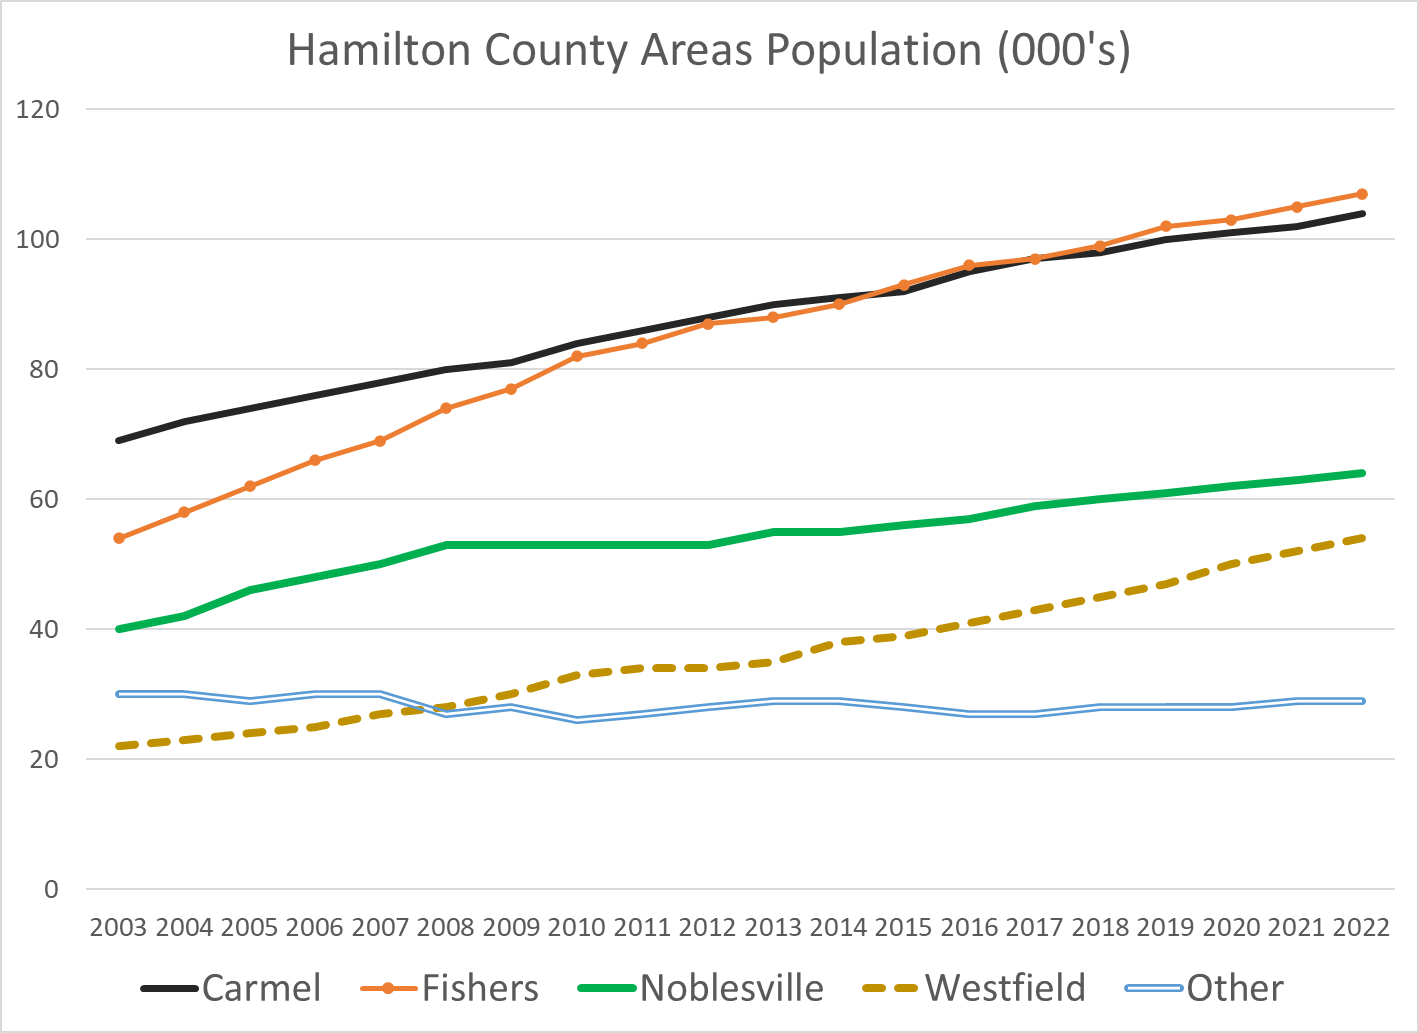
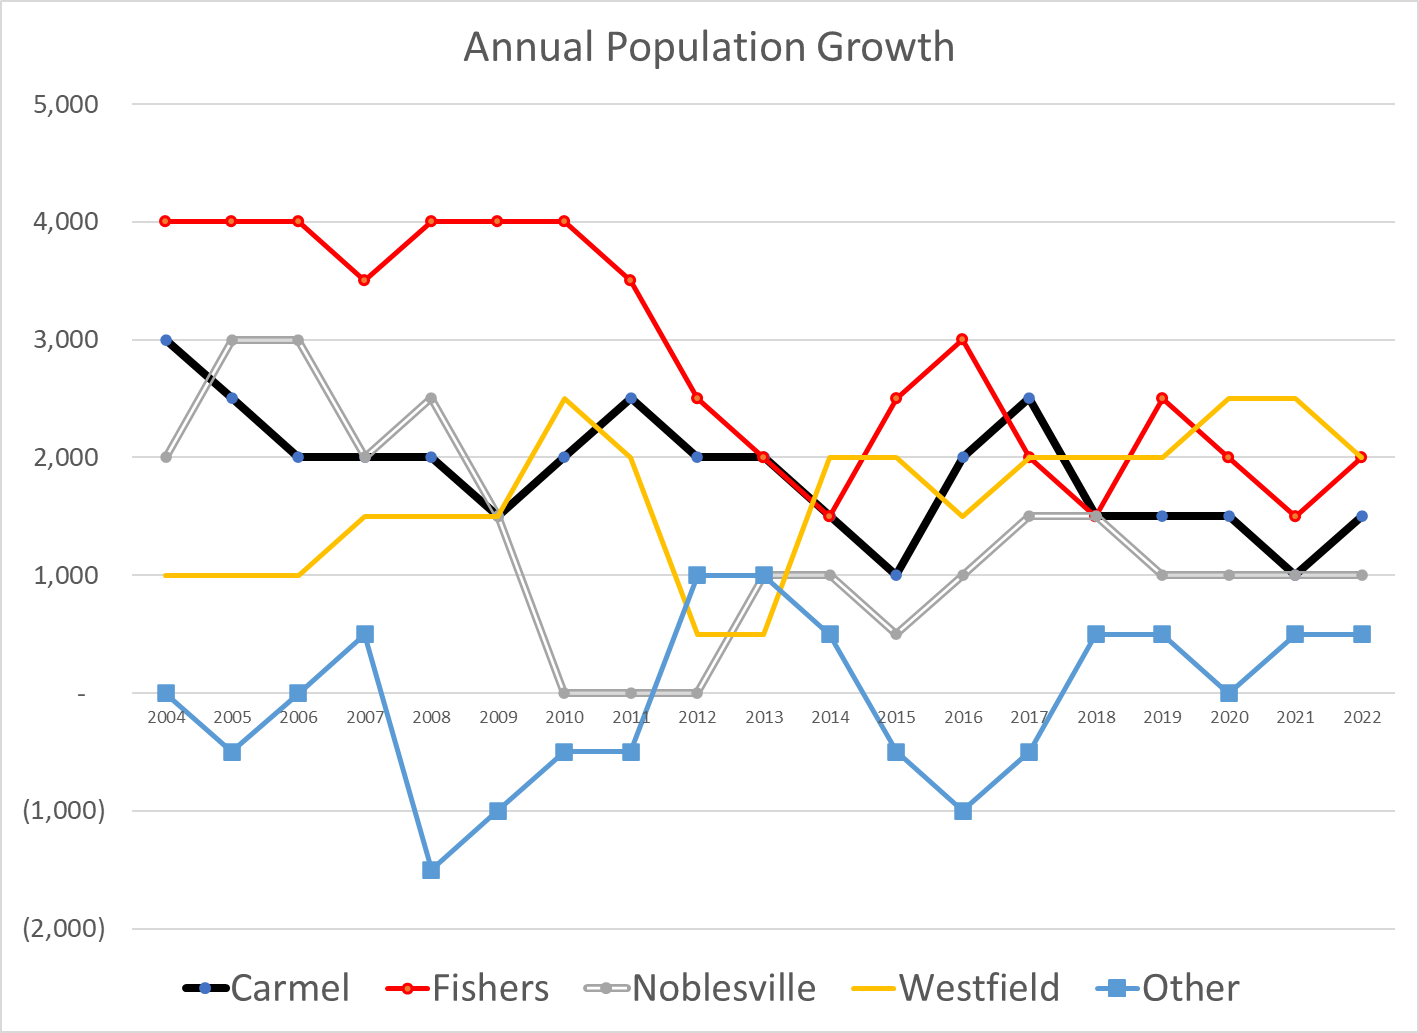
Four major cities contribute to Hamilton County’s rapid growth. Carmel was the early leader. Fishers grew even more rapidly in the 2000’s. Noblesville has continued its steady growth of 1,000 new citizens annually. Westfield has joined Carmel and Fishers in adding 2,000 residents per year, showing a higher percentage growth rate on its lower base.

Forecast Growth Through 2050

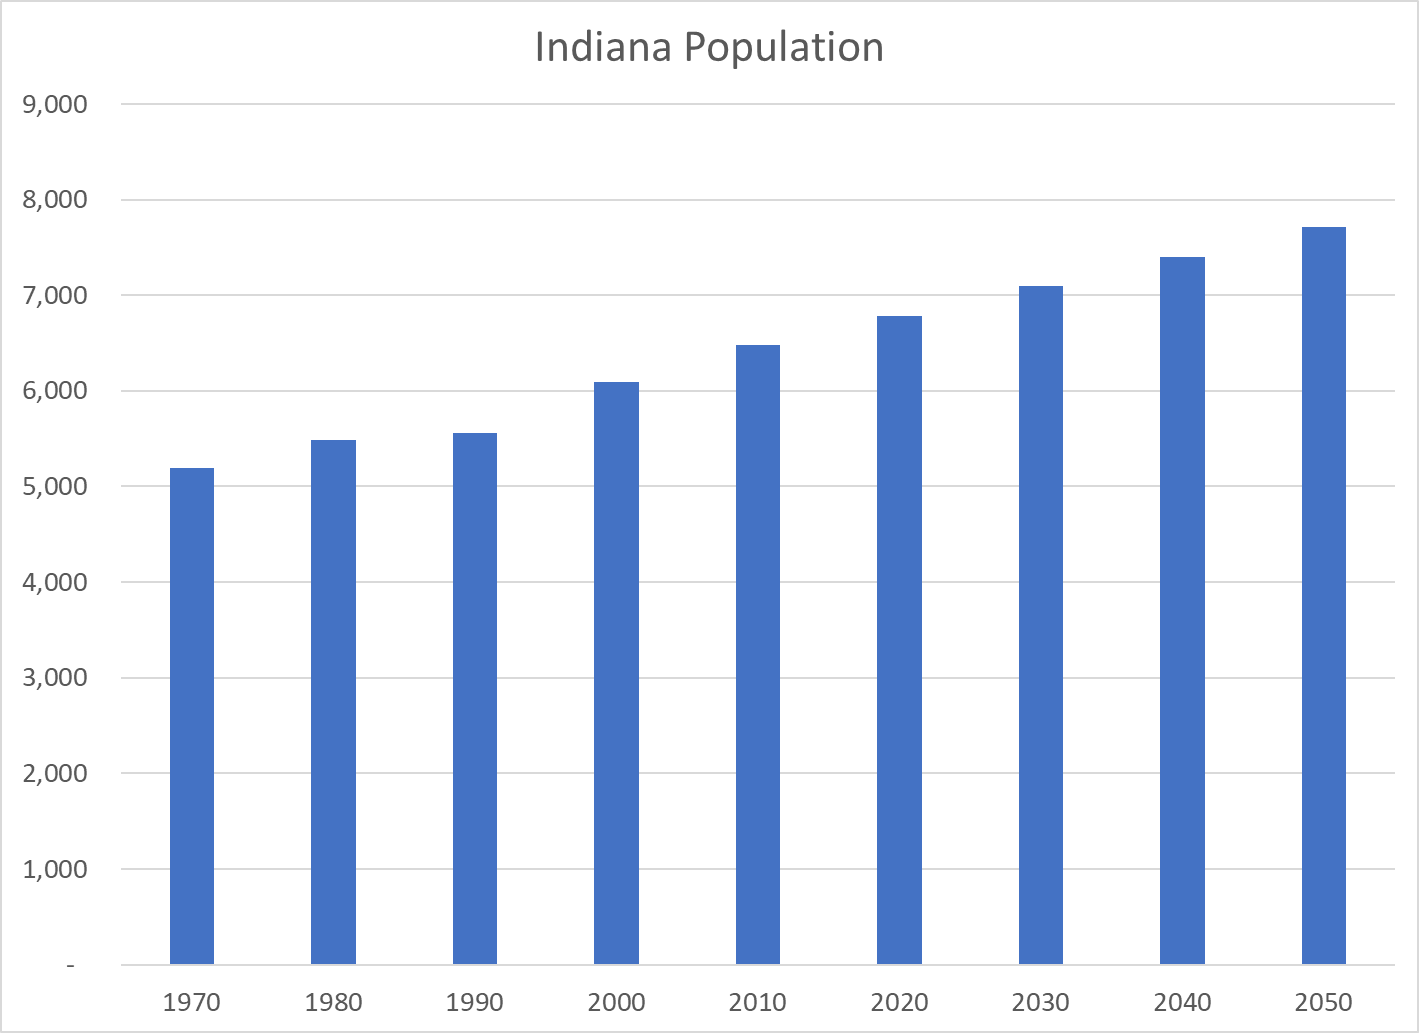
Indiana has grown by 300,000 people per decade for the last 50 years and is expected to continue growing, perhaps at a somewhat slower rate.

https://www.incontext.indiana.edu/2018/mar-apr/article1.asp#:~:text=Boone%2C%20Hendricks%2C%20Johnson%20and%20Hancock,Clark%2C%20Elkhart%20and%20Switzerland%20counties.

The 2020 census results were significantly higher than the 2018 state of Indiana forecast update. The 2018 forecast shows Hamilton County in 2050 at 528,000 people rather than 567,000 with growth of 180,000 rather than 219,000. It has Indiana at 7.3 million instead of 7.7 million people in 2050.

https://newsinfo.iu.edu/news/page/normal/21689.html

https://www.stats.indiana.edu/topic/projections.asp

The metropolitan Indianapolis area is expected to continue to experience solid growth rates for the next 3 decades.

In 1970, Hamilton County had 55,000 citizens and ranked 21st of Indiana’s 92 counties. It doubled in size to 110,000 by 1990, ranking 11th largest and joining Madison, Delaware, Tippecanoe, Vigo and LaPorte as “major” counties. By 2000 Hamilton County contained 185,000 people and was ranked the 6th largest in Indiana. Hamilton continued to grow by 75,000 per decade, passing Elkhart and St. Joseph counties for 4th place by 2010. Based on these trends, Hamilton will pass Allen County by 2030 and Lake County by 2040 to become the second largest Indiana county, trailing only Marion County.

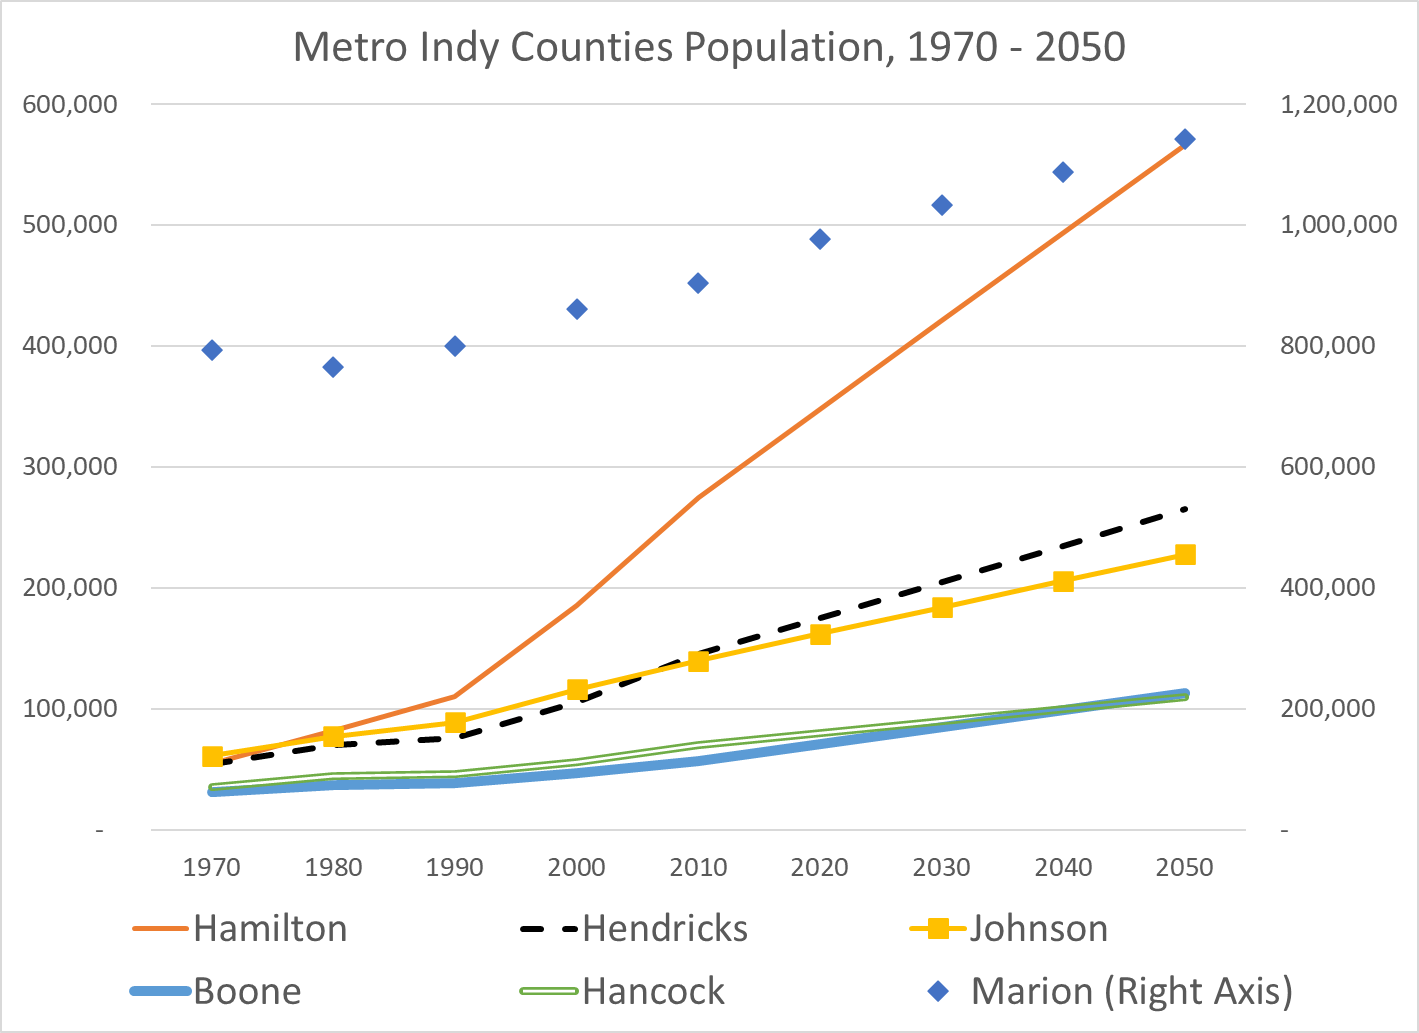
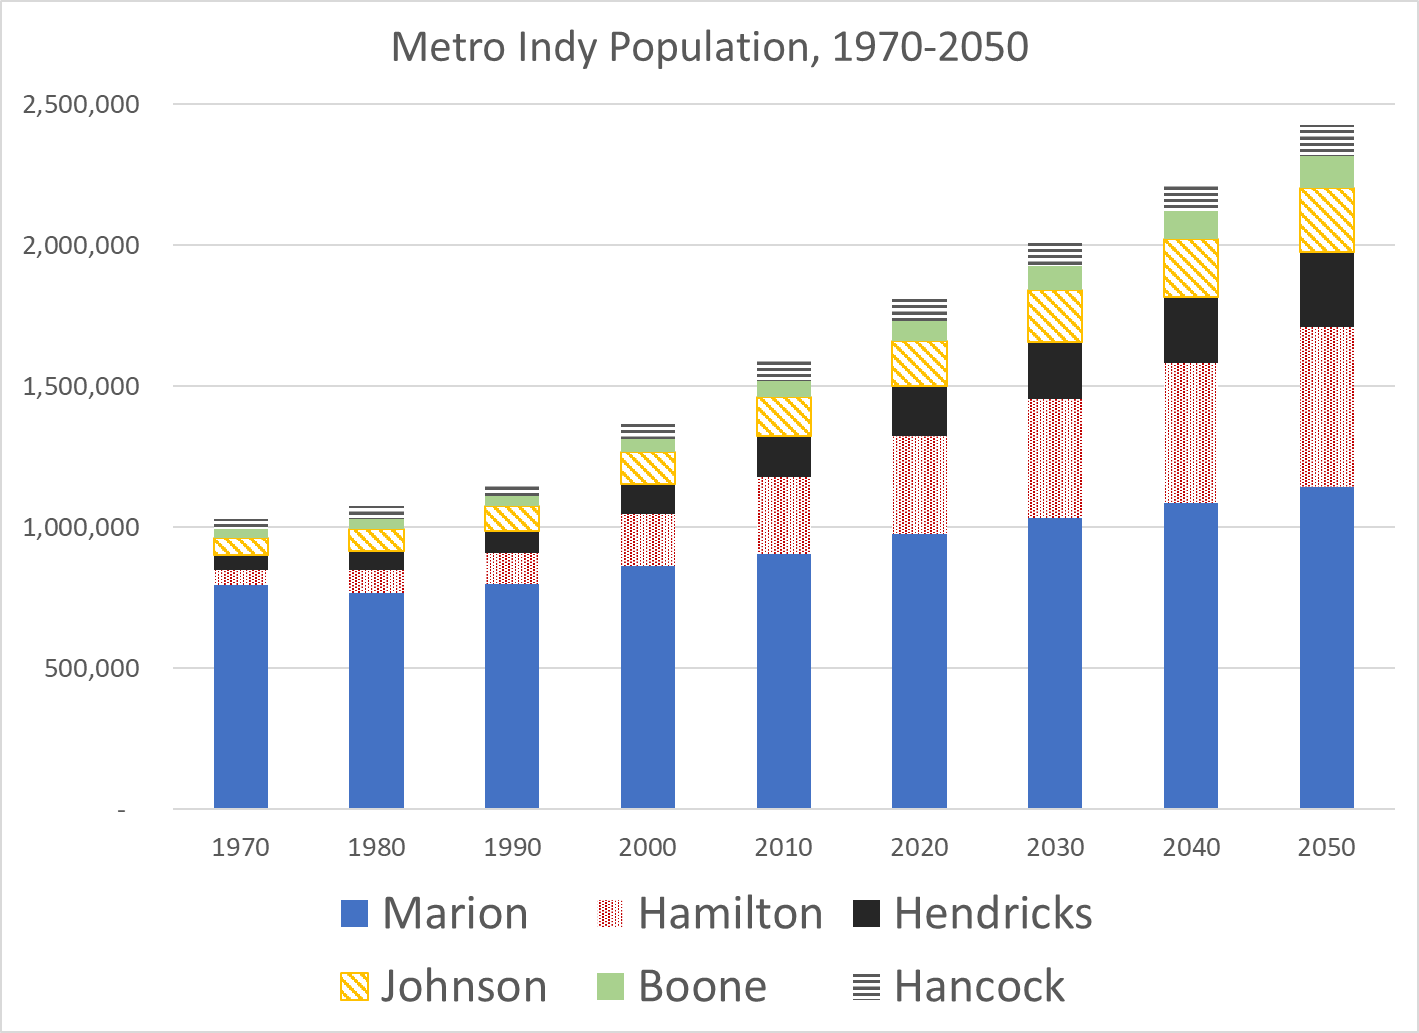
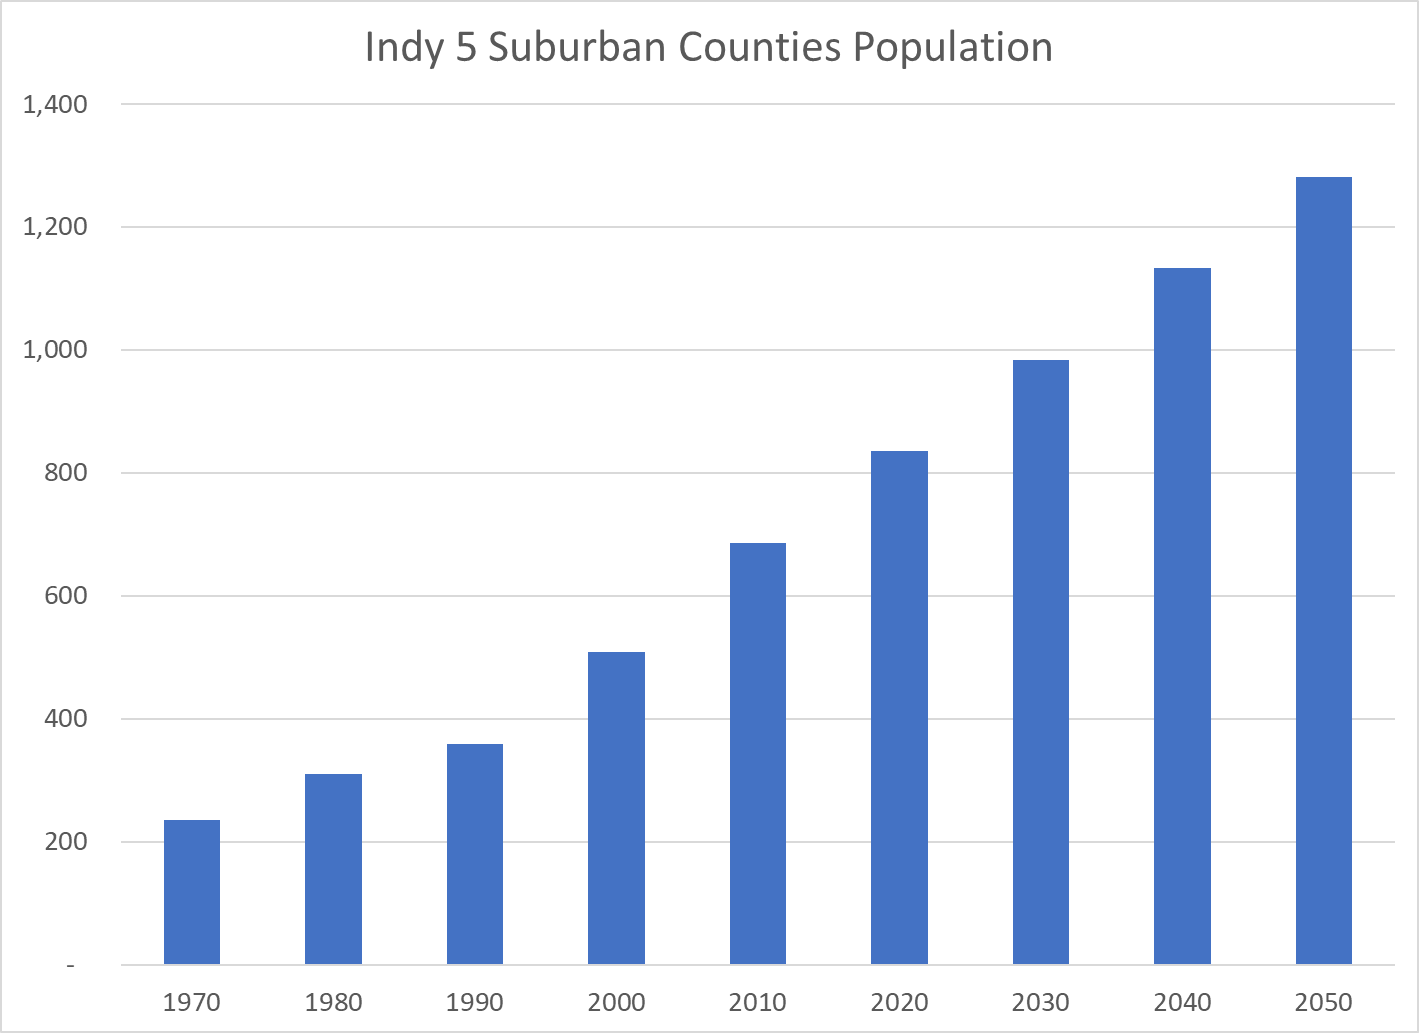
Hamilton County has grown as part of the Indy Metro area. Marion County has averaged growth of 60,000 people in the last 3 decades. Hamilton County is forecast to maintain its 73,000 per decade growth rate. The other four suburban counties are forecast to maintain their combined 80,000 per decade growth rate.

Summary

Hamilton County has enjoyed annual population growth of 7-8,000 for the last 30 years and can reasonably be forecast to continue such growth for the next 30 years. The growth of the Indy Metro area stands out versus slower growing areas in Indiana and the Midwest. Hamilton County’s four major cities continue to attract new residents and the county’s northern areas remain available for managed development within short commuting distances of the existing economic centers throughout the county. Economic growth has a tendency to be self-reinforcing. As Hamilton County approaches one-half million residents it will focus more on “managing” such growth.

Our Hamilton County: More Diverse

https://www.playfishers.com/250/Volunteer-at-the-Market

https://view.officeapps.live.com/op/view.aspx?src=https%3A%2F%2Fwww.stats.indiana.edu%2Fc2010%2Fdp1%2FIndianaCounties.xlsx&wdOrigin=BROWSELINK

https://www.stats.indiana.edu/topic/census.asp#C2020

https://www.census.gov/data/tables/2000/dec/phc-t-09.html

Summary

Between 2000 and 2020, Hamilton County added 165,000 residents.

It added 60,000 minority group members and 105,000 non-Hispanic Whites.

The Black population quadrupled, growing to 4% of the total.

The Hispanic population increased six-fold, climbing to 5% of the total.

The Other/Multiple Race group grew 8-fold, reaching 5%.

The Asian population almost tripled, at close to 7% of the total.

Overall, the minority population increased 6-fold from 12,000 to 72,000, tripling its share of the total population from 7% to 21%.

Hamilton County’s 14% increase in minority population share was greater than the US average of 11% from 2000 to 2020.

Hamilton County’s 21% minority share of its population is one-half of the US’s 42% average. The 2000 comparison numbers were 6% versus 31%.

Hamilton County has a significantly smaller share of Blacks (4% versus 12%) and Hispanics (5% versus 19%) compared with the nation.

Hamilton County’s Other/Multiple race share (5% versus 6%) is closer and it holds proportionately more Asians (7% versus 6%) than the nation overall.

The county is making significant progress in welcoming all groups.

Our Hamilton County: By Age Group

https://www.standard.co.uk/news/uk/four-generations-royal-family-new-decade-a4326271.html

Summary

Hamilton County’s population continues to be about 1 year younger than the average for Indiana.

Hamilton County’s population increased by 90,000 in the decade to 2010 and by almost 75,000 in the decade to 2020.

The “core” 18–64-year-old age group declined just a bit, from 62% to 61% of the total.

Pre-schoolers grew by only 4,000, so they dropped from 9% to 6% of the total.

School agers grew by 30,000 but decreased from 22% to 20% of the total.

Retirement age citizens tripled, from 14,000 to 45,000, shooting up from 8% to 13% of the total.

Hamilton County’s pre-school 6% share matches the state average.

Hamilton County’s 20% of school agers is 3 points above the state average of 17%.

It’s 13% of retirement aged citizens is 3 points lower than the state’s 16%.

The 61% “core” age population matches the state average.

Hamilton County’s population is a little younger than Indiana’s.

It has aged by nearly 4 years since 2000, with a growing share of older and fewer school aged citizens.

Indiana Population Growth: 1970-2050

https://www.colts.com/game-day/stadium/

The last official forecast of Indiana’s population was made in 2012, estimating growth from 6.5M in 2010 to 7.5M in 2050. The actual population was a little higher than this forecast in 2020. My forecast is for 7.7M in 2050.

https://www.ibrc.indiana.edu/ibr/2012/spring/article1.html

Indiana was and is an agriculture and manufacturing intensive state. Population growth slowed in the 1970’s and 1980’s before recovering in the 1990’s. Indiana added 1.2M people in the 30 years from 1990 to 2020, growing by 7% per decade, about one-half of the national average, but faster than its neighbors.

I expect the 2010-2020 growth levels to continue for the next 3 decades.

Indianapolis (Marion County) is the only major city in Indiana. It was also manufacturing intensive at the end of the 20th century. Its population growth stagnated in the 1980’s and 1990’s before recovering.

Indy’s suburbs were immaterial in 1970, but have grown to be nearly as large as the main city in 2020.

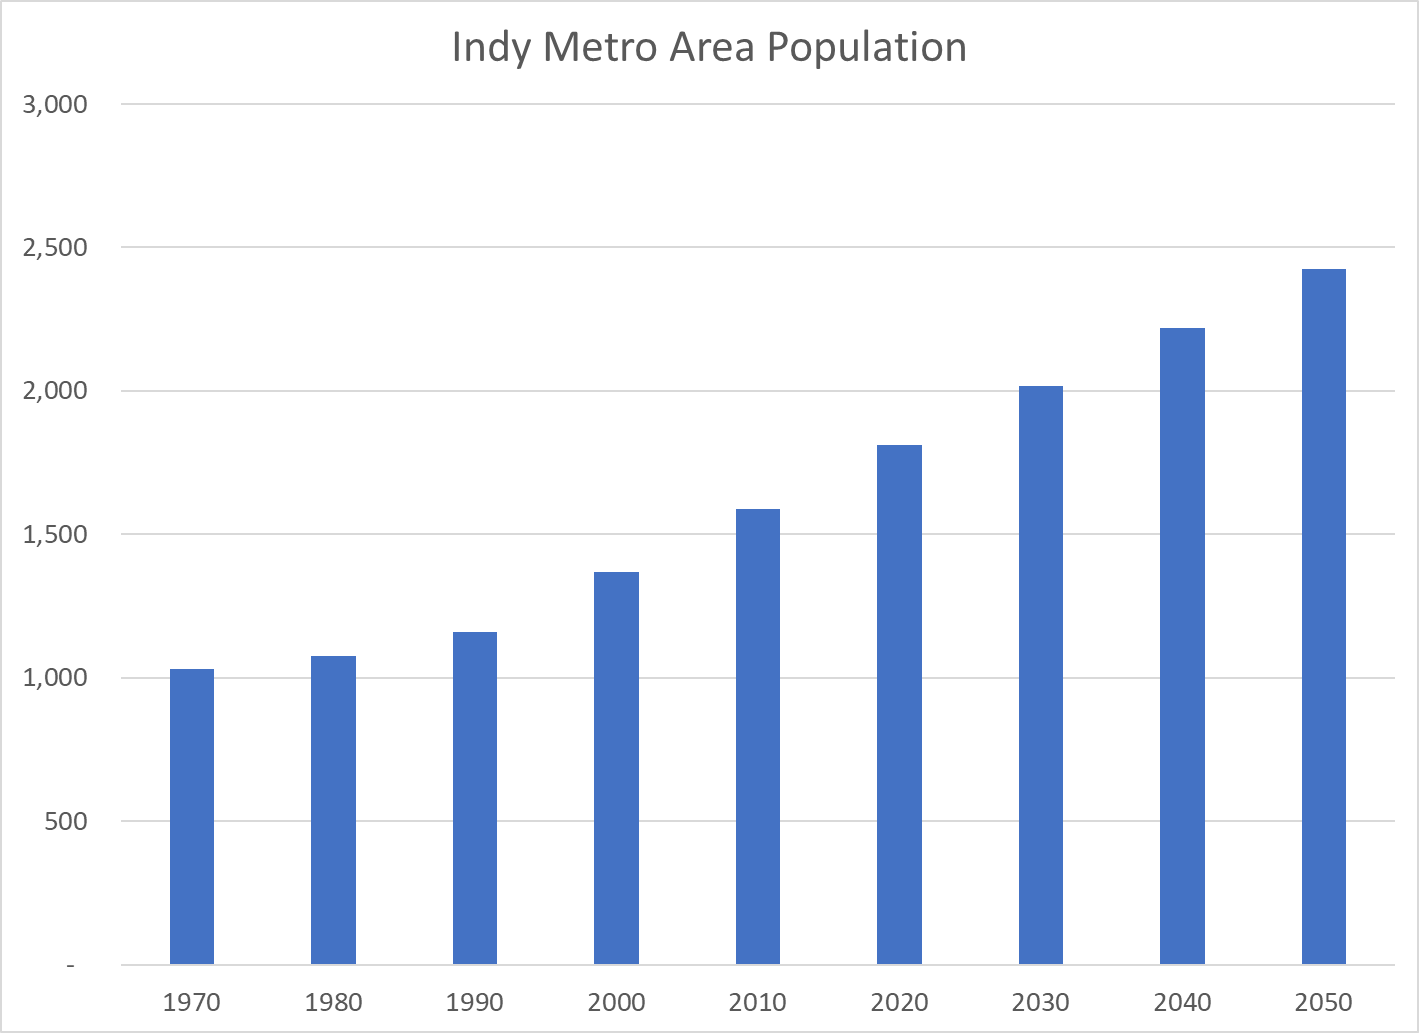
The total Indy metro area grew by 80% from 1990 to 2020 and is expected to grow at the same rate for the next few decades.

Like metro areas across the country, Indianapolis has grown much faster than the rural counties of Indiana.

Lake County (Gary) in the northwest corner of Indiana is the second largest metro area of Indiana. Its population dropped drastically from 1970 to 1990 and has slowly recovered. This manufacturing intensive area is not considered a highly attractive Chicago suburb, but it has found sources of growth.

The four counties east of Lake County are a separate economic area and have grown since 1970 at a reasonable pace.

The I-90 corridor’s population was the same size as metro Indianapolis from 1970-1990, but their growth paths diverged afterwards.

Historically, Ft Wayne has been the third largest Indiana city. It was also a manufacturing leader, which slowed its growth in the 1980’s and 1990’s. It has since recovered and established a strong growth rate.

Indiana has 6 other minor cities that have collectively accelerated their growth since 1990. Tippecanoe and Monroe Counties benefit from their state universities. Columbus (Bartholomew) is a manufacturing leader supported by its proximity to IU and Indianapolis. Clark County is a suburb of Louisville. Evansville (Vanderburgh) has struggled to find a new economic engine due to its small size and remote location, despite the extension of I-69. Terre Haute (Vigo) has also been slow to find new engines of growth to replace its historic manufacturing strengths.

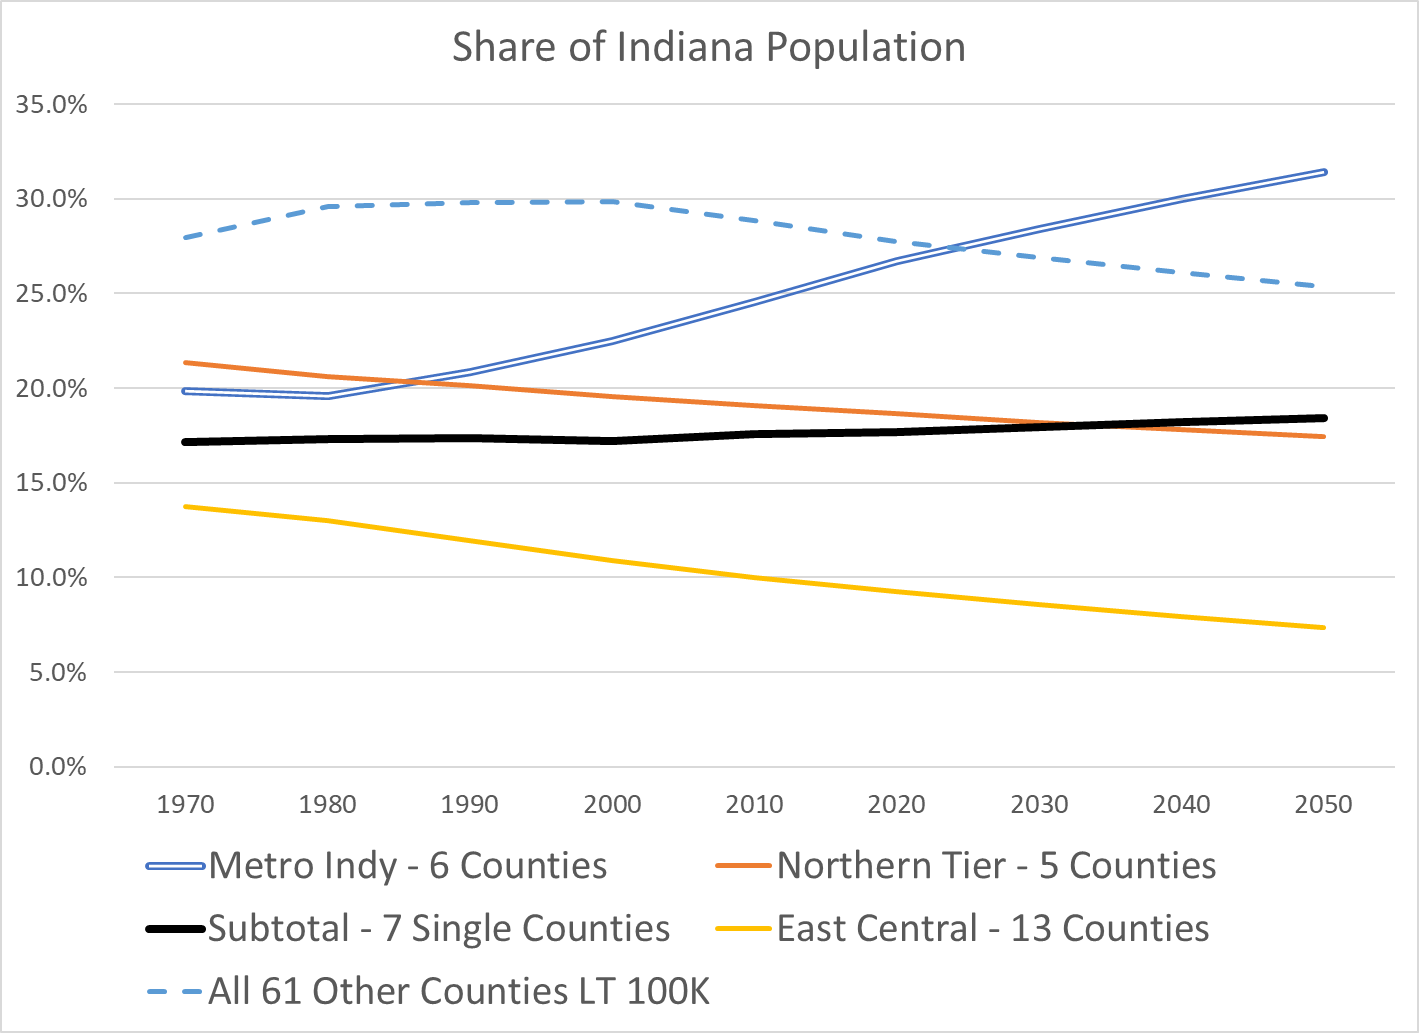
These 18 larger counties (of 92) have collectively driven almost all of the population growth in Indiana for the last 30 years. These trends are expected to continue for the next 30 years.

A broad swath of 13 counties north, east and northeast of Indianapolis have seen population declines in the last half century and will likely experience further declines. The natural gas boom, Wabash River transportation advantage and national road (US 40, I-70) advantage drove manufacturing in these areas in the early twentieth century. General Motors grew and then declined. The Ball Corporation grew and declined. Muncie was the subject of the famous Middletown sociology studies of the typical American community and this area, and the greater Indianapolis area have remained targets of marketing and political research studies. Logansport, Peru and Wabash along the river. Marion, Anderson and Muncie. Hartford City, Portland, Randolph, Richmond, Connersville, Newcastle and Rushville. The 61 other Indiana agricultural counties managed to grow slowly from 1970 to 2000 but found their limits afterwards.

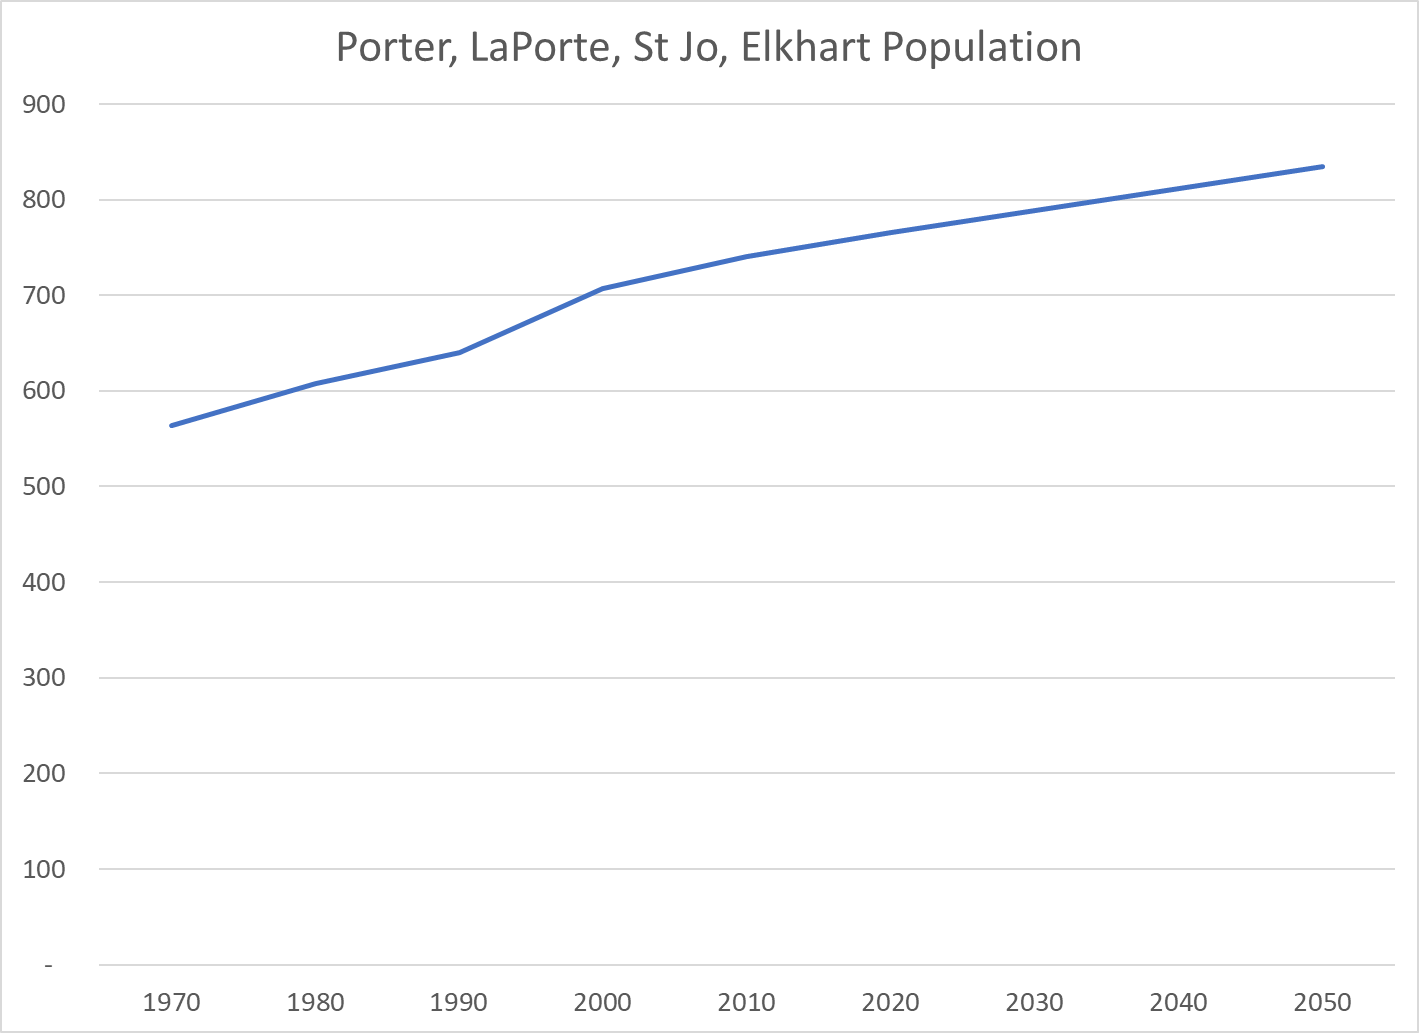
In the modern world, local economies must find “critical mass” in order to succeed. Metro Indy is doing well. The I-90 corridor near Notre Dame is surviving as are the other mini-metro areas. The other 74 counties are stagnant.

How Hamilton County, Indiana Grows

Hamilton County, Indiana is north of Marion County and Indianapolis. It has grown seven-fold since 1970, from 54,000 to more than 365,000 people. It now ranks in the top 7% as the 209th largest county of the 3,142 in the US. It is the fourth largest of Indiana’s 92 counties, trailing Marion (Indianapolis), Chicago’s suburban Lake County and Allen County (Ft. Wayne) which it will surpass for third place in 2029.

The county has averaged a 7,800 person annual increase since 1990 and has maintained a 7,500-person annual increase in the last decade.

Growth reached a peak of 12,000 per year prior to the Great Recession, dropped back to 7,000 per year and has slowly grown to 8,000 per year.

As a growing suburban area, the county has benefitted from a younger population with relatively more births and less deaths. This demographic advantage has decreased through time.

On average, this natural increase advantage has provided 2,000 additional people each year for the last two decades. The net in-migration level was over 8,000 before the Great Recession, dropped in half to 4,000 before recovering to about 6,000 people per year.

The US Census Bureau’s American Community Survey (ACS) attempts to measure the annual migration flows between all 3,142 counties! It’s survey techniques generally require a 3-5 year sampling period to have statistical reliability. The US Census Data and the Indiana Vital Statistics Data (Births and Deaths) show an implicit net in-migration to Hamilton County from 2011-20 of 4,575 annually. The ACS reports just 3,124. The actual increase is 144% of the surveyed increase.

https://www.census.gov/topics/population/migration/guidance/county-to-county-migration-flows.html

https://www.stats.indiana.edu/vitals/

https://wonder.cdc.gov/controller/datarequest/D158

Cross-County Migration

Hamilton County’s population ranged from 283-346,000 between 2011-20, for an average of 314,000. Inbound migration averaged 23,600 per year or 7.6% of the population. Outbound migration averaged 20,400 per year or 6.6% of the population. On average, the county’s population turns over every 15 years. The net in-migration in the ACS survey was 3,100, a little more than two-thirds of the implicit 4,600 net in-migration per year. I compared the 2011-2015 and 2016-2020 data and found that they were generally consistent. I believe that the proportions reported are generally accurate.

International In-Migration

ACS reports an annual average of 1,800 international immigrants. This is 59% of the net 3,100 figure; quite material. On an annual basis, this is just 0.6% of the county population, but for a decade it is 6%. 61% of Hamilton County’s international immigrants report Asia as their home continent.

Total US Migration

Net in-migration to Hamilton County from the US is a positive 1,300 per year in the ACS survey, perhaps 1,900 including the 1.46X factor. Net domestic net in-migration is two-thirds the size of international net in-migration; 0.4% annually or 4% per decade.

48 States Aside from Indiana and Illinois

Net in-migration to Hamilton County from the other 91 counties in Indiana plus Illinois averages 3,004 per year, essentially equal to all of the total net in-migration. Net in-migration to Hamilton County from the other 48 states is a negative 1,700 per year, roughly one-half of the positive overall net in-migration figure. Hamilton County receives minor positive inflows from the adjacent states of Ohio, Michigan and Kentucky. It sends 1,000 residents to Texas each year and receives just 400 in return. Texas accounts for one-third of Hamilton County’s net out-migration aside from Indiana and Illinois. Hamilton County exports 1,200 residents annually to Florida but an equal 1,200 return each year.

Chicago, Illinois

In the last decade 1,500 people annually moved to Hamilton County from Illinois (Chicago) and just 700 returned the favor. Hamilton County received a net 800 residents from Illinois each year in the past decade. This is one-fourth of the net in-migration to Hamilton County. Many Hamilton County college graduates make Illinois their first professional home, so the flow of experienced professionals from Chicago to Hamilton County is probably more than 1,500 per year.

Marion County, Indiana (Indianapolis)

Hamilton County’s Carmel, Fishers, Westfield and Noblesville claim that they are “edge cities” somewhat independent of Indianapolis. In the last decade a net 3,300 migrants from Marion County chose to make Hamilton County their home each year, accounting for more than ALL of the ACS survey’s 3,100 annual increase. Marion County has nearly 1 million people and continues to grow slowly despite this 0.3% annual leakage to Hamilton County.

College Students

Hamilton County school graduates have very high college attendance rates. Hamilton County exports 2,600 students each year to IU, Purdue and Ball State and receives 1,000 back, for a net out-migration of 1,600 per year, about one-half of the net in-migration figure.

Indiana

Hamilton County has a minor net in-migration from sparsely populated Boone County to its west (300/year). It’s net in-migration with the 8 nearby counties, including Boone, is a 500 loss. Hamilton County is an attractive suburban destination, but net net it loses 500 residents annually to nearby counties other than Marion.
Setting aside Marion County and the 3 university counties, Hamilton County attracts 500 new residents annually from the other 87 Indiana counties.
Summary

Hamilton County enjoys a 2,000-person annual natural population increase due to its relatively young age profile. Half of its 6,000-person annual net in-migration is driven by international immigrants attracted to its schools, amenities, services and culture. Most of its remaining growth is driven by nearby Marion County residents who are seeking the same results. Hamilton County is attracting residents from Chicago as retirees, commuting residents or transplants. Hamilton County loses about 2,000 college students each year who migrate into a national labor market. This is an opportunity for further population growth. It also shows that the net 3,100 growth per year figure understates the attractiveness of this county to all potential migrants.
Mostly Good News Since the 2008 Great Recession

https://content.time.com/time/specials/2007/article/0,28804,1733748_1733756_1735278,00.html

Real, after inflation, Gross Domestic Product is up by one-third, despite the pandemic. That’s 2% annually, despite the Great Recession and the pandemic. The US economy is very solid.

A 21% increase in per capita income during this time. Quite solid and constant growth.

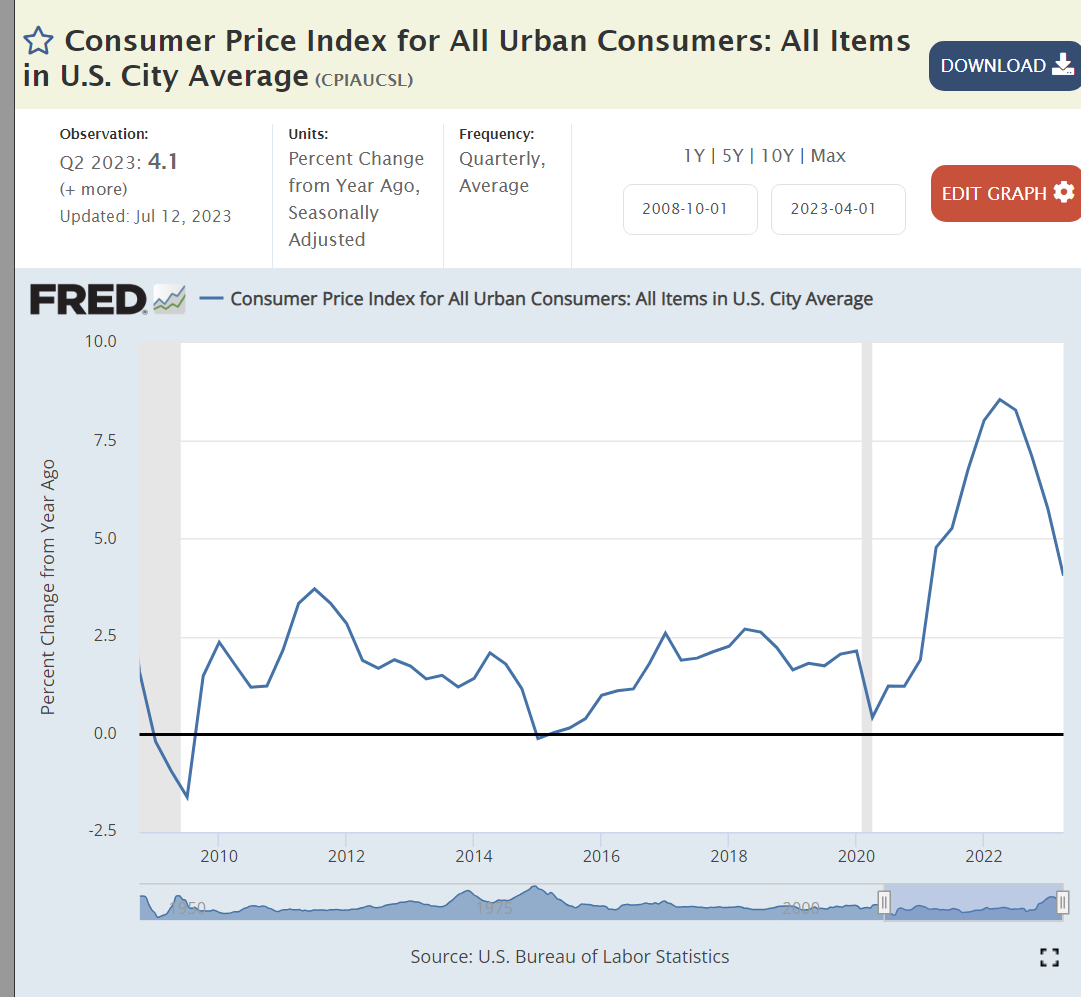
Inflation averaged a bit less than 2% before the pandemic, spiked to 8%, and has since declined to 4%. Experts disagree on whether it will return to 2% soon.

Gas prices are the most obvious component of inflation. They are largely driven by global supply and demand. Prices today are the same as in 2011-14, despite the general inflation increase of more than 20% since then.

Despite the pandemic, US unemployment is at a 50 year low!

Job seekers today encounter 3 times as many job openings.

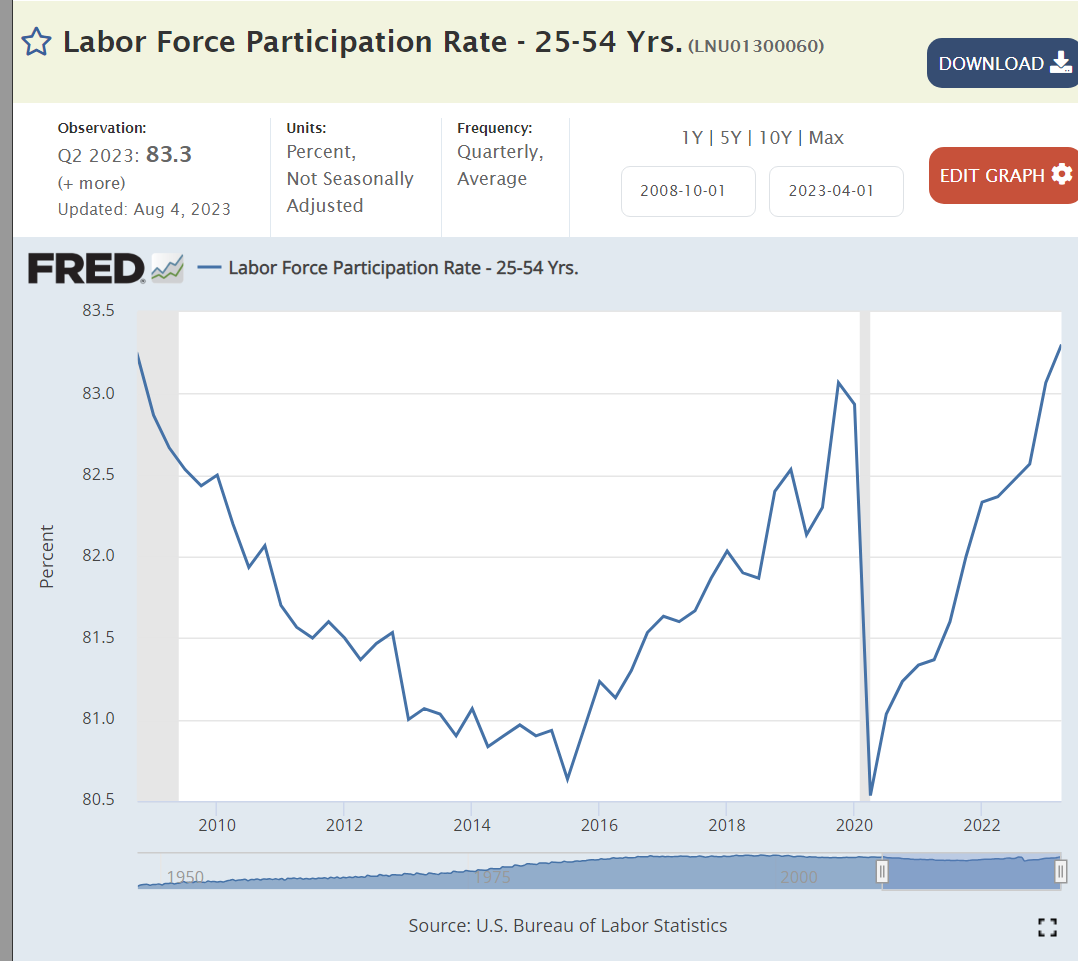
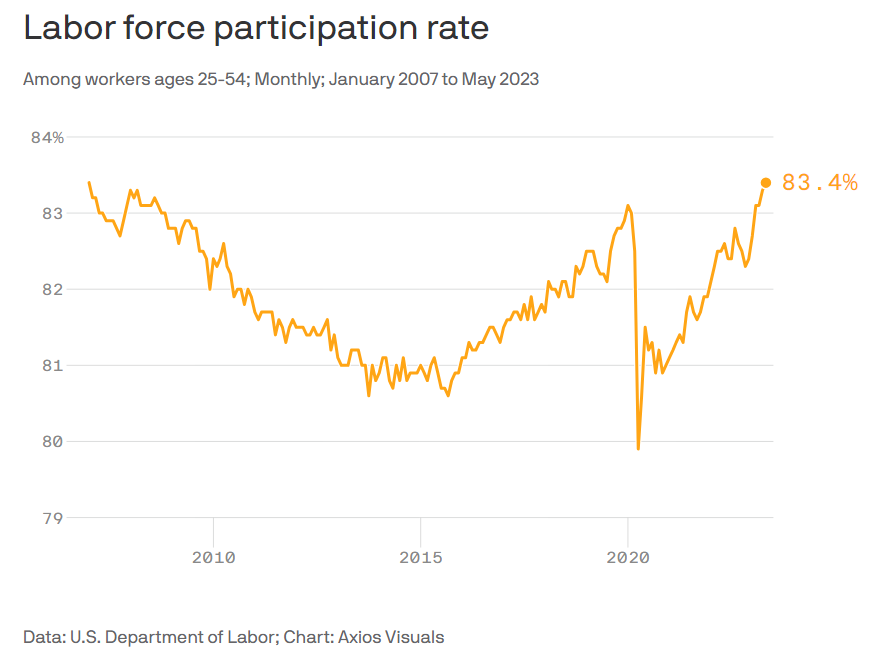
Core age labor force participation has snapped back after the pandemic.

Investment values have doubled.

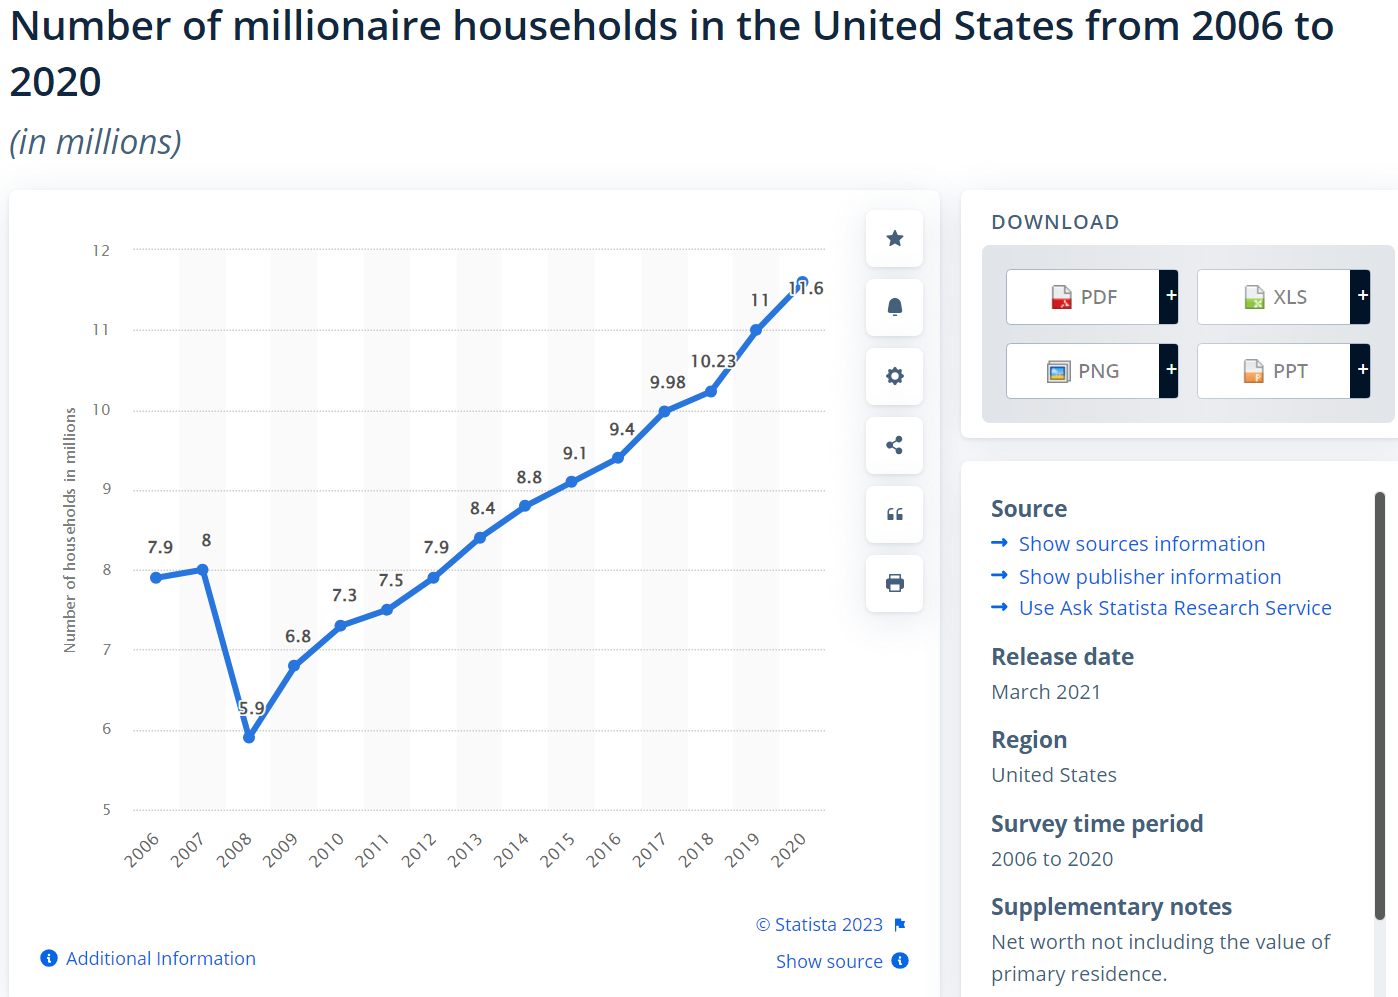
The number of millionaires and billionaires in the US has continued to increase.

Personal savings rates rose from 6% to 9% before the pandemic, shot up and fell back down to just 4% recently.

Housing values have doubled since the Great Recession.

Mortgage rates averaged 4% after the Great Recession, dropped to 3% and then increased to 6%+ as the Federal Reserve raised interest rates.

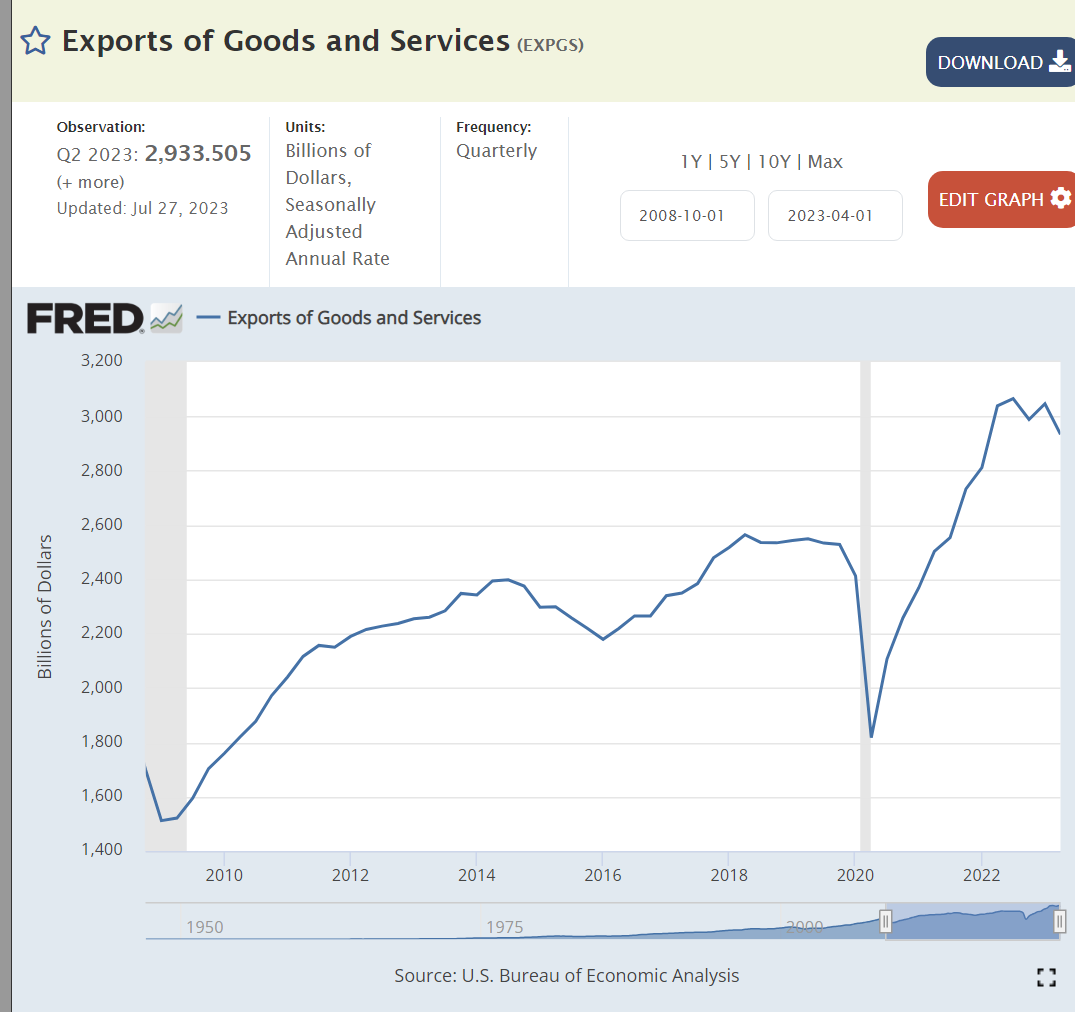
US exports have nearly doubled in 14 years.

Despite the Trump tariffs, which Biden has maintained, imports have also nearly doubled.

Despite historically slower growth rates, higher budget deficits and looser monetary policies, the US dollar is more highly valued today than in 2008.

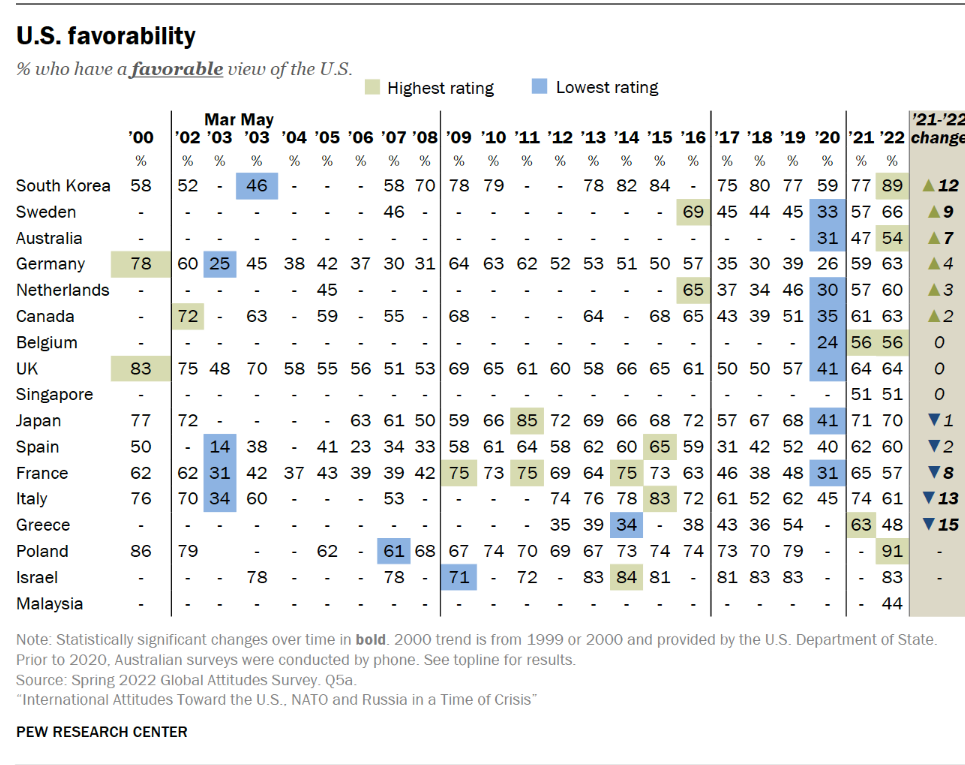
Foreign countries still see the US as a positive ally, despite their concerns during the Trump era.

Obama returned the budget deficit to a “reasonable” 3% by 2016. Trump expanded it to 5% and then 15% as the pandemic struck. Biden drove some recovery to 5% by 2022, but has not driven further reductions.

US coal production is in a long-term decline.

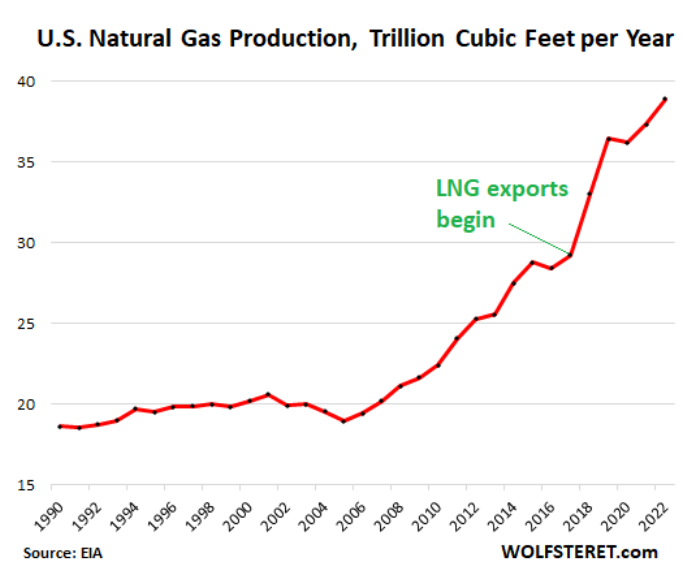
Natural gas production has nearly doubled in 14 years.

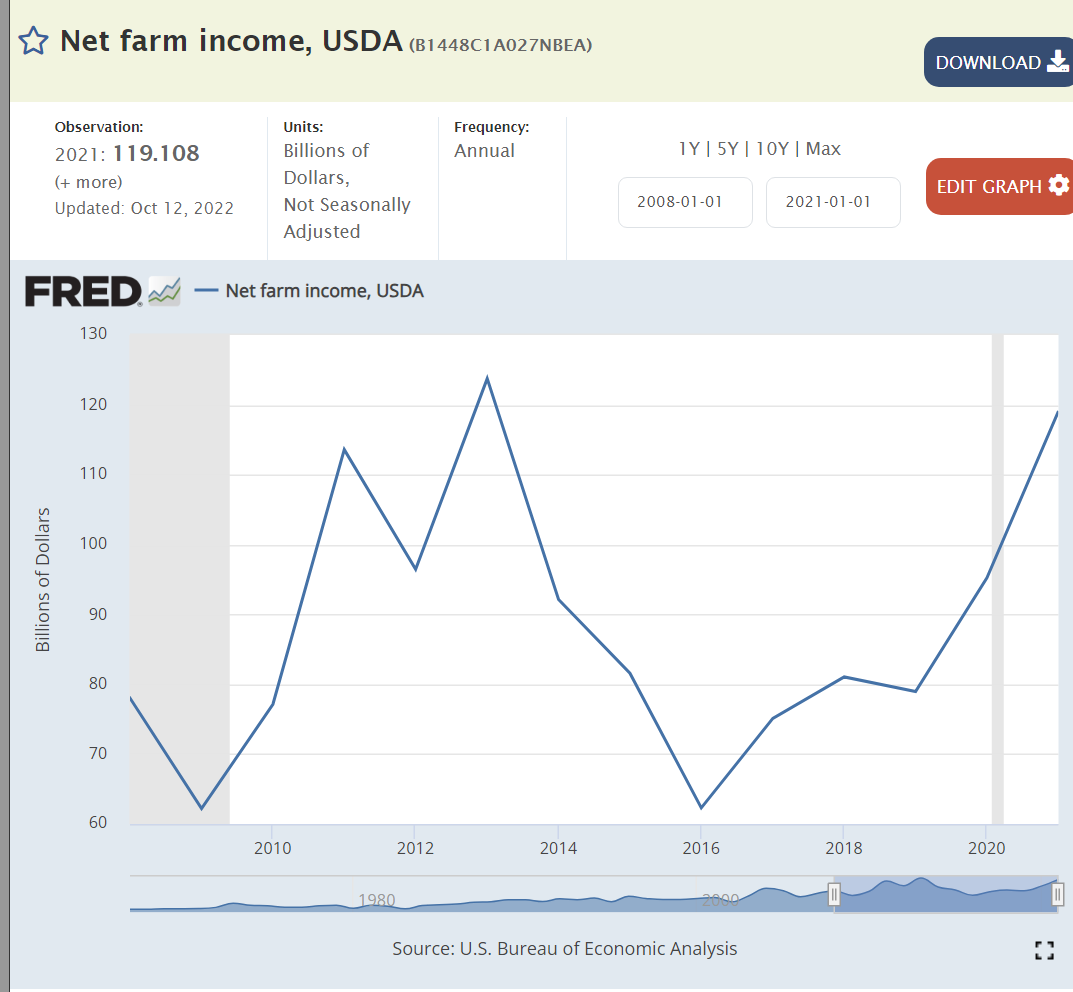
Net farm income has been significantly above the base for 6 of the last 14 years, despite lavish Trump farm subsidies.

Manufacturing employment has continued to rise slowly in the last 14 years against the headwinds of international competition.

It’s difficult to put the pandemic in perspective, but here we see a 2-year reduction in expected lifespans. Opioid deaths and so-called “deaths of despair”, alcohol, drugs, suicide, also play a role.

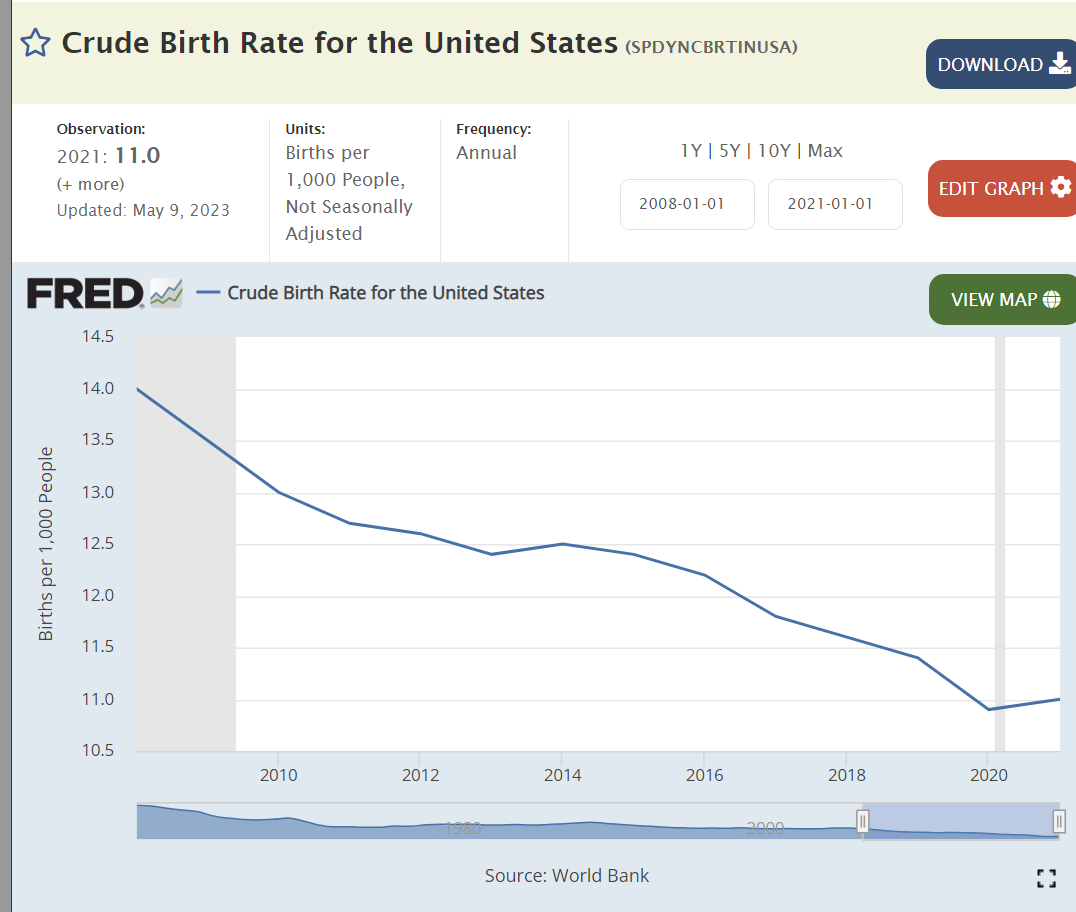
Birth rates continue to drift lower as seen in all regions of the world.

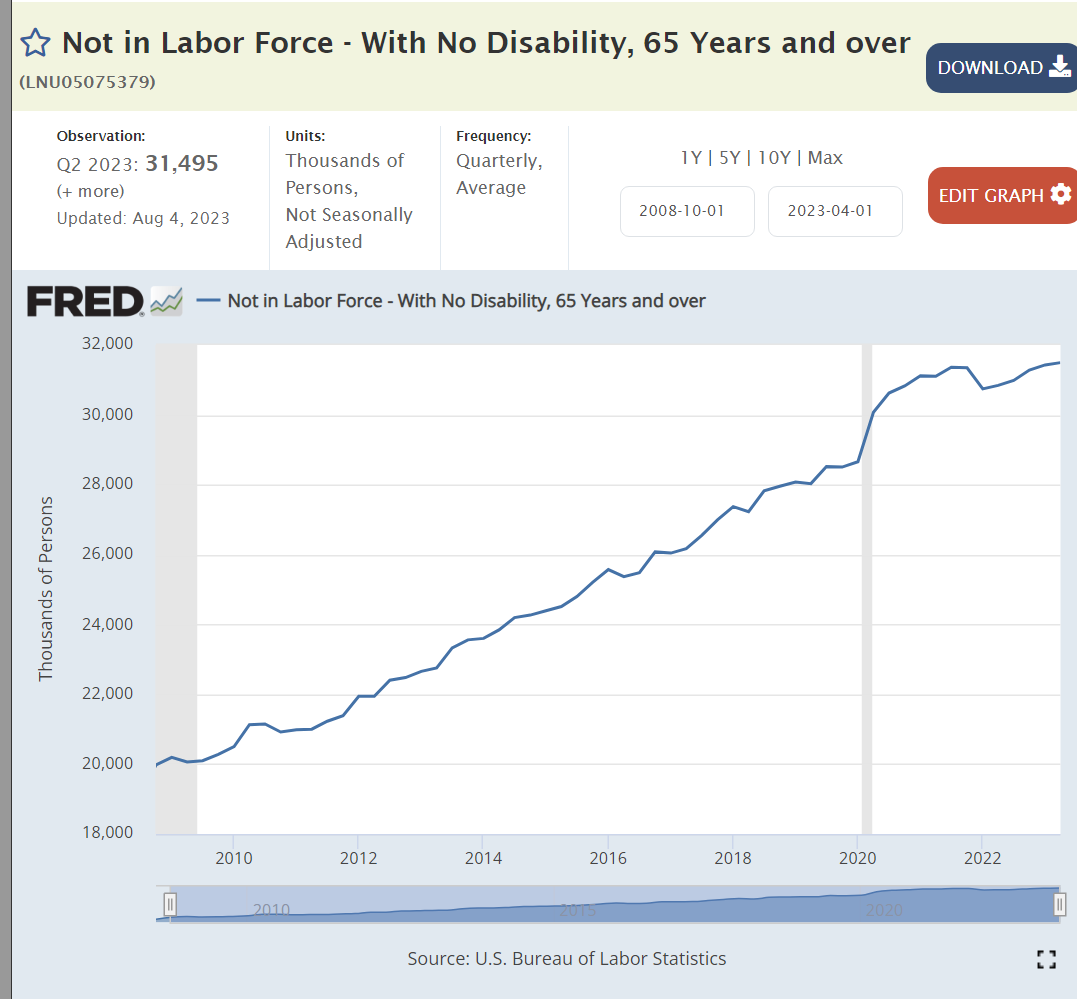
The number of retirees has increased by more than 50%.

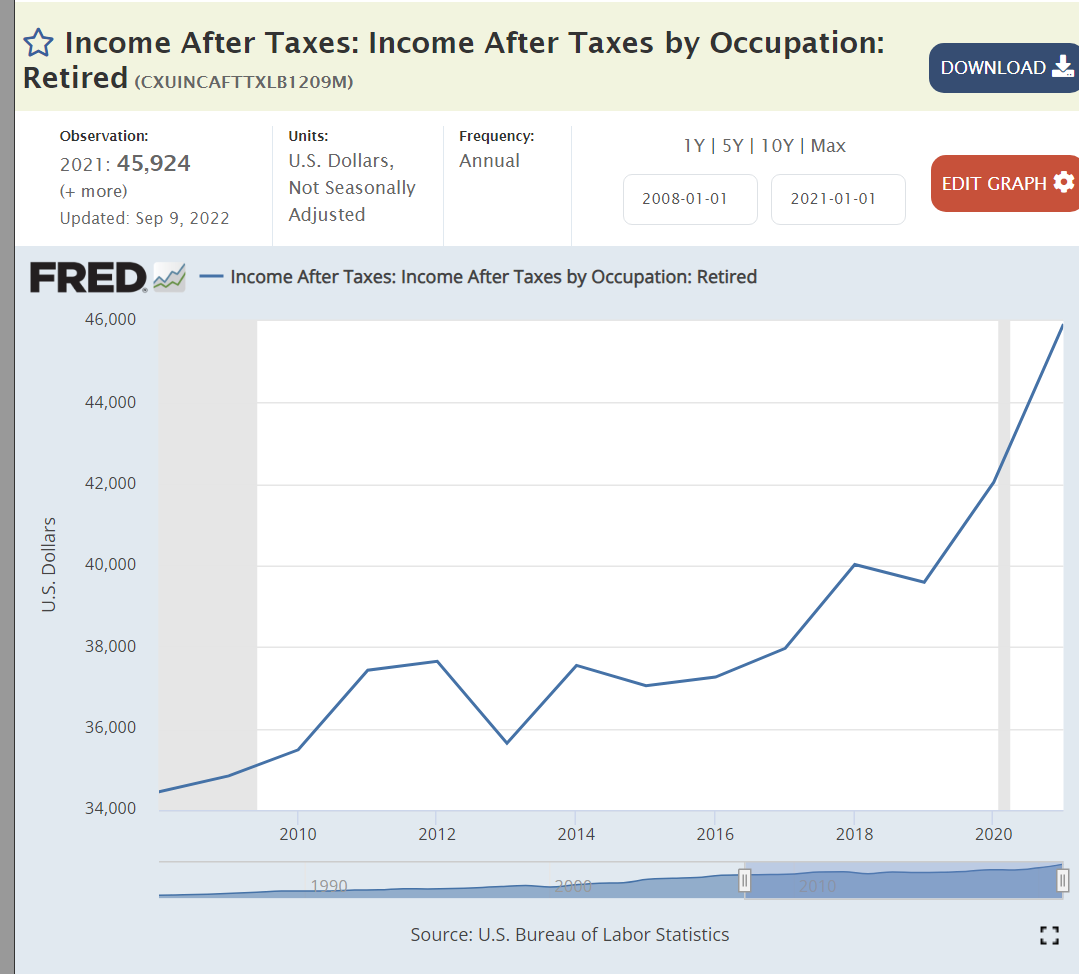
Retiree incomes are up by one-third, matching inflation.

Prospective retirees have doubled their cumulative savings.

The abortion rate has continued to fall in the last 30 years.

Church attendance has dropped from 40% to 30%.

Summary

The US economy recovered slowly after the Great Recession and then very quickly after the pandemic. Real, after inflation, output and per capita output increased. The labor market became very tight. Asset prices (investments and housing) rose for intrinsic and monetary reasons. The US remained a competitive international producer. The federal budget deficit was better at the end of the Obama period but worse for Trump and Biden. The pandemic reduced life expectancy and households had fewer children. Successful retirements grew and will grow. Social trends continue, uninterrupted by political positioning and policies.

Perceptions of the country and the economy are increasingly shaped by partisan political party views. Nonetheless, the US economy continues to grow and thrive.

Good News: Labor Force Participation Recovers from the Pandemic

https://chicago.suntimes.com/2022/6/10/23162642/best-photos-of-the-week-chicago

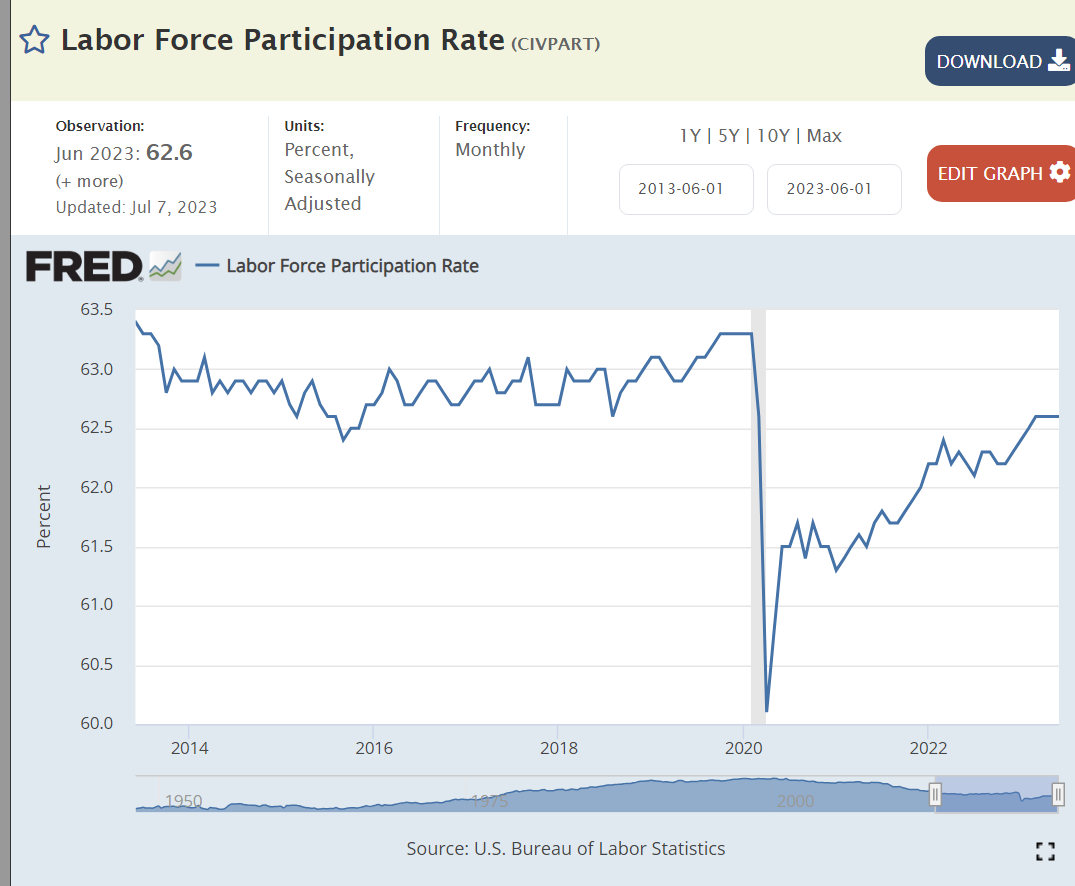
Overall labor force participation rate dropped by 1.5% in the pandemic and has recovered by 1%, still 0.5% below the recent history. However, the prime age category and several market segments no meet or exceed their pre-pandemic levels. Many details to consider.

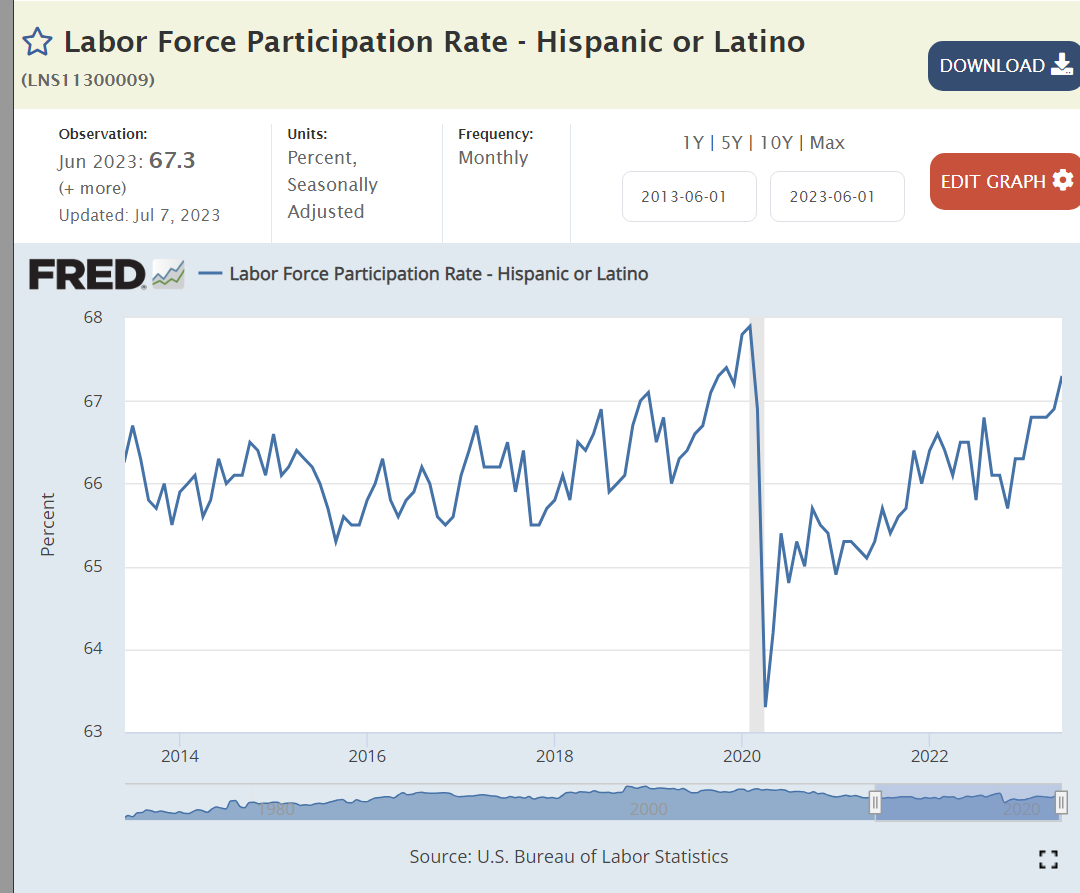
Hispanic participation is now 1% higher than the 2018-19 average before the pandemic.

The Asian participation rate is up 1%.

The Black participation rate is up 0.5%.

The White participation rate dropped by 1.5% and has recovered by half: 0.75% better but 0.75% below history.

The Women’s participation rate has essentially recovered to the 2018-19 average but is a half point lower than the peak levels seen just before the pandemic.

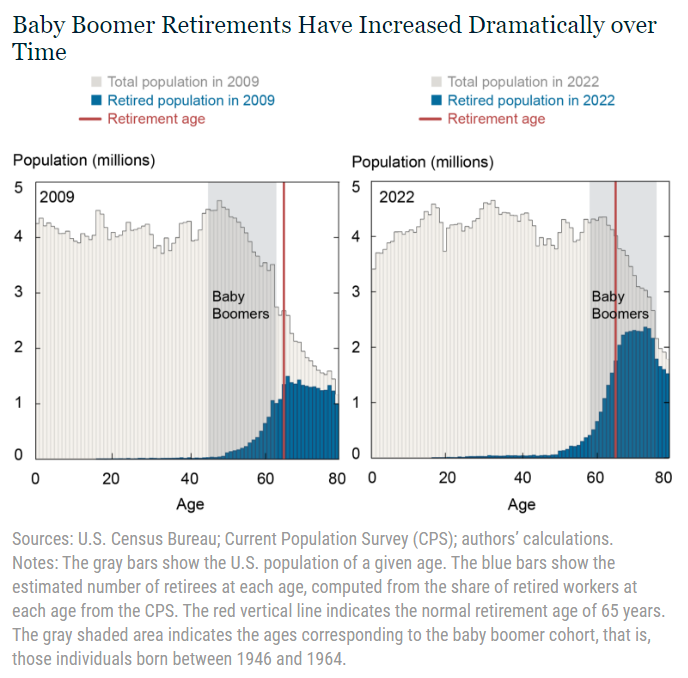
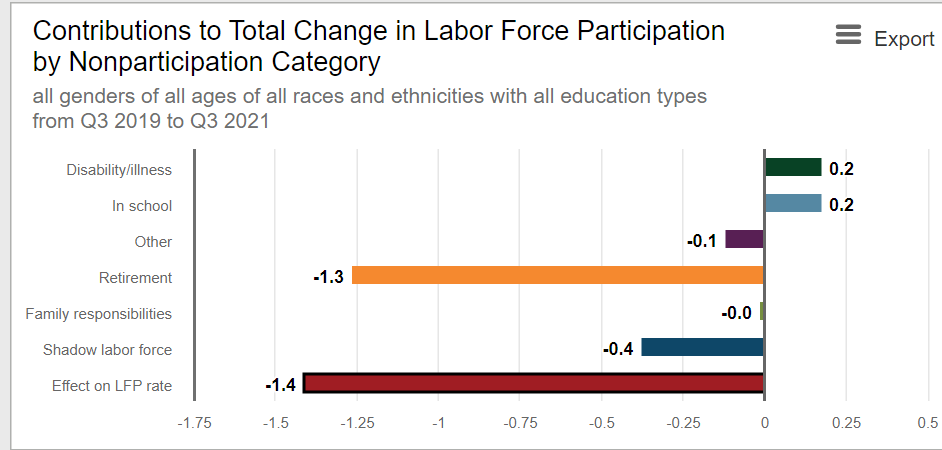
The male participation rate dropped by 1.5% but has only recovered by 0.5%, a major 1% below pre-pandemic times. Part of this is due to the long-term downward trend. Part of this is a “mix variance” driven by the very high number of “baby boomers” moving into normal retirement age or retiring early.

https://www.richmondfed.org/publications/research/econ_focus/2021/q1/district_digest

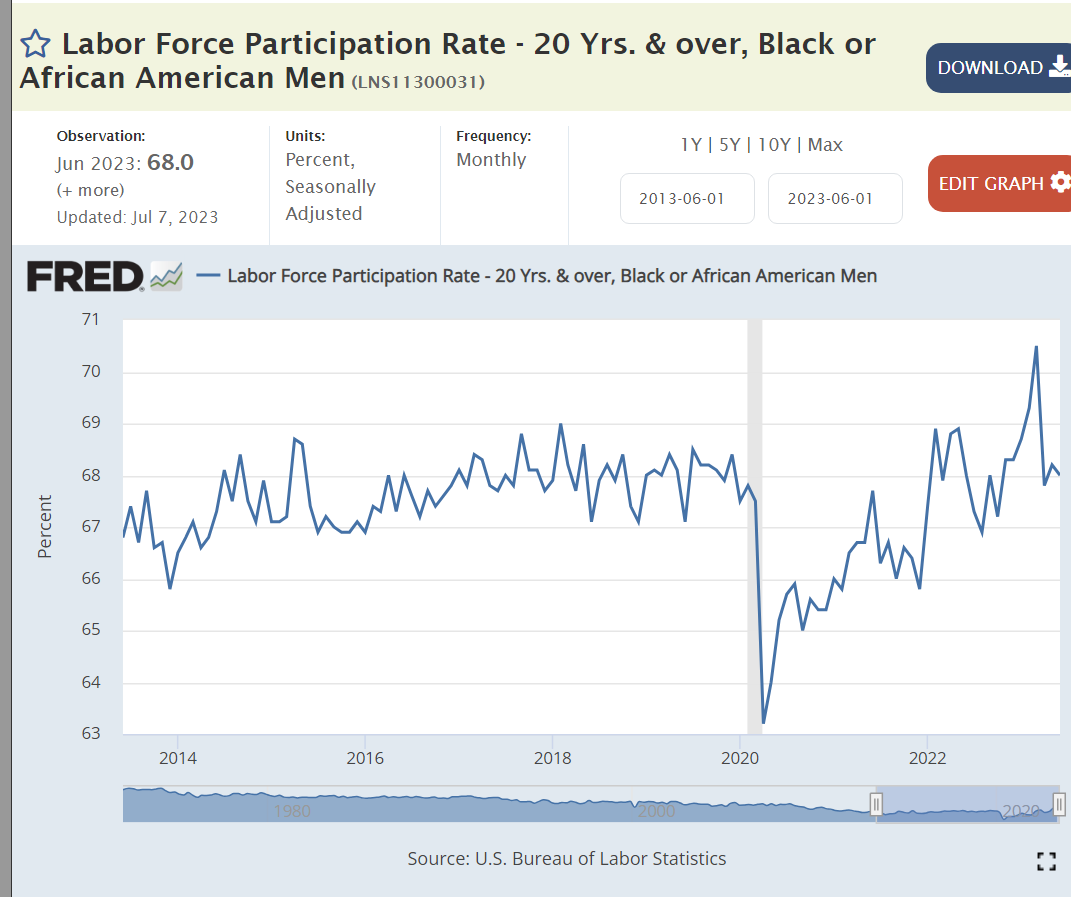
Black men are back to their pre-pandemic participation rate.

Black women are more active labor force participants.

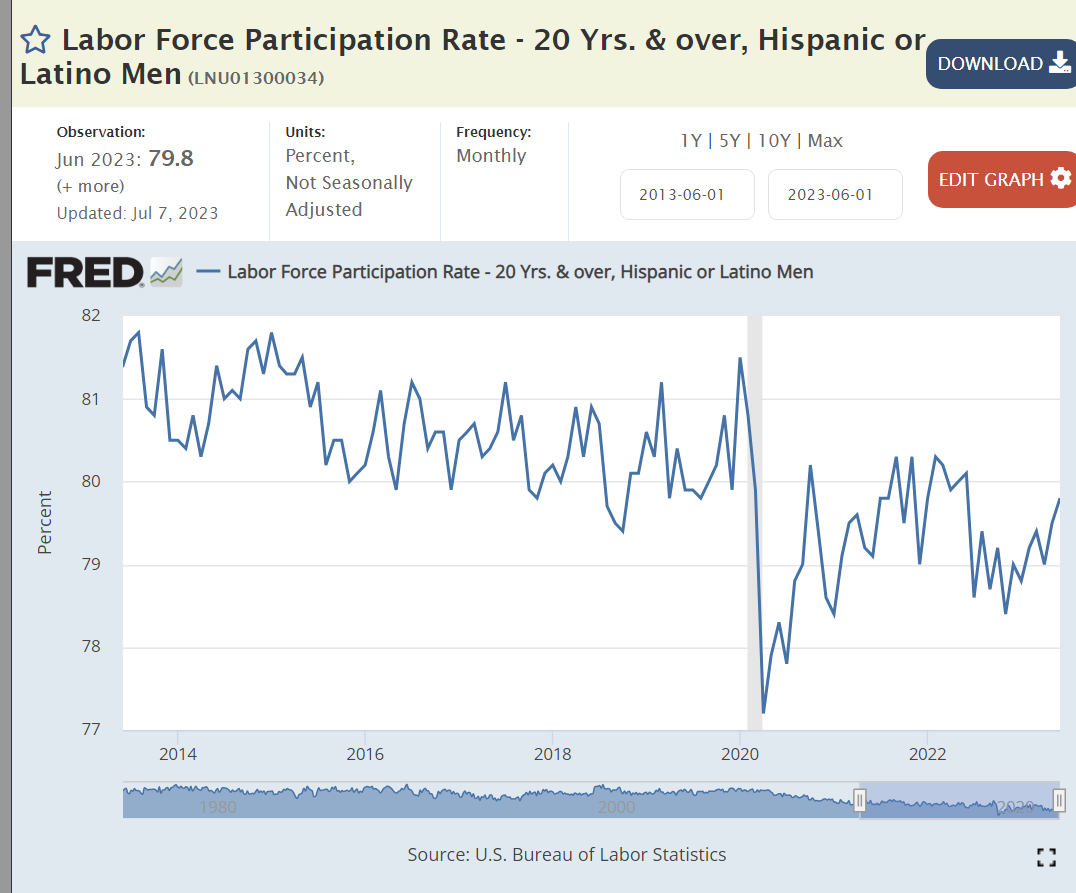
Hispanic men remain 1% below their pre-pandemic labor force participation rate.

Latino women have recovered to their historically high 61% participation ratio.

The White male participation rate dropped by 2% and has not recovered. Again, part is due to the long-run downward trend. Part is the aging of baby boomers into retirement. The remainder appears to be a response to the pandemic experience. “I’m not working unless you make it worth my while.”

White women remain a little below their 2018-19 average and three-quarters of a point behind their pre-pandemic peak level.

Teenage work participation has increased by 1.5% as entry level wages have risen.

College grad age participation rate has mostly recovered but remains 1% below the pre-pandemic high.

The retirement age workforce reduced its participation rate by 1.5% and has stayed there after a brief pseudo-recovery.

https://www.whitehouse.gov/cea/written-materials/2023/04/17/the-labor-supply-rebound-from-the-pandemic/

The prime age work force is now above even the elevated pre-pandemic level and a full one percent above the 2018-19 average. This is very good news, reflecting a strong economy an labor market.

Prime aged men have returned to the workforce.

Prime aged women are the “rock stars”, increasing their participation by 2% from 2019.

Brookings has combined all of the race and age data. Major declines for white men in all 3 age groups and for white women aged 65+. Major improvements for prime age white, black and other women and for prime age black men.

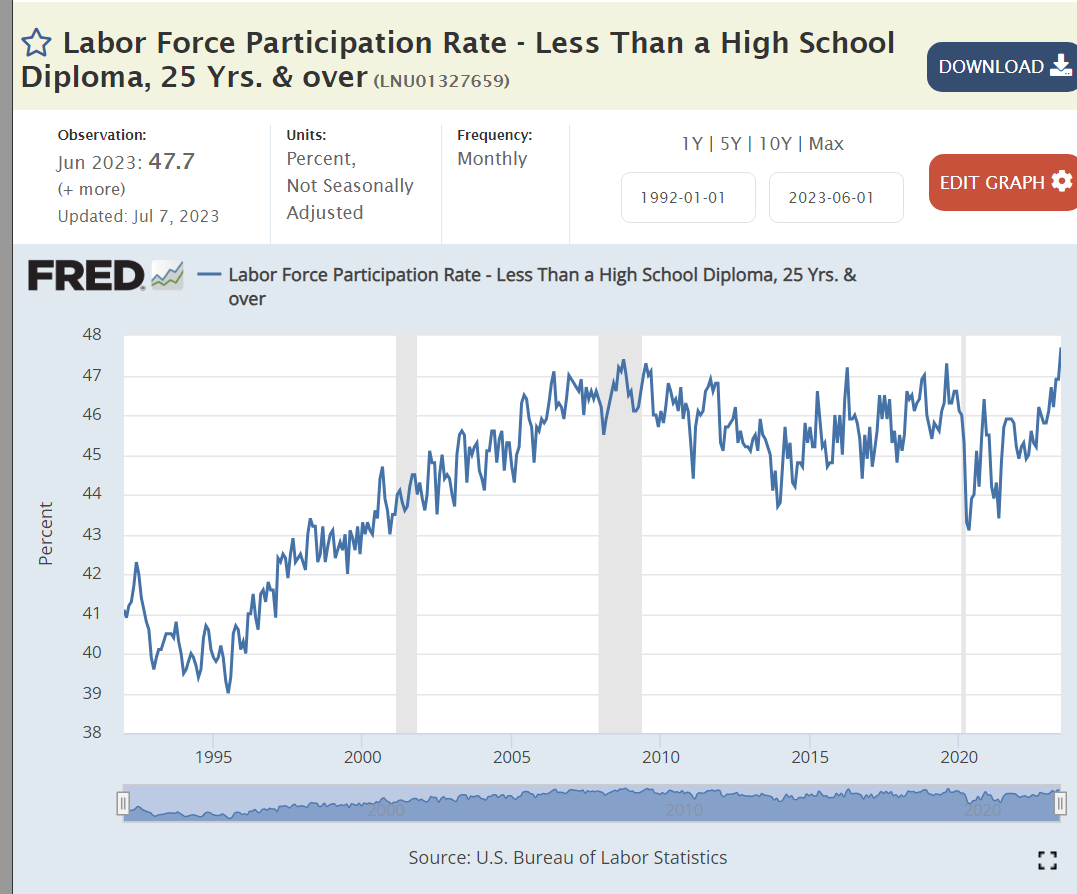
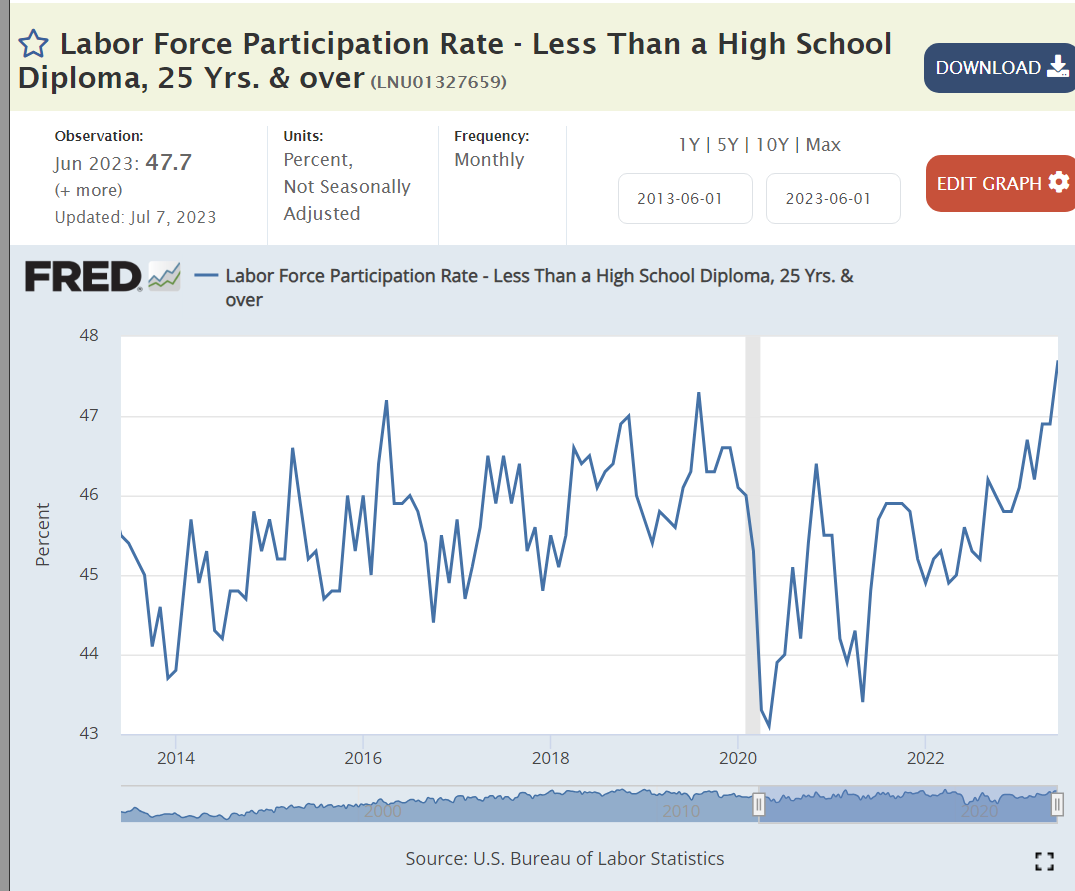
Non- high school graduates have added 1% to their labor force participation as real wages have increased.

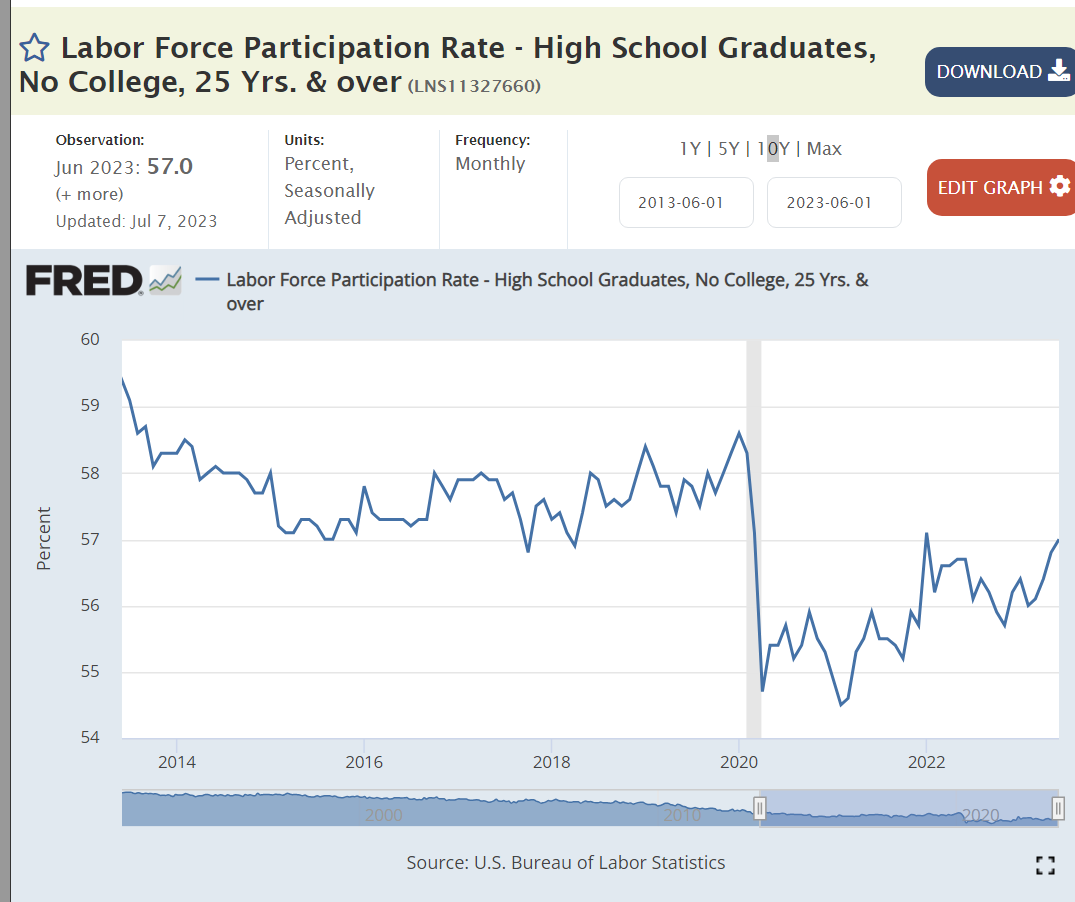
High school graduate participation dropped by three points before recovering by two points.

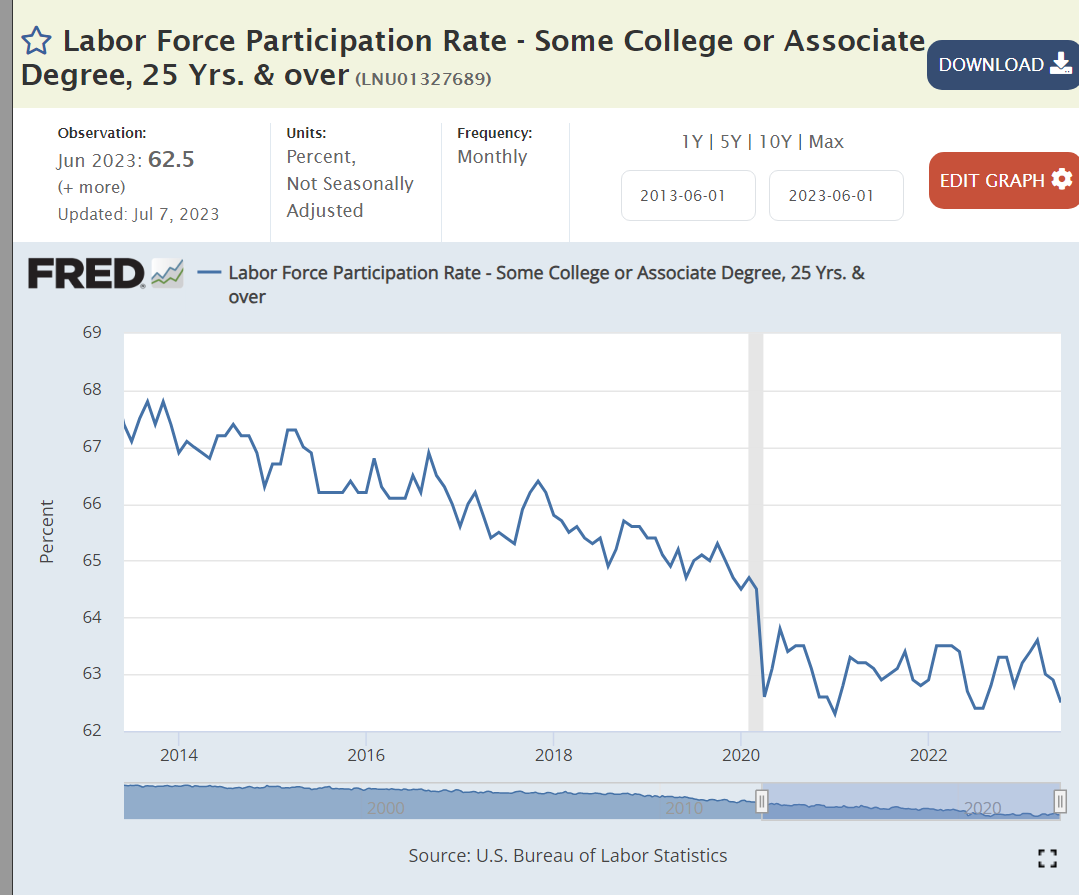
Individuals with some post-high school education, but not a bachelor’s degree, are in the middle range of US educational attainment. Their labor force participation rate had declined by almost 3 points in the 6 years before the pandemic, dropped by another 2 points during the pandemic and has not “recovered”.

Labor force participation by bachelor’s degree holders was stable before the pandemic, then dropped by 2 points and has since recovered by a little more than 1 point, remaining about one-half point below the prior average.

Individuals with a high school degree or higher have displayed drops of 10 points in labor force participation across the last 30 years. Most of this change is due to the “mix variance” of lower participation by an increasingly older and retired population, but some reflects other causes.

https://www.census.gov/library/stories/2021/06/why-did-labor-force-participation-rate-decline-when-economy-was-good.html

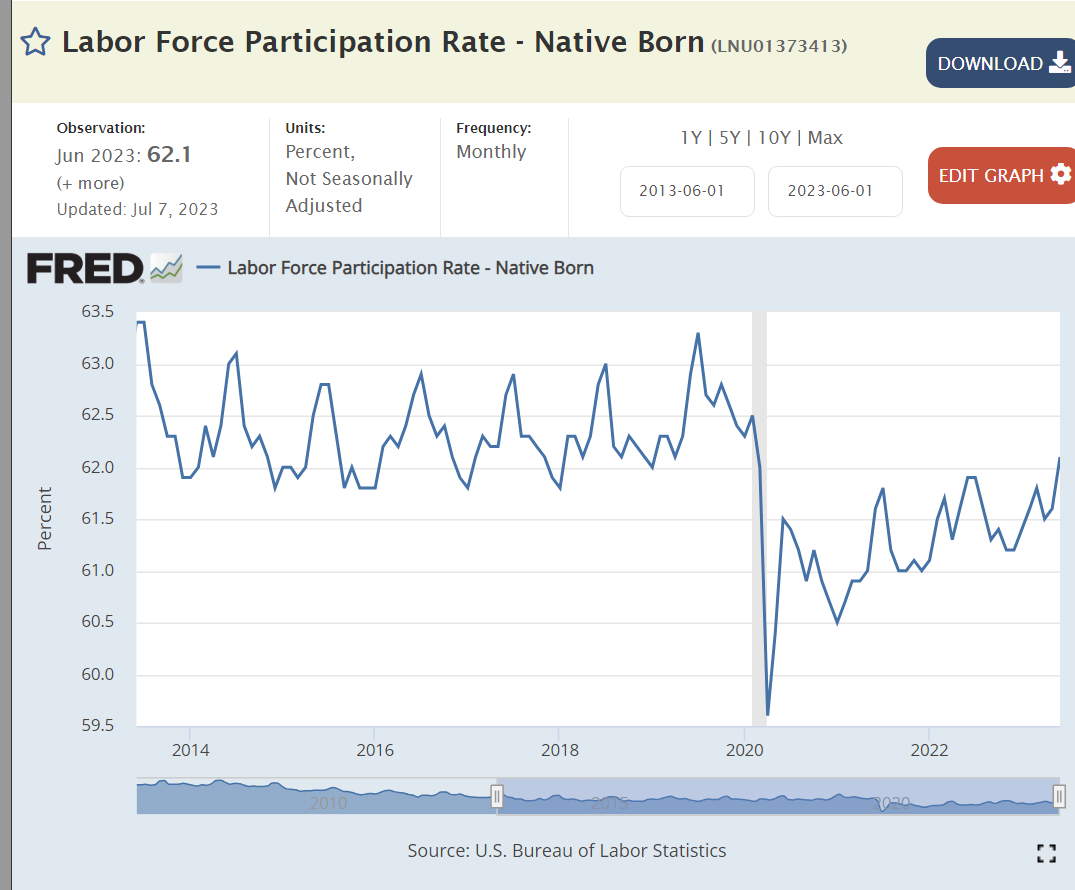
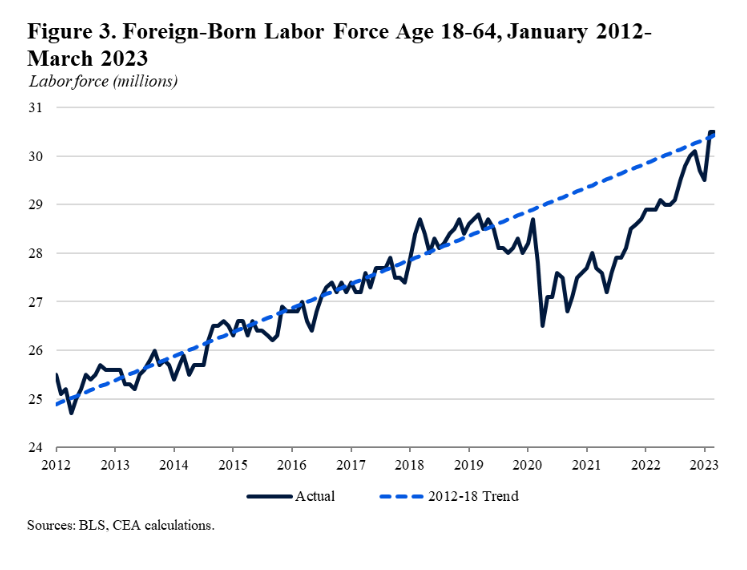
Foreign born members of the US labor force have fully “returned to work” after the pandemic.

https://www.whitehouse.gov/cea/written-materials/2023/04/17/the-labor-supply-rebound-from-the-pandemic/

This participation growth improvement has taken place as the foreign-born population has increased to its trend growth rate.

https://www.ers.usda.gov/topics/rural-economy-population/employment-education/rural-employment-and-unemployment/

https://www.ers.usda.gov/data-products/chart-gallery/gallery/chart-detail/?chartId=103862

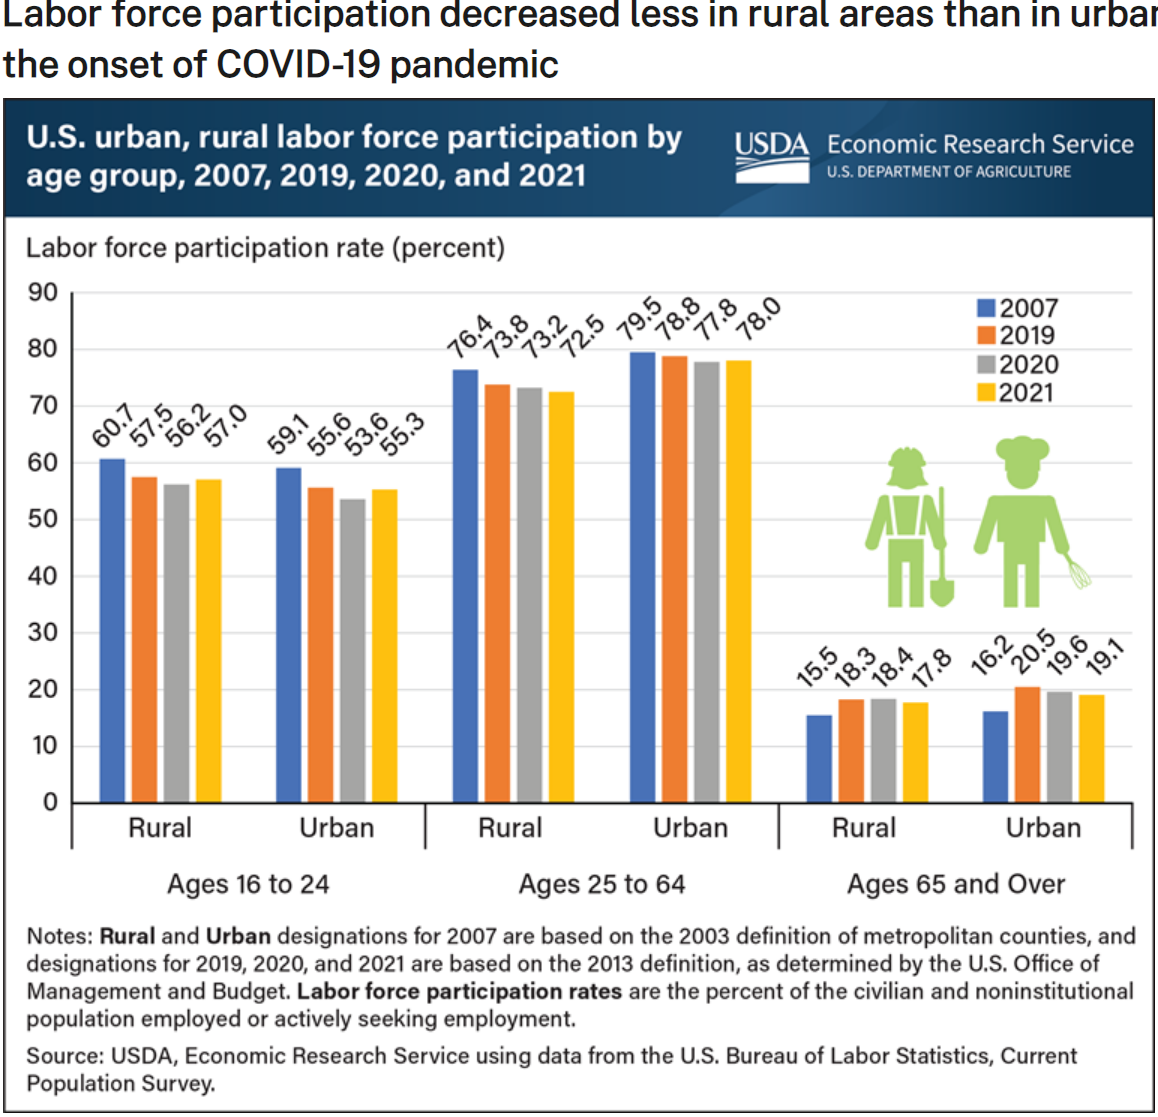
In general, rural labor markets have grown more slowly in the last 15 years and shown greater reductions in labor force participation. Some of the increased labor force participation in the last 2 years may reflect a recovery from these declines.

https://www.bostonfed.org/publications/new-england-economic-conditions/2023/april.aspx

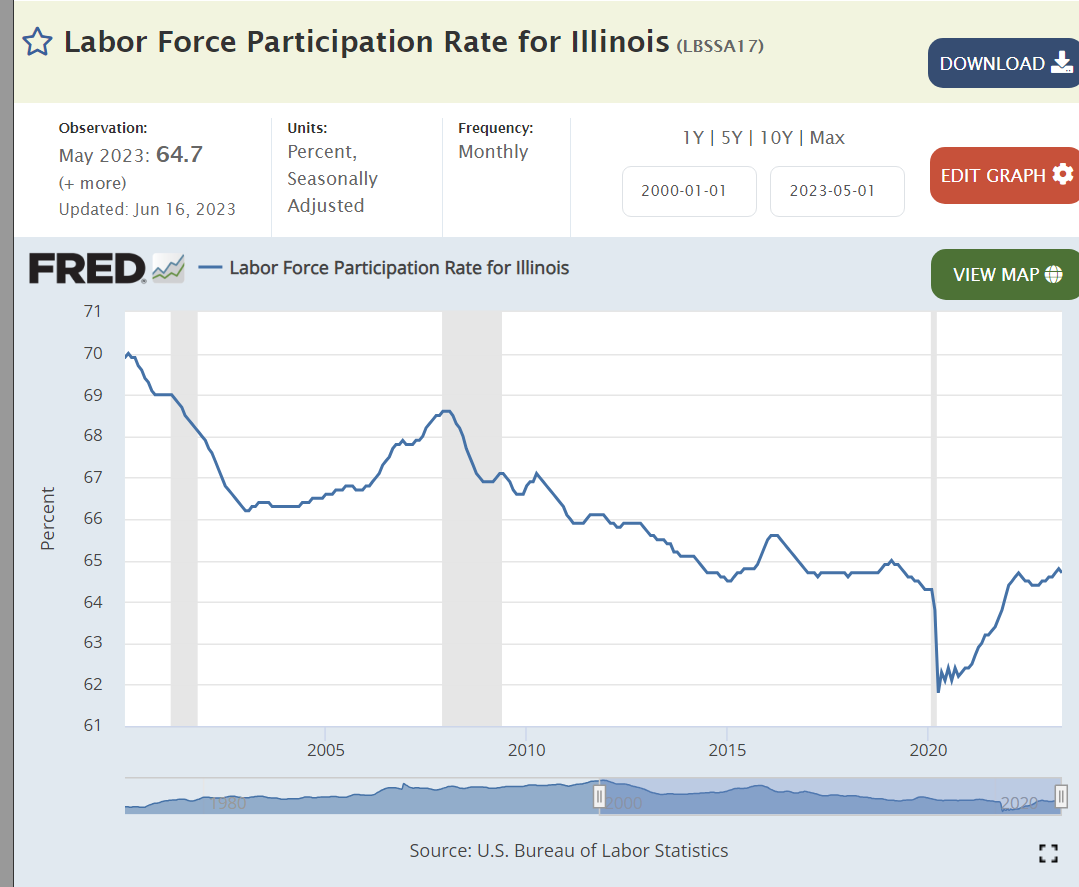
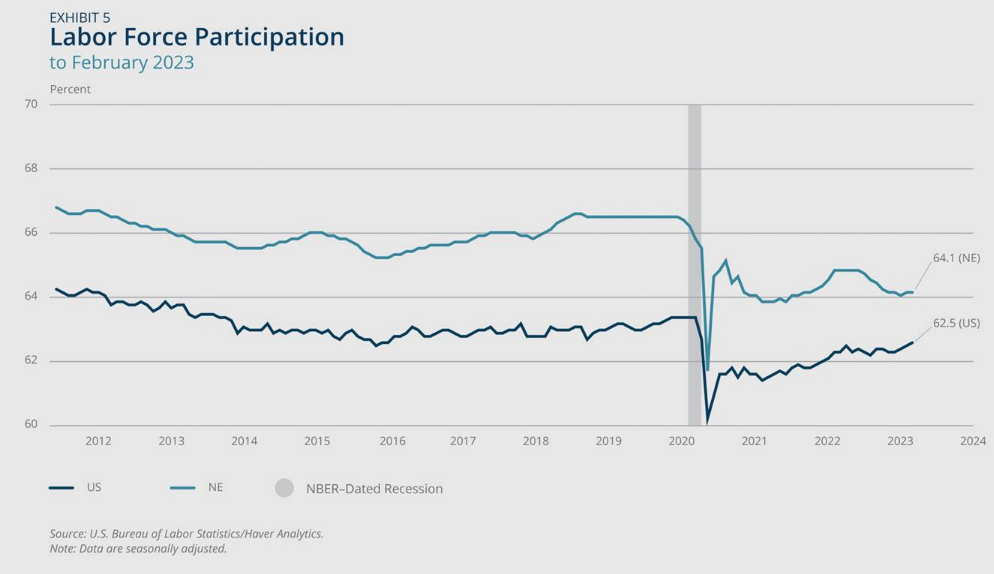
Most states show a similar pattern of labor force participation in the years before the pandemic, declining by 2-4% and afterwards recovering to their pre-pandemic level. California’s recovery has been slower. The New England states had an unusual increase in labor force participation before the pandemic and have not seen a major recovery after the pandemic.

Summary

Several sources decry the decline in the number of workers and the labor force participation rate, noting that it holds back the economic recovery and taints the 3.5% unemployment rate.

https://www.forbes.com/sites/qai/2023/01/25/unemployment-is-low-but-so-is-the-labor-force-participation-rate—whats-going-on-in-the-us-labor-market/?sh=72f0035b244e

https://www.gspublishing.com/content/research/en/reports/2021/11/12/4f72d573-c573-4c4b-8812-1d32ce3b973e.html

https://www.uschamber.com/workforce/understanding-americas-labor-shortage

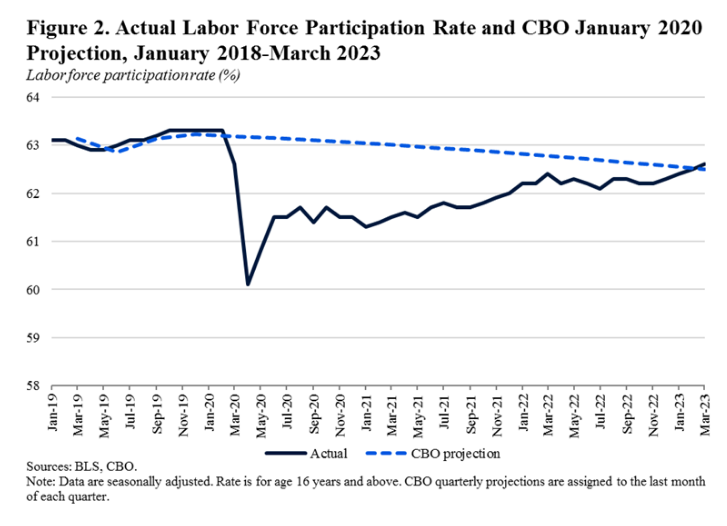
Other sources point to the long-term downward trends in participation as the biggest factor, mostly driven by an aging workforce and recent higher than normal retirement rates. Pre-pandemic forecasts showed a one-half point decline in participation, matching the actual 2023 data. Detailed analysis shows that the age adjusted participation rate is a little higher. The core group, aged 25-54 population, also shows labor force participation recovery to relatively high pre-pandemic levels. So … there are demographic, racial, education, birth country, rural/urban, location and state differences in participation. There are opportunities for higher participation in a strong economy and labor market. However, the recovery from the pandemic is complete, reflecting this strong economy and labor market.

https://www.whitehouse.gov/cea/written-materials/2023/04/17/the-labor-supply-rebound-from-the-pandemic/

https://www.axios.com/2023/06/02/jobs-report-workers-prime-age-labor-force-participation

https://www.atlantafed.org/chcs/labor-force-participation-dynamics

One Page: Why We’re Polarized – Klein (2020)

Trump’s 2016 election win was unremarkable statistically. He won the usual share of Republican voters in most demographic sectors and attracted extra non-college graduate white voters. Our political system has built an increasingly polarized electorate based on appeals to identity politics (red versus blue). We vote for our team or against the “other” team, setting aside our other concerns.

Both political parties contained liberals, conservatives and moderates in the 1950’s. The Civil Rights and Voting Rights Acts of the 1960’s broke the Democrats’ grip on the “solid South”. Regional, local, character, ideology and other factors mattered more to voters, politicians and parties through the 1990’s. By 2016 even self-identified independents were polarized, views of the “other” party dropped from 45 to 29 degrees and 43% of partisans saw their opponents as a “threat to the nation’s well-being”.

Voters and political parties are increasingly aligned by a single conservative to liberal dimension, with other dimensions of identity running in parallel: race, religion, region, urban/rural, and gender. This builds on the personality trait of openness, fluidity, and tolerance of threats.

Individuals are inherently attracted to group membership, like sports teams and easily oppose other teams and seek to win. As the two major political parties began to clearly sort on the “left versus right” dimension by the 1980’s wise political actors clarified the differences between the two parties in extreme terms. Political messaging is simpler, more extreme and more effective in this environment. Group identity and membership trumps facts, science, beliefs, thinking, policies, and detailed ideologies.

Rational individuals outsource politics to parties and politicians. Individuals adjust their views to match the views of the parties and politicians. More politically engaged individuals are more easily influenced. Higher knowledge and skilled individuals use their talents to challenge the opposition but not their own party’s views.

The decline of cultural and political power held by White Christians due to demographic changes has encouraged conservatives to emphasize traditional values and liberals to emphasize diversity. President Obama’s presidency punctured the “post-racial myth”, as the country became much more divided on racial issues. The cultural power of media, university and corporate elites and institutions threatens some conservatives while increasing Republican political power and actions threaten some liberals.

Modern journalists and media compete for attention. They are biased towards “loud, outrageous, colorful, inspirational and confrontational”. They reinforce the cycles of polarization, mostly leaving behind historical norms of objectivity and balance. More information and choices have not helped media consumers to better evaluate parties, politicians, messages or issues.

Polarized voters and media outlets have combined to make elections be based on national parties and wedge issues. Political candidates focus on these issues and raise more money from small donors, independent of the wishes and interests of political parties which tend to be more moderate, optimizing their chances of winning competitive districts. Gerrymandering, rural/urban political sorting, direct primaries and fundraising have undercut the power of political parties.

A polarized country, roughly evenly split politically, leads political actors to focus more than ever on “winning”, decreasing the role of norms, tradition, civility, pragmatism, patriotism and institutional preservation. The emphasis on national issues reduces the incentive and scope for transactional, local based politics, log-rolling, earmarks, and compromise. By 2012 the radicalization of the Republican Party was complete with Democrats not far behind. Klein uses former Attorney General William Barr’s words to highlight the increasingly expressed Republican view that they are fighting a war to preserve their culture from extinction by the secular elites of the other party. He doesn’t describe the coastal Democrats complementary view of a Trump-led nation.

Solutions

Agree to move some issues beyond politics: debt ceiling approval, longer-term budget program approval. Improve political system legitimacy: cut bias of electoral college overrepresenting rural voters through changes or the Popular Vote Compact. Use independent commissions to draw election districts. Eliminate the Senate filibuster. Award DC and Puerto Rico congressional representation. Consider a multi-party-political system and multiple seat districts and ranked choice voting. Increase the size of Supreme Court and make some appointments outside of politics. Reduce the Speaker of the House’s total control of the legislative agenda. Make everyone aware of their “political identity” and how media and politicians use this to persuade or control. Proactively choose, evaluate and challenge media sources. Invest time in politics, especially state and local politics.

We Need a More Legitimate US Senate

https://kids.britannica.com/students/article/13-colonies/338325

The alliance of 13 independent states to become the United States of America enshrined the notion of “minority representation” in the US constitution. North versus South. Different religious majorities. Rural versus urban. Domestic versus international leaning. Free versus Slave.

We should embrace that principle but fine-tune the mechanism. Two senators per state when the population was just 3 million was a practical compromise. The US population reached 300 million in 2006; 100 times larger. The numerical and proportional differences today are simply too large to ignore. Louisiana and Kentucky at 4.6 million people are the median states. The average state population is 6.6 million today. 5 states, SD, ND, AL, VT and WY have less than 1 million citizens. They get 5 to 7 times more representation than the “typical” state. I recommend that we accept this difference as a way to preserve “minority representation” and the legitimacy of our democratic system.

On the top side, four states stand out. California (39M), Texas (30M), Florida (22M) and New York (20M) have populations 5-8 times the median and 3-6 times the average population. [For perspective, note that California’s population today is 13 times as large as the whole country in 1780.] I recommend that these four states be given 2 extra Senators since they have more than 4 times the median state population. Seven states have populations more than twice as large as the median 9M: PA, IL, OH, GA, NC, MI and NJ. I recommend they each get an additional Senator. [California (19x), Texas (15x), Florida (11x) and New York (10x) after these changes are still less represented than the dozen states with populations of just one million, rounded; just not so disproportionately.]

This change would add 15 Senators. It would dilute the “minority representation” of the other 39 states by 15%.

Fortunately, the political impact of this change would be modest, so both parties can support this improvement in political legitimacy. CA and NY are Democratic locks, while Texas and Florida are Republican locks. Illinois and New Jersey are Democratic locks, while Ohio is a Republican lock. Pennsylvania and Michigan lean left, while Georgia and North Carolina lean right. Net, net this change adds one Democratic Senator out of the new 115 seats, an immaterial number.

The Senate is a very important part of our government. It acts as a check on the more representative and responsive House. It approves treaties, constitutional amendments, judges and presidential appointments. The number of Senators drives the size of the electoral college. Changes should not be made without due consideration.

My Republican colleagues might reject this “out of hand” because it costs them a Senate seat today and it reduces the future leverage of less populated states. I think that the legitimacy of our government, to prevent populist winners and civil war is reason enough to “fine tune” our system. Republican oriented Texas and Florida are growing faster than California and New York, so their citizens are the most “disenfranchised” by the current system in the future. A revision might block the pressure to admit DC and PR as states. Four of the five next least populous states are likely Democratic states in the future: DE, RI, ME, NH versus MT, which has some Democratic voting potential. The next, Hawaii, is a Democratic lock. In the next five, KS, NE and WV are safe Republican seats, but Idaho and New Mexico could follow Colorado and Nevada into the other party’s column.

It’s time for all Americans to step out of their partisan comfort zones and think about what is best for the country in the long-term. This is a reasonable change that everyone should support.

https://www.statsamerica.org/sip/rank_list.aspx?rank_label=pop1

https://www.theatlantic.com/ideas/archive/2019/01/heres-how-fix-senate/579172/

https://www.washingtonpost.com/news/politics/wp/2017/11/28/by-2040-two-thirds-of-americans-will-be-represented-by-30-percent-of-the-senate/

https://www.vox.com/2020/11/6/21550979/senate-malapportionment-20-million-democrats-republicans-supreme-court

https://www.cnn.com/2018/07/10/politics/small-states-supreme-court/index.html

https://www.vox.com/mischiefs-of-faction/2019/4/9/18300749/senate-problem-electoral-college