I grew up in Greater Cleveland as a proud buckeye in “the best location in the nation” 1956 – 74. Learned about demography in my first 1974 quarter at New College in Sarasota from Dr. Peter Hruschka. Transferred to Indy in 1988. Remained ever since. Slowly became a “Hoosier”. Started documenting the Hoosier population in 2009, including the exceptional growth of our suburban Hamilton County.
The urban counties have tripled in growth. The others remain flat.
Rural America was behind in 1960. It was much further behind in 1980. The gap has continued to grow. This has huge political implications. George Wallace, Spiro Agnew and Richard Nixon deeply understood this in 1968. Not sure my Democratic party has yet caught on.
Hamilton County’s 357,000 residents are a little more than 0.1% of the 332 million national citizens (1/1,000). It’s typical 80 National Merit Semifinalists are 0.5% of the 16,000 national total (1/200). It produces 5 times more than its “fair share”.
The 13 lowest population states range from 0.6 to 1.8 million citizens, averaging 1 million. Hamilton County has one-third as many citizens, on average.
Public Sheridan HS awards some NMS semifinalists. Hamilton County has a large number of students at private schools that do not report NMS semifinalists by their place of residence. University, Park Tudor, Heritage Christian, Cathedral, Roncalli and Guerin. I estimate that there are another 3-5 Hamilton County winners each year.
Hamilton County students benefit from their abilities, parental and neighbor involvement, high expectations, extracurricular opportunities and strong school systems.
Typical annual National Merit Scholarship Semifinalists:
In 1970, Hamilton County was home to just 55,000 people. It has grown 6-fold since then to more than 330,000. One percent of the nation’s 3,143 counties have experienced similar growth in this 50-year period. These 32 counties combined have grown more than 5-fold from 2.2M (1.1% of US) in 1970 to 11.8M (3.6% of US) in 2020.
8 of the counties are Sunbelt retirement areas. 4 are smaller urban areas. 20 are suburban/exurban counties within larger metropolitan areas.
Each county remains fast growing, issuing an average of 5,000 building permits in 2022 versus an average of 500 per county nationally. Hamilton County’s 5,800 permits is above average.
As a group the counties average 16% of residents aged 65+, ranging from 11% to 25-29% in retirement counties. Hamilton County’s 14% makes it a little younger than the national average of 17%.
The percentage of adults working averages 66% versus 64% for the US as a whole, ranging from 48-54% in retirement communities up to 74%. Hamilton County’s 71% ties for second place.
Median household income at $85,000 for this group is 13% higher than the national average. Hamilton County’s $115,000 is sixth highest. 5 of the retirement counties average less than $70,000. Loudon County records a stunning $170,000.
Poverty rates are the mirror image, at 9% for the group versus 12% nationally. Rates range from 3-16%. Four retirement areas have poverty rates above the national average. Hamilton County’s 4% is tied for second lowest.
The group records 38% of adults with college degrees versus 34% for the nation. 7 retirement counties and Henry County south of Atlanta report 28% or less. Hamilton County’s 61% is second to Loudon County’s 64%.
Average home values are $345,000 for this subset, a solid 22% higher than the $282,000 national average. 10 counties reported prices below the national average, 5 in retirement areas, 4 in suburban counties and Bentonville, AR. 4 suburban counties listed their median home prices above $600K: DC, Sacramento, Nashville and Denver. Hamilton County’s $351,000 was average for the high growth group.
The group averaged 68% non-Hispanic White versus 59% for the nation as a whole. 4 counties had more minorities than non-Hispanic Whites: Ocala, FL, Henry/Atlanta, Prince William/DC and Brazoria/Houston. St. Charles County in the St. Louis Metro area had the highest non-Hispanic White share at 85%. Hamilton County’s 81% was 6th highest.
These 32 counties averaged 10% foreign born, much below the 14% national average. St. Charles County recorded only 3% foreign born. 5 counties reported 20% or higher foreign born: Forsyth/Atlanta, Ocala and Naples, FL, and Loudon and Prince William/DC. Hamilton County’s 9% is a little below the group average.
Summary
Hamilton County is one of 32 counties that have recorded tremendous growth across 50 years. It is relatively young and less diverse than most. It has higher incomes and average housing costs compared with its peers.
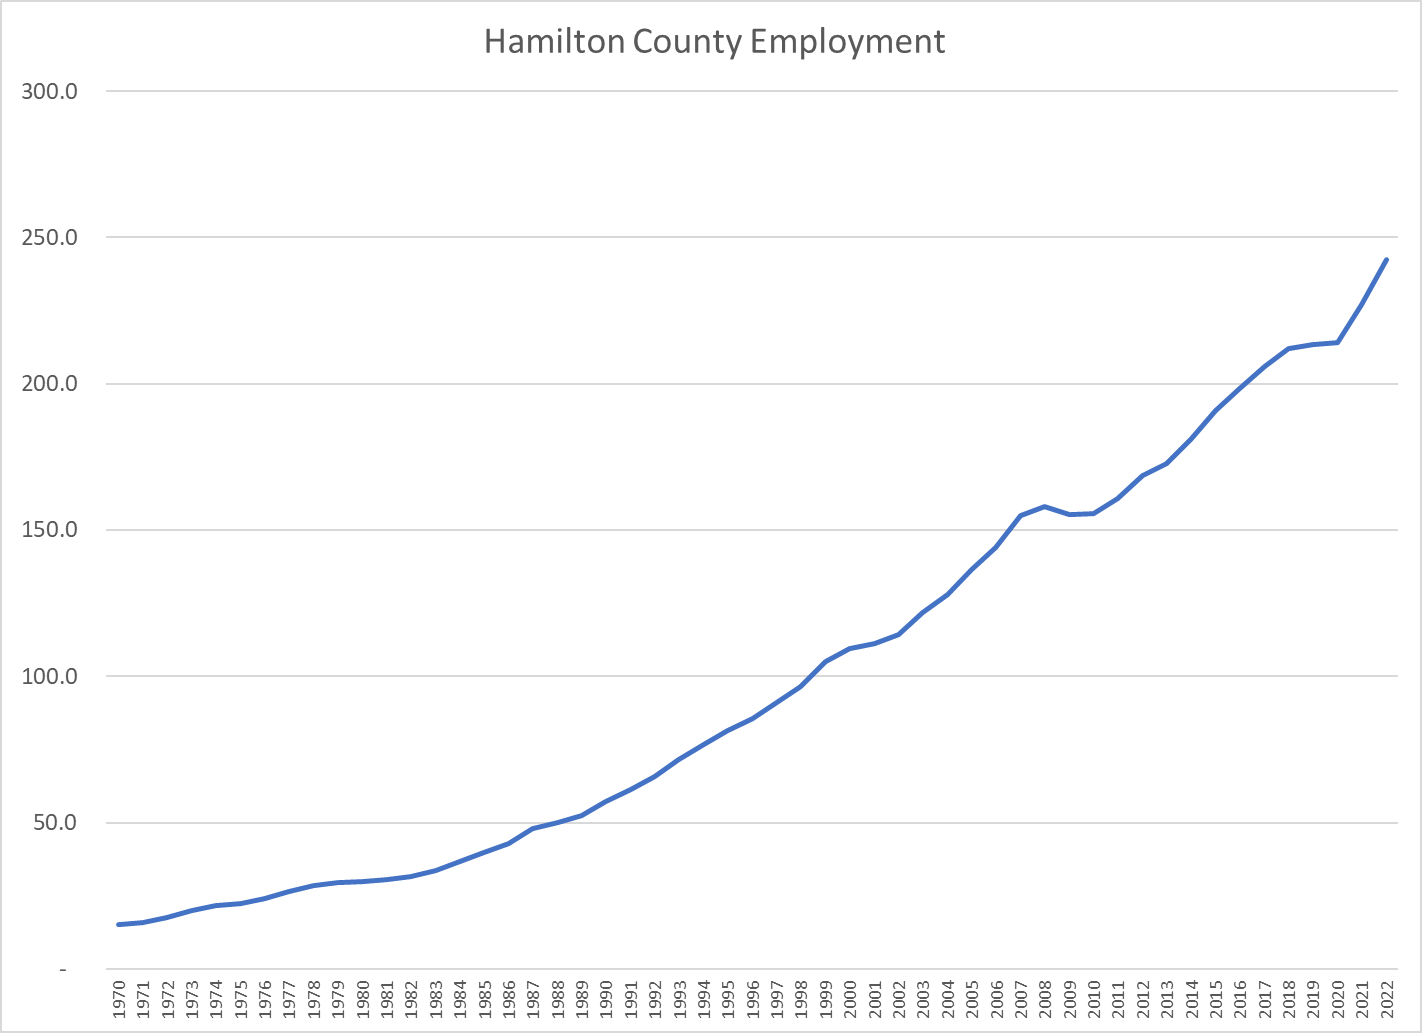
Hamilton County’s employment has grown 16-fold since 1970 from 15,000 to 243,000. This is a 52-year compounded 5.5% growth rate. You aren’t likely to find that growth rate in your stock or mutual fund portfolio!
This growth started from a low base of 1,500 new jobs per year and accelerated to 5,000 new jobs per year by 2000. Hamilton County has maintained this growth rate for 2 decades with some extra results recently!
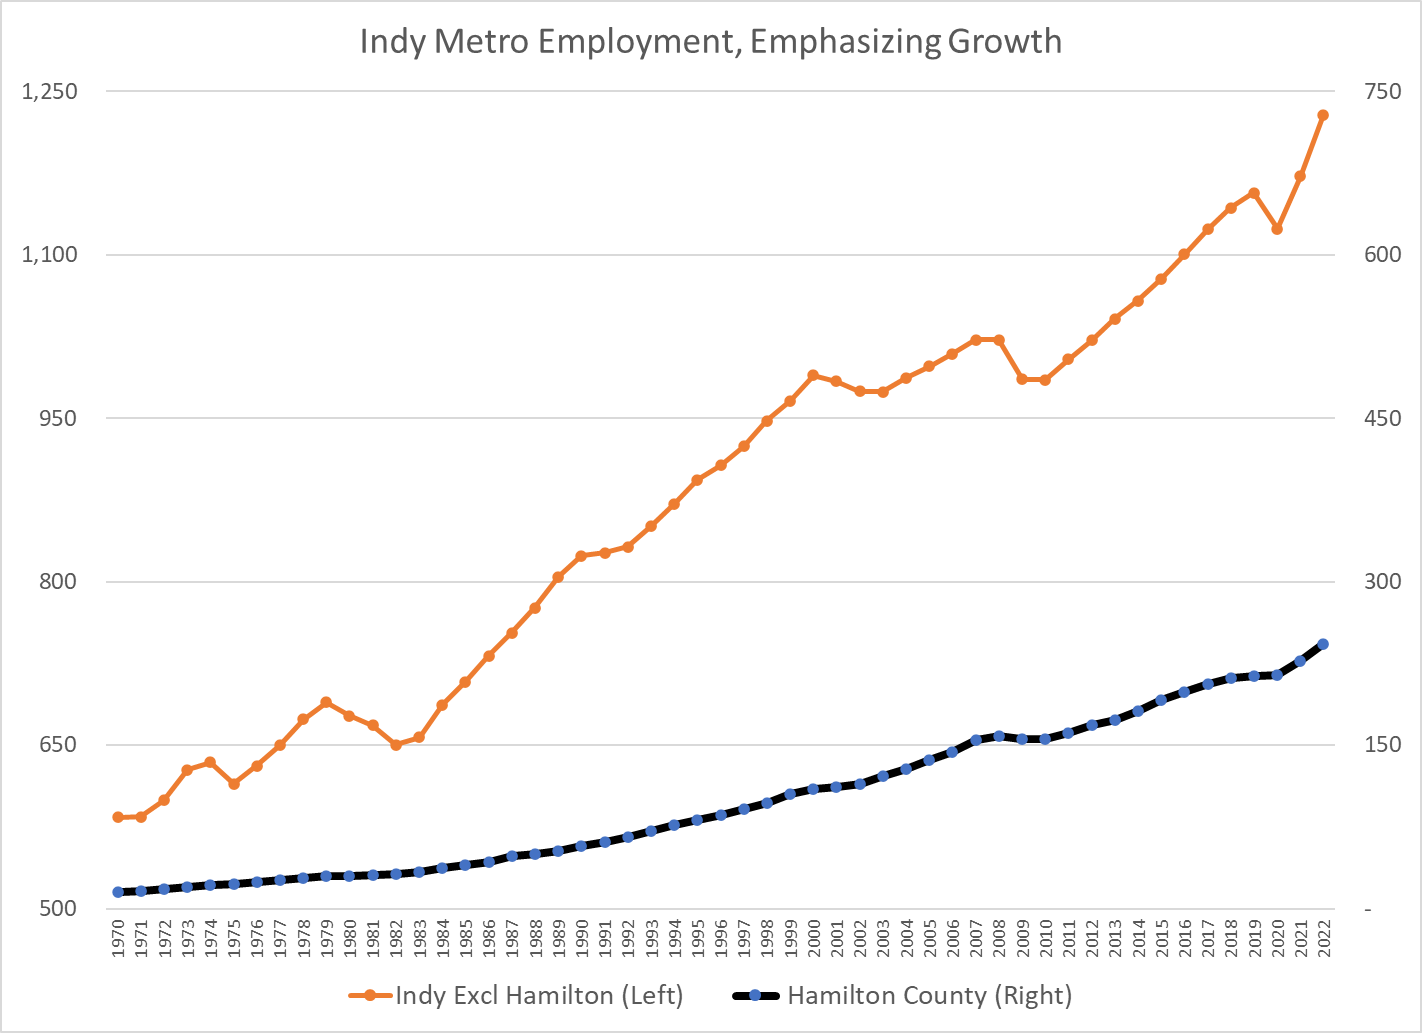
Hamilton County’s population doubled from 1970 to 1990. Metro Indy, excluding Hamilton County, grew by the same 50,000 people. In the next 30 years, Hamilton County added more than 250,000 people and the rest of metro Indy added a very solid 475,000 people (almost 2X). Hamilton County benefits from the Midwest leading growth of metro Indy.
Hamilton County employment growth has been a little faster than population growth.
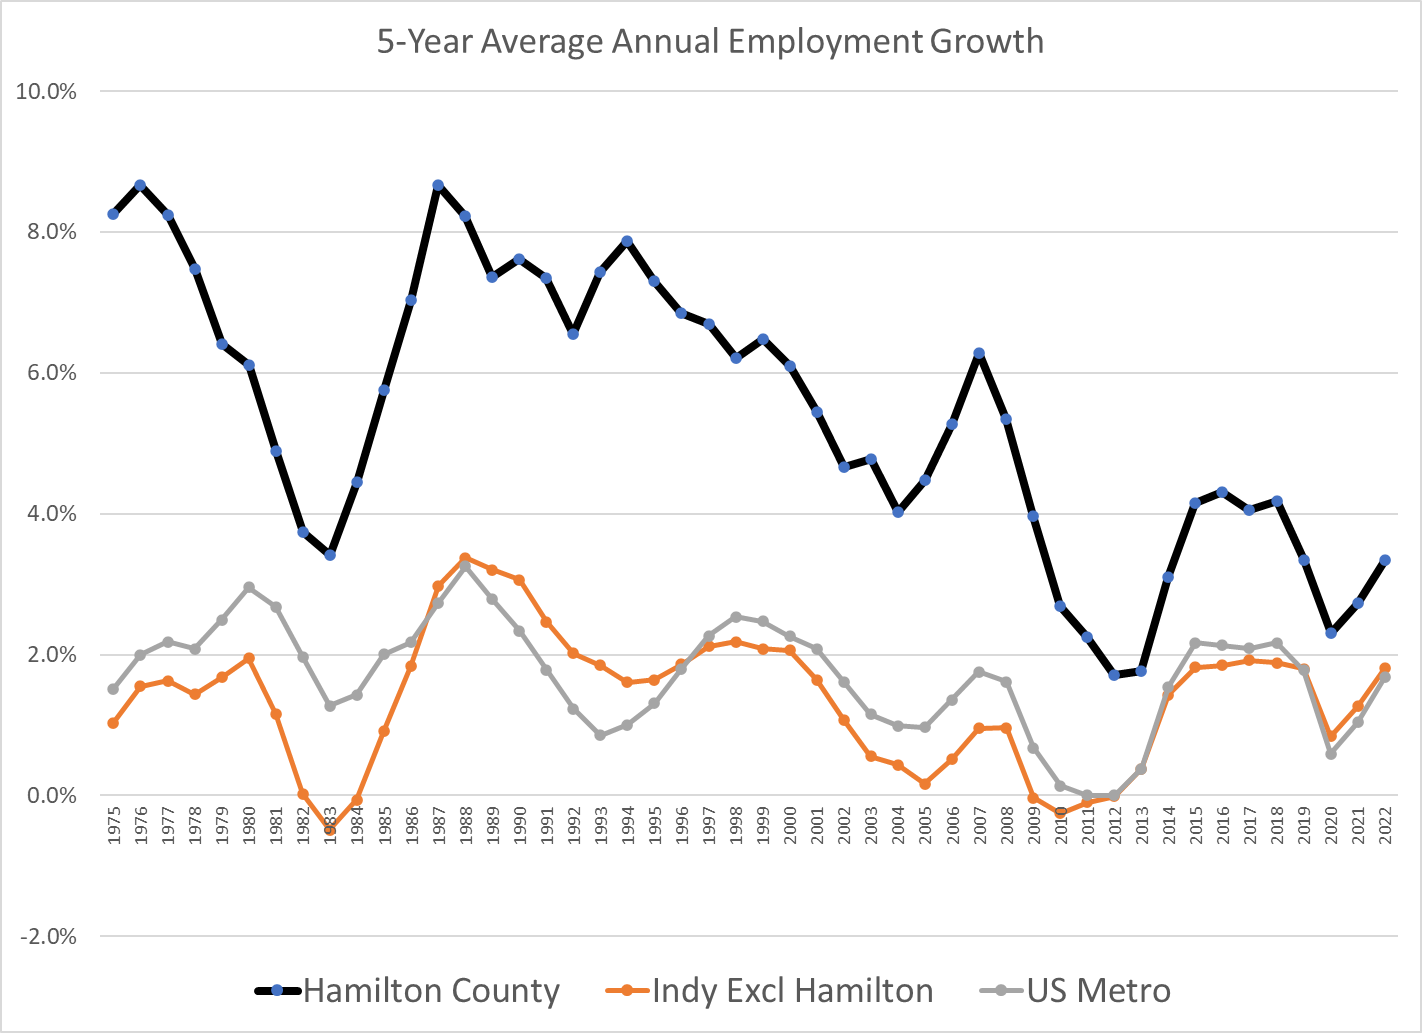
Metro US population has grown by 1% annually and employment has grown by 1.6% annually. The Indy metro area has grown at similar rates. Hamilton County has grown 3-4 times faster.
As Hamilton County has grown, its annual growth rate has declined from 7% to 4%, still far above the 1.5-2% baseline growth rate.
Hamilton County has grown from 1/3,000 US people and 1/5,000 US employees to 1/800 citizens and workers. (4-6X growth).
Metro Indianapolis has been a solid job creator. Hamilton County has grown alongside the metro area.
Hamilton County was a “bedroom suburb” in its early days but reached the national level of jobs to population by 1992 and tracked the national average thereafter.
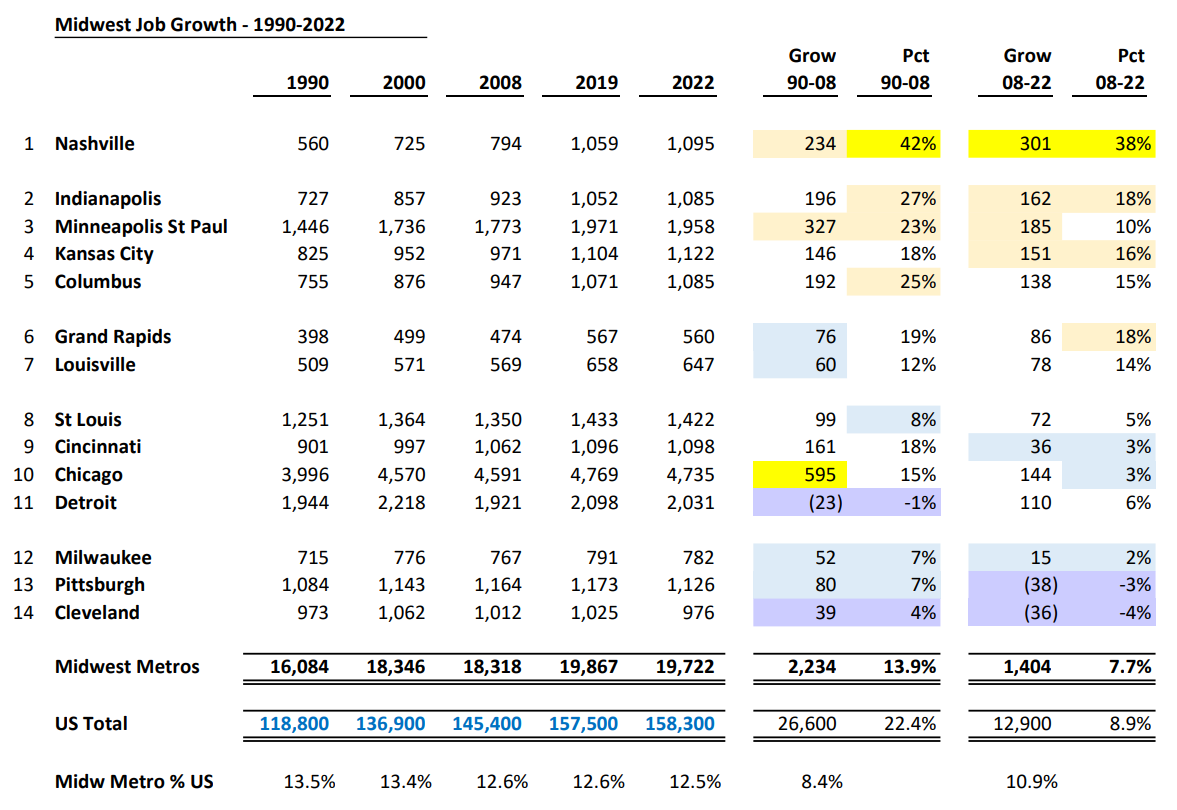
Between 1990 and 2008 US jobs grew by 22% but trailed in Midwest metro areas, increasing by only 14%. US jobs have grown by 9% since the Great Recession, with the Midwest trailing slightly at 8%. Metro Indianapolis has been a percentage growth leader in both periods, at 27% and 18%. Columbus and Kansas City show similar figures. Minneapolis has higher actual jobs added but slightly lower percentage growth on its twice as large base.
Chicago has added more total jobs, but its 18% growth is far behind Indy’s 49% and most of its growth took place back in the 1990’s. Nashville is typically grouped with the Southeastern states but if it was included in the Midwest, it would be the clear winner, nearly doubling its job base in 3 decades.
Hamilton County is in the middle of the Wisconsin glaciated till plains region. The nearby landscape is relatively flat and contains a limited number of state parks, forests or nature preserves. Yet, for the weekend hiker willing to drive 1-3 hours away, the hiking options are unlimited. The 3-hour radius extends far into Ohio, Michigan, Illinois and Kentucky. Think of Chicago, Bloomington, IL, Champaign-Urbana, IL, Vandalia, IL, Terre Haute, Evansville, Owensboro, KY, Louisville, Elizabethtown, KY, Frakfort, Lexington, Cincinnati, Hillsboro, OH, Columbus, Dayton, Fort Wayne, Findlay, OH, Toledo, Coldwater, MI, Kalamazoo, South Bend, and South Haven, MI.
A 3-hour driving radius covers 100,000 square miles and 200 counties. Indiana is the 38th largest state with 36,000 square miles, so we cover almost 3 Indiana’s. This is equal to the combined land area of Michigan and Ohio or the combined land area of Illinois and Kentucky! Indianapolis is deemed the “Crossroads of America” due to its central location and direct access to national highways in all 8 directions away from the city. Chicago, Peoria, St. Louis, Evansville, Louisville, Cincinnati, Columbus and Lansing. US 31 provides a ninth limited access highway north to South Bend and Grand Rapids. The abundance of highways offers 3-hour access up to 210 miles away.
During the pandemic I hiked in all 200 counties within 3 hours of Hamilton County. I summarized the top 40 hikes in 3 blog posts based upon distance away and an extra one for honorable mentions. Let’s organize them below based upon their primary attraction for hikers.
Methodists, Baptists and “Christians” played key roles in founding churches in the pioneer 19th century. Some of these churches or their descendants remain influential to this day. The historical summary below is from 1915.
Hamilton County has the national average of 1% of LDS, Muslim, Hindu and Buddhists. It hosts 2% of Jewish faith members versus the 1% national average. The county reports 25% unaffiliated, slightly above the national average of 23%. The county reports only one-third of the national average of Black and Hispanic religious members today. It has 50% more White Catholics, Evangelicals and Mainstream Protestants compared with the national average (63% vs 44% overall).
Sperling’s Best Places reports that Hamilton County has 45% religious citizens versus the national average of 49%.
At 2,074 people per congregation there are one-half as many churches as the national average of 1,000 (332M/350K). It’s difficult to interpret this number. I think that it reflects the lag between population growth and church planting. Nearby Indianapolis is noted for its nation leading 2,900 churches for 1 M people or one church for every 300 people.
Hamilton County residents are well served by 5 nearby general aviation airports. The county owns and operates Indy Executive Airport which recently expanded its main runway to 7,000 feet, the longest general aviation runway in the state, now capable of landing all private jet aircraft. The airport hosts 100 aircraft, including 20 jets and conducts more than 40,000 operations per year. It is the fourth busiest non-towered airport in the US. The airport hosted private jet flights from around the country for the 2012 Super Bowl. It was awarded “Indiana Airport of the Year” recognition in 2007.
Indianapolis Metro Airport is located in Fishers near the Marion County border and operated by the Indianapolis Airport Authority as a “reliever airport”. It has 110 based aircraft and conducts 25,000 operations each year. It has a single 4,000-foot runway and is actively developing half of its 400 acres for aviation-related uses.
Eagle Creek, Anderson and Indy Regional airports to the southwest, north and southeast also offer general aviation services to Hamilton County residents.
Indianapolis boasts main runways of 11,200 and 10,000 feet and a cross-wind runway of 7,200 feet. Indy is home to one of the nation’s 22 FAA control districts. Indianapolis has 40 direct flight destinations. Due to its Fed Ex hub status, it joins its neighbors Chicago, Louisville and Cincinnati as “top 10” US air cargo carriers, ensuring that the airport receives priority FAA funding and maintenance.
Historically, Indy residents took advantage of the US Air hub in Dayton (74th largest metro area) and the Delta hub in Cincinnati (30th largest metro area) within 2 hours, but those attractions have expired. Louisville (43rd largest metro area) is also within 2 hours but has never had preferred flight options.
Similarly, Detroit, St. Louis, Cleveland, Nashville, Milwaukee and Columbus are large metro areas within 5 hours of Indy, but typically do not have super attractive air travel options worth a long drive.
Chicago’s Midway (31st busiest) and O’Hare (4th busiest) airports DO provide solid air travel options for Hamilton County residents, just 3 hours away.
Despite its relatively small size, Indy has attracted all national carriers and many discount carriers. Its average ticket is $396, just above the $392 national average. Among top 50 metro areas, it ranks 20th at $396, just above the median of $390.
Hamilton County has several top-quality general aviation options. The Indianapolis International Airport is a national leader in quality and service. Prices are roughly average. Indy has a relatively low number of direct flights, so travelers often need to connect through major hubs or drive to Chicago, especially for international destinations.
Hamilton County has the fourth largest population of the 92 Indiana counties at 365,000, trailing only Allen (391K), Lake (500K) and Marion (961K) counties.
It has the second highest Net Assessed Property Valuation (NAV) at $33.8 billion, trailing only Marion ($58.1B), but ahead of Lake ($30.6B) and Allen ($24.0B) counties. This reflects higher than average residential property values and significant commercial property investments (30% of the total).
The average net assessed valuation per capita in Indiana is $63,000. At $92,600, Hamilton County has the highest NAV/person among the 21 counties with at least 100,000 residents or a density of at least 200 people per square mile. It is 50% higher than the state average. Marion, Lake and Allen counties each have NAV/person slightly below the state average. These 21 counties represent 68% of the population and 67% of the NAV, with an average NAV/capita of $61,900, slightly below the state average.
18 of the 20 counties with the highest NAV/person in Indiana have population densities below the state average of 191 people per square mile. Benton County has a population of just 8,000, rich agricultural lands and several windmill farms giving it the state lead at $148,600 of NAV per person.
Carmel-Clay Public Library (CCPL) was awarded the top tier rating in the Hennen’s American Public Library Ratings (HAPLR) system in each of its first 9 years, one of only 11 libraries in the country to consistently qualify among the best.
The Sheridan Public Library was rated at the 87th percentile by the Library Journal in 2020.
The Westfield-Washington Public Library was ranked at the 62nd percentile.
The Hamilton North Public Library was listed at the 48th percentile.
The Hamilton East Public Library was not rated in recent years.
The state of Indiana tracks total materials circulation per population which can be used as an indicator of library activity and quality. Of the 236 Indiana library districts, CCPL ranked 3rd with 19.4 items per person in 2021. Hamilton East was close behind, ranked 5th with 16.1 items per person. Westfield-Washington was 17th with 12.3 items per person.
Combining the 5 Hamilton County public libraries yields annual circulation of 16.1 items per person, which would rank 5th out of 232 libraries if it was a single library system. (Table 7). Hamilton County checks out more than twice as many items as the state average of 7.4 per person.