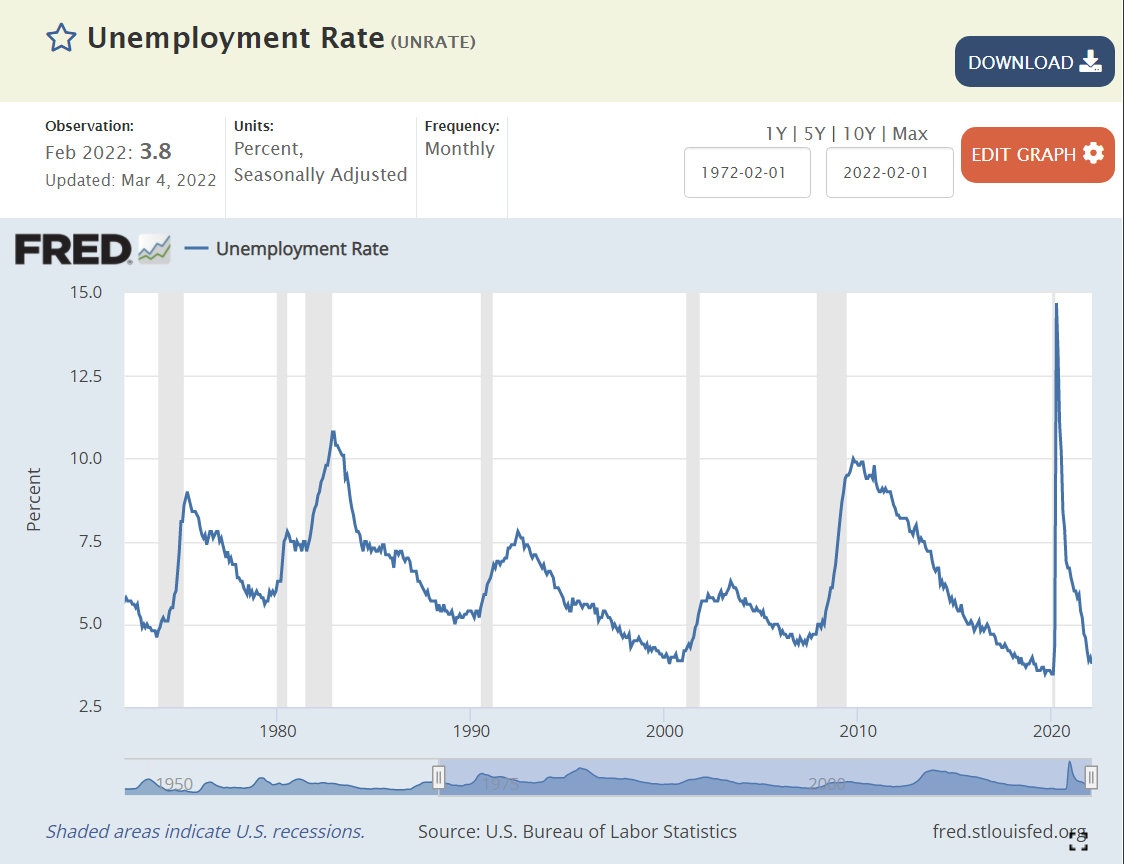
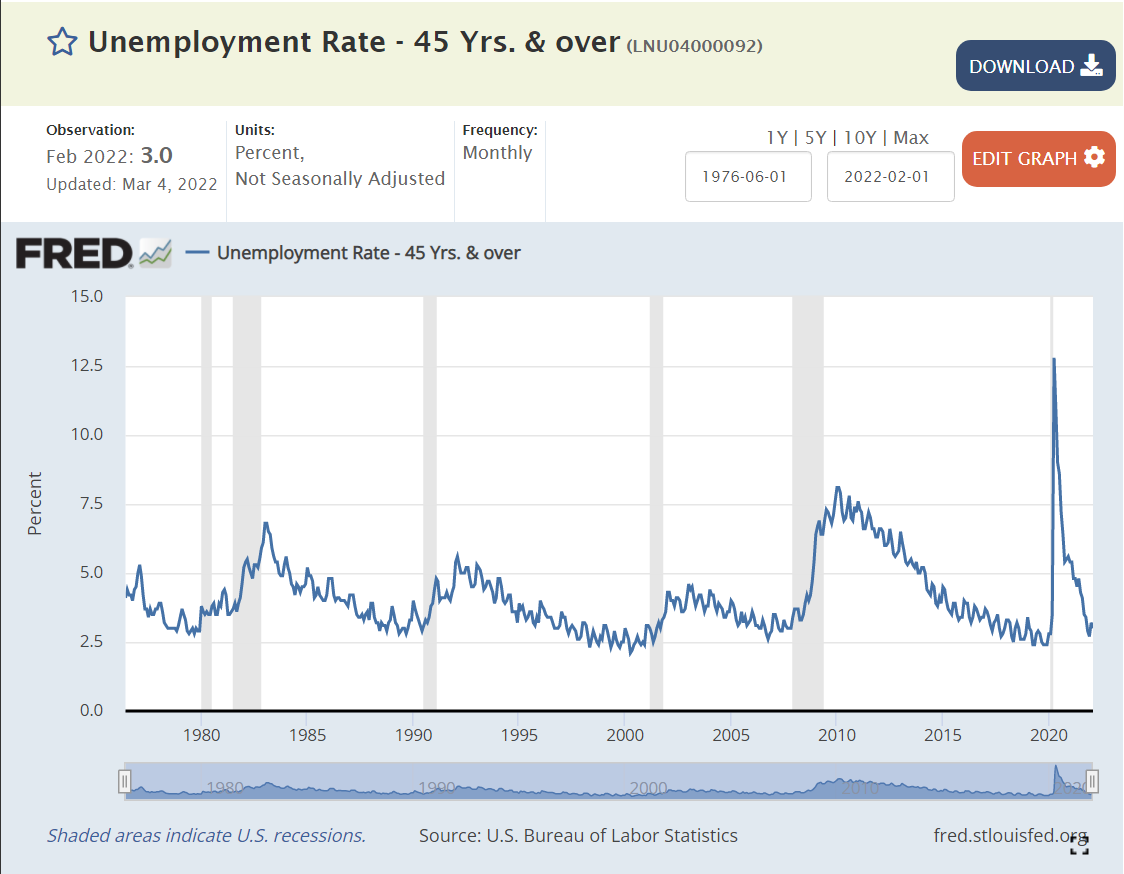
In the last 50 years, the last 600 months, the US unemployment rate has been below the current 3.8% for just 9 months (less than 2% of the time).
This is less than 2 years after the rate hit a modern HIGH of 15%.
9 states set all-time lows this month: Nebraska (2.1%), Vermont (2.1%), Indiana (2.3%), Kansas (2.5%), Montana (2.6%), Oklahoma (2.6%), Arkansas (3.1%), West Virginia (3.9%) and Mississippi (4.5%).
In February, 31 states had material decreases, while 19 had immaterial changes and NO states had material increases.
At the metropolitan area level, 50 areas sported unemployment rates of 3% or less, far below historical results.
11 areas were at crazy low 2.3% unemployment rates or lower: Lincoln, NE and Madison, Wi. Logan, Provo and Ogden UT. Elkhart, Columbus, Bloomington, Lafayette, Ft Wayne and Indianapolis, IN.
Typical vehicle age increased by one-quarter, from 9.6 to 12.1 years since 2002.
Typical vehicle age increased by more than one-half from 7.8 years in 1990.
Typical vehicle age more than doubled from just 5.3 years in 1969.
The rate of increase has remained relatively constant, with improved highways, driving, designs, quality and maintenance allowing the average age to increase by 1 year every 7-8 years.
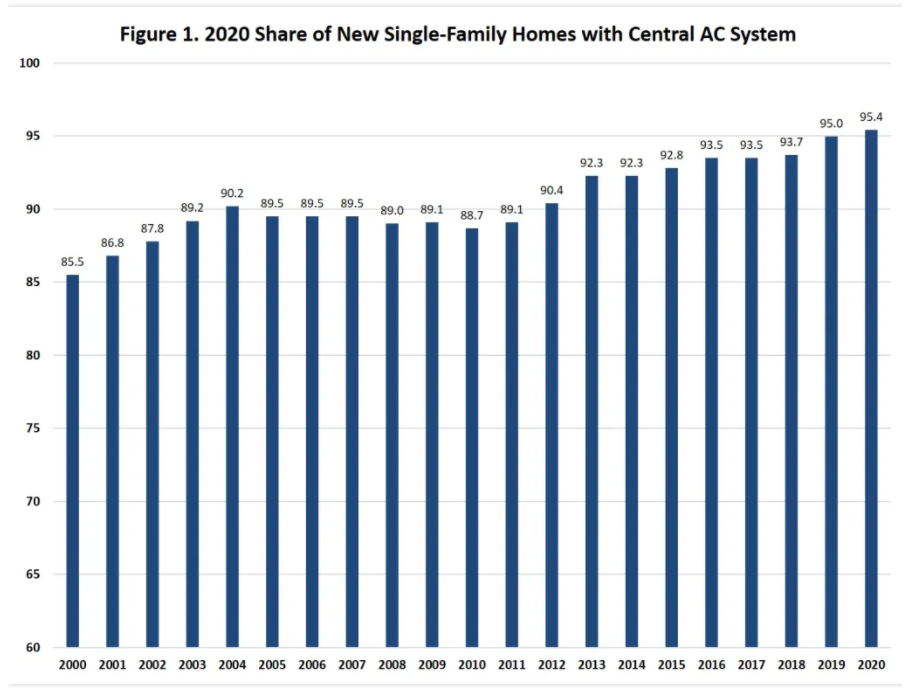
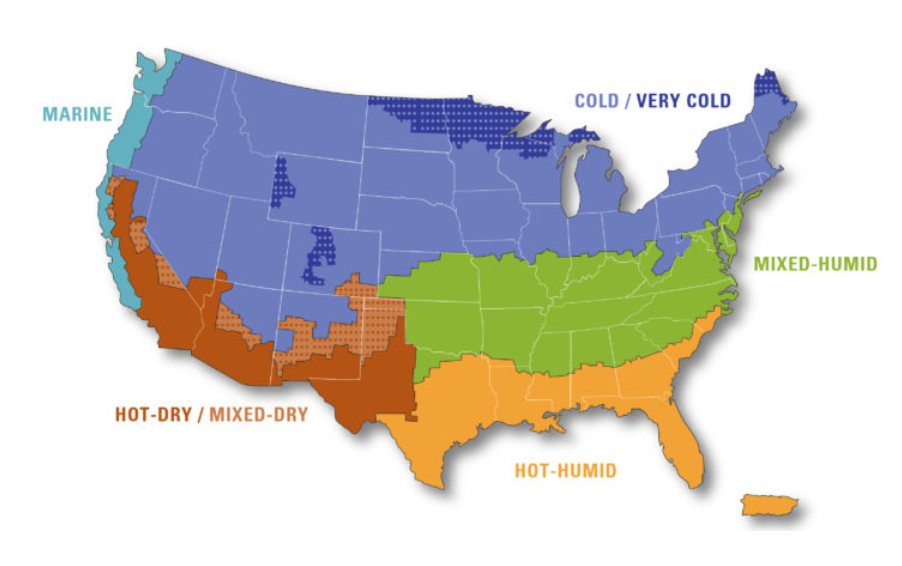
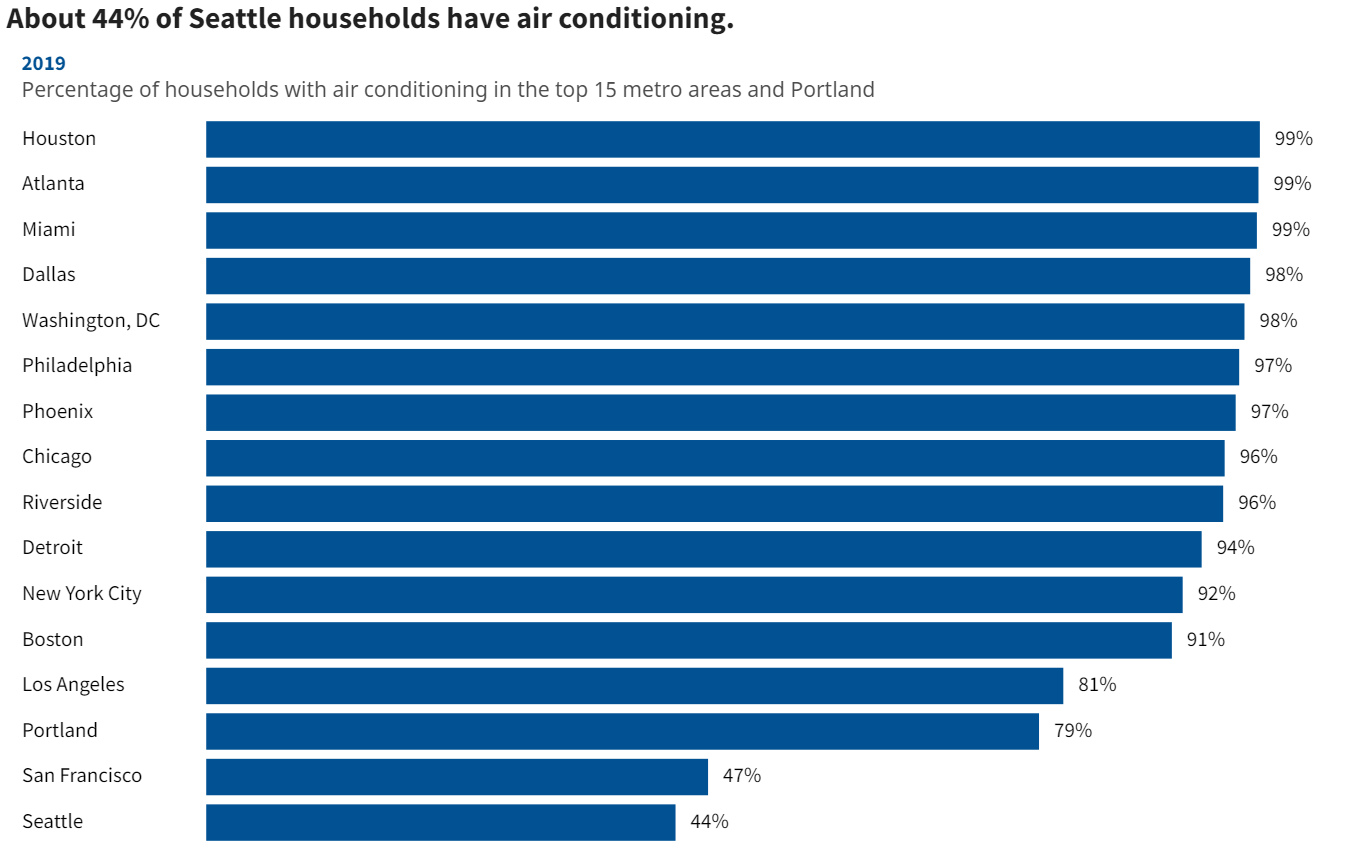
Air conditioning demand varies significantly by region/climate. AC use increased from 75-99% in the South, from 60-90% in the Midwest, from 50-85% in the northeast and from 40-60% in the West. AC demand varies based on peak temperatures, the number of days at peak temperature, the number of hours per day at peak temperature and the humidity (felt temperature). San Francisco, Portland and Seattle rarely “require” AC, even though their residents could afford this service.
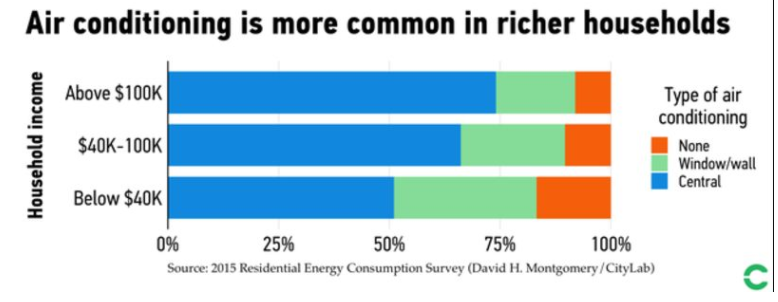
The US, Japan and Korea lead the world in households with air conditioning. China and Saudi Arabia are representative of moderate-income nations with relatively high AC usage. Most other nations, including the wealthier European nations, remain at very low rates of AC adoption (10%). This is a “good news” item for personal comfort, but not so good for energy consumption.
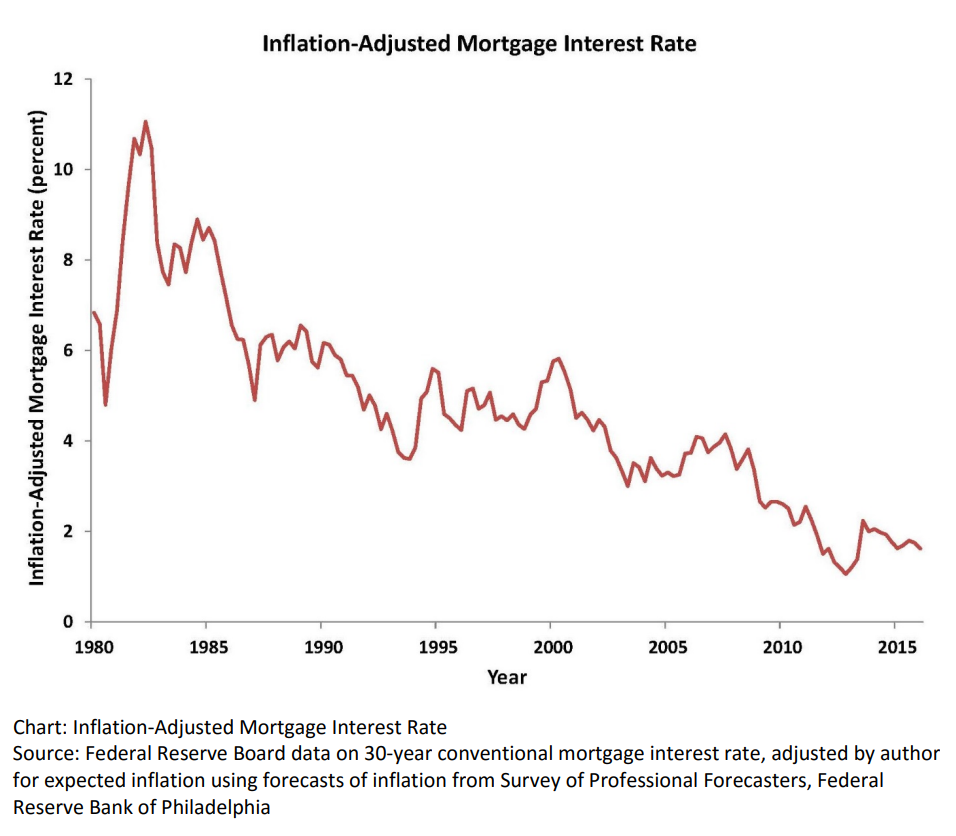
Real, inflation-adjusted, interest rates have declined greatly since 1980. At that time, with the risks of variable inflation and surging oil prices, the real mortgage interest rate was 8%. It declined to 5% in the 1990’s and 4% in the 2000’s before falling to 2% in the 2010’s. The financial cost of owning property has rarely been lower.
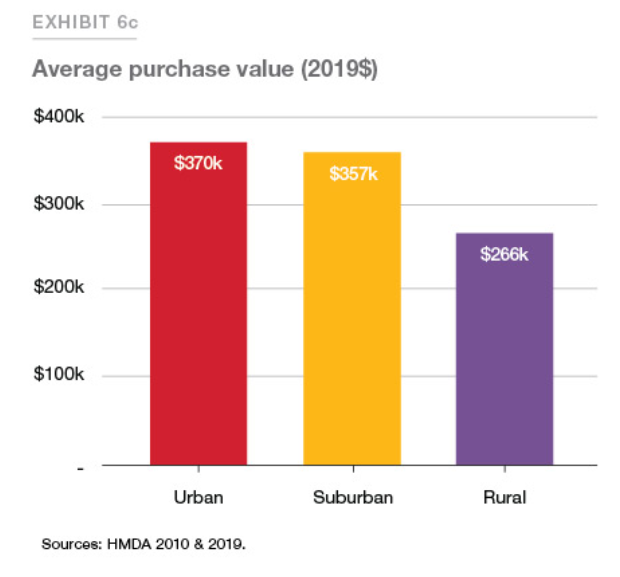
House Values are Up, Way Up
House prices grew relatively consistently from 1970 through 2000, with a spike in 2005-9 and a return to trend values in 2010-12. In the last 10 years, house prices have increased by 6% annually in nominal terms, or 4% annually in real terms.
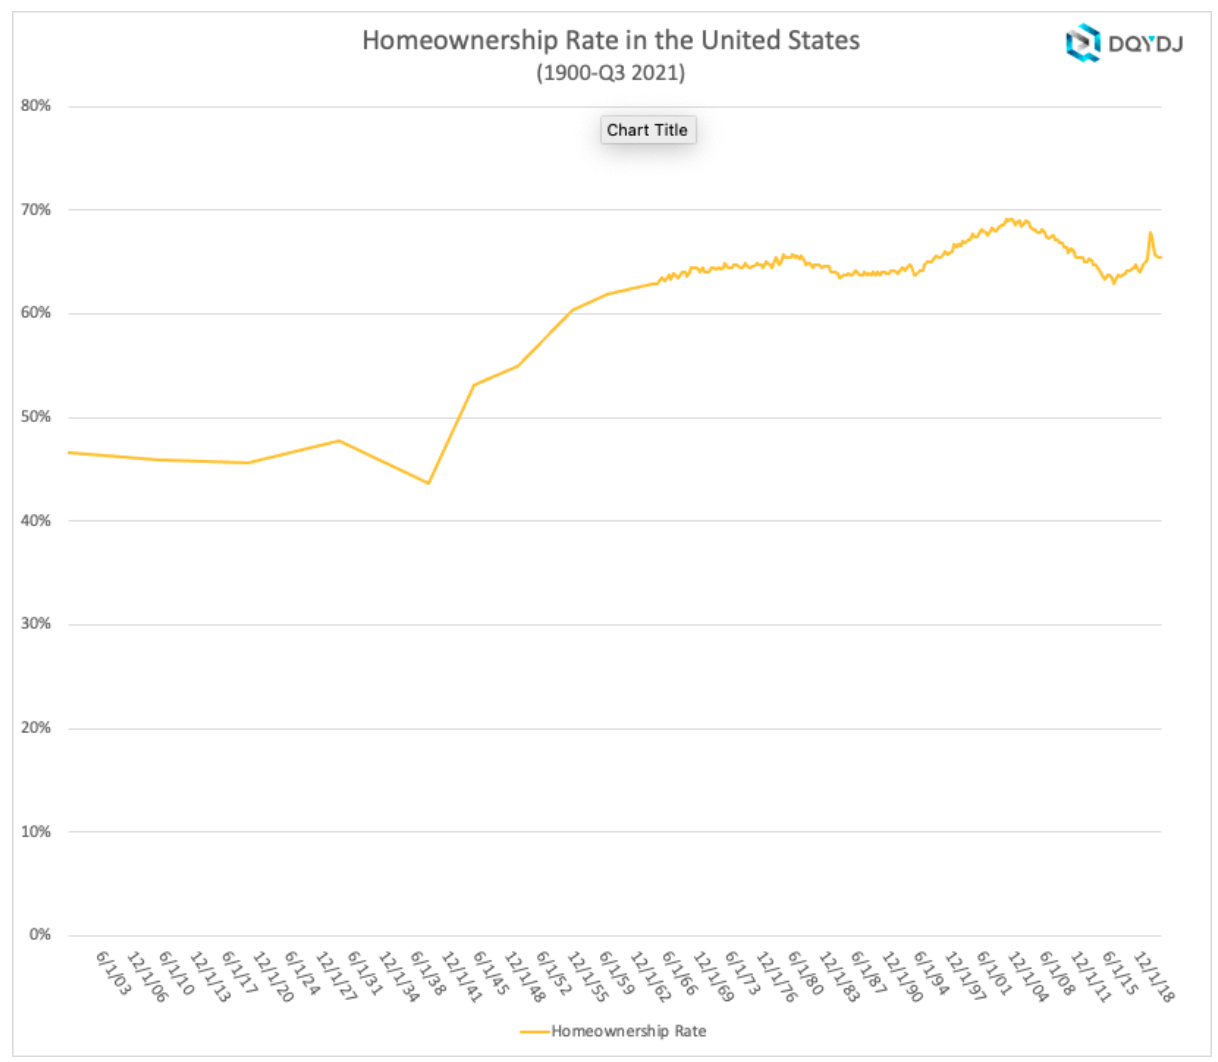
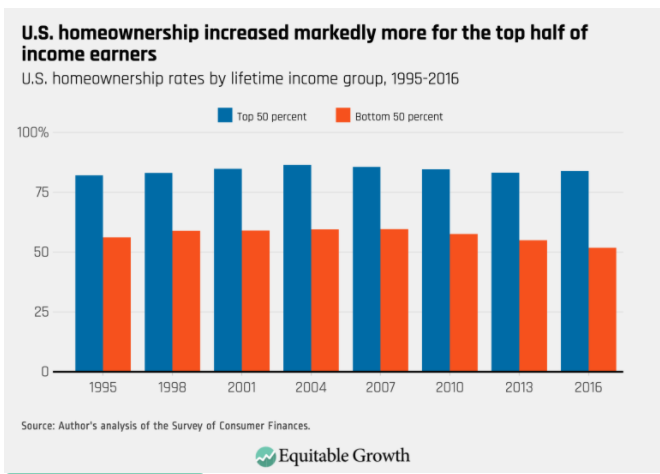
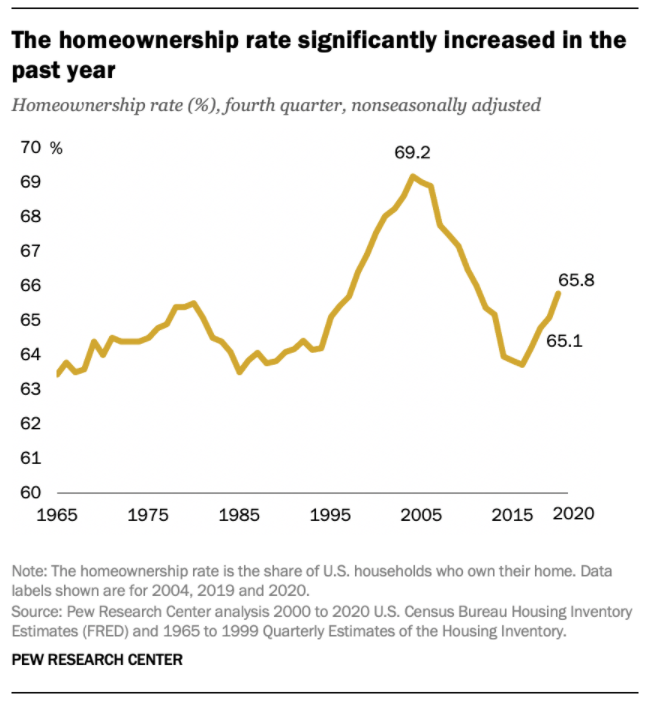
Home Ownership Rate is Rebounding, Up 2%
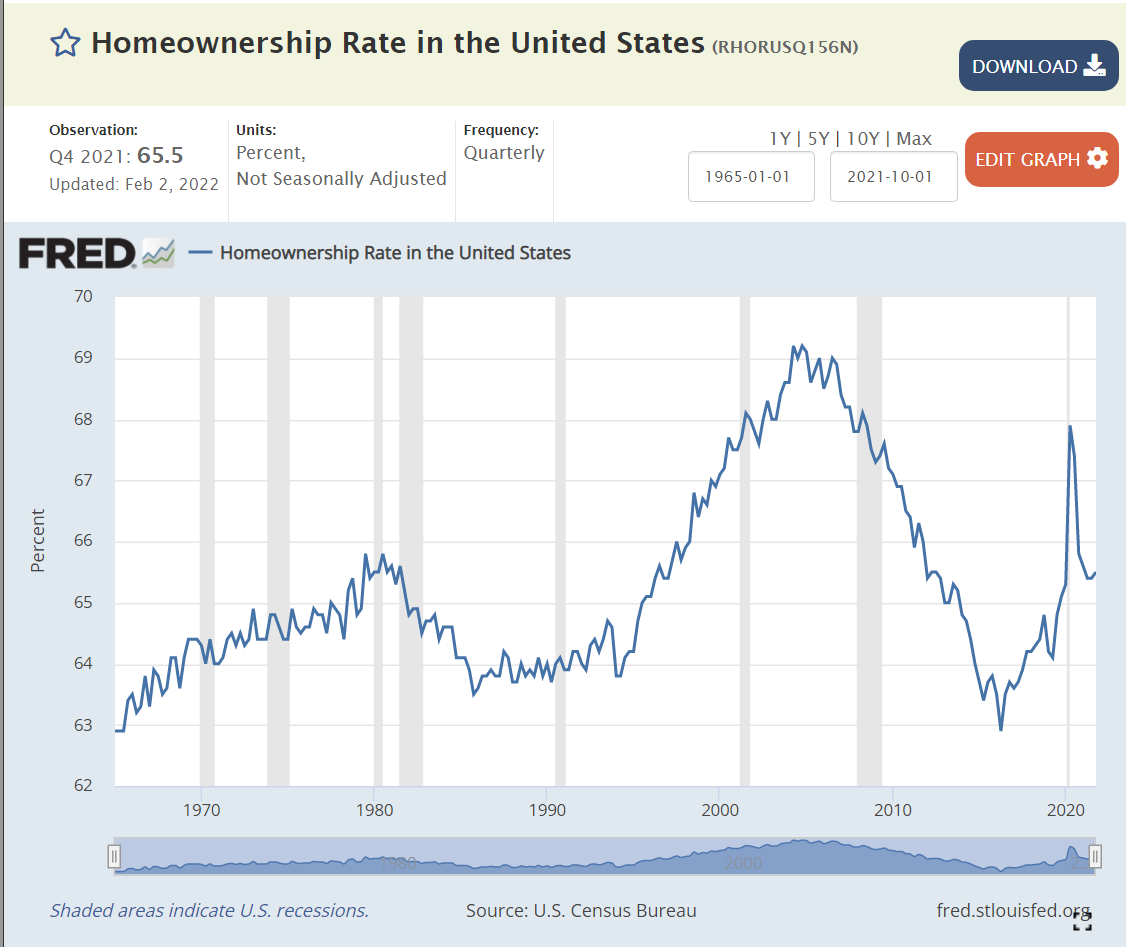
The US homeownership rate averaged 47% from 1900-40. It increased smartly in post WWII times to 60% by 1955 and 64% by 1965. Homeownership averaged 64%+ for the decade of 1969-78. It increased by 1% during 1979-81. In the midst of a difficult depression, homeownership rates dropped back to 64% by 1985, about the same for the last 20 years, setting a “normal” level. Homeownership rates stayed at 64% for the next decade. Ownership rates increased from 64% to 69% in the next decade before declining right back to 63% by 2015. In the last 7 years, despite many headwinds, the home ownership rate has increased by 2%.
Number of Homeowners has Jumped by 7 Million
In 2000, there were 69M owner-occupied homes in the US. This increased by a solid 7M to 76M by 2005. The housing market hit a lull and the number of owner-occupied homes essentially stayed flat for a dozen years, through 2017. The supply of owner-occupied homes then rose by a strong 7M in the next 4 years to 83M!
The housing market is inherently volatile, typically rising by 2 times the trend and then falling to one-half of the trend. Annual housing starts averaged 1.6M from 1960-2008. They declined by a severe 75% to just 0.5M in 2009. Housing starts have subsequently grown 3-fold to 1.6M annual housing starts, but the accumulated lack of new supply is impacting housing markets today.
The period from 1982-2000 showed homeownership rates by the 5 age segments remaining relatively constant; 65+ 78%, 55-64 80%, 45-54 76%, 35-44 67% and <35 40%. The 65+ group increased homeownership from 75% to 80%. During this time, the overall US homeownership rate increased from 65% to 69%, mostly due to the aging of the population, now more heavily weighted towards the groups with 76-80% homeownership versus the 40-67% younger groups.
Homeownership rates grew from 2000 to peak rates in 2004, before declining significantly for all groups except for the 65+ cohort which essentially held it’s own. The adjacent 55-64 class fell 4%. The middle 45-54 group dropped 7%. The typically homeownership growing 35-44 group cratered by 9%. The young <35 group fell by 5%. Hence, the overall rate fell dramatically during this time.
There is a 30 point gap between married couples and other groups, with 84% of married couples owning homes versus about 55% for other family structures.
The US shows dramatically different homeownership rates by racial category. The differences between the 1995 non-Hispanic White rate (70%) and Others/Asians (50%), Hispanics (42%) and Blacks (42%) remain large in 2021 where we see White (74%), Other (57%), Hispanic (48%) and Black (44%). The groups homeownership share gain from 1995 to 2005 were similar, ranging from 6-10%, but the decline from 2005-2015 was only 3-4% for Whites and Hispanics, but 7% for Blacks and Others. The improvement from 2015 to 2021 has been 2% for 3 groups and 4% for the Other/Asian group.
Summary
The Great Recession flattened the housing market. The number of owner-occupied homes in the US remained level at 76 million from 2006 – 2017. The number of housing starts plummeted from 2.0M to 0.5M per year, compared with an historic average of 1.6M. New home construction first exceeded 1.2M units (75% of historic average) again only in 2020, a dozen years later. New home-owning households have increased by 7M units in the last 4 years! The homeownership rate is up 2 points, from 63.5% to 65.5%. Supply is responding to increased demand and higher home prices. Homeownership rates will increase with the economic recovery, but be constrained by higher home prices.
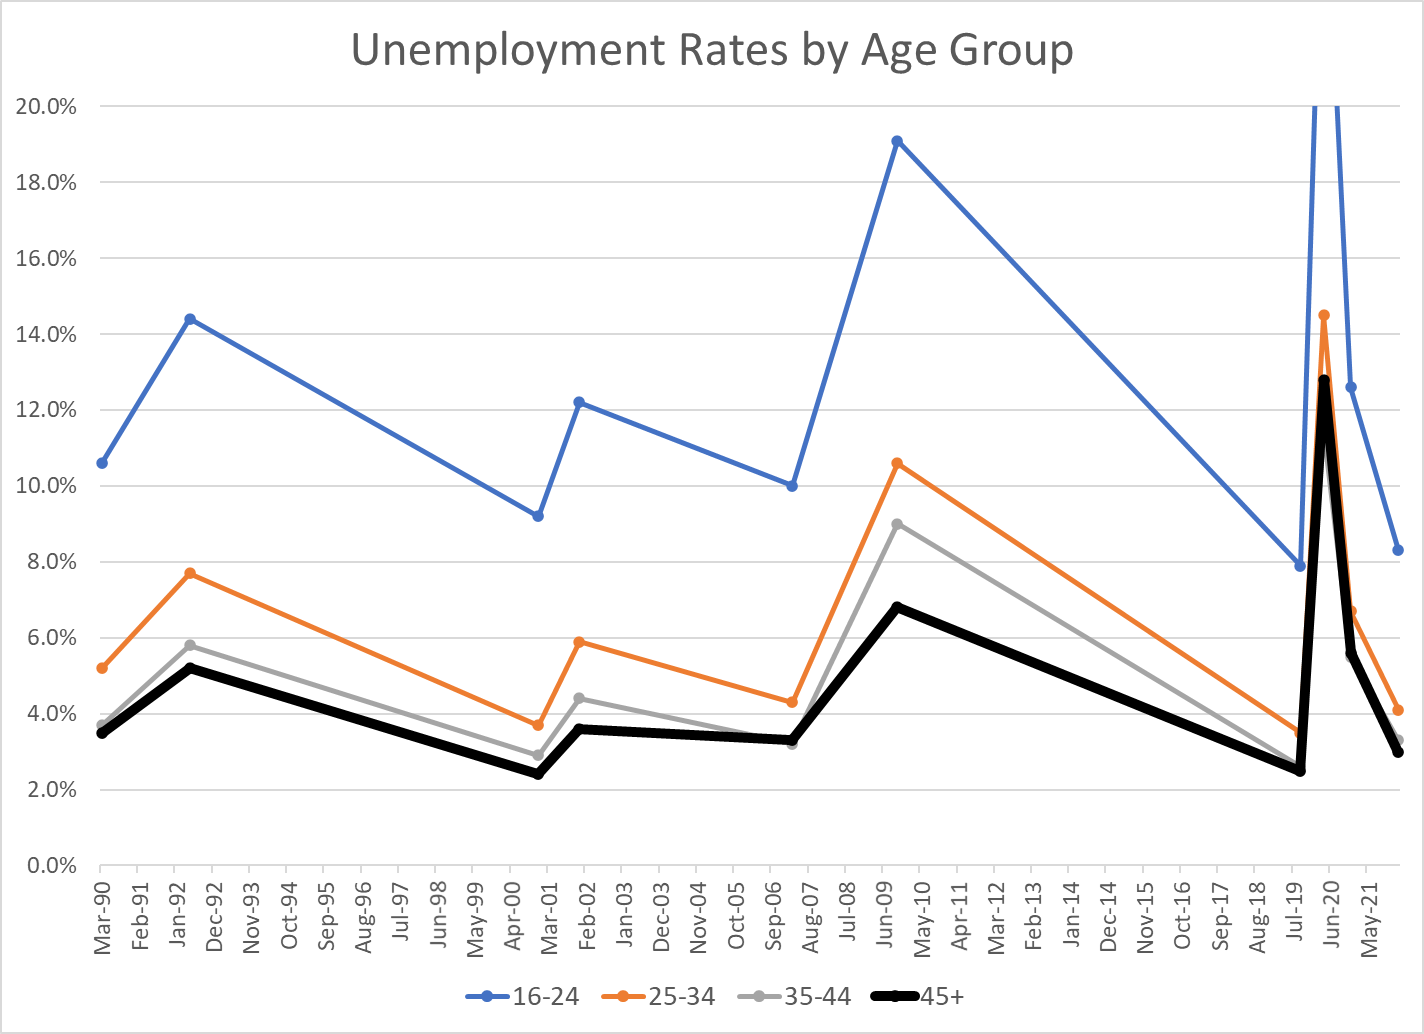
I’ve summarized the last 30+/- years of US labor market experience with just the peak unemployment rates of the business cycle, plus December, 2020 as a secondary indicator of the peak Covid/pandemic impact, since the actual peak numbers in April, 2020 were so extreme and short-lived.
Less experienced individuals have historically had higher unemployment rates in the US. Compared with the 45+ age group, the 35-44 age group has averaged 0.3% higher unemployment; 5.2% versus 4.9%, a relatively minor difference. The 25-34 year age group has averaged 6.6% unemployment, a substantial 1.7% higher rate. The job-seeking 16-24 year age group has averaged 13.2% unemployment, more than twice as high as the 25-34 year age group and more than 2.5 times the 45+ age group (8.3% extra).
The “extra” unemployment for 35-44 year olds versus the 45+ group has been zero for the last 15 years, versus a minor 0.5% premium historically. It appears that workers are reaching full employment value at an earlier age.
The “extra” unemployment for 25-34 year olds versus the 45+ group has been 1.0% for the last 15 years, a small reduction from the prior 1.5% premium.
The “extra” unemployment for 16-24 year olds at the peak of the business cycle versus the 45+ group averaged just 5.3% recently versus 7% historically.
The 2007-2009 recession showed a greater impact on modestly younger (25-44 year old) workers, with their unemployment rates increasing by 2.5% more than the 45+ group.
Despite the reduction in the inexperience penalty for youngest workers (16-24) in the last few years, they did experience much higher “extra” unemployment during both the 2007 and 2020 recessions.
Very young workers continue to be penalized for their inexperience, but other workers from ages 25+ seem to have relatively equal economic value today.
Note that the current unemployment rates for those aged 25+ already matches the average MINIMUM rates of the last 4 business cycles: 3-4%. The 8.3% unemployment rate for the 16-24 year age group is below the minimum in 1990, 2000 and 2007, and just above the 7.9% level of Sep, 2019.
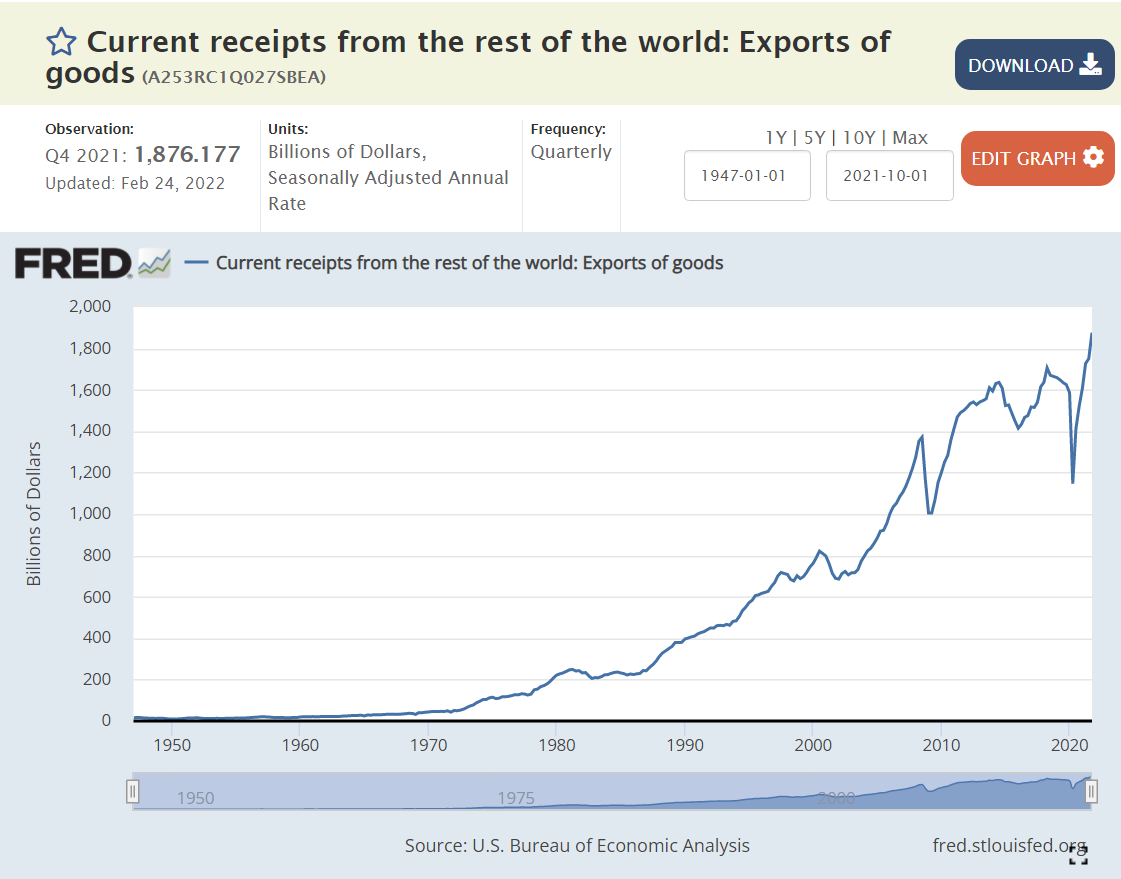
Critics complain about the US economy’s weak international performance in recent decades. Let’s set aside the trade balance (exports – imports) and focus just on exports. US exports occur when US goods and services are more competitive than ALL other countries in the world, subject to limits based upon transportation and purchasing costs, currency values and trade barriers. In real (inflation-adjusted) terms, US exports have increased by 180% since 1980, or 2.5% per year, year after year after year. Despite the 10% increased real cost of labor in the US, firms have leveraged their advantages, developed new products, found new markets and used better financing structures to greatly improve the US export results.
Total Goods and Services
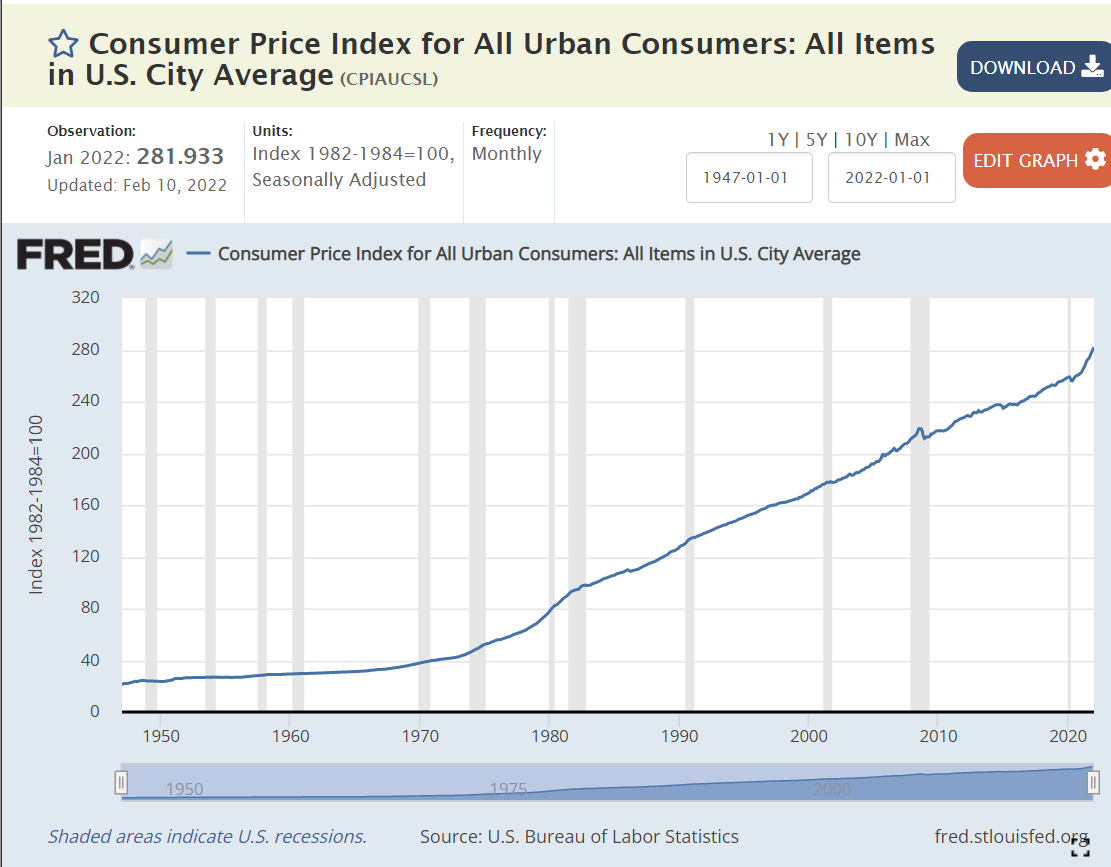
Real goods and services exports increased by 180% from 1980 until today. They increased 9-fold in nominal terms, but consumer prices increased by 230% (3.3x).
The US Dollar fell in value significantly in the 1980’s as US inflation exceeded inflation in other countries, but has since been relatively constant against a market basket of other currencies. The increase in exports is not due to a weaker US dollar.
Goods Exports
US goods exports have increased by 140% or 2.1% per year in real terms since 1980. They have fallen from 4/5ths to a little more than 2/3rds of the total as services exports have grown more rapidly.
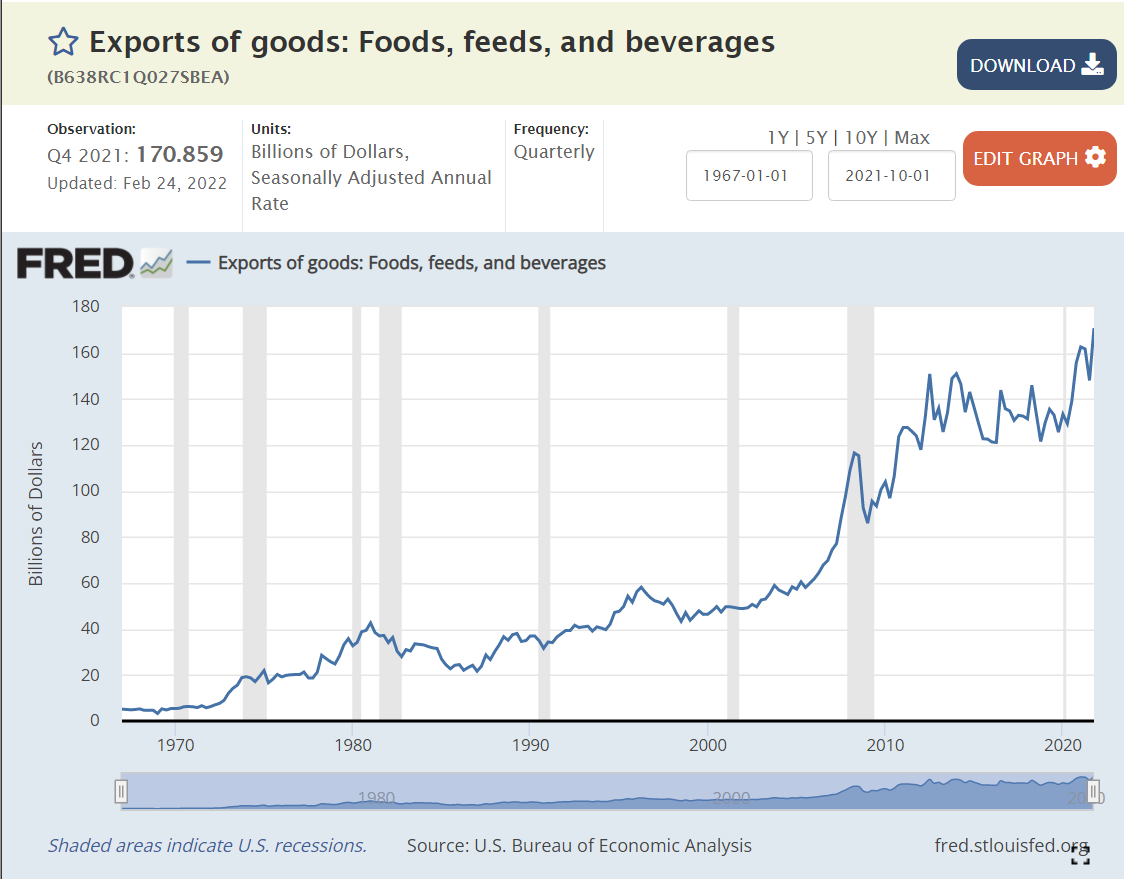
Agriculture
Ag exports grew very rapidly in the 1970’s and then flattened through the 80’s and 90’s before rapidly accelerating in the “oughts”. Ag exports grew by 30% in real terms over these 4 decades, a little less than 1% per year.
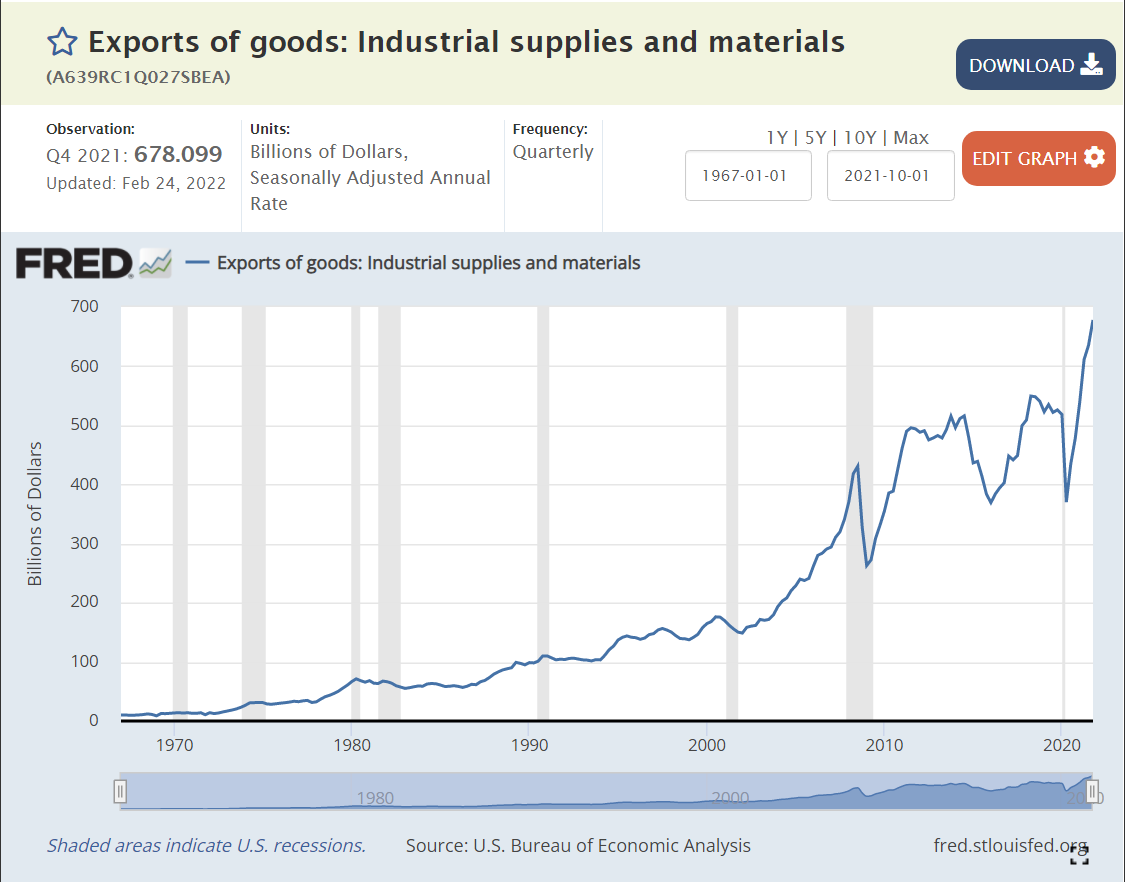
Industrial Supplies Exports
US chemistry based and other engineered supplies and components grew by 210%, or a strong 2.8% annually.
Petroleum Exports
From zero to something, now 10% of US exports.
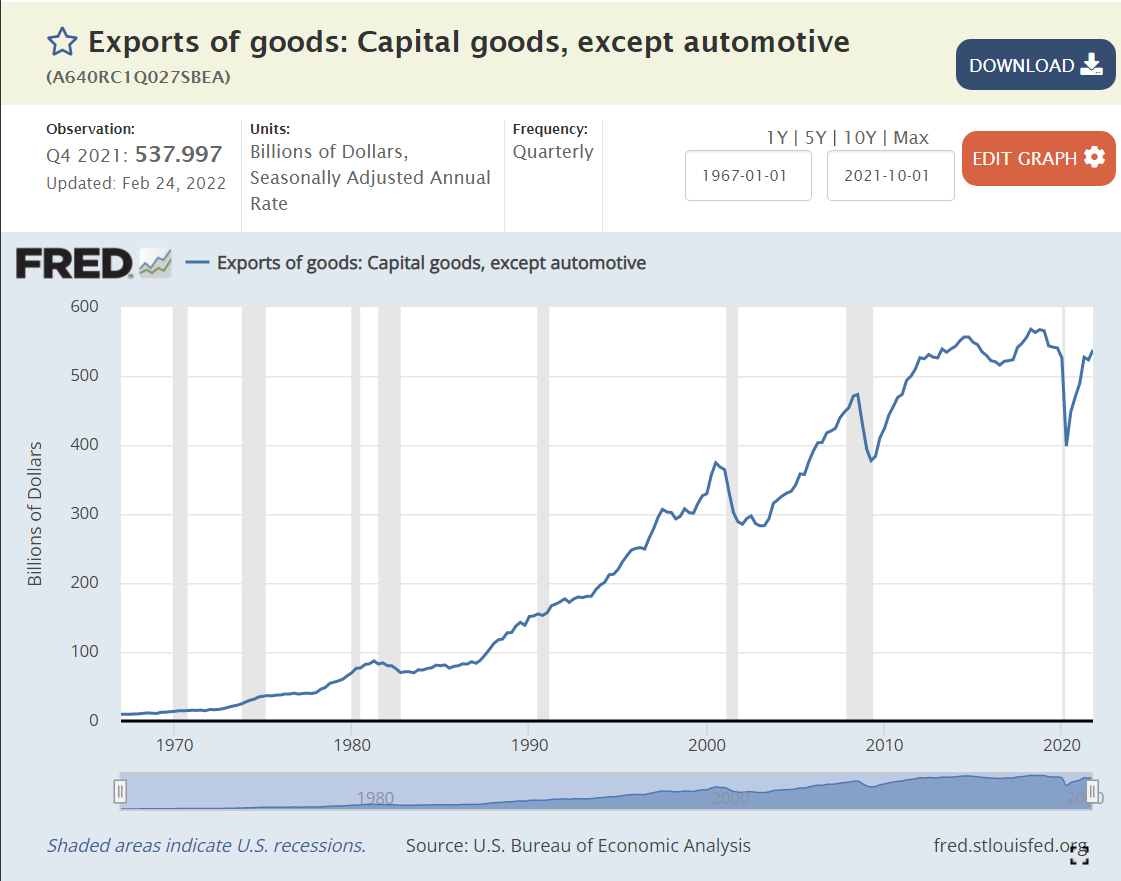
Capital Goods Exports
US exports of highly engineered capital goods increased by 100%, or 1.7% per year.
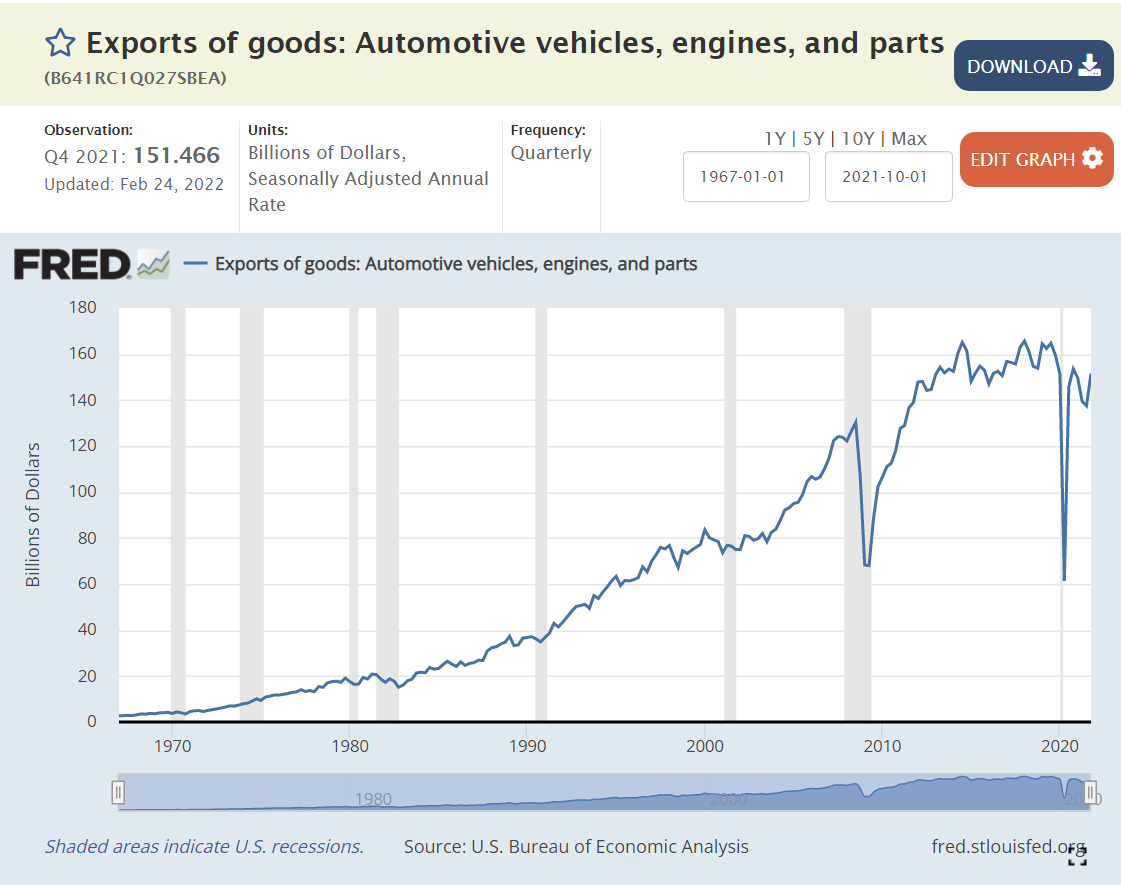
Automotive Exports
Another positive result. US auto exports are up 140% in real terms, or 2.1% per year.
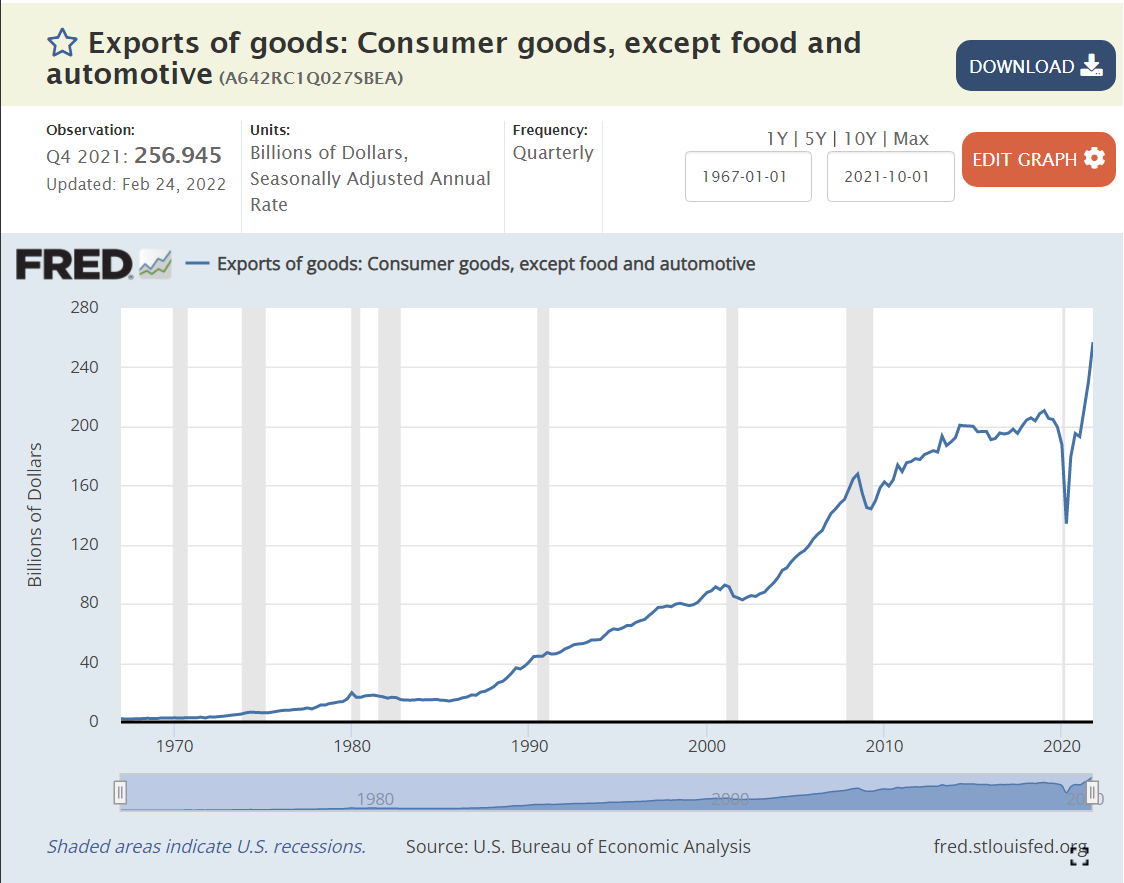
Consumer Goods Exports
Miscellaneous consumer goods exports increased by 340% or 3.6% annually, an amazing performance!
Services Exports
US services exports grew by 350% in these 4 decades, by 3.7% annually. The US is very competitive in the “most competitive” areas of international trade.
Summary
The US economy continues to increase its internationally competitive real exports at a rate of 2.5% per year in the long-term. The US is very well positioned to prosper in an era of increased global and free trade.
Hotel capacity increased by 50% from 1995 to 2019.
Demand grew at the same 50% rate, although not always in lockstep.
Occupancy averaged a healthy 63% (almost two-thirds) through this period, with significant differences due to changes in construction and the economy.
The price per room averaged about $125 per night in real 2020 dollars, again varying based on supply and demand, but overall, relatively constant.
Total hotel industry real revenue ($2020) for the 21 years from 1998 through 2019 increased by a little less than 50% according to Bureau of Economic Analysis (BEA) figures.
Real consumer only (leisure) sales increased by nearly 100% during this period.
Real consumer sales per person increased by about two-thirds.
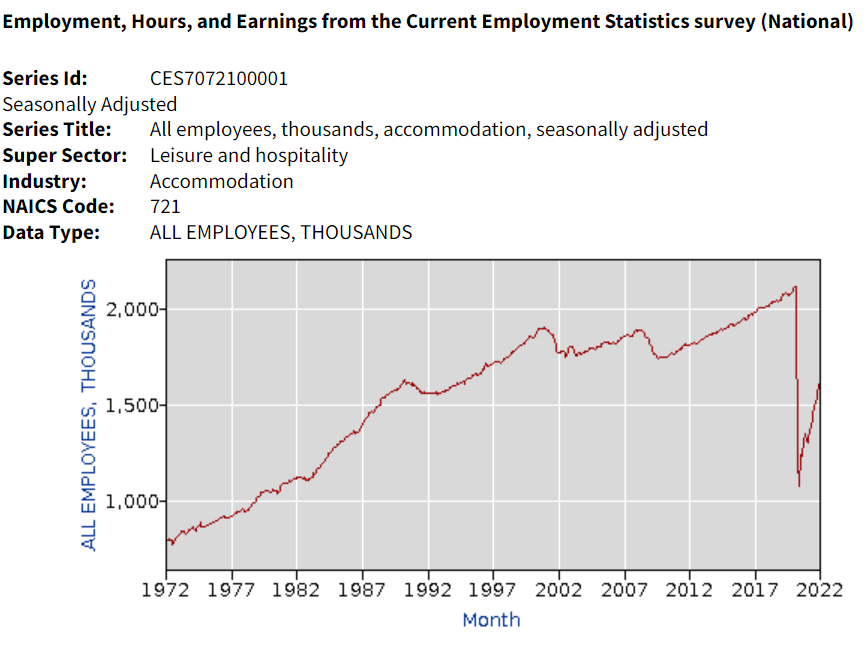
Hotel industry operating statistics before 1995 are not readily available. The tremendous growth of the industry in the last 30 years of the twentieth century is illustrated by the more than three-fold growth in industry employment, from one-half million to 1.8 million. Note that employment did not follow the growth of rooms during the first 20 years of the next century.
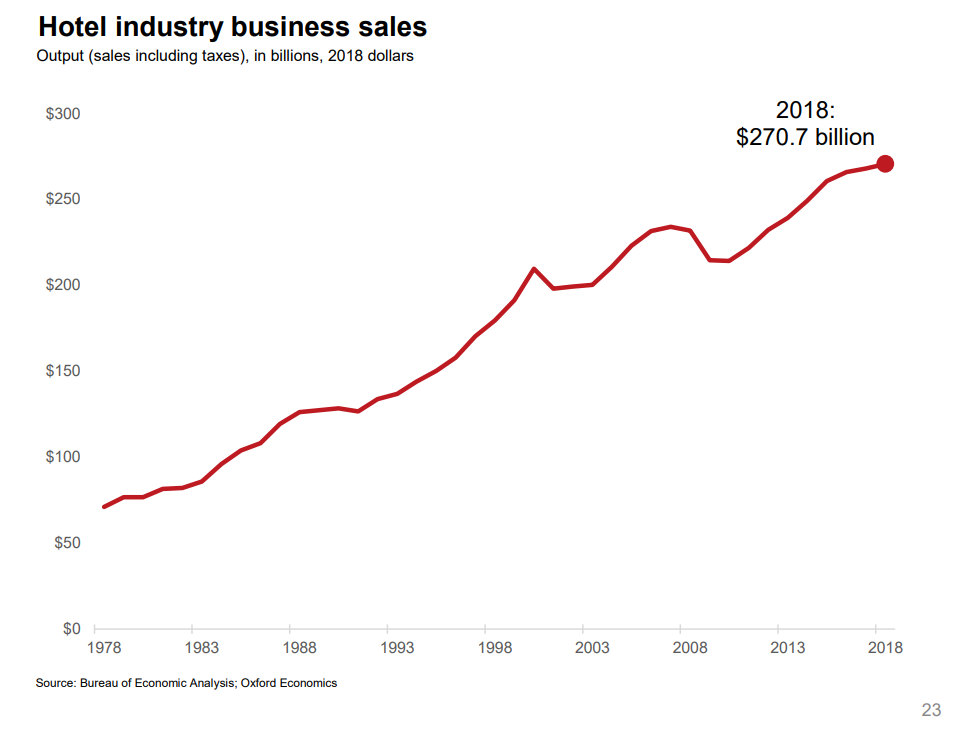
Oxford Economics developed an industry promotion brochure in 2019 that has some longer-term data. Total real (inflation adjusted) revenue is up more than 4 times in 40 years. Our 1995-2018 data shows relatively small changes in average hotel prices. I suspect that there were “real” increases from 1978 – 1995 as the industry was growing quickly in response to consumer demand.
A similar measure, gross domestic product (GDP), or production value added, net of the cost of inputs, increased 3-fold in 40 years.
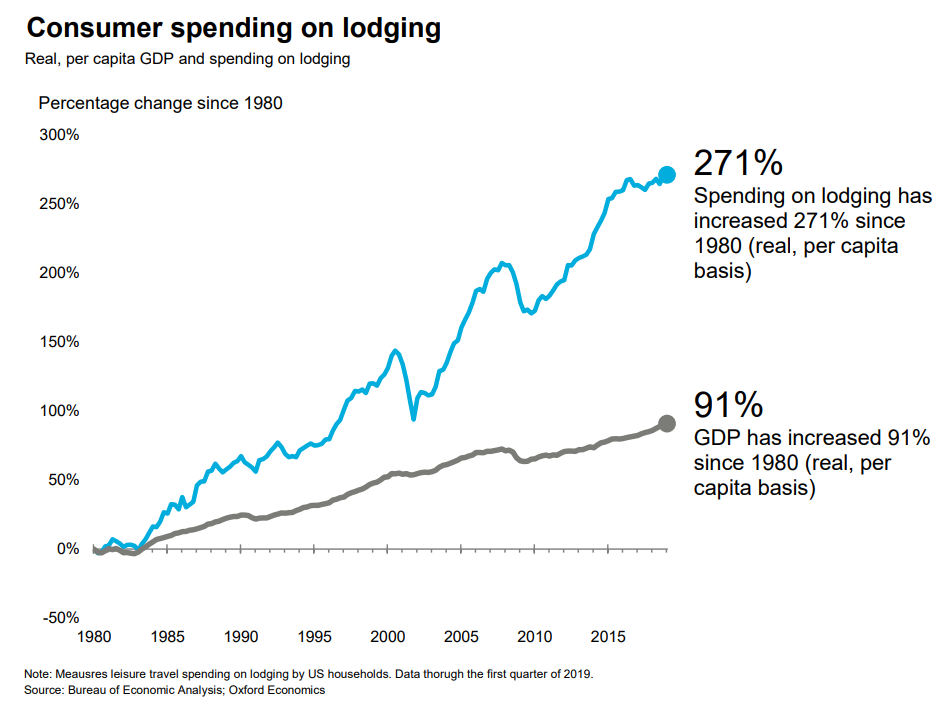
Consumer spending on accommodations has increased about 3 times as fast as GDP overall in the last 40 years.
Hotel purchases as a share of total consumer spending has increased by more than 80% in these 40 years.
Overall demand for hotel rooms per citizen for all uses (personal, business, government and foreign travelers) has increased by 20% across 30 years. Personal and foreign travel have grown at a faster rate.
The short-term rental market (personal vacation rentals, Airbnb) has grown from zero to 10% of the hotel room volume and appears to have years of growth ahead of it. This growth is not included in the industry summary figures.
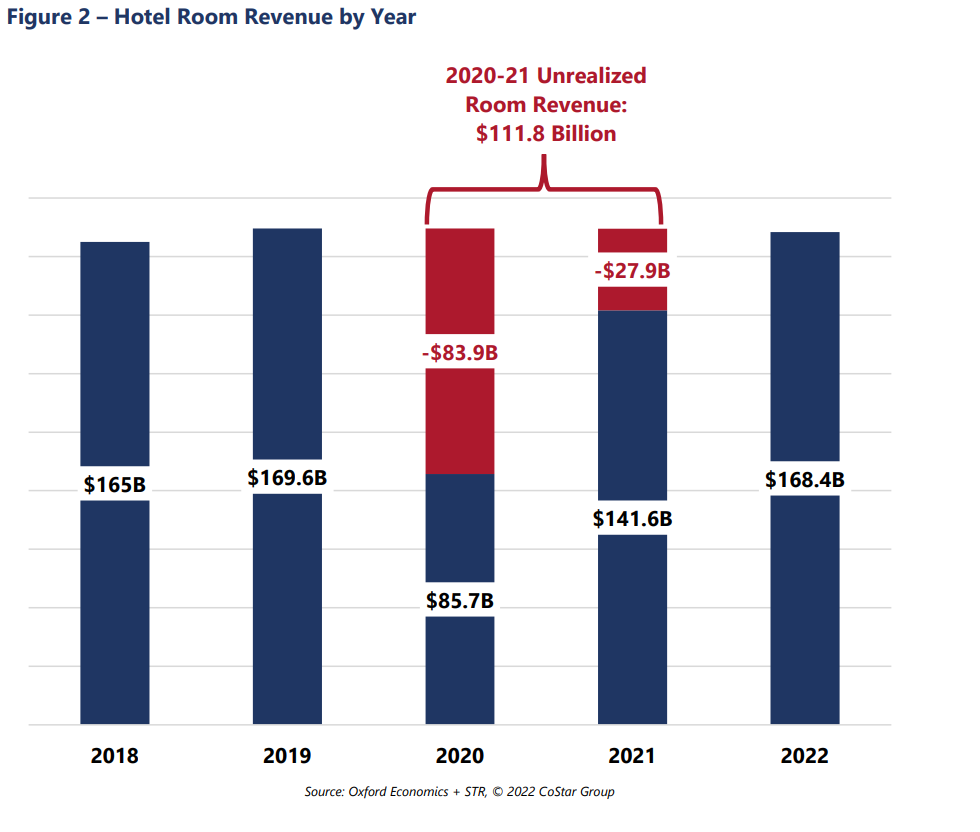
Occupancy is forecast to return to the historical average of 63% for 2022 and increase further in the following years. The industry “lost” more than $100B of revenues due to the pandemic, so analysts estimate that the industry will return to “normal” employment, prices, profitability and reserves by 2025.
Consumer access to hotels and private rentals has increased by 3 or 4 times in the last 50 years, at a faster rate in the first 25 years, and somewhat slower in the last 25 years. Hotel business models at 63% occupancy seem to justify continued capital investments in new supply. Prices have been relatively flat for 25 years. Competition between brands, pricing segments, corporations and private owners seem to be effective at providing adequate capacity and service options at competitive prices.