In the 2020 elections, Democrats once again earned a smaller share of votes than expected. Republican candidates in national, state and local election outperformed. Candidate Trump registered 74M votes, 11M more votes than in 2016. Americans were voting for the “real Trump”, not just the imagined populist candidate Trump. He earned 47.0%, up from 46.4%. Biden registered 81M votes, 15M more than Hillary’s performance. The Democratic share increased from 48.5% to 51.3%. A presidential win, a narrow House win and a very narrow Senate win.
“How can this be?” questioned the Democratic party leaders and supporters. “Where is our landslide victory?”
There was a higher voting percentage, which usually helps Democrats.
There were more registered and voting minorities, which always helps Democrats.
There were more young voters and fewer older voters, which helps Democrats.
The “special” negatives of Hillary as a candidate could not effect the results.
America is becoming less religious and less evangelical, which helps Democratic results.
Voter surveys show 60% plus support for many leading Democratic policies.
Despite the 2010 “Citizens United” Supreme Court case that eliminated restrictions on campaign contributions, Democrats raised money as effectively as Republicans.
Obama was able to win convincingly in 2008 and 2012 as a moderate Democrat, increasing the number of independents who would consider voting for Democrats at all levels.
Democrats deliver results on social, environmental, international, military and economic issues.
Like all political parties, Democrats “know we are right”.
Setting aside the “policy content” of the 2020 election for this article, Republicans had their own advantages in these elections.
The “megatrend” in the US and west continues to lean toward conservative politicians since the Reagan/Thatcher switch. There is great momentum in voting.
The U.S. Senate and electoral college provide an advantage to Republican leading states, adding 2-4% to the pure voting totals.
Republicans captured a greater share of state legislatures in 2010 and took advantage of this position to gerrymander state and national districts in their favor. At the national level, this adds 1-2% to the Republican House team.
The Republican supporting media (Fox) and talking heads continue to be more effective than the Democrats who are still “catching up.” Republicans have effectively undercut the legitimacy of the “mainstream media” for many, causing them to abandon centrist platforms and consume only Republican supporting sources.
The Republican advantage in the public policy “think tank” arena continues. See the article aggregators at RealClearPolitics or RealClearMarkets for samples of “policy pieces”. Left-leaning contributors from the academy, unions, not-for-profits, entertainment industry and Democratic party publish fewer articles and generally restrict their content to research articles.
Republicans continue to have an advantage in painting Democrats as extremists, socialists, communists, radicals, anarchists, irresponsible, anti-American, soft on crime, atheists, secularists, relativists, opportunists, special interest supporters, pinkos, big spenders, etc.
While Democrats always considered themselves “the party of the big tent”, Ronald Reagan was able to erect a tent which welcomed various somewhat incompatible streams of “conservativism”: philosophical, main street, wall street, religious, social, economic, libertarian, traditional, military and American. Republicans have leveraged this advantage, cooperating on “conservative” policies and ignoring those with conflicts.
Republicans since Newt Gingrich have effectively defined a very polarized world view. Democrats are the enemy. Party discipline is paramount. Results matter most. Insufficiently conservative or loyal reps have been chased from the party. This means that all Republicans vote for all Republican candidates in the general election. Any Republican is better than any Democrat.
Far left, new left, progressive Democrats take a different stance. They support progressive policies and candidates. They are not sure that a moderate, center-left Democrat is “better” than a Republican. They may not vote, cast a write-in ballot, or choose the libertarian or the socialist option. This costs mainstream Democratic candidates 1-4% of the general election vote. In Europe, they would have a party to vote for and the coalition building stage of a parliamentary government would give them influence, from time to time.
Republicans continue to win the framing and communications wars, better positioning their policies and candidates. Pro-choice versus pro-life. American versus globalist. Free market versus government control. States rights versus central government. Regulations versus necessary limits. Common man versus elites. Balanced budget versus deficit spending! US versus UN.
In recent years, Republicans have started to shape election laws to favor turnout from their supporters and discourage turnout from their opponents. This did not appear to have a major impact on the 2020 results, but could do so in the future.
“politics ain’t beanbag”.
Republicans have very effectively managed their political resources and campaigns in recent years. The Democratic demographic trends are simply not enough to assure wins in the short-run.
Historically, for more than 200 years, economists, conservatives, industrialists and western countries have supported free trade, based upon the theories of Smith and Ricardo. Free trade creates more valuable goods and services. Free trade provides opportunities. Free trade forces domestic firms to become more competitive. The losers from free trade can have their losses mitigated through enlightened government policies. Leftists and labor unions have opposed free trade because governments have not always provided those “enlightened” policies to offset the negative effects on workers and because far leftists cannot support any positive results from capitalism.
Conservatives in the west have generally supported free trade for these last two centuries. Western firms and their beneficial owners were positioned to benefit (on average) from free trade. Part of this was the justification for imperialism and economic extraction from “less developed countries”, but most advocates saw the local, corporate and global benefits of trade. Republican support of free trade has been consistent in the post WW II era. Most Republican policy wonks agree with their Democratic colleagues that the great depression was deepened and prolonged by anti-trade legislation in the US and elsewhere.
Economists of mainstream political views tend to support “free trade” as a government policy which can provide benefits for countries and the global economy.
The free trade position has been opposed in the last 200 years by many. Leftists and less developed countries see this as gloss to justify exploitation. Marxists oppose capitalism. Labor sees the negative impact on domestic wages. Environmentalists see trade as a way to export pollution. Anti-globalization advocates see trade as a way to provide power to multinational corporations, so oppose it. Supporters of “less developed countries” argue that pure free trade unfairly prevents firms from developing. Incumbent firms argue that competitors have “unfair” advantages, including government support, that must be offset.
While the “science” and “interests” of free trade may be clear, the “politics” is less clear. In a simple, win/lose, Manichean view, evil foreigners attempt to defeat good domestic firms and their employees. Populist politicians of both left and right views are tempted to tap this voting block.
As with many modern public policy issues, there is a professionally supported position (pro, with some limits or compensations). However, the gap between the relatively complex analysis (comparative advantage, history, statistics) required to support these conclusions and votes is wide and used by politicians to frame and tell stories in their best interest, not the interest of the nation or its citizens.
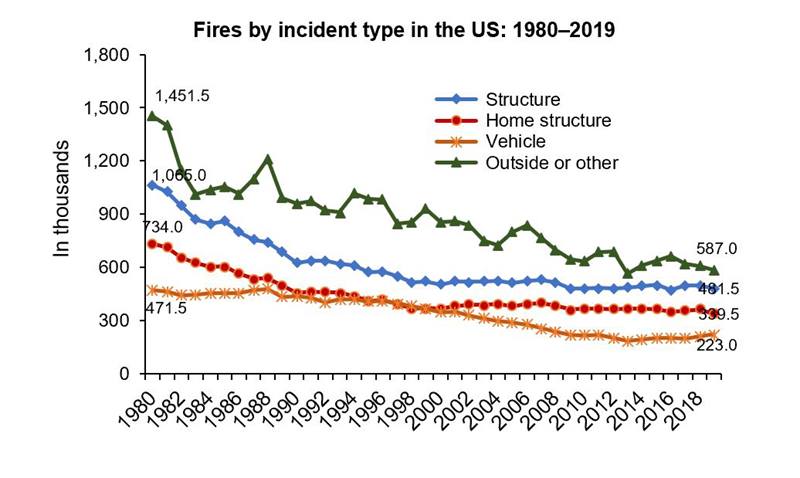
As with most well-defined problems and risks, the incidence or occurrence of fires has declined through time. In the last 40 years, the incident rate has been cut in half for outside, structure and vehicle fires. The US population grew by 45%, from 227M to 330M during this period. Hence, the incident rate per person declined by 70%.
Fire deaths have been cut in half over the last 50 years. The population has increased by 47%. The number of fire deaths per million has decreased by two-thirds, from 34 to just 11.
While the incident and deaths figures show a clear pattern of significant decline from 1980 to 2010, with relative stability from 2010 to 2020, the real cost of fires per person has much greater annual variability and a less certain trend in the last 20 years. Using 1990-2016 as the time period, the trend is clearly downward, from $90 to $80 per person per year. Adding the last 3 years, with their higher costs, the trend line moves upward from $80 to $100 per person per year.
Overall, the cost of fires per person is flat in the last 20 years, even though the outside incident rate has declined by one-third, the vehicle fire rate has declined by one-third and the structure rate has declined by 10%. Clearly, structure fires have the greatest weight on the cost measure. The unusually high costs in the last 3 years must be driven by a greater number of very high cost incidents.
Total Federal Government employment has ranged from 4-5 million across the last 65 years, from 1955, when post WW II changes were in effect until today, 2020.
While Federal Government jobs have been flat to down 20%, the U.S. population has doubled, from 166 million to 331 million people.
Hence, the ratio of federal jobs to population has dropped from 3.1% in 1955, or 2.6% in 1960-1965 to just 1.25% in 2020. The much maligned and mistrusted federal government is less than half as large, in relative terms, as it was from 1955-1965.
The detailed components are somewhat complex. The judicial and legislative branches have employed a relatively immaterial 30,000 to 66,000 during this time, doubling with the population.
The Executive Branch includes both the Department of Defense and other civilian agencies. It does not include active military employees. It typically does not include the postal service (USPS), which is seen as a truly independent agency. The Executive Branch started with 1.860 M employees and ended with 2.206 M in 2020. The low was 1.778 M in 2000 and the high was 2.252 M in 1990. In rough terms, flat employment for 65 years. As a percentage of the population, it has ranged from 1.12% to 0.65%, declining throughout the period.
The postal service started with 367,000 in 1955, grew to 761,000 in 1990, flattened out for 1995-2000, before declining to 492,000 in 2015 and 496,000 in 2020. So, we have a doubling in the first 45 years, adding 400,000 staff, followed by a reduction of one-quarter million in the last 20 years. As a percentage of the population, it grew from 0.22% to 0.30%, before declining to 0.15% in 2015-2020.
Combining the executive, legislative, judicial and postal branches, we get a subtotal that excludes the active military category. This is what most people think of as “federal” employees. This started at 2.3 M in 1955, grew to 3.1 M in 1990 before settling down a bit to 2.8 M in 2020. As a percentage of the population, it began at 1.36% and ended at 0.84%. This is a 38% reduction, removing more than 0.5% of the population from government employment.
The active military population has declined from 2.9M in 1955 and 3.1M in 1970 (Vietnam winding down) to 1.4M in 2000 (peace dividend), where it has remained. As a percentage of the population, this function declined from 1.77% in 1955 to 0.99% in 1975 to 0.49% in 2000 to 0.42% today. This is a 3/4ths reduction. moving 1.25% of the population out of military service.
The “Total” column shows the 5.2M start and 4.2M end. The percent of population falls from 3.13% down to 1.25%. The Federal Government is a much smaller employer today than in the “post-war” era.
The next column combines the Department of Defense in the Executive Branch with the active military to give a total military. This does not include the Veterans Affairs or Department of Homeland Security which serve quasi-military functions. We start with 4.1M in 1955, touch 4.3M in 1970, fall to 3.2M in 1975 and 2.0M in 2000, ending at 2.1M in 2020. The percentage of populations falls from 2.5% down to 0.6%.
The remaining federal employees began with 1.1 M in 1955 and grew fairly constantly to 2.0M in 1990, remaining flat for the next 30 years, ending at 2.05M in 2020. As a percentage of the population, this measure started at 0.64%, peaked at 0.82% in 1990 and has since declined to 0.62%, just below where it started.
After the Clinton/congress budget compromises in the mid-1990’s, criticism of the size and growth of Federal employment quieted down for the next 2 decades. Some criticism has restarted, as Federal agencies have increased the amount and variety of outsourcing employed through contracting and grants. The main summary shows that “contract” employees, those who work directly on Federal contracts, have been in the 3-5 million range since 1985. It reports that grant funded employees have been 1-2 million per year. The total is 4-7 million, the same order of magnitude as “regular” federal employment. I was unable to find comparable numbers for the 1955-1980 timeframe, so cannot be sure that this category has grown faster than the U.S. population. My guess is that there is some degree of “employee shifting” from regular to contracted employment. A subset of this is probably politically motivated, to please congressional oversight committees. On the other hand, corporate America discovered outsourcing to foreign factories and specialized firms in the 1980’s and probably moved 15-25% of jobs out of the Fortune 500. At one point, firms like GM and AT&T had 1 million employees.
STEM degrees awarded at the bachelors, masters and doctoral level continue to increase in response to market demands from 2011 to 2019, increasing by 54% in total and by 45% for U.S. residents. Most of the increase has been at the bachelors level, from 255,000 to 379,000 degrees (+49%). Masters degrees have increased from 53,000 to 72,000 (+36%). Doctoral degrees have increased from 14,000 to 17,000 (21%).
African-American degree earners have increased by 46%. Hispanic Americans have increased by 137%. Asian-Americans have increased by 57%. White Americans have increased by 28%, from 224,000 to 287,000 (+63,000).
US resident male degree earners increased from 210,000 to 297,000 (41%). Female degree earners increased from 112,000 to 171,000 (52%).
By contrast, the US population increased by just 5% during this period, from 312M to 329M.
I don’t find many news stories highlighting this very good news. In a world that requires technological innovation, application, maintenance and understanding, the US is quickly increasing the number of graduates with these skills. Women and minorities are increasing their relative share of the graduates in these subject areas, which historically have been well paid.
There is room for improvement. Women and minorities are still underrepresented. They graduate at lower rates than white whites. Non-residents earn a significant (19%) share of US degrees awarded.
Bottom line: US residents are earning about one-half million STEM degrees each year. This is double the one-quarter million degrees awarded in 2000. Note that compounding of 31% and 54% growth yields 102% total growth, not just 85% (a core STEM skill).
Since WWII, the US has increased college graduation rates overall 5-fold, from 6-8% to 39%. We now graduate 2 out of 5 individuals. We used to graduate 1 in 12 to 1 in 16.
Graduation rates have increased every decade, including a 7% increase, from 32% to 39% between 2010-2020. That increase is equal to the total college graduation rate after WWII!
Male graduation rates have increased more than 4-fold, from 7-10% to 35%.
Female graduation rates have increased 8-fold, from 5-6% to 44%.
African-Americans have increased their graduation rates 10-fold, from 2-3% to 28%. From 1 in 40 college graduates to 1 in 4.
Hispanic Americans were not tracked separately in the first 4 decades, but they have tripled from 8% to 25% in the last 40 years.
Critics can challenge the modern value/difficulty of a degree versus those after WWII. They can highlight the “pause” in 1980-1990 when degree attainment barely rose. They can note that male graduation rates paused from 1980-1990 and then again from 2000-2010. They can observe that men earned twice as many degrees in 1950-60, before being exceeded by women by 2000 and exceeded by 9% points, 44% to 35% (25% advantage) in 2020. They can point to the very rapid increase in degree attainment between 2010-2020 being suspiciously high. They can bemoan imperfect 4-year or 6-year graduation rates. They can note the financial challenges faced by college students, especially those with lower incomes or first generation attendance status.
However, even assuming that some good portion of these criticisms are appropriate and relevant, the overall results are clear. The U.S. is educating far more residents at a college graduation level. Men and women are benefitting. Minorities are improving their performance and have better access to higher education. Overall, this makes for a fairer society. It improves our ability to run a democratic form of government. It makes us a more economically competitive and creative society. Ideally, it allows more individuals to pursue their dreams, take advantage of their talents and contribute to the community.
James Carville once tried to greatly simplify American politics. I’m going to take a longer term view, back to the 1940’s, using the Gallup Poll’s “Most Important Problem” surveys. He’s only partly right, IMHO.
For 1948-83, I’ll use the top problem from each year to greatly simplify the analysis.
In the Cold War period (1948-62), the economy was most important 3/14 years (20%). International affairs, aid, war, peace, nuclear attacks, etc. held the top spot for 10/14 years (70%). Race was the leading issue in 1956 (tied).
From 1963-72, Vietnam, War and Peace dominated in 7/11 years (63%). Race was the biggest issue in 2 years (18%). Crime/violence first became a leading issue in 1968. Ethics, morality and families also first became a top issue in 1968.
Through the transitional 11 years of 1973-83 (Nixon, Ford, Carter, early Reagan), the economy scored 22 of the 23 votes. The “environment” in 1974 was the sole outlier. Foreign affairs scored zero after its 25 year reign. Inflation was the largest economic issue, as “stagflation”, supply chain disruptions, gas shortages and oil prices pinched.
Inflation placed in 2 of the next 4 years as an issue, but was a relatively unimportant factor thereafter, registering in just 7 of the next 32 years (23%).
In these first 35 years, the economy and international affairs were each half of the high visibility topics. Domestic affairs were a minor focus, aside from the issue of race, racism and race relations. The counterculture of the 1960’s and the reaction against it would have a greater impact later.
For the next 36 years, I’ll use a hybrid measure for important problems. Issues which were either in the “top 4” for the year or which claimed the attention of at least 10% of the respondents are recorded as important.
In this timeframe, economic issues wax and wane in importance, but overall they account for 42% of all topics. Economic topics at the end of senior Bush/Clinton were 70% of all responses. They declined in Clinton times to 40% and eventually just 20%. Economic worries increased to 40% in early junior Bush times, but declined to just 20% by the end of his tenure. Obama presided over the Great Recession, with 70% of economic topics ascendant, slowly declining to 30%. Trump inherited a healthy economy, with only 15% of those surveyed considering it a top issue.
In the late Reagan period (1984-88), the economy remains the primary focus with 2/3rds of the votes (14/22). The budget deficit/government spending becomes a priority, recognized in each of the 5 years as a highly important issue. Federal government budget deficits exceeded 3% of GDP for the first time since WWII in the Reagan presidency and remained at this level for a decade until a Clinton/congressional compromise returned it briefly to break-even.
International issues remained visible in Reagan times, with 5/22 votes (23%). With the end of the “Cold War” we have a dozen years with no priority international issues.
The first “emerging” domestic issue in the Reagan years was “drugs”. It was a priority for 3 of those 5 years (15%) and 6 of the next 12 years (10%). Democrats, some then and many now, claim that this was a veiled racist signal. Republicans, as in Prohibition, pointed to the direct negative impact on individuals and the collateral damage to others. Americans, in general, believed that “drugs” were a significant social problem for many decades, increasing with the more recent “opioid crisis”.
The Bush Sr years showed 50% attention (8/16) to economic issues: jobs, budget and overall. Drugs remained a major focus in 1989-92. Poverty became a material issue at this time, scoring a top rating in all 4 years and in 5 of the next 8 Clinton years. This generally Democratic favorable issue expired in the 90’s after “welfare reform” without major policy implications.
During Clinton times, economic issues were just one-third of the total (14/45). Foreign policy issues were non-existent. This created a vacuum for policy wonks and spinners to guide the public. Republicans clearly won this battle. The “war on drugs” continued, with moderate Democrats supporting additional measures. The “war on crime” was a top issue in 7/8 Clinton years. Again, Democrats pointed to veiled racism, while Republicans leveraged the statistics.
The “culture wars” began in earnest, with “ethics, morality and family values” becoming a priority issue in 4 of the 8 Clinton years, highlighted by his impeachment on moral issues.
Secondary education quality became a national political issue. The 1983 study of “A Nation at Risk” highlighted the shortcomings of the decentralized US public education system. Although Republicans sought to eliminate the national Department of Education, they effectively criticized the American public education “system” as inadequate, captured by unions and in need of a competitive challenge through vouchers. President Clinton could not dodge the challenge and made improving the education system a priority. President W Bush followed in his footsteps.
Clinton presided over the consolidation of American superpower status, the expansion of Republican promoted free trade, balanced budgets and the embrace of the capitalist market system (The third way). This was not seen as a Democratic win or compromise, but an opportunity to focus on domestic policy issues, by wise Republican strategists at the national level.
Clinton also attempted to deliver some form of national health care. He failed. But, this was a top policy issue in 4 of his 8 years. It continued to be an issue in the W Bush years, even though no solution was proffered. The basic criticism of “national government” (think Spiro Agnew) re-emerged in the Clinton years, earning priority status in 2 of his 8 years in office.
9/11 changed the world. In W Bush years, the economy ranked a top priority in one-third of minds (12/32). Terrorism and war in the Middle East was of the same magnitude (12/32). Crime, ethics, education and government became less important. Health care remained a priority (3/32) even though no “solution” was found.
In the Obama years, economic issues were rightfully the priority, earning two-thirds of the votes (19/30). The Republican driven “culture” issues were not as highly visible in this period. Health care was a priority issue, and continued to be so through the Trump years as Republicans fought to reverse this legislation.
The legitimacy/illegitimacy of the national government began as a criticism of the Clinton years. This faded in the W Bush years, but came roaring back for 8/8 of the Obama years. Once again, Democrats pointed to racism, while Republicans increasingly criticized the basic validity of national government decisions that restricted individual choice.
Trump inherited a solid economy and a world with fewer major active conflicts. Economic and foreign policy issues were not a priority. Traditional Republican “culture wars” issues were also less important to the public. Trump was able to raise immigration and trade to the status of important subjects. Health care remained an issue for 1 year with the failed attempt to unseat Obamacare and 1 year of Covid. Race became a priority issue for 4/4 Trump years. “Unifying the country” earned a top 4 spot in the last 2 years. Criticism of “the government” continued as a top 4 issue in all 4 years of the Trump presidency.
Across 70 years, the economy accounts for 44% of the votes. International affairs account for one-sixth of the votes. Domestic policy issues account for 40% of the total. Republicans were more effective at framing public thoughts, guiding their preferred domestic policy issues to be 25% of the total.
Most Important Problems: By Presidency and Category
There is significant politics and complex statistics in this subject area, but the basic outcomes are clear cut and positive.
High school graduation rates in the US increased throughout much of the 20th century. 1910: 10%. 1930: 30%. 1950: 60%. 1960: 70%. 1970: peak 75%. Then, graduation rates held steady or declined for the next 30 years! Various explanations are offered: increased graduation requirements, less effective educators, social challenges, mix of students.
The gold standard is the data from the National Center for Educational Statistics (NCES). We have 5 different measures. The first 3 provide 1977-2017 comparisons.
Annual dropout events have declined from 7% to 5%. They reached a minimum of less than 4% in 2007 before increasing. White dropouts declined from 6% to 4%. Black dropouts declined from 10% to 5%. Hispanic dropouts declined from 10% to 6%.
The dropout status of 16-24 year-olds collectively declined from 14% to 6% overall. Whites dropped from 12% to 5%. Blacks declined from 20% to 6%. Hispanics fell from 33% to 10%.
The percentage of 18-24 year olds who had completed high school (or GED) increased from 84% to 93%. Whites rose from 87-95%. Blacks rocketed from 74-94%. Hispanics rocketed from 59-88%.
The “adjusted graduation rate” measures on-time graduation. From 2010 to 2016 it shows overall improvement from 79% to 85%.
The “freshman graduation rate” measures on-time attainment of a regular diploma. It shows improvement from 71% in 1995-98 to 82% in 2012.
At the international comparison level, the US has improved from 18th of 21 OECD (advanced) economies in 2006 with a 75% graduation rate versus 81% average to 9th of 35 in 2018 with an 86% graduation rate versus the 81% average.
From Sputnik to “A Nation at Risk” to “No Child Left Behind”, the US has become relatively more effective at setting goals, measuring progress and adjusting educational strategies and tactics. Some groups essentially act as gadflies, pressuring politicians, educators, administrators and boards to improve.
These policy groups have become effective at identifying groups that are not meeting the goals and offering recommendations for improvements. For example, they were able to identify a relatively small number of schools that accounted for a majority of non-graduates (Pareto principle). The pejorative term “drop out factories” was applied to schools with graduation rates below 60%. A tail of low performing schools remains (for various reasons), but many low performing schools were closed or greatly improved in the last 25 years.
The leading group is termed “America’s Promise”. It has focused efforts on reaching a 90% graduation rate for every state, school and subgroup by 2020. Through the latest report from 2018, that goal has not been achieved, but solid progress has been documented. Graduation rates reached 85%, with 14 straight years of improvement. Between 2011-18 Black grad rates improved from 67-79%. Hispanic grad rates improved from 71-81%. Low income grad rates improved from 70-80%. Individual state scores demonstrated that even higher rates were pragmatically possible for all groups. In 2017, 2 states reached the 90% level. In 2018, 7 states met the target. They were from all corners of the country: Iowa, Texas, Alabama, New Jersey, Kentucky, Tennessee and West Virginia. This group noted that 7% of students in 11% of high schools accounted for 28% of non-grads. It also noted that 10 states account for 56% on non-grads. It outlined specific recommendations for continued improvement.
The post 1999, “No Child Left Behind” progress is questioned by some sources. They claim that increased accountability has lead educators and administrators to simply work the system by changing graduation requirements or fudging tests. Statistical reviews of state performance discounts the effect of these alleged activities.
Two measures of educational performance (NAEP and PISA) focus on elementary and middle school results so they cannot be used to confirm or dispute the high school graduation improvements.
College admissions of a greater percentage of high school grads supports the positive results.
College remediation requirements remain high, but no clear increasing trend has been documented.
SAT scores have not significantly changed during the last 40 years (math up and reading down).
US high school graduation rates improved from 10% to 70% between 1910 and 1970. They remained the same for 30 years as requirements were increased to meet the obvious challenges of a more competitive world (Sputnik, Japan, Asia, EU). Graduation rates have increased consistently for the last 20 years, mainly through improvements at the lowest performing schools. These improvements have slowed in the last decade, but progress continues to be made.
U.S. charitable giving to GDP ratio is 1.44%. Canada is second at 0.77%. UK is third at .54%. Italy at 0.3% is representative of Europe. U.S. giving is 5 times as high as other developed countries. (Table 27). U.S. private overseas aid is $44B. UK is second at $5B. (Table 25).
The World Giving Index has consistently rated the U.S. as the most generous country of 125 reviewed. Across 2010-19, US is 3rd highest percentage of those surveyed reporting they had “helped a stranger in the last year” at 72% compared with 48% global average. US was 5th highest with 42% reporting they had volunteered time for a charity in the past year versus 20% global average. US was 11th highest in percent reporting monetary donations in the last year (61%), versus global average of 30%.
In general, total US charitable giving has grown on a per capita or percent of GDP basis for more than 50 years. There is a clear “step up” in giving in the late 1990’s. Real (inflation adjusted) per capita giving has nearly doubled from representative $600 in 1970’s to $1,100 in 2000’s. (table 1). The US nonprofit sector reflects that growth, even though program fees are a much larger share of revenues, rising from less than 2% of GDP in the 1930’s-50’s to 3% in the 1970’s to more than 5% by the 2010’s. (table 6).
Total US charitable donations as a share of disposable income ratio has averaged roughly 2% across the last 40 years. Charitable giving as a percent of GDP averaged 1.7% in the 80’s and early 90’s, before increasing to 2.1% in the “oughts” and teens.
The most widely reported figure shows total real (inflation adjusted) US charitable giving since 1979. This has increased together with real US GDP. Representative years and amounts: 1982 ($150B), 1992 ($194), 2002 ($317), 2012 ($355) and 2019 ($450B).
Giving by individuals has fallen from 80% to 70% of the total. Bequests have increased from 7-8%. Foundation giving has more than doubled as a share of the total, from 7 to 16%. Hence, the real individual giving numbers are solid and rising, but their growth rate has slowed through time. 1982 ($130B), 1992 ($160), 2002 ($250), 2012 ($250), 2019 ($310).
While the total and individual charitable donation amounts have increased, the percentage of individuals donating has declined significantly. Years, percentages and average donation. 2002: 67%, $2,000. 2008: 65%, $2,300. 2012: 59%, $2,400. 2016: 53%, $2,500. Various authors speculate that the decline is caused by increasing inequality, lower confidence in institutions and changes in tax deduction laws.
In the early 2010’s there was a significant decrease in charitable giving percentages by non-itemizers (10%) and a much smaller decrease by itemizers (5%).
There are various reports that break down giving rates by state, city, religion, politics, region, marital status, generation and income. Perhaps most important is that the decrease in the giving percent from 67% to 53% means that the percentage giving zero, and dragging down the average, has increased from 33% to 47% of the population, from one-third to nearly one-half.
More than 90% of individuals with income above $125K donate to charity. 77% of those with incomes of $50-125K donate. This drops off to 58% at the $25-50K range and 37% under $25K (graph 11).
One source indicates that actual 2020 giving increased by 5%, with 1% more people making donations. This report also indicated that 23% of affluent donors increased their contributions to local projects and increased their unrestricted contributions.
Another source indicates that 2020 donations were up by 11% and the number of donors was up by 7%. They reported a 15% increase in small donations (<$250), an 8% increase in medium-sized donations and a 10% increase in large donation ($1,000+).
The US has a solid track record of individual charity. Donations have risen in real terms through time. Americans support nonprofits through cash and time donations. The decline in the percentage of individuals making donations is a concern. The “one-time” tax deduction for non-itemizing filers may help to spur increased contribution habits.