The US population has doubled from 1960-2020, so the share of new lawyers remains roughly at the same percentage, despite the greatly increased complexity of modern business, communications, intellectual property and society. This ratio is now way down from the 2000’s when it was unusually elevated.
Supply and demand drove lower salaries and higher unemployment after 2010.
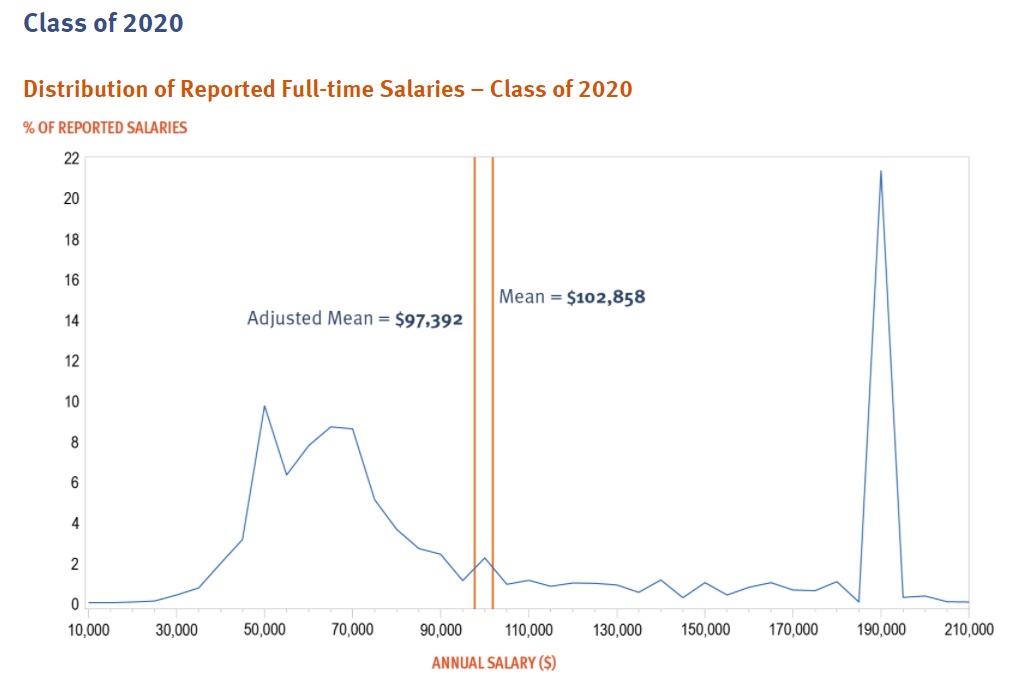
Starting salaries at major law firms have always been attractive to undergraduates. The distribution of starting salaries shows that the legal profession is divided between those in the top one-fourth and all of the rest. The median starting salary at $100K for 7 years of college education looks more like an engineer, pharmacist, actuary, data scientist, financial analyst or market researcher than a world changing persuader.
The percentage of US congress reps with a legal background has declined decade after decade.
Lawyers occupy 9% of CEO roles; far less than their MBA competitors.
The highest skilled lawyers remain in high demand in the US, earning $120-180K for starting salaries. They are typically not “changing the world”. But, they are helping the owners of great wealth to maintain and improve their positions. As an accountant, engaged to measure and advise, I appreciate this value-added role in society.
At the turn of the century (1900), there were about 2,000 brewers in the US, serving it’s 75M residents. In 1940, following prohibition, there were 750 breweries serving the nation’s 130M residents. By 1960, the population has grown to 180M, but the number of breweries had fallen to just 200. By 1980 the number of breweries had dropped to 100, while the population had reached 225M. Each brewery served 40,000 people, then 200,000 people, then 1M, then 2M. The ratio increased 50 fold! (this is a negative result, less variety and options)
In 1978, Congress passed a law that allowed “home brewing” without punitive excise taxes.
Between 1986 and 1996, the number of active breweries increased ten-fold to 1,000, exceeding the number producing in 1940.
By 1998, the brewery count reached 1,500 and plateaued for the next decade through 2008.
The following decade showed a 3-fold growth in active breweries, exceeding 5,000, a record high above the 4,000 level of the 1870’s. The new ratio of people to breweries is 70,000 to 1, twice as high as the turn of the century (1900), but 20 times better than 1980.
I served as a residence hall director at a small college in Cleveland from 1979-82. We held blind-folded beer tastings. Of a dozen “remaining” brews, the legally eligible students could only reliably identify Strohs, with its “fire-brewed” sulphur smell.
Coors was considered a very premium beer. Genessee Cream Ale from upstate NY was a good option. Old Milwaukee was an acceptable brew. Duquesne Beer from Pittsburgh was solid. Iroquois Beer from Buffalo was acceptable. POC, “pilsener on call” or “piss on Cleveland” was the bottom of the barrel, except for “Heritage House”, a private label brand at Fisher-Fazio-Costa supermarkets, which was the very lowest. Chicago’s Old Style was available, but not so special.
It’s difficult to illustrate the tremendous change in available options between 1980 and 2020, but one way is to focus on just one American city, Chicago.
Goose Island, 3 Floyds, Revolution Brewing and Two Brothers garner 10 of the 15 Chicago best. 5 others warrant acclaim.
I’ve been flying for business and pleasure for more than 40 years. I’d like to share some of my favorite domestic and international airports.
Cleveland Burke Lakefront: steps from downtown; my boss Ron Diderich used to fly here daily from DTW in 1982.
Sarasota: My first landing in 1974; so much busier today where Sue and I have our winter home.
Indy Exec Airport. I served on the local airport board for 8 years.
Boston Logan is a major NE hub with an ocean approach which I first experienced landing in 1975.
Mackinac Island is a small airport with varied service.
Chicago Midway Airport
Chicago’s Midway Airport is a Southwest hub and used to be a hub for Indy’s American TransAir (ATA). The airport is in a 1 x 1 mile block in Chicago with a very short 5,200 foot long main runway.
New York is a huge US hub; enjoy a Newark approach.
Maui (’nuff said).
Key West; Another Island Paradise
San Diego; more exciting landing than expected.
San Francisco; I observed this approach from the front seat in 1998.
Washington, DC: Reagan. The greatest mainstream US airport approach, every time.
Aspen, CO. A mountain approach and a very exciting takeoff.
Tokyo.
Nice, France.
Old Hong Kong Airport (I first experienced in 1997).
There are few policy choices that have 90-95% positive results compared with 5-10% negative results. Cutting international trade tariffs is one of those “rare birds”.
President Trump “delivered” on his 2016 campaign promises regarding trade deals. He unilaterally increased tariffs on imported aluminum, steel and manufactured goods from China and the rest of the world, including our trade and military allies. As with most “trade killers” (which used to be a minority Democratic party position), he claimed that this would save or restore American jobs. As usual, it had no measurable positive effect. He also claimed that this would lead to a renaissance in American manufacturing. Didn’t happen. He claimed that these actions would make America more self-sufficient in critical military and economic areas. Didn’t happen. Note pandemic issues. Finally, he claimed that these actions would form the basis for “new and improved” trade deals to replace the “awful” deals negotiated by Democrats and Republicans alike for 70 years in the post- WWII era. NAFTA 2 was concluded with minor changes. Small China commitments were obtained to buy things China wanted to buy. But, mostly the response was “HUGE” retaliatory tariffs from China and our allies.
The “root cause” of the failed results in this situation, and in most other trade fights, is a logical / intellectual error. Proponents of trade restrictions believe that bilateral trade negotiations are a simple “win/lose” game. A real estate deal is a simple “win/lose” game. Bilateral trade deals are more complex. There are many winners and losers in both countries, some direct and some indirect. Higher tariffs or trade restrictions benefit the importing country’s manufacturers and their employees. However, these tariffs typically result in much higher prices for the importing country’s consumers, so the net effect for the importing country is negative. Unfortunately, bilateral trade deals or actions often don’t even help the importing country’s producers. Whatever country is “next most” competitive takes the place of the target country which has been made less competitive by the new tariffs. In the case where a country holds a large share of the global market, neither the “next best” country, nor the domestic producers benefit. The “target” country has such a strong competitive, cost, price advantage that even with added tariffs they are the preferred supplier. This is a very disappointing result for those who wish to take direct action to “save jobs”, but global markets truly matter.
Columnists, journalists and politicians say that Joe can’t reverse the tariffs for political reasons. The American voting public is too unsophisticated to understand complex trade logic. Given Trump’s framing of his actions, this will look like a capitulation to China. The progressive left doesn’t believe in “free” international trade, which undercuts worker’s pay and the environment. American “labor” is a required part of the Democratic Party coalition and opposes “free” trade. Consumers do not link tariffs to goods inflation. American business and agriculture are fully committed to the Republican Party, so will not repay beneficial actions.
The American people elect leaders (of either party) to lead. Step up. The benefits of “free trade” are well known, well documented and supported by 90% of professional economists of both parties. Assign Kamala Harris, Pette Buttigieg and Jared Kushner (just kidding) to develop the communications plan for this policy decision.
The American People Benefit Directly: Taxes, Inflation and Jobs
Tariffs are simply taxes with a longer name. Exporters pay a small share, less than one-third of the total. Importing firms pay a slightly larger share, again less than one-third of the total. Consumers typically pay more than one-half of the tariffs in the form of higher prices. This is a tax, plain and simple. Estimates of the taxes paid by Americans for the Trump Tariffs range from $50-80B.
Tariffs provide importers with an excuse, reason, justification to increase prices. This is contributing to the current round of inflation at a level last seen in the 1980s. American consumers are paying $700 annually for these taxes.
Tariffs are imposed to “save jobs”, but the “indirect” impact is usually larger than the “direct” impact. Domestic manufacturers who use imported products find their costs to be higher and some become uncompetitive. Domestic retailers who now sell more expensive products find their sales lower and reduce their work force accordingly. Target countries impose retaliatory tariffs on domestic export products. This is the main source of job losses. The Trump Tariffs are estimated to have cost Americans 250,000 jobs.
Make American Businesses More Competitive Globally
American businesses pay one-fifth to one-third of the $80B of annual tariffs imposed. This drops straight to the bottom-line. Reduced profits result in reduced capital investments, R&D, product innovation and new markets.
Tariff administration has an overhead cost and it distracts supply chain, logistics and international trade staff from higher value added work.
Tariffs require profit-maximizing firms to accelerate their consideration of import sourcing and domestic production options. Some of this has a minor impact. Some of this activity displaces other higher value-added sourcing projects.
One estimate indicated that 8% of stock market value was destroyed by the Trump Tariffs.
Sharply higher tariffs disrupt existing supply chain relationships and remove some sources as economically feasible sources. In a time of supply chain challenges, tariff make a bad situation even worse.
Farmers were most negatively impacted by the Trump Tariffs. Trump provided temporary subsidies to offset some of the pain, but farmers complained that they were seeing decades old trade lanes being permanently disrupted. Reduced tariffs and reduced retaliatory tariffs might restore these natural trade lanes.
Resume American Trade Leadership that Benefits America
Revert to the 70 year bipartisan American “free trade” strategy that delivered tremendous value for the US and the world. US exports tripled from 4% of GDP in 1955 to 12% in 2007 forward.
Restore positive relationships with our historic trading partners.
Re-engage in leadership at the World Trade Organization (WTO) and regional agreements like the Asian Pacific Trade Agreement to establish beneficial trade rules for services and intellectual property.
Conclusion
Reversing the Trump Tariffs can create 250,000 jobs, reverse an $80B consumer tax increase, help American manufacturers and farmers to compete globally, improve supply chain performance, and help the U.S. to craft international trade deals that greatly benefit a country that mostly provides “world class” services.
Ronald Reagan skewered Jimmy Carter with this taunt in the 1980 presidential debate. Joe Biden’s approval rating is falling quickly in recent months. US voters need to assess the true state of the US economy under Biden’s leadership after 2 years of a global pandemic, last seen in 1918.
Real Disposable Personal Income Per Capita
Real, inflation adjusted income per person continues to rise. In 2000, average income was just $33,000 per year. It rises quite significantly to $38,000 in booming 2007-10. It remains at this level through 2013. This is a 15% increase over 13 years, a little better than 1% per year. The economy adds another $6,000 in the next 7 years before the pandemic. That’s growth twice as fast, 2% per year during this boom time. Real income has grown another $2,000 to $47,000 in the last 2 years, 2% annually, after the pandemic. Very good news.
Employed Persons
US employment was typically 130M from 2000-2012. Great growth occurred from 2012 to 2020, reaching an unprecedented 152M. The pandemic dropped employment to 130M, an incredible 22M lower. Employment quickly rebounded about half-way to 142M during 2020. It has grown by another 6M in the last year. The employment growth from 2010-20 averaged 2M per year. The 2021 record is a very strong performance, reflecting a healthy economy that has robustly adapted to the challenges of a pandemic environment.
Unemployment Rate
Unemployment averaged about 5% during the first decade of the century, a generally good result compared with 20th century history. It doubled to 10% during the “Great Recession” and then slowly declined to 5% by 2015 and then even further, exceeding economists’ expectations, to 3% in 2018-2020. The pandemic rocketed it up to 15%, but it quickly recovered to 7%. It has since declined to less than 5%, which has historically been the typical definition of “full employment”.
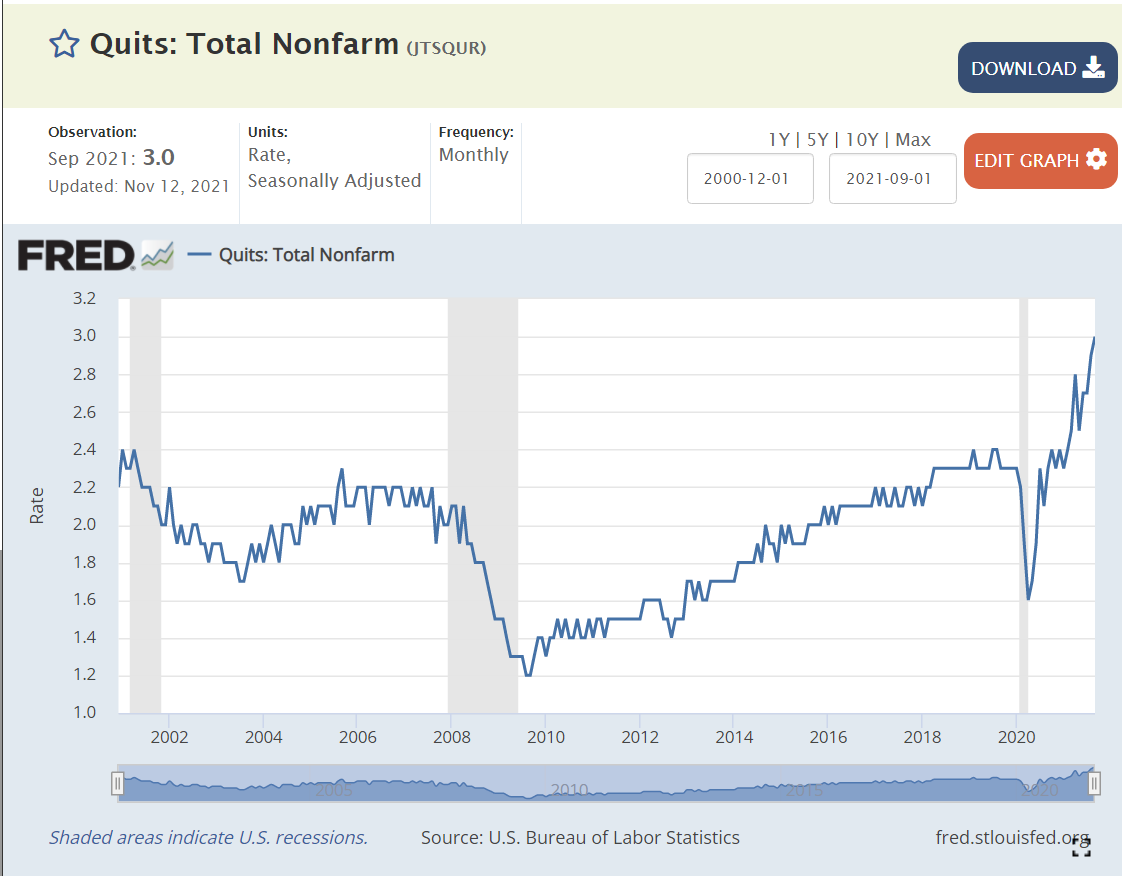
Job Quits
From 2000-2008, about 2% of employees voluntarily left their positions in any given month. The quit rate dropped to 1.5% in the aftermath of the “Great Recession” (2010-13). It very slowly recovered to 2.2% during 2016-18. It increased a little bit to 2.3% in 2019-2020. It rebounded to 2.3% in 2020, and has since increased to an unprecedented 3%. This reflects a labor market where 50% more employees are making a voluntary choice to leave their current employer, apparently confident that they can find an equal or better position.
Job Openings
Job openings averaged 4M from 2000-2014. Openings fell to 3M in 2010-12 after the “Great Recession”. Job openings then grew to 6M in 2017-18 and further to 7M in 2019-20. Job openings quickly returned to 7M early in the pandemic and then began their climb to the current 11M level. Again, these are unprecedented levels, twice as many open jobs as in any time from 2000-15.
Unemployed Persons Per Job Opening
The 2006-7 baseline was 1.5 unemployed persons per open position. The “Great Recession” peak was 6 to 1, an incredibly different labor market, where many older people “retired”; new college graduates went to graduate school, accepted lower positions or remained unemployed; and mid-career professionals accepted positions at 20% lower salary levels. It took 5 years to return to the typical 1.5/1 ratio. This ratio declined a little bit further to 1/1 during 2017-2020 in a tight labor market. The ratio very quickly returned to the historical 1.5 baseline during 2020. It is now at an unprecedented 0.8/1 level. Fewer unemployed people than jobs, not 1.5 to 1, but 0.75/1, half as many potential applicants. This is the first “employees” labor market since the 1960’s.
Home Values
The US Home Price Index was set to 100 in 2000. It increased to 180 during 2005-7. It dropped back to 140 in 2010-13, indicating that part of the rise before “the Great Recession” was a bubble. Prices climbed steadily from 140 to 210 (50% increase) from 2013 to 2020. Despite the pandemic, house prices have continued their climb, exceeding 260, another 25% increase in the last 2 years.
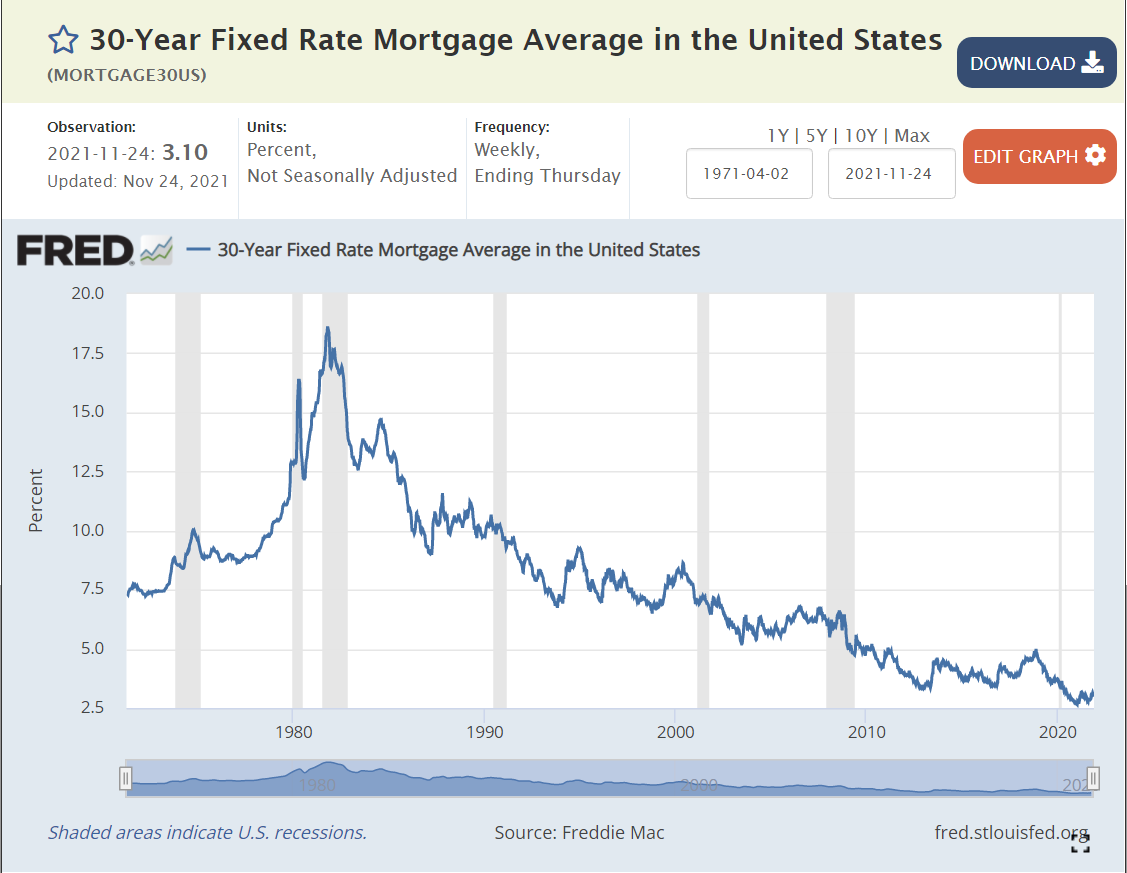
Mortgage Interest Rates
Mortgage interest rates averaged 8% during the 1990’s. They averaged 7% in the 2000’s. They declined even further to 4% during the 2010’s. They fell even further to 3% in 2020-21. The interest cost to finance a house is at an all-time low.
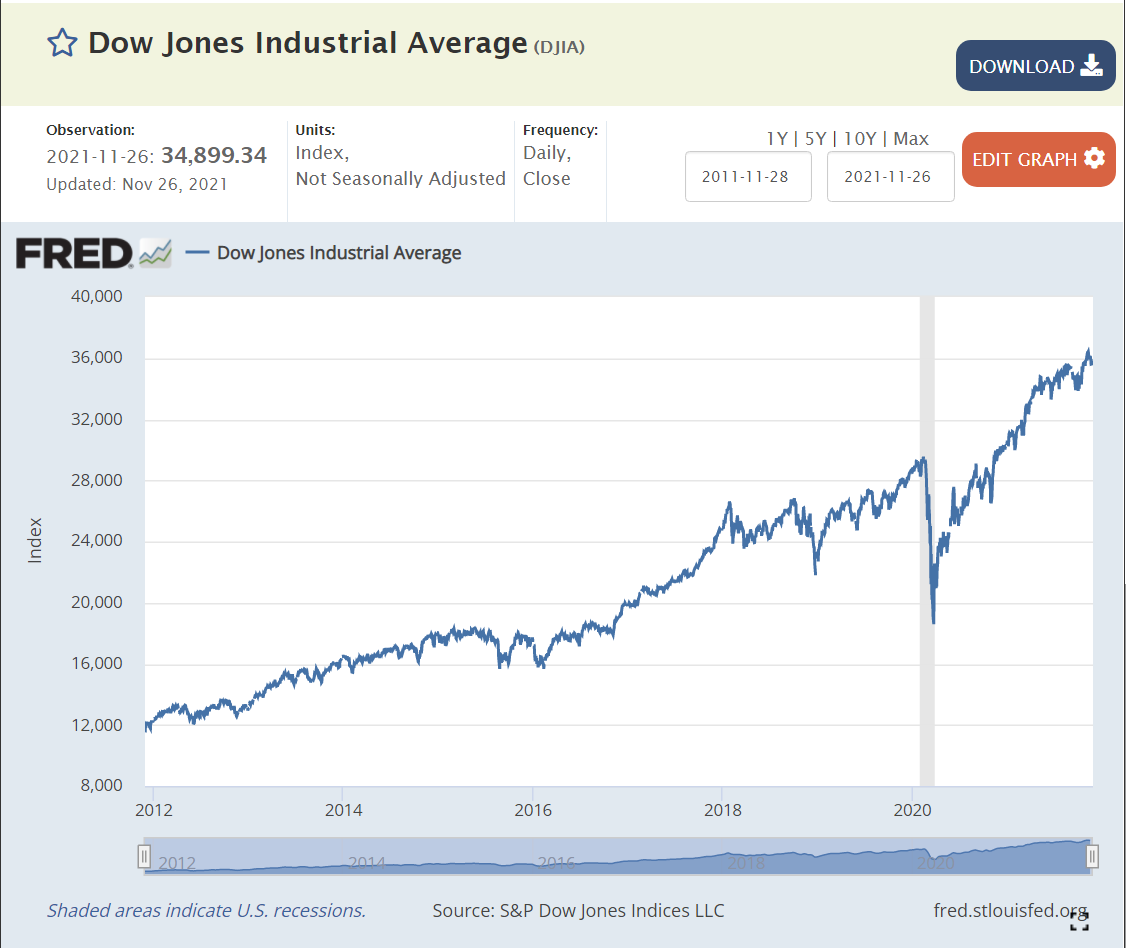
Stock Market
The US stock market averaged 16,000 points from 2014-16. It increased by 50% to 24,000 in 2018, and then climbed to 26,000 and 28,000 before the 2020 pandemic crash. Despite the real financial costs of the pandemic, the market quickly rebounded to 25,000 in the middle of 2020. It has since continued its climb to 36,000, 20% above the pre-pandemic level.
In 1992 James Carville claimed that “it’s the economy, stupid”.
If so, voters should provide some support to president Biden’s results. Real income is up 2% annually, a record level. Reduction in number of unemployed is 6M in 1 year, another record. Unemployment rate is at 4.6%, below historical “full employment” level. Voluntary quit rate is 50% higher than history, indicating tremendous worker confidence. Nearly twice as many job openings as the historical level, providing great options for job seekers to find their “best” opportunities. Mortgage interest rates remain at historical lows, supporting home purchases. House values have grown by another 25%. The stock market is 20% higher.
This is all at a time when the pandemic unfortunately continues to claim lives and greatly disrupt life and the economy. Overall, the recovery is proceeding at a rate far faster what anyone thought was possible during 2020.