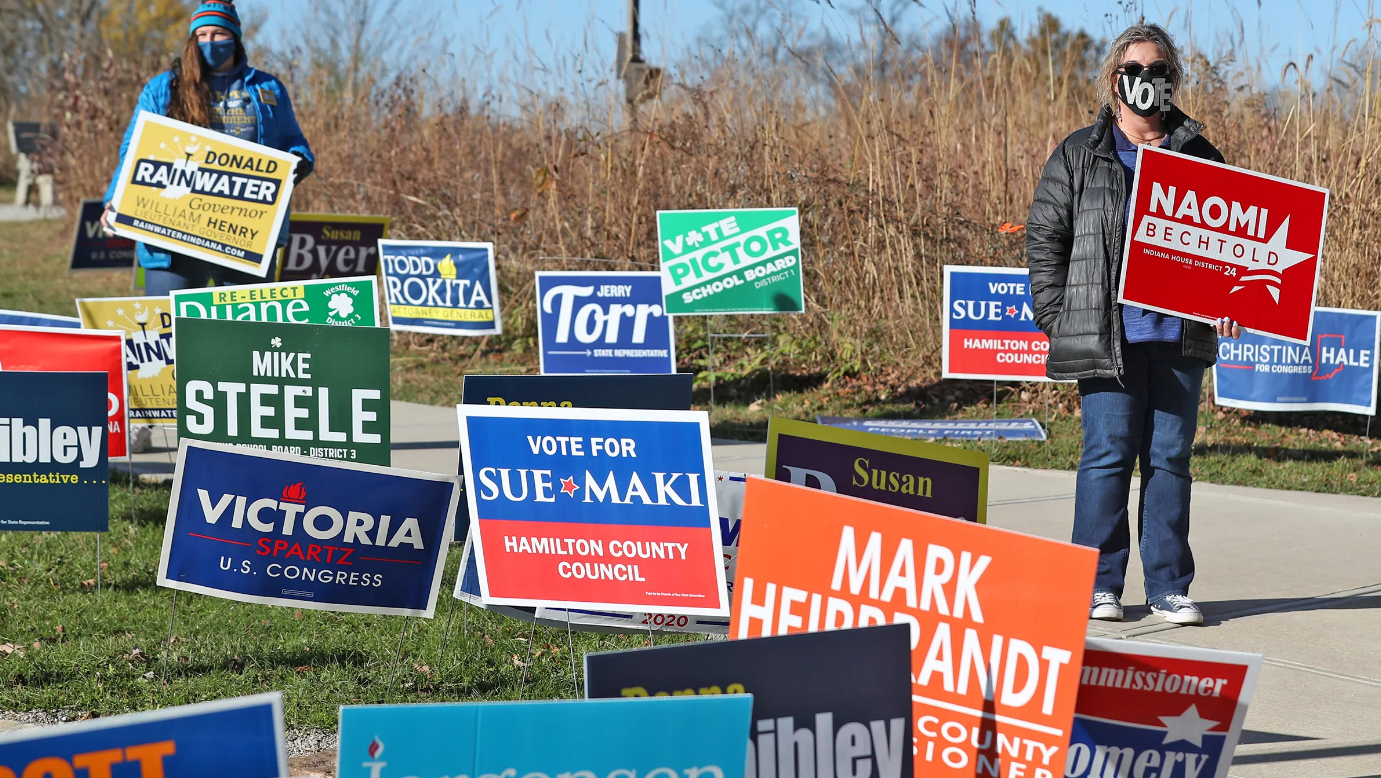
2018 and 2022 elections showed widespread increased voter participation. Increases were seen by all races, genders, income, ages, states and education levels. Increased voting by the youngest age group and Hispanic Americans were most notable.
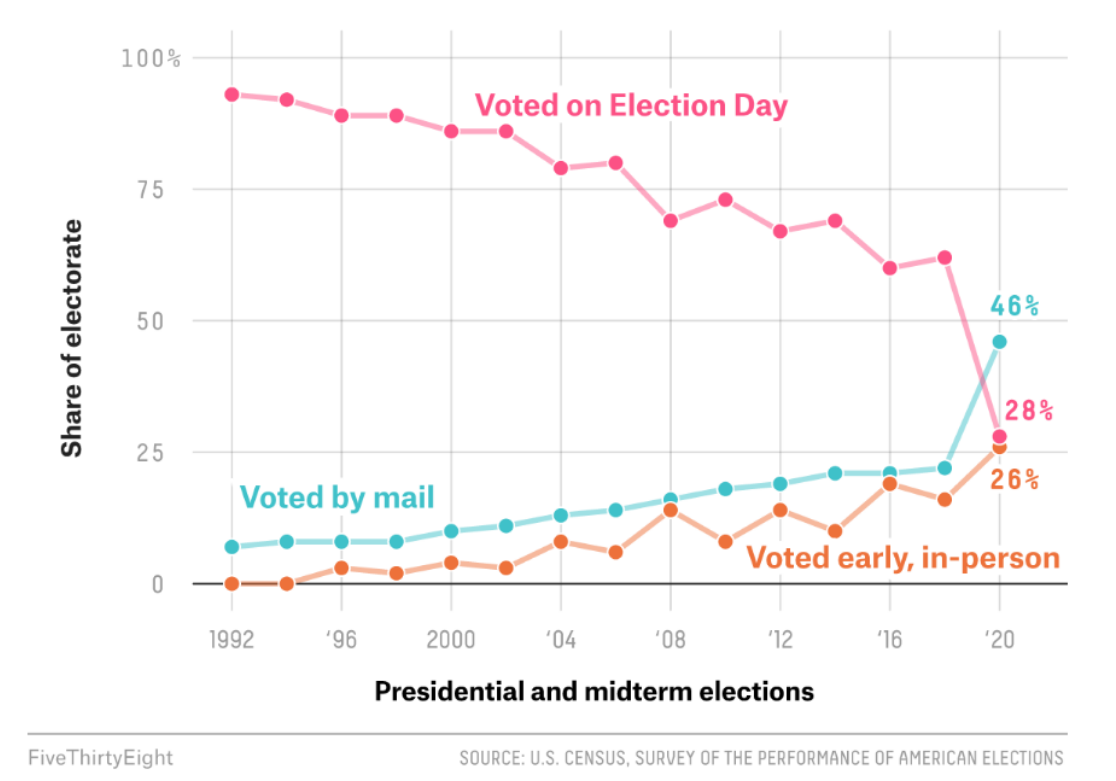
The 2020 and 2022 elections both relied heavily upon mail-in and early voting options. Early voting participation, especially in competitive states, was equal to or ahead of 2018. Hence, election day participation in 2022 was somewhat lower than in the record year.
Voter Registration is as Important as Participation
Voter registration in the states with party-preference records increased from 108 million in 2017 to 117 million in 2021 and then a little to 120 million in 2022. Registrations have increased a little faster than voting age population, but have not made a material difference.
The Democratic party share has declined significantly in the last 2 decades, replaced by “independent” voters. The Republican party share has declined by just 3%.
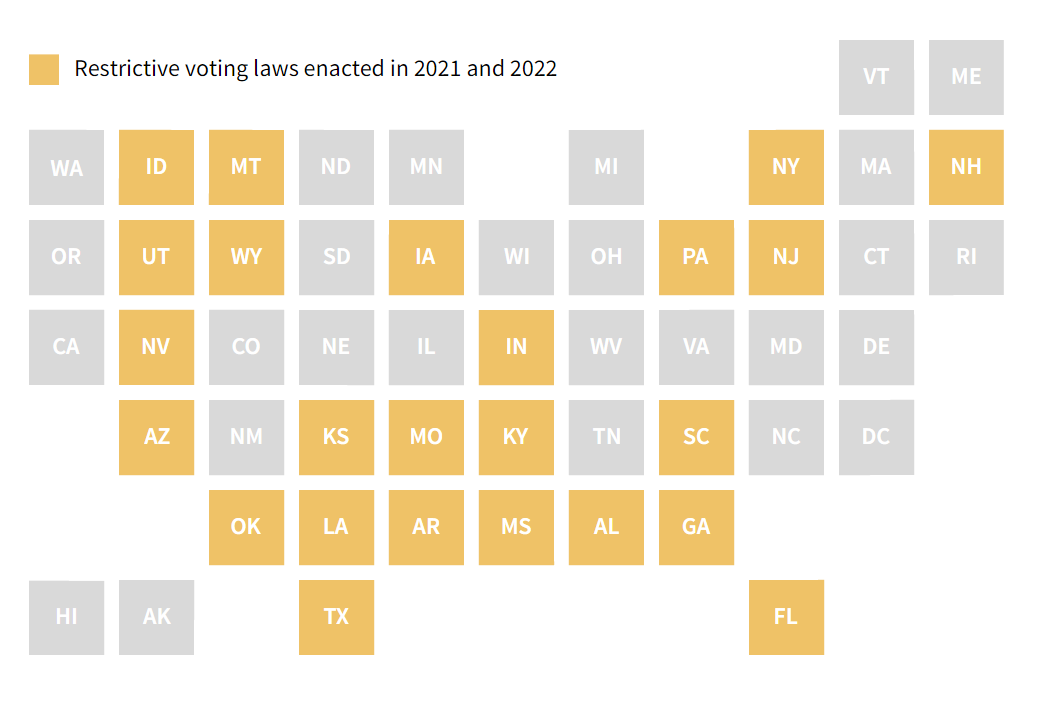
Good data on the impact of various voting law changes is not yet available. Anecdotal media reporting of the 2022 election did not indicate extremely large changes in voter behavior.
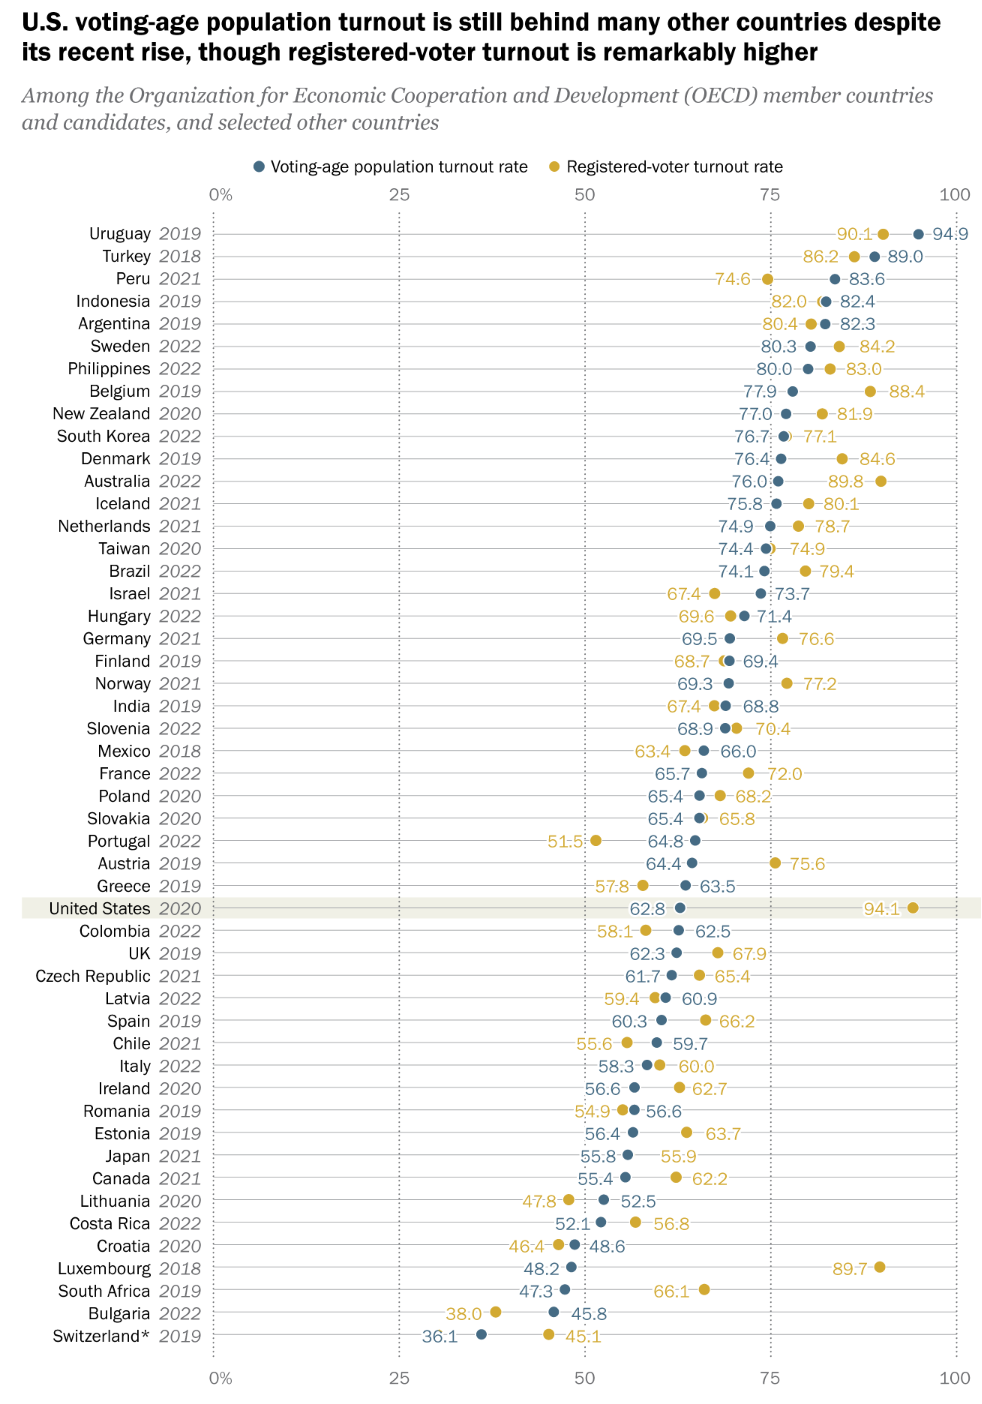
US Registration and Net Participation is Low versus other Advanced Economies
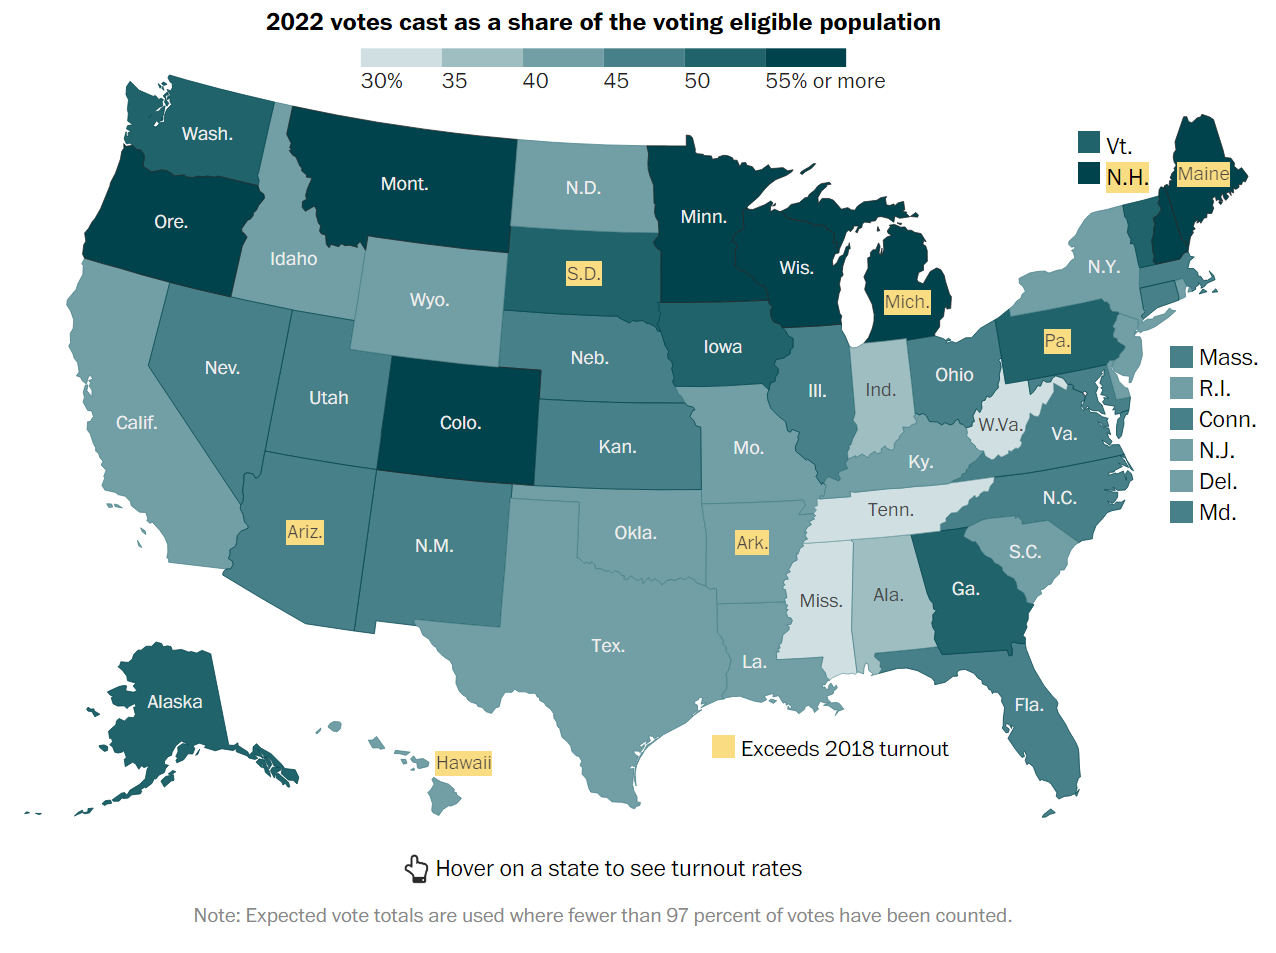
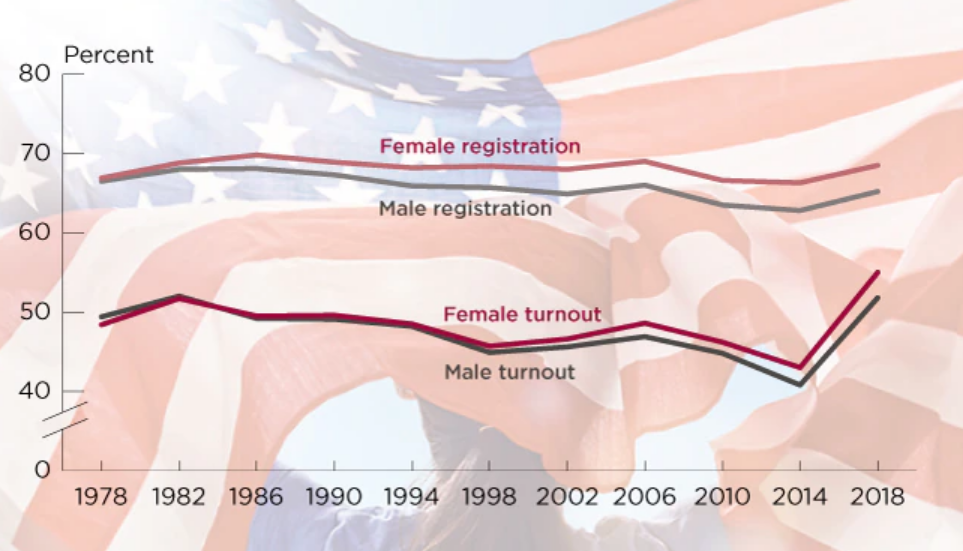
Voting participation in the US varies significantly by gender, race, age, state, income and education level. It recovered to some degree in 2018-22 following a 40-year low period. Voter registration has increased by a small amount in the last 10 years, but increased participation among registered voters has been the driver of overall results. The availability of mail-in and expanded early voting clearly boosted turn-out in 2020 and 2022. The impact of additional voting restrictions is unclear, but obviously intended to reduce turnout. Polarized politics in the US has increasing voter turnout, but only by 10-15% versus recent history. Presidential years boost turnout by 15%. State by state participation in election years ranges from 58% to 76% (excluding a few extremes), based on habits, demography and state laws. Presidential elections could have 10% higher participation if all states followed the examples of the high participation states.
Government has an increased impact on all citizens. Democracy requires participation to make the decisions and programs of governments (at all levels) legitimate. The US can do better.
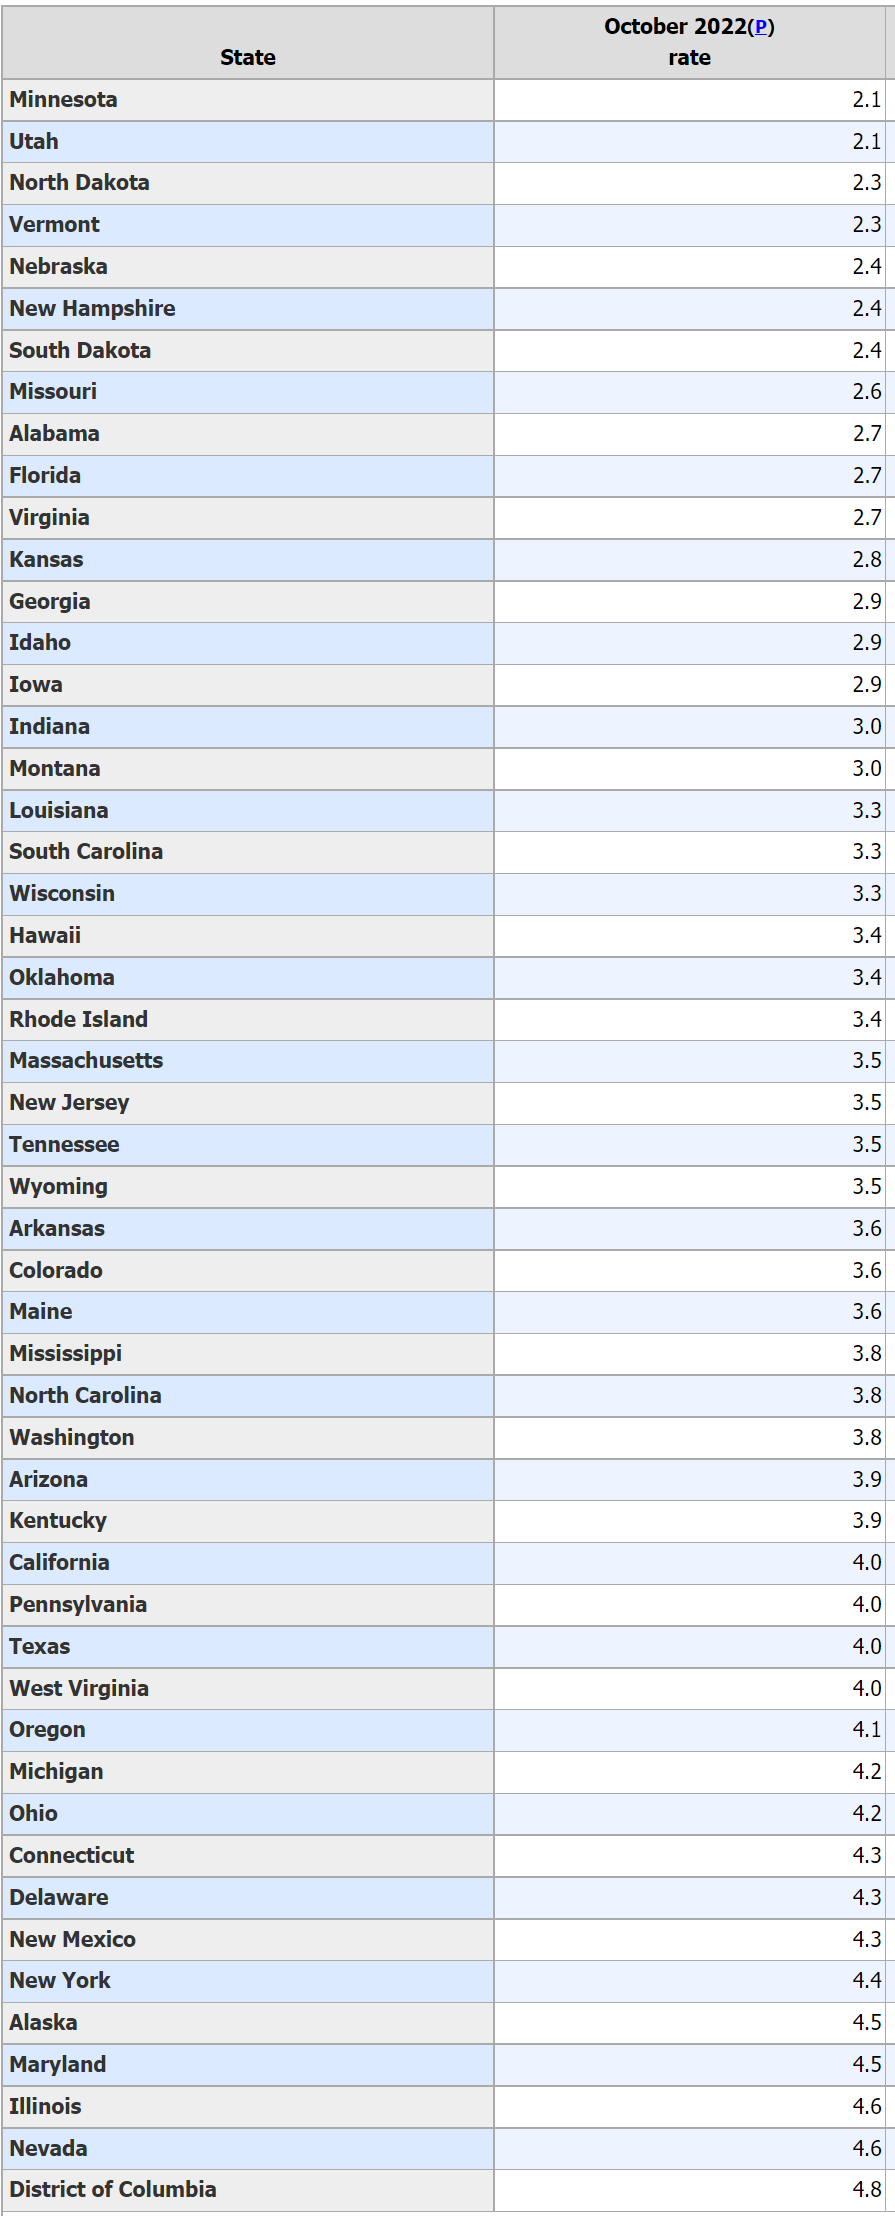
15 of the 50 states have unemployment rates in the TWO’s!
The Great Plains region has 7 states with 2% unemployment rates: MN, SD, ND, Mo, KS, NE and IA.
Utah (2.1%) and Idaho (2.9%) standout in the Rocky Mountain states.
In the Southeast, Alabama (2.6%), Florida (2.7%) and Georgia (2.9%) enjoy minimal unemployment.
New Hampshire (2.4%) and Vermont (2.3%) represent New England and Virginia leads the Middle Atlantic (2.7%).
Another 20 states report 3% unemployment rates, for a total of 35 (70%) at 2-3%.
The remaining 15 states and the District of Columbia (4.8%) enjoy 4% unemployment, historically considered better than “full employment”. Illinois (4.6%) and Nevada (4.6%) have the highest unemployment.
A plurality (40%, 149) of the 370 US metropolitan areas report employment rates of 3%, consistent with the 3.5% overall national rate.
More than one-third (34%, 124), enjoy rates in the 2% range!
About one in seven (14%, 51) reflect better than classic “full employment” rates in the 4% range.
24 metro areas (6%) enjoy astonishingly low 1% unemployment rates.
22 metro areas (6%) are outside of “full employment” at 4.9%. 17 are in the 5% range. 5 exhibit 6%+ unemployment rates.
The statistics for just the top 100 metro areas show the same pattern. The distribution of unemployment rates weighted by population shows less dispersion, with just 3% each in the 1% and 5%+ ranges and a heavier 47% in the central 3% range.
22/370 Metro Areas Not at Full Employment (5-7% Unemployment Rates)
California: Yuba City, Madera, Fresno, Hanford, Merced, Bakersfield, Visalia
Texas: Corpus Christi, Brownsville, Beaumont, McAllen
Illinois: Danville, Kankakee, Decatur, Rockford
Michigan: Muskegon, Saginaw, Flint
Pueblo, CO, Rocky Mount, NC, Farmington, NM and Las Vegas, NV
42 of the 50 states enjoy having all of their metro areas with full employment.
24 Metro Areas with Far Better than Full Employment (1% Unemployment Rates)
Missouri: Columbia, Jefferson City, Springfield, St Joseph, Joplin, Cape Girardeau
Lincoln, NE and Ames, IA
Minnesota: Mankato, Rochester, St Cloud, Minneapolis-St Paul
Dakotas: Fargo, Grand Forks, Bismark, Sioux Falls, Rapid City
Utah: Provo, Logan, Ogden, Salt Lake City
Burlington, VT, Columbus, IN and Bloomington, IN
Summary
The labor market stands out as a very positive measure of the health of the US economy in October, 2022. A general, prolonged, material decline in economic health is difficult to see on top of this broadly very positive economic base. A slow-down? Highly likely.
American “pop culture” transitioned from mostly White to “Black and White” during 1965-67. 20/100 top 100 Billboard hits in 1965. 23/100 in 1966 and 1967. In 1966/67 half of the top 100 R&B songs were recorded in Detroit. Another one-fourth were captured in Memphis. My VERY favorites: Up, Up and Away. Sweet Talkin’ Guy. Bare Footin’. Soul Man. Groovin’. Reach Out. Bernadette. Ain’t Too Proud to Beg. RESPECT. Ain’t No Mountain High. Reflections.
Pop music. The first album I ever purchased at JJ Newberry’s in Painesville, OH.
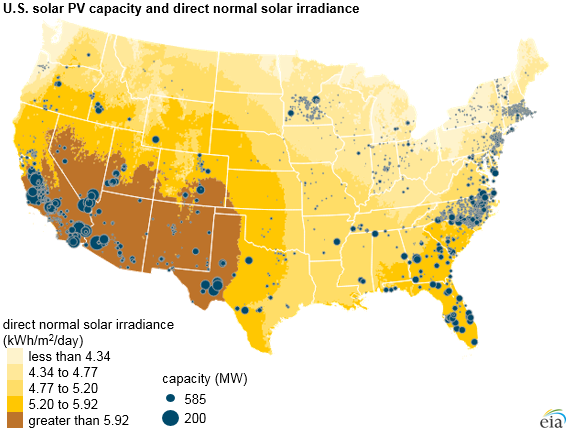
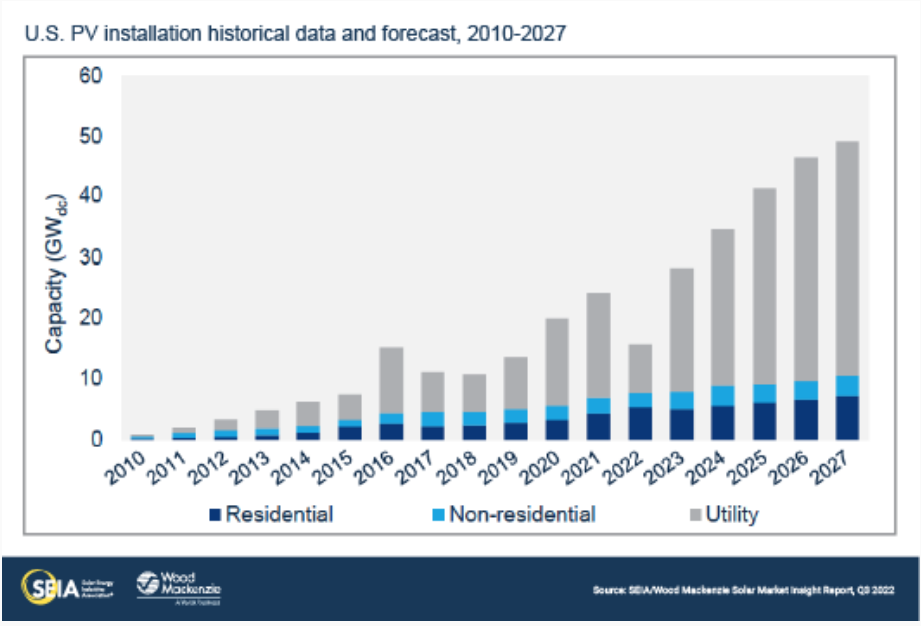
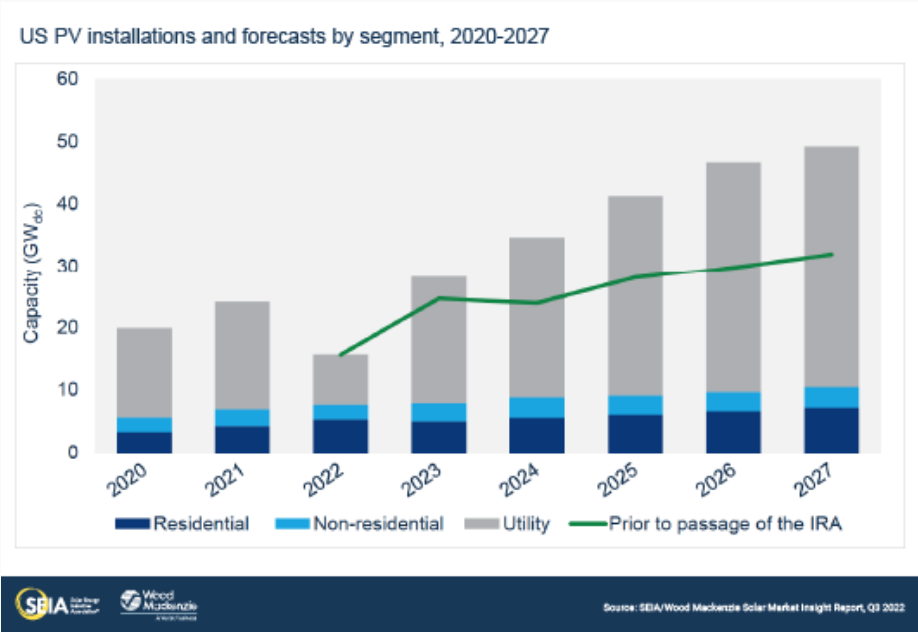
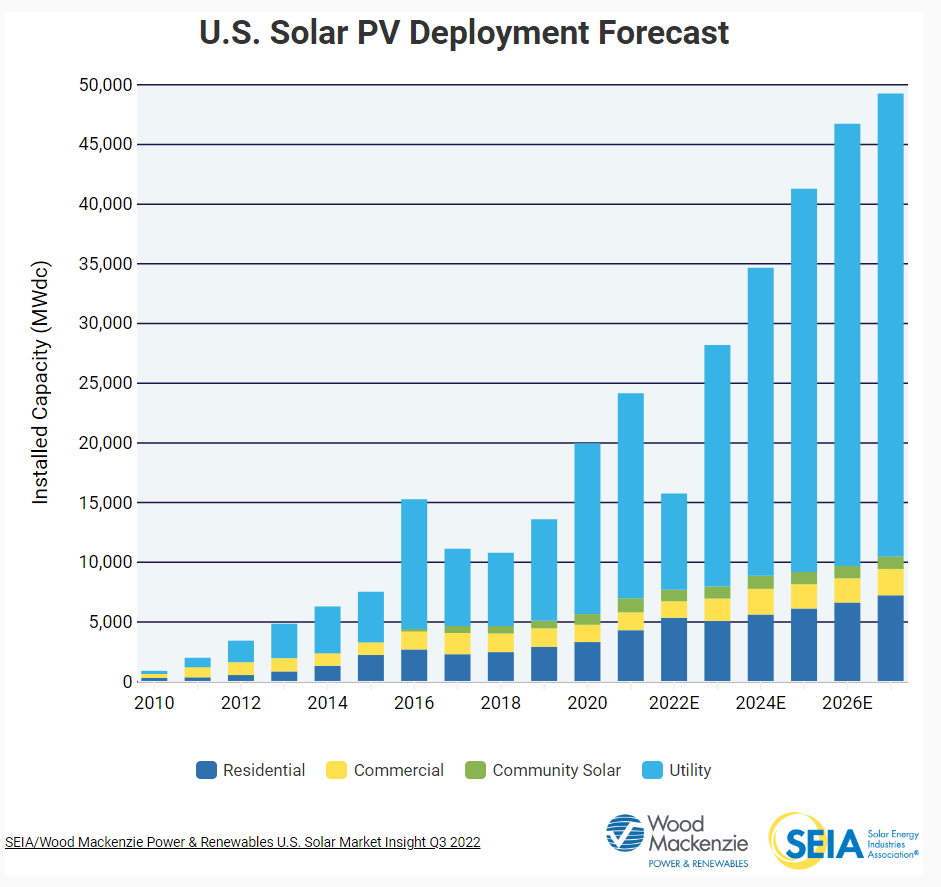
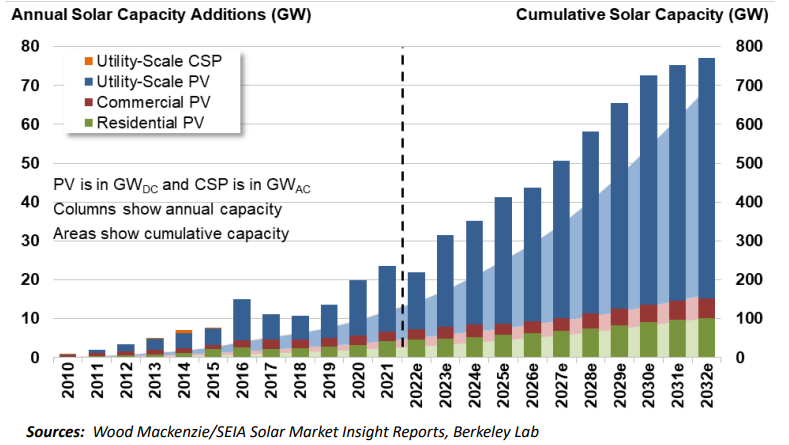
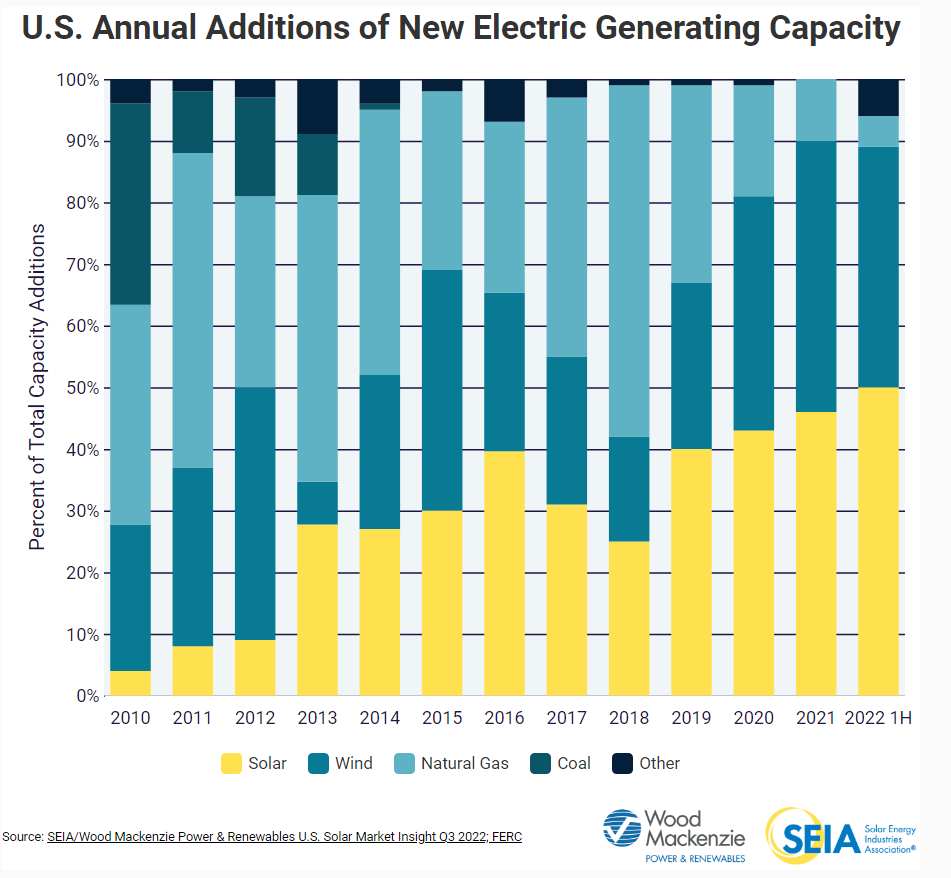
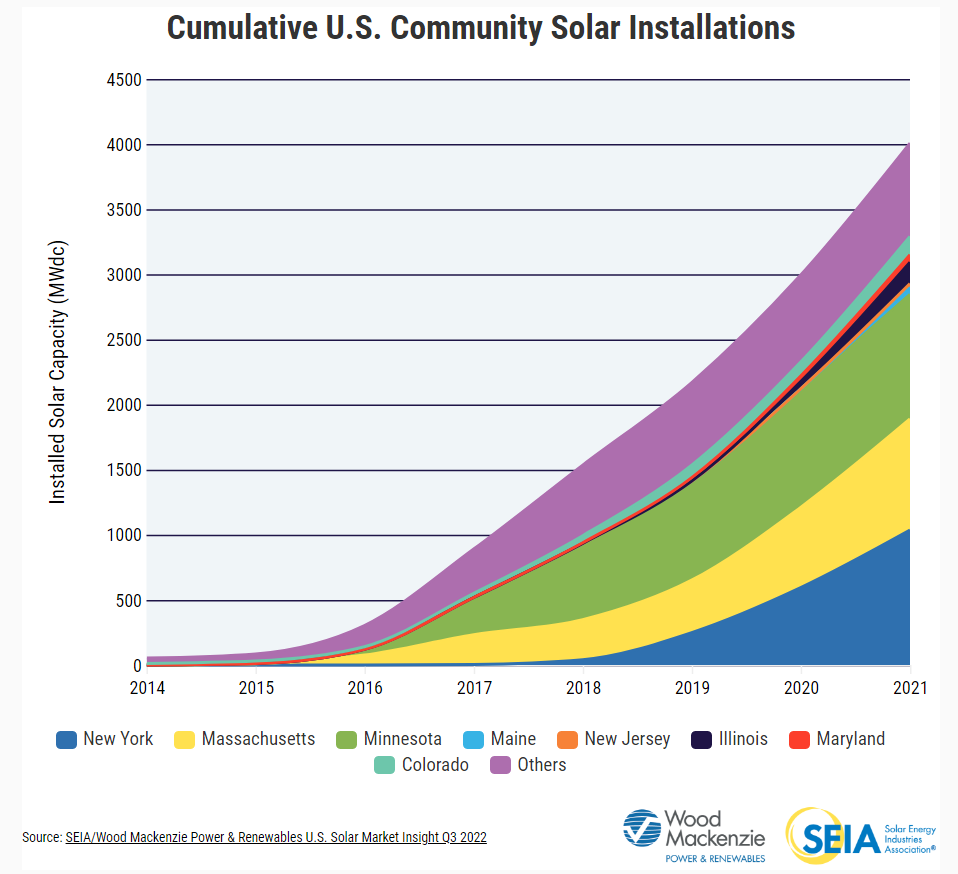
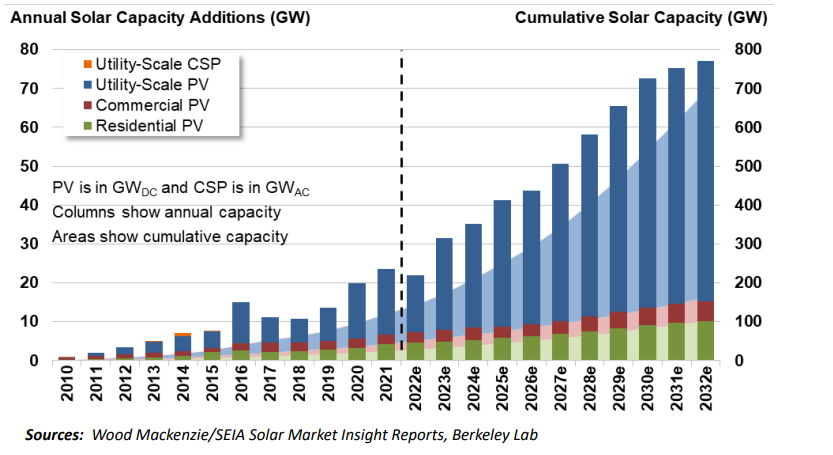
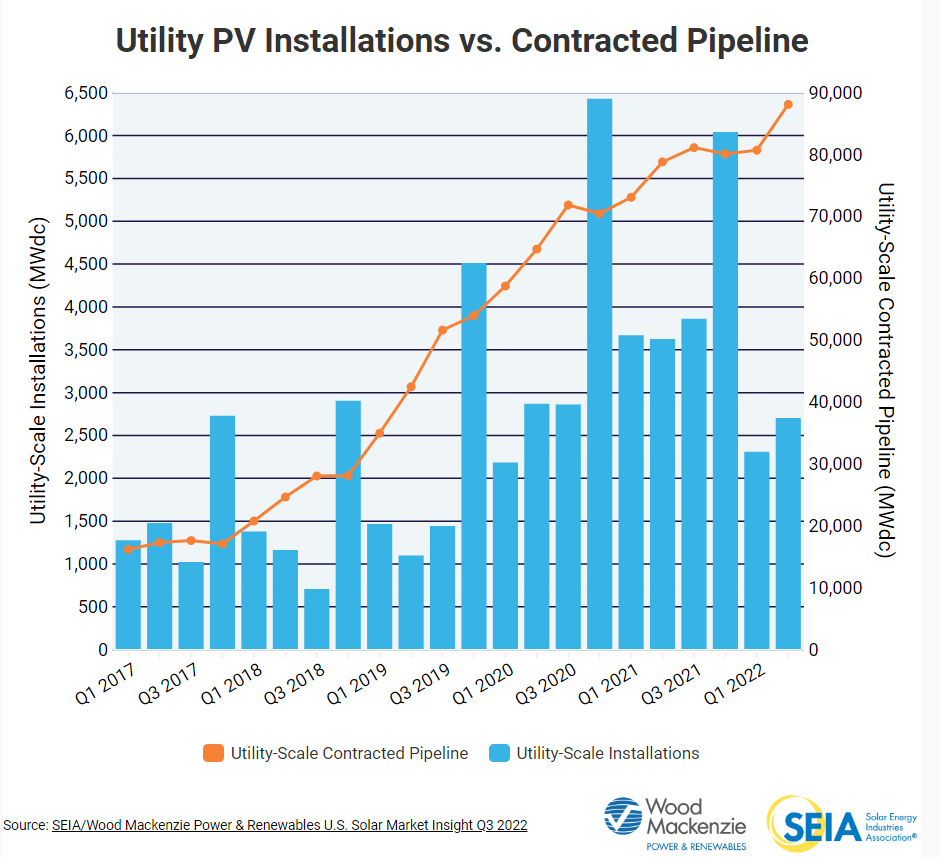
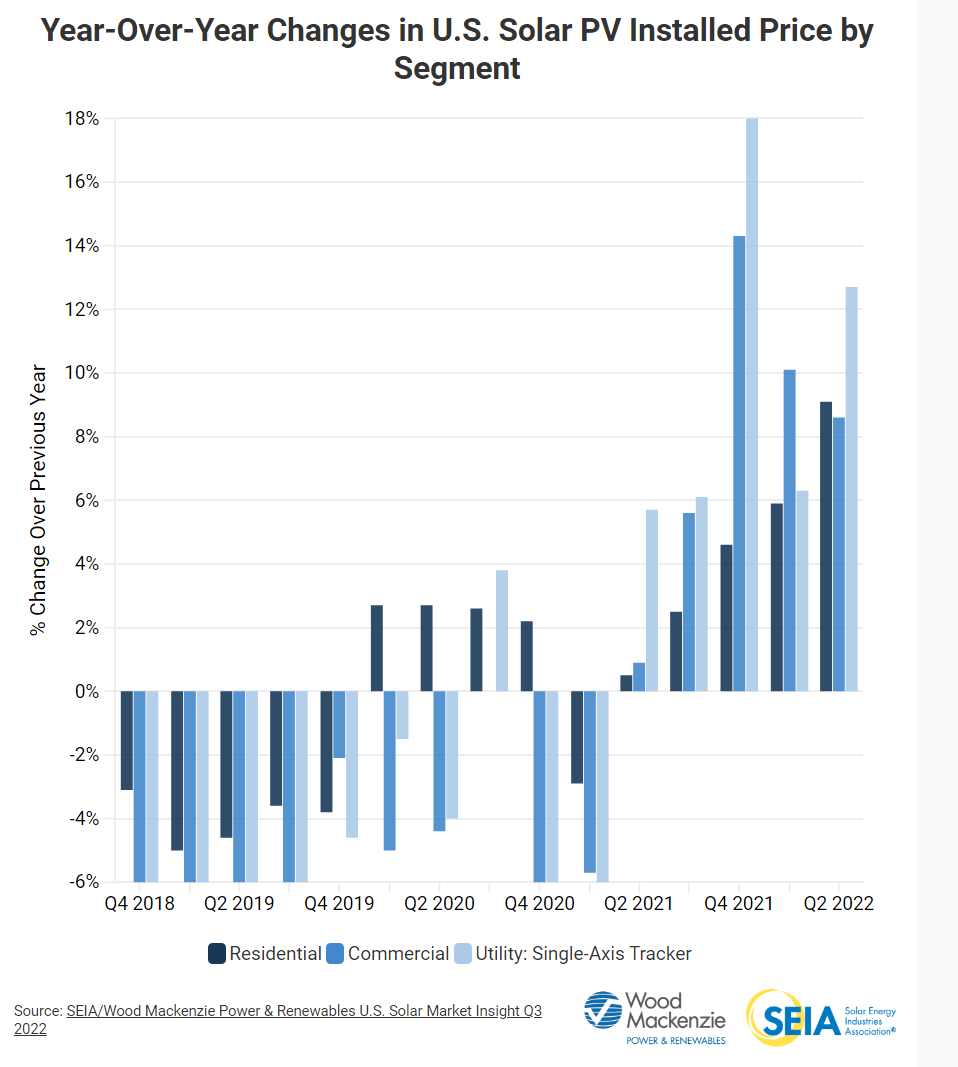
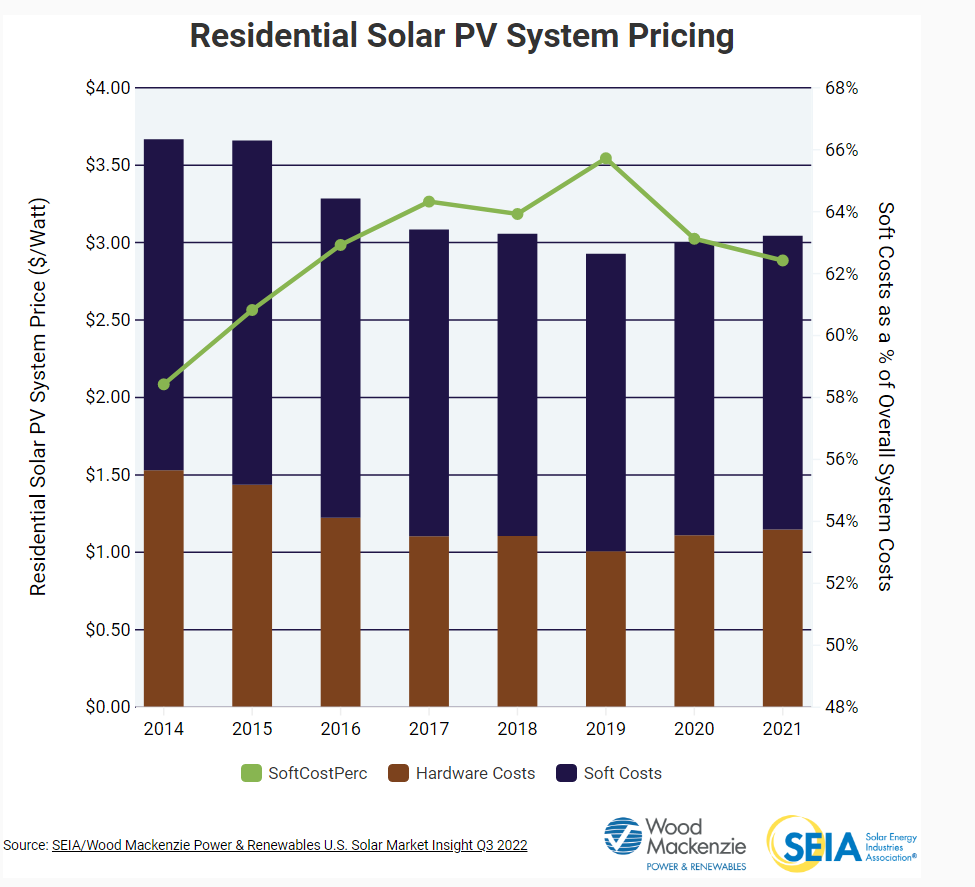
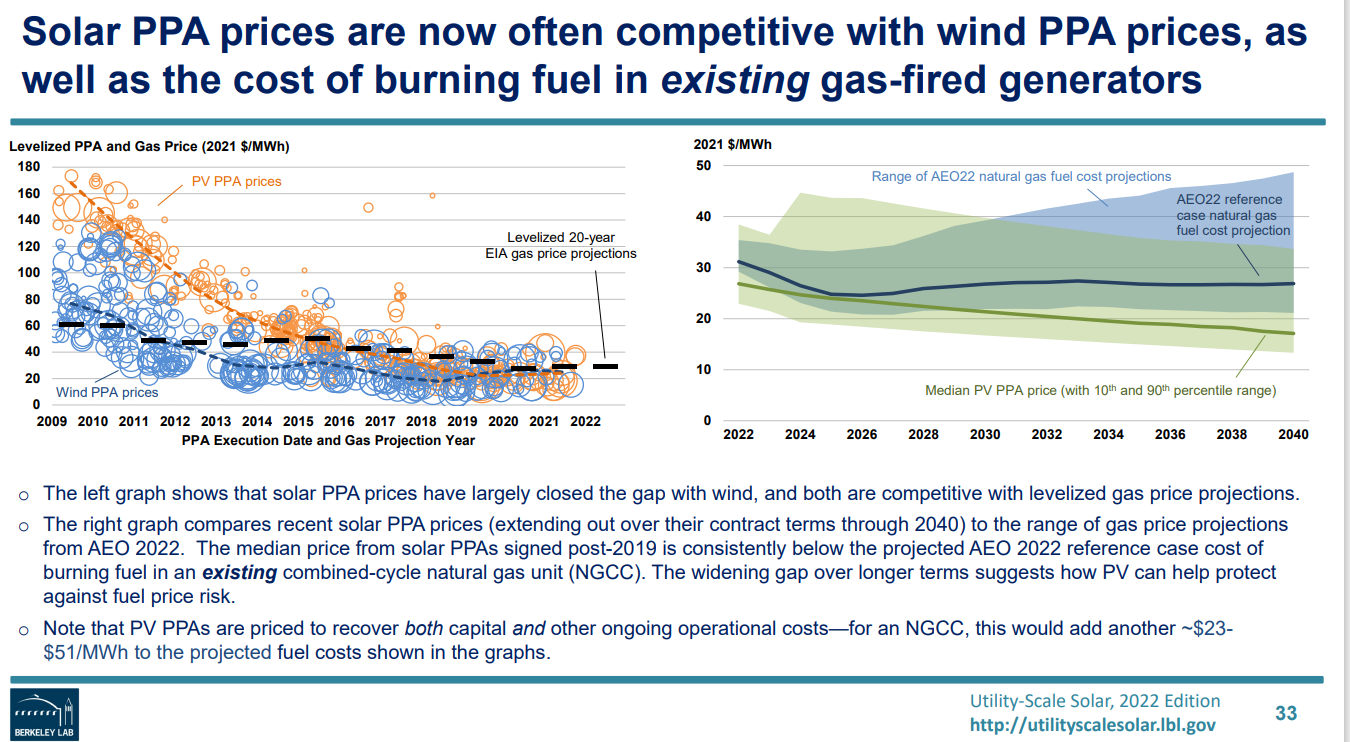
Utility scale photovoltaic solar panel energy generation is the future for the US energy market. The cost structure is already low enough to justify 30-40 year investment projects. Solar projects are 40% of new electricity generation projects, heading towards 50-60%, competing fairly with wind power. Solar power at 4% of the total electricity generating capacity is still relatively small, but the new investments will drive it to 8%, 12%, 16% and 20% in the next 20 years.
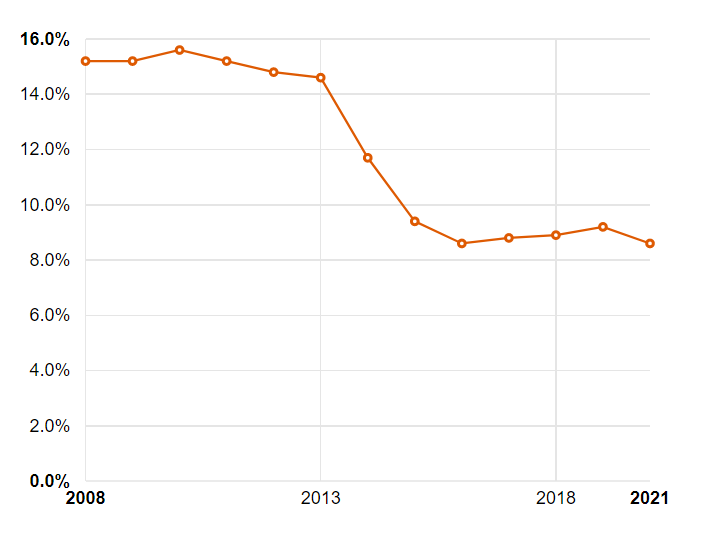
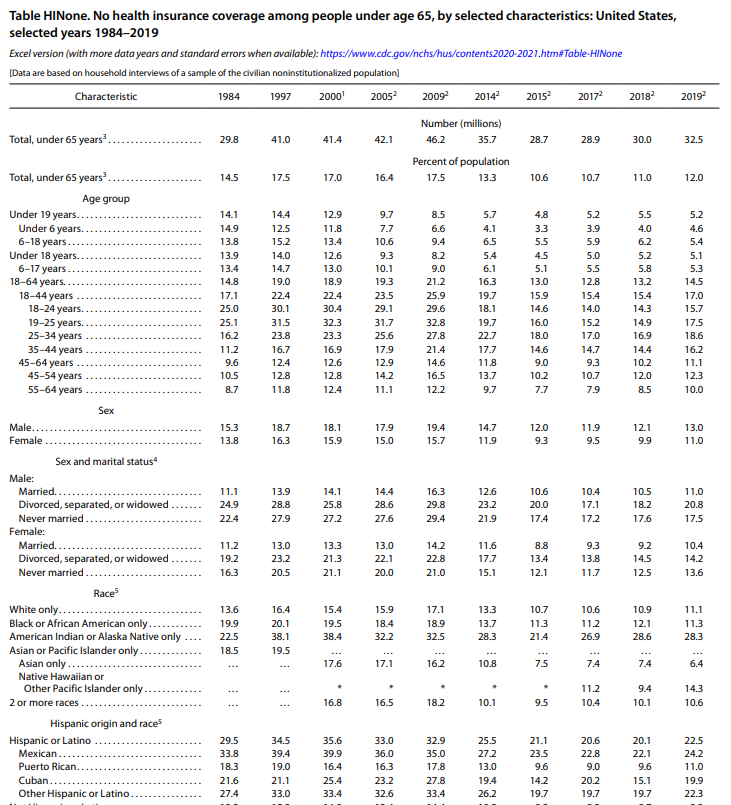
Hispanic-Americans are twice as likely as African-Americans and 3 times as likely as White Americans to be uninsured.
The 40 states that adopted the expansion of Medicaid to cover medical costs for low-income families have uninsured rates about one-half the level of the other 10 who rejected this federal program.
The decline in the medically uninsured has been relatively consistent across racial/ethnic groups from 1984 to 2009 to 2019. Whites 14% to 17% down to 11%. Blacks 20% to 19% to 11%! Hispanics 30% to 33% to 23%.
14 states have much higher uninsured rates than the nation at large. TX and OK at 15%. GA, FL, MS and WY at 12%. NC, AL and AZ at 11%. NC, TN, SC, AL and NM at 10%. Rural, southern and mountain states, by and large.
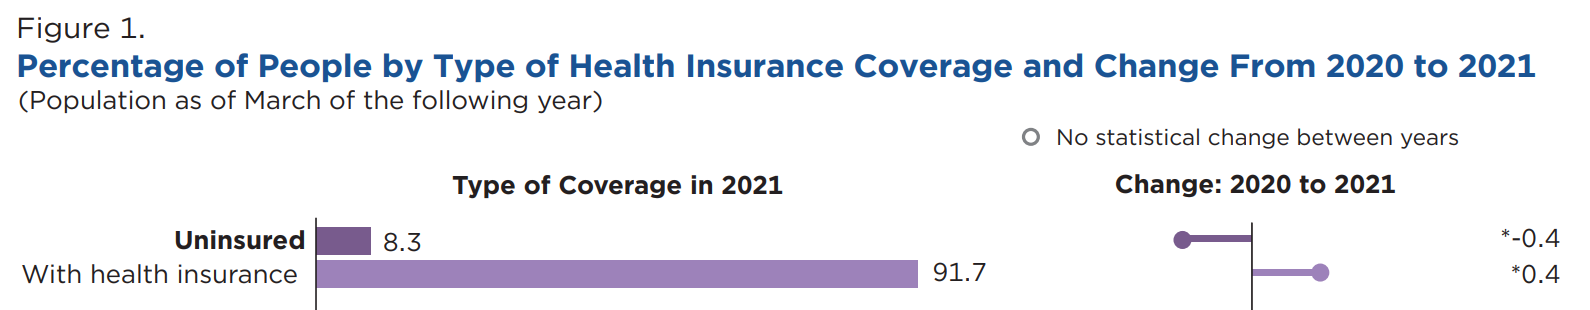
There were 28M uninsured people in the US in 2021. Just six of the high uninsured percentage states account for 42% of all uninsured people. TX (5.2), GA (1.3), FL (2.6), AZ (.8), NC (1.1), and TN (.7). The other 8 high uninsured percentage states include 2.6M uninsured citizens, for a cumulative total of 14.3M; more than one-half of the uninsured in 14 states, about one-third of the country. Five high population states with 5-7% uninsured rates account for another one-fourth of the total: 6.9M. CA, NY, IL, OH and PA.
Summary
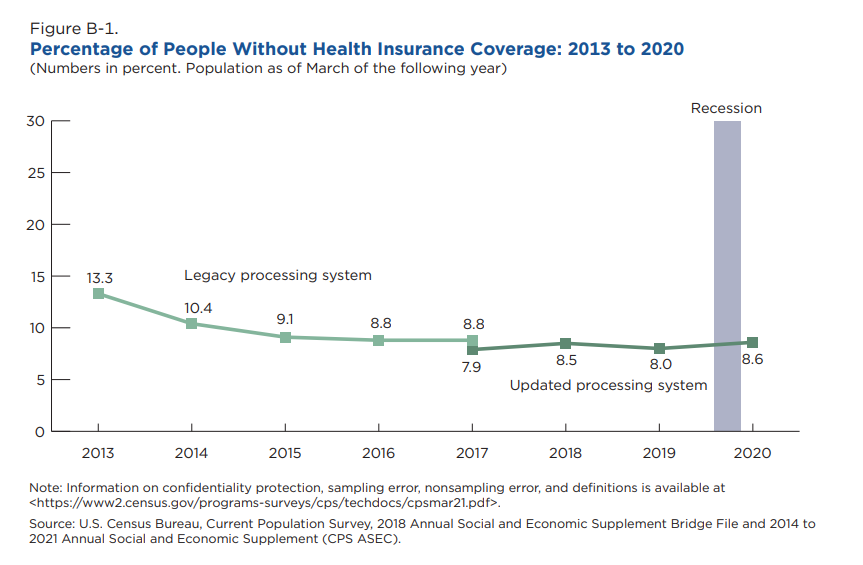
Between 2013 and 2015, the US reduced its uninsured population by one-third and has slowly reduced its uninsured population in the last 7 years.
The stock market reacted quite positively yesterday to the slightly better than expected news regarding measured inflation. The total measure and the “core inflation” measure excluding more volatile food and energy prices were both a little lower than expected for the month and for the 12-month calculation.
I don’t think that trend inflation was ever as high as the markets and voters perceived (double digits) and I don’t think that today’s reaction/perception of a peak or recovery in the inflation rate is correct, as inflation totals and details have been slowing for seven months, since March. In hindsight, the business cycle tends to reflect a smooth “sine-wave” curve of increasing, flattening and then decreasing various measures. It is VERY difficult to separate the “signal from the noise” as the monthly data is released on GDP, employment, inflation, etc.
As usual, we need to look at nearly a dozen measures of inflation and its components and 2-3 views of each component to try to identify the “signal”.
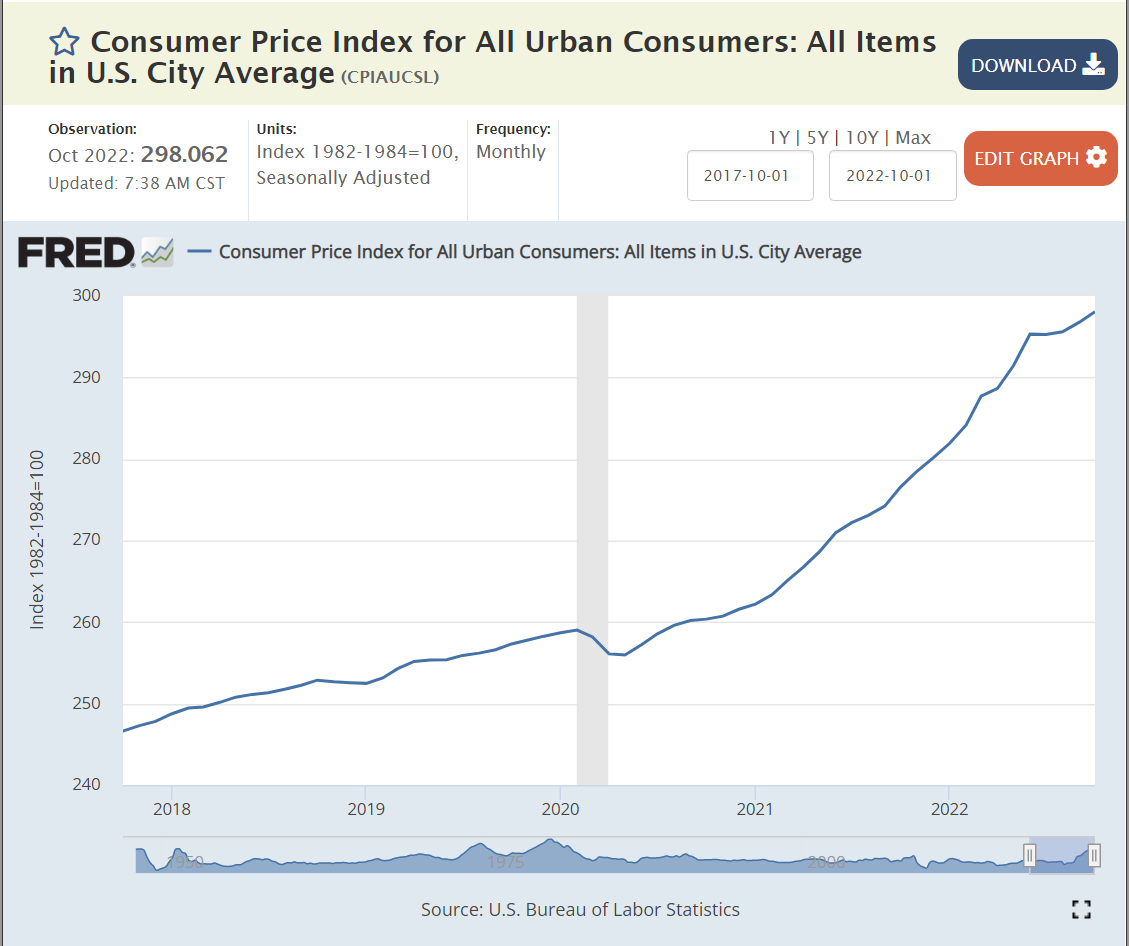
When I look at the consumer price index, I see an inflection point in March, 2022, when a quickly accelerating curve paused its growth rate. Inflation appeared to resume at its prior pace in April and May, not faster than in prior months, indicating that March was a fluke, but at about the same pace, indicating that, overall, there was the beginning of a slow-down in Feb-May. In June, I see a second inflection point, and the pace of price growth has clearly slowed for the next 4 months. The annual inflation rate from March to October was 6.2%
The inflation rate from September, 2021 to March, 2022 was 9.8%. This was the highest rate indicated by this data. 6.2% is a good one-third lower than 9.8%, strongly indicating that the inflation rate has peaked. It might not be declining, but it has clearly peaked.
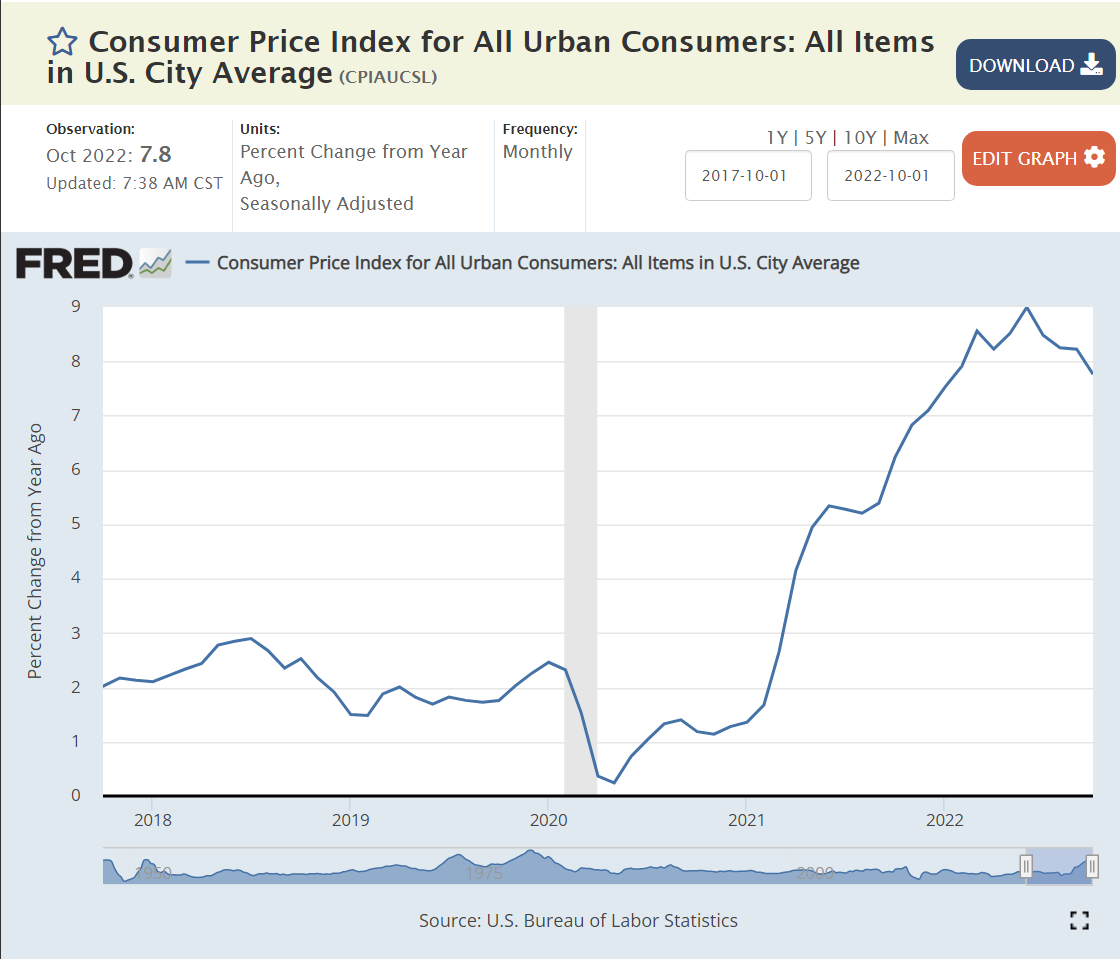
The annual, 12-month price change measure tells the same story. At September, 2021, the trailing annual inflation rate was 5.4%. At March, 2022, the rate had reached 8.6%. It appears to have peaked at that time, levelling off in the low 8% range. A peak was reached in June at 9%. The next 5 months have shown a declining trend to less than 8%.
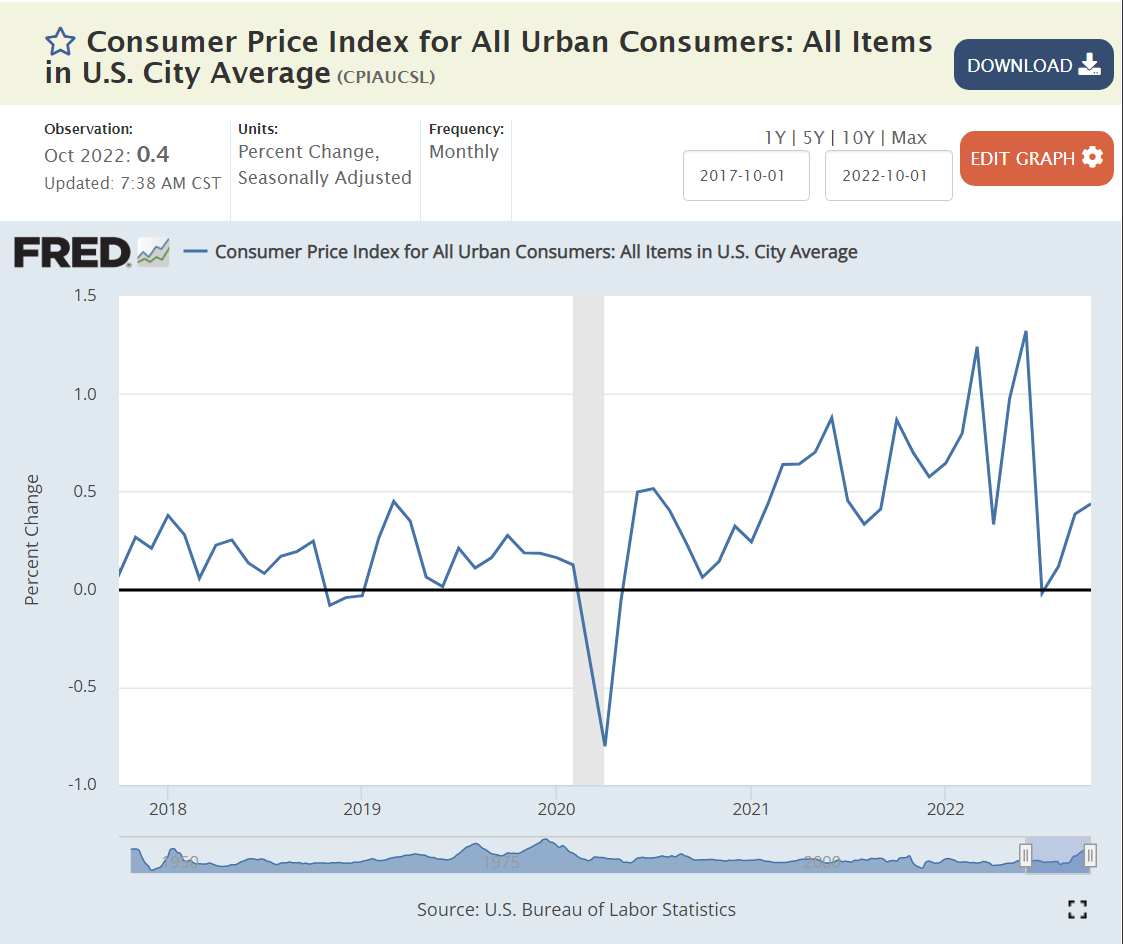
The monthly percentage change is much more volatile. Monthly changes reached 0.88% in Jun 21 and 1.32% in Jun 22. There were also lower monthly changes during this period, keeping the 12-month measure to 9% or less. The last 4 months have shown good news, with monthly inflation of 0%, 0.1%, 0.4% and 0.4%, a total of 0.9% for 4 months, or 2.7% annually. This measure is too volatile to claim victory, but it reinforces the notion that inflation has peaked and is beginning to decline significantly.
The “core” inflation index appears to have peaked at 6.4% of annual inflation in Feb, 2022. Most economists focus on this measure because the excluded food and energy components are much more volatile and tend to return to their low long-term inflation rates, so high monthly increases tend to be followed by offsetting declines. The core inflation index appears to have levelled off at 6.5%, but evidence of a future decline is not obvious in this measure.
The monthly core inflation measure fluctuates between 0.4% and 0.6% for the last 18 months, indicating annual inflation of 5-7%. A lasting decline is not obvious, but the October measure is encouraging.
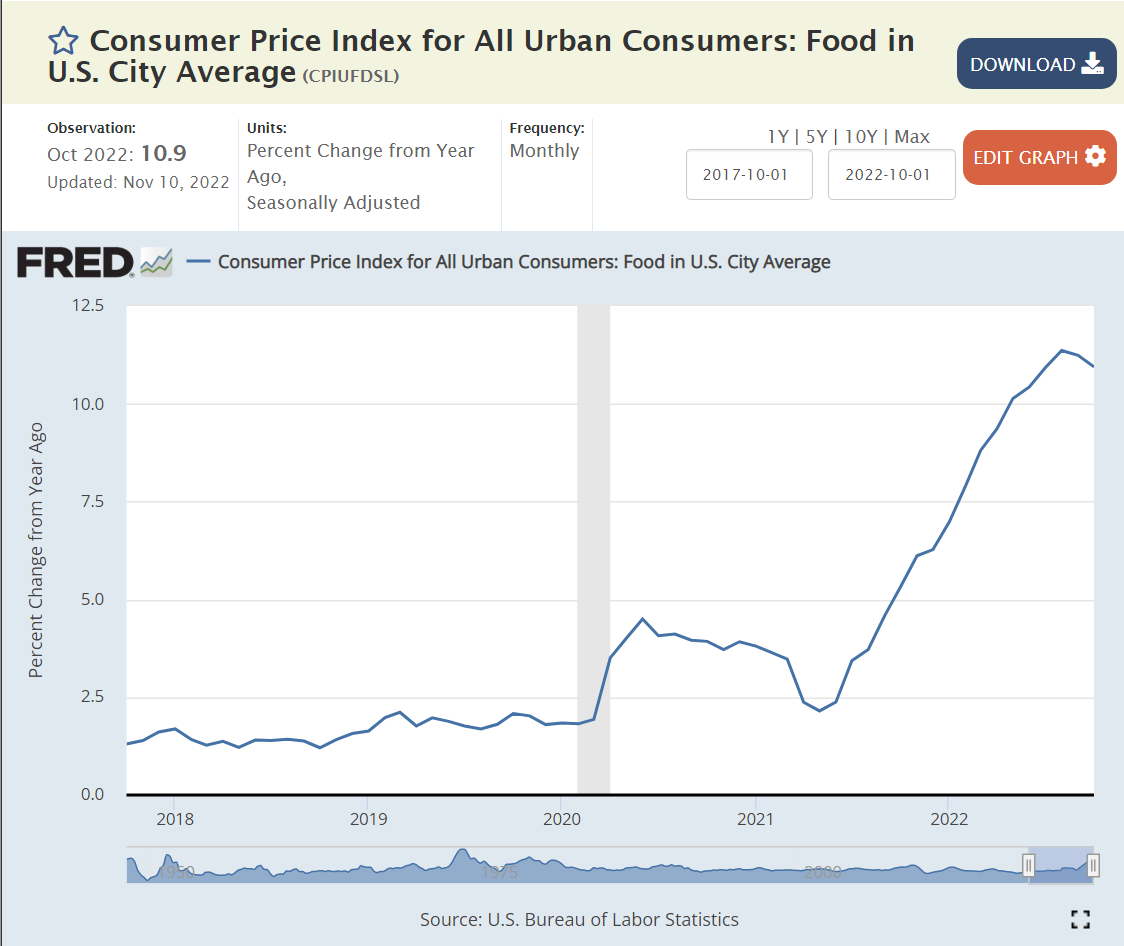
The food consumer price index clearly accelerated from late 2020 through mid 2022. Monthly inflation grew from 0.2% in late 2020 to 0.6% in the last 2 quarters of 2021. Food inflation reached 1% monthly in February, 2022 and stayed at that level for 6 months, before beginning to decline quite sharply to 0.6% in the next 4 months.
On a year-over-year basis, it took a little longer for food price inflation to become noticeable, as the earlier lower inflation months were combined with the growing inflation months. In June, 2021, the trailing 12-month food inflation rate was just 2.4%, comparable to the last 30 years. The annual inflation rate reached 6% by November, 2021 and peaked at 11.4% in August, 2022. The monthly food inflation rate and the trailing 12-month rate are clearly declining. Consumers face a grocery bill each week and are sensitive to these changes for key items.
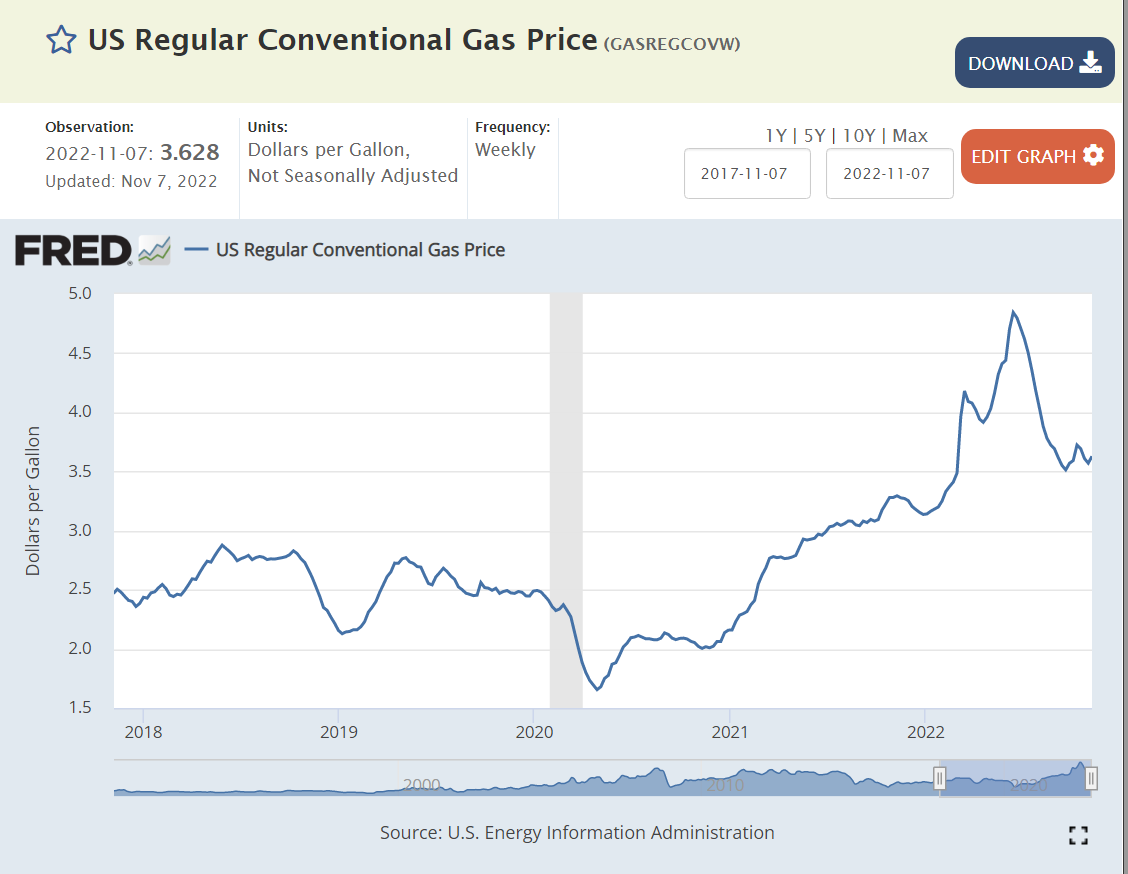
Energy prices are volatile. That’s why they’re excluded from the “core” inflation measure. Nonetheless, from a consumer experience and future inflation expectations perspective, they matter. They matter greatly. The gas and electric bills arrive each month. Automobile fuel is purchased weekly or more often with huge price signs at the station. Monthly energy prices increased by 5% in June, 2021 alone and averaged about 2.5% per month for the next year and one-half. Energy prices then briefly increased by 19% in the next 4 months combined before finally dropping a bit. The monthly experience was one of 2 years of increases and 30% annual inflation for more than a year. The recent price reduction is seen as a release from relentless large increases.
The most visible energy price. for regular auto fuel, dropped from $2.50 per gallon to just $2.00 per gallon during the first year of the pandemic before increasing to $3.00 per gallon in the second year and then up to nearly $5.00 per gallon in June, 2022. It has since declined to a slightly elevated $3.60 per gallon. Consumer perception of “gas prices” is mixed. It’s clearly higher than in 2019, 2020 or 2021, but it has come down from the peak level. Various threats and weekly volatility make consumers shy to conclude that gas prices are “really” declining.
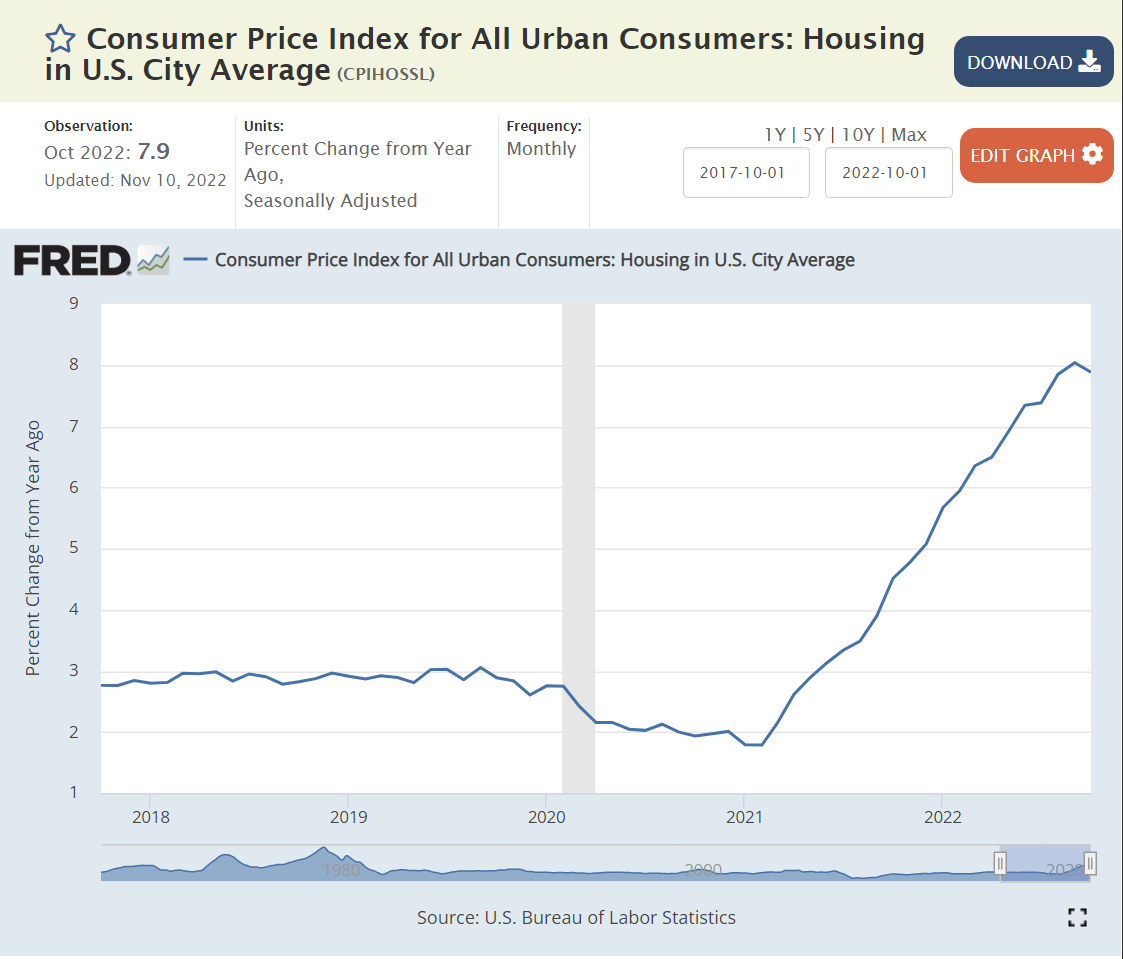
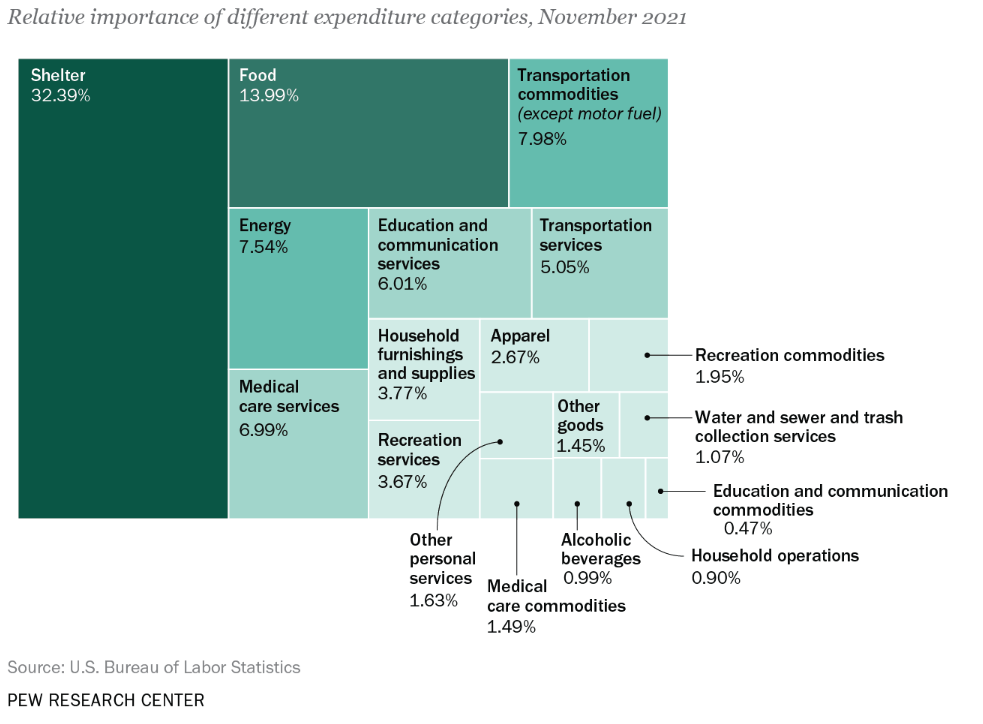
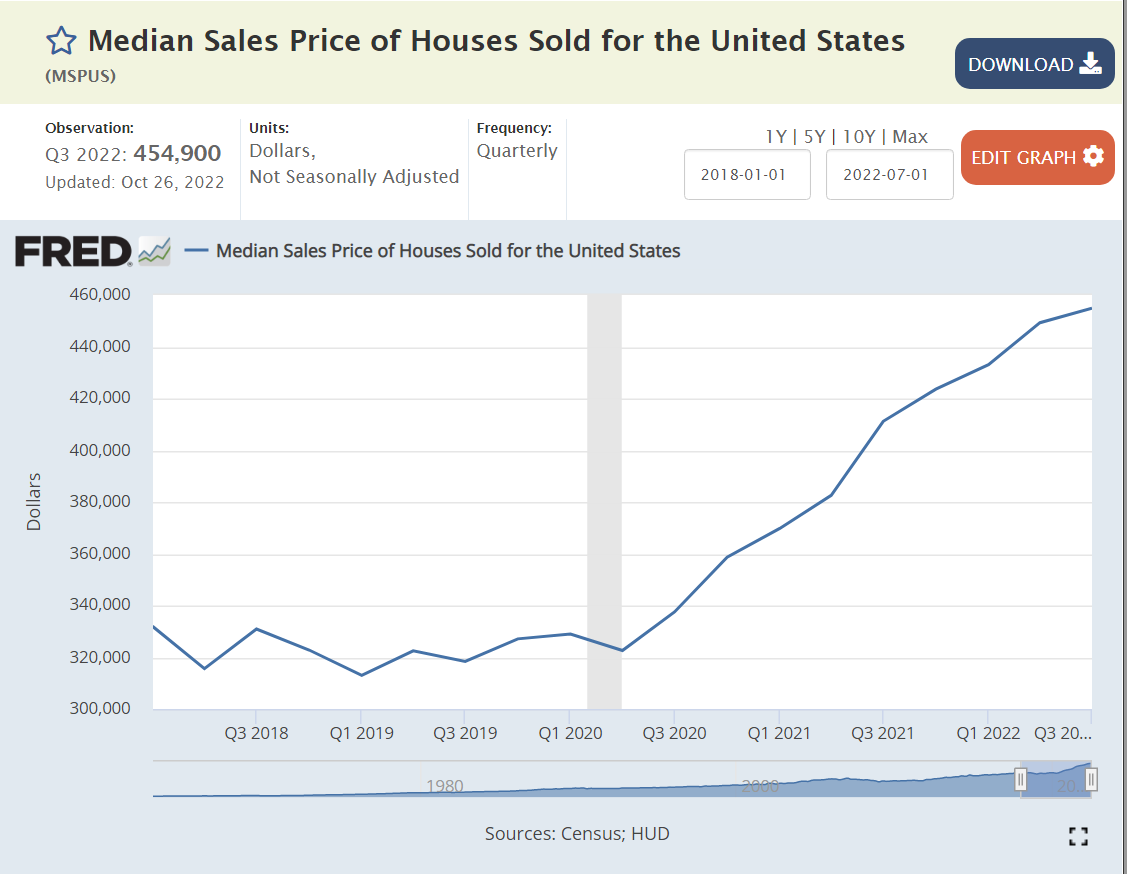
Housing/shelter is the largest component of the CPI. Both rental and home ownership costs are estimated, with adjustments used to try to smooth out variable month-to-month changes.
Annual housing inflation remained in the 2-3% range for the first year of the pandemic, but very quickly climbed to 6-8% as the supply of new homes was reduced and demand for housing of all kinds increased. Consumers saw this inflation in record high rent and housing prices (new or used).
With the Fed driving higher mortgage interest rates, consumers can afford less housing, so demand for new and used housing has dropped, causing owned and rental prices to flatten or fall.
Consumers have clearly seen the substantial increases in housing values and rents, and the subsequent flattening in recent months. Most consumers would estimate experienced annual housing inflation at more than 10% for the last 2 years and be unsure as to expected future housing and rent prices. When in doubt, consumers are likely to expect the worst; some level of continued increases in rents and total costs (mortgage payments).
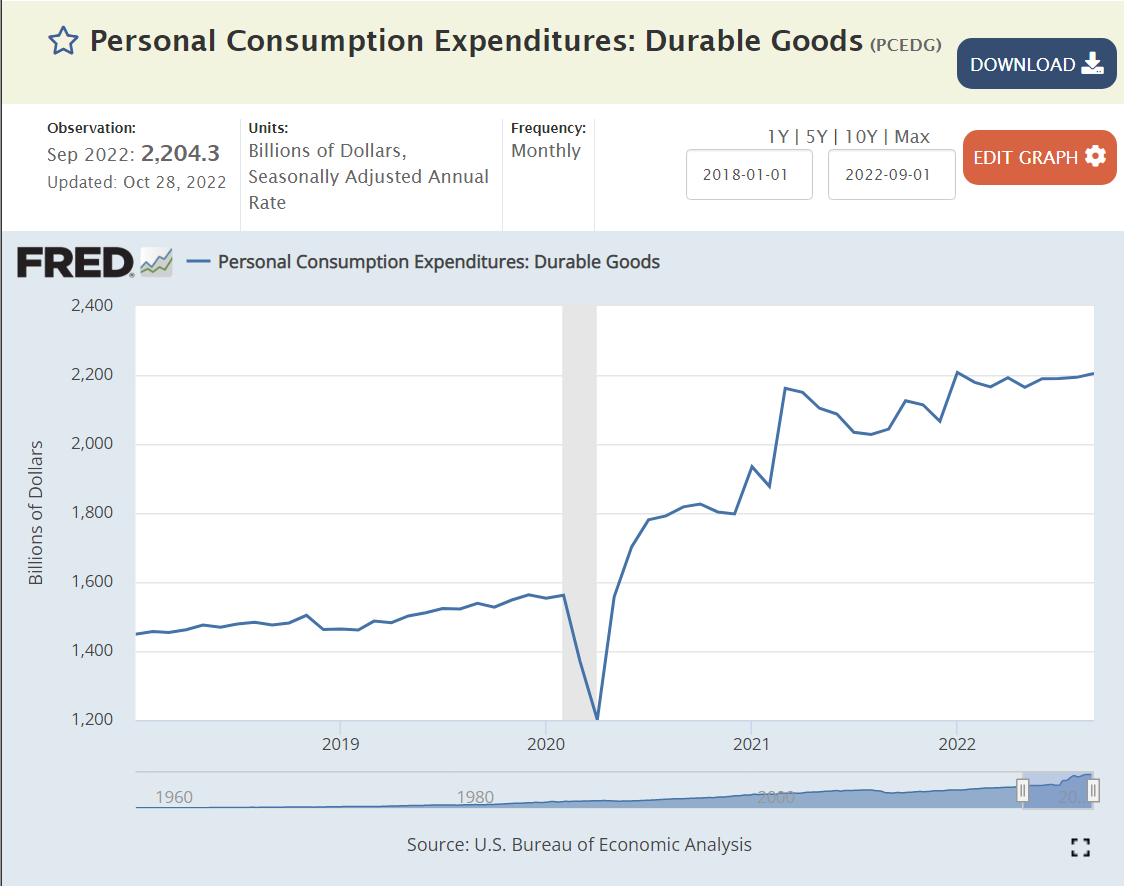
The pandemic’s large consumer and business subsidies lead to a 20% spike in demand for durable consumer goods, which drove a 25% price increase in 18 months. Consumers obviously experienced this large price increase, even though it was implemented over more than a year. Prices effectively peaked by February, 2022 and then returned to their usual 0-2% annual level. Consumers can feel that “everything costs more”. Many durable goods are purchased infrequently, so the new zero inflation will take some time to shape consumer perceptions, but we are already 9 months into this cycle, so consumers are mostly feeling better about this category.
The “transportation” subset of the CPI looks like the durable goods graph. It contains the prices of cars and trucks, the cost of fuel, insurance and maintenance. I think that most consumers would say that transportation costs are up and have not yet begun to fall, even though the index indicates that they plateaued beginning in March, 2022. This is another category where expectations should slowly change to match the numbers.
Used car and truck prices stayed flat or declined in the 7 years before the pandemic. In the 17 months from June, 2020 to November, 2021 they increased by 45% as private vehicle demand increased and new car supplies shrunk. Used car prices have essentially flattened in the last year. Consumers are aware that prices have stopped increasing but suspect car dealers of still trying to raise prices further. A little more positive experience on this higher profile measure will help to reduce inflation expectations.
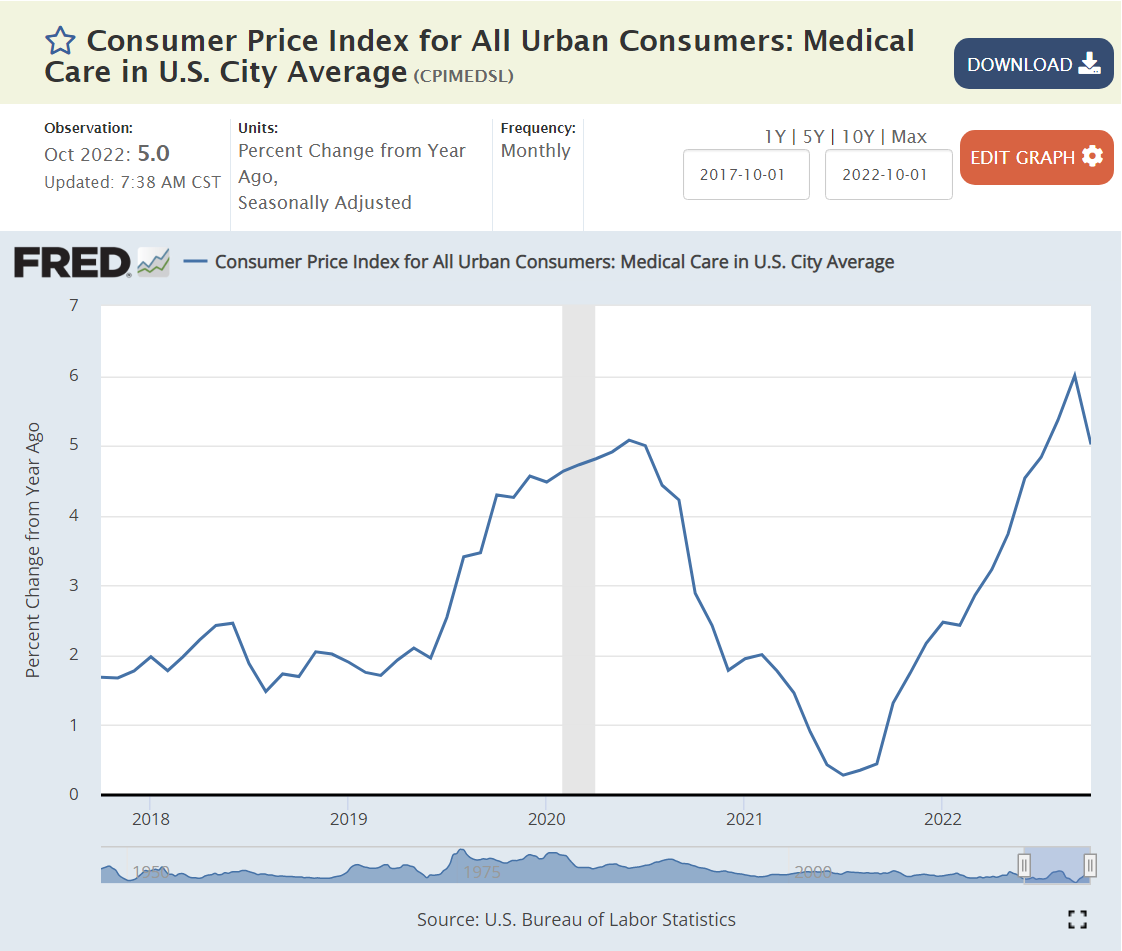
Medical cost inflation was a bit elevated at 5% heading into the pandemic, then fell to less than 2% during 2021. It has since returned to 5%. Consumers have relatively weak perceptions of medical costs due to the buffer of insurance policies. Most service prices were restrained during the first 2 years of the pandemic as demand for durable goods was up, but demand for services was down.
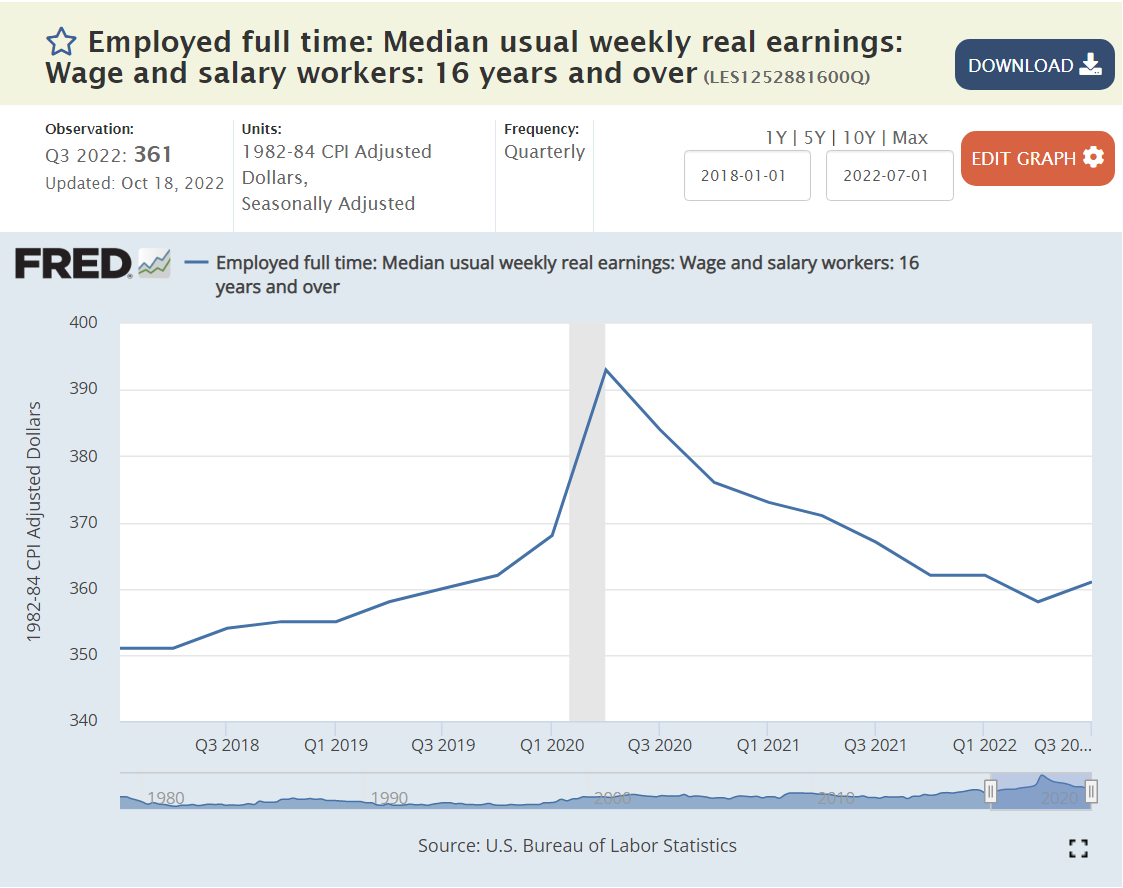
Another way that consumers gauge inflation is through their “real”, inflation-adjusted incomes. Real incomes were increasing slowly in the 3 years before the pandemic, following many flat years. Businesses bid up wages during the first year of the pandemic, but then reduced the increases in their offered wages to less than the increase in inflation. Hence, real wages have decreased by about 2% annually in each of the last 2 years. Hence, at a total level, workers are feeling inflation, because their wages are able to buy a little less at the end of 2022 than at the end of 2020 or 2021.
Summary
The data clearly indicates that inflation has peaked and is heading downward. The rate of decline is unclear. It’s unclear how long it will take to return to a stable 0-2% rate. Consumer perceptions are likely to lag the data by 3-6 months.
Total inflation reached an inflection point in June, 2022, pointing to 3% inflation, rather than 8-9%. Core inflation increased quickly throughout 2021 to a 6% annual level, but has remained flat at 6%. Food inflation reached a 12% annual level, but has slowed to 7%. Energy inflation reached 30% for an extended period of time, but has decreased to “just” 20% with high variability. Official housing costs rose by 8% annually, while consumers experienced 10% plus cost increases. The official housing inflation rate has declined a little to 6%, while consumer perceptions of current and future housing inflation are mixed. Durable goods inflation exceeded 12% annually, but has dropped back to its typical 0-2% range. Broadly defined transportation costs increased by 12%+ for more than a year and have flattened out recently at close to zero percent. Medical cost inflation was low after the pandemic, but has increased back up to 5%. Real worker wages have declined by 4% in the last two years, making inflation a felt reality. There is no sign of a wage-price spiral.
The worst of the post-pandemic inflation appears to be over. Key sectors show flat or declining inflation. Gas prices and used car prices are down. Consumers have used up most of their excess savings. Government spending is way down in real terms. Increased interest rates and a tight labor market are slowing the economy. Consumer inflation expectations are coming down with experienced inflation. Barring another major supply chain disruption, inflation should be under 3% before the end of 2023.
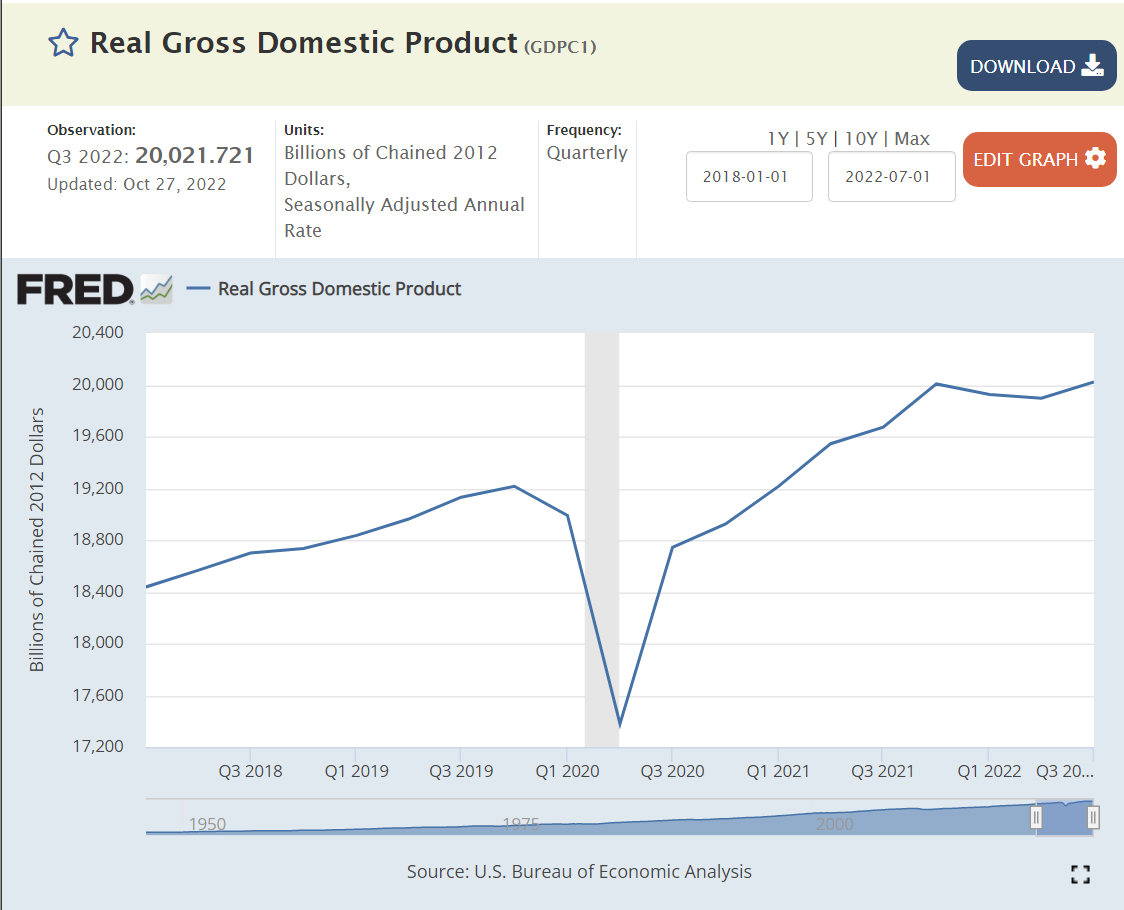
Real, inflation adjusted, GDP has quickly resumed its long-term growth rate. GDP grew in the 3rd quarter and on an annual basis has continued to grow through the 3rd quarter of 2022. Employment recovered more slowly, but has exceeded the pre-pandemic peak. Very solid job growth has continued through September, 2022.
Real, inflation-adjusted, consumer spending quickly recovered from the pandemic and continues to grow. Consumers have enough income and savings to spend more, despite inflation challenges.
This is the labor market we have been waiting for since I graduated from high school in 1974. Record low unemployment, twice as many job openings and real wages above those of 2018-19, after inflation.
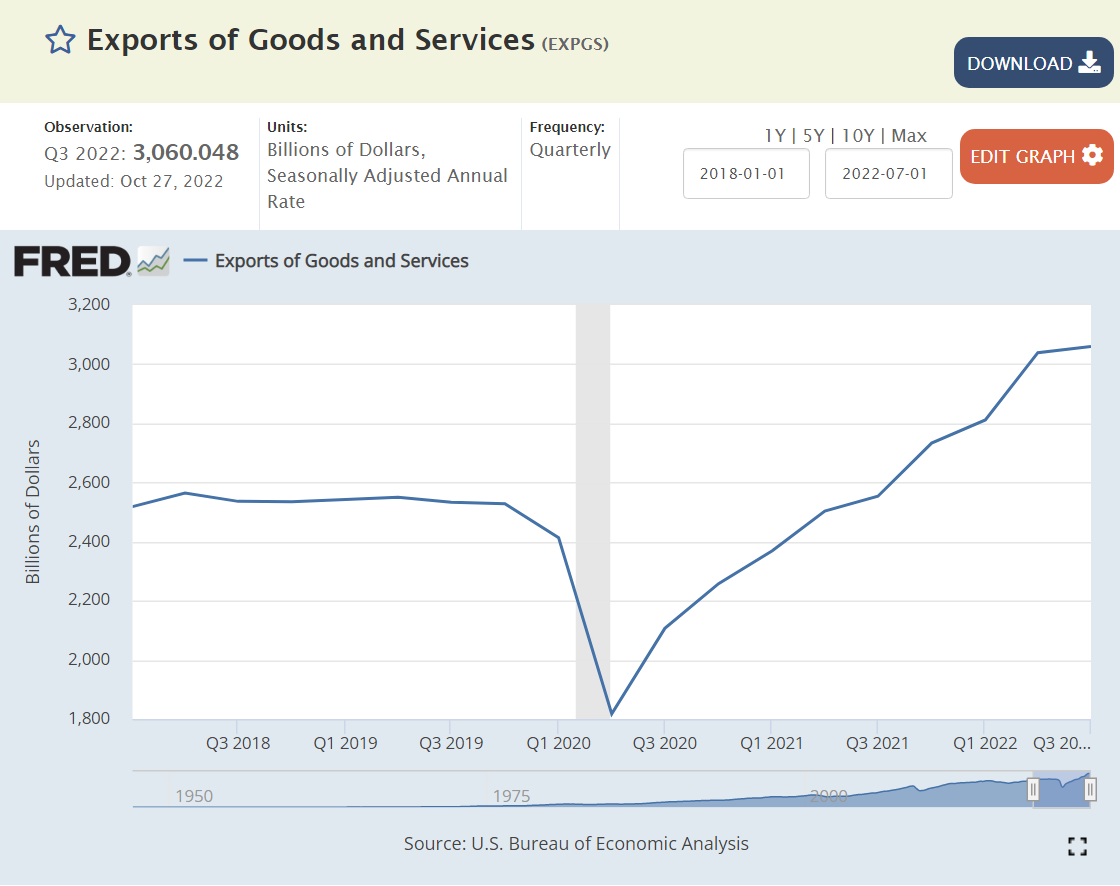
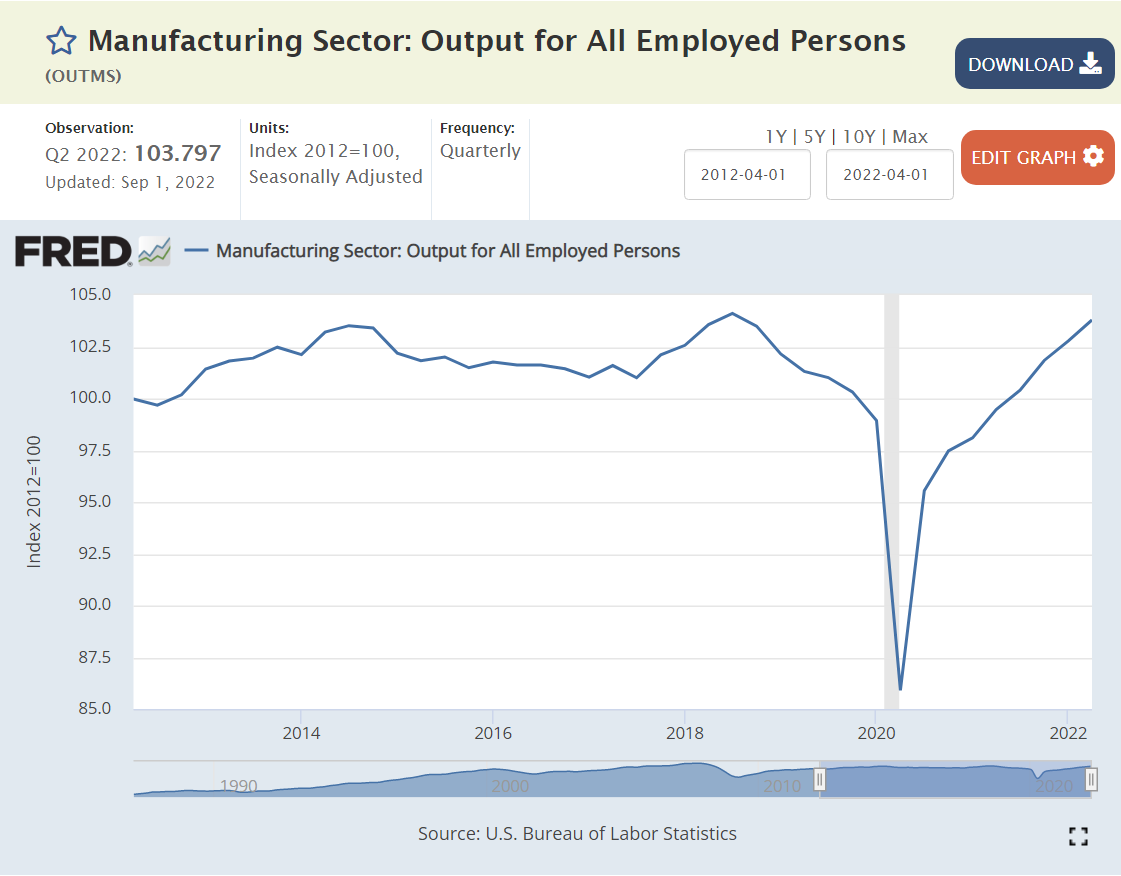
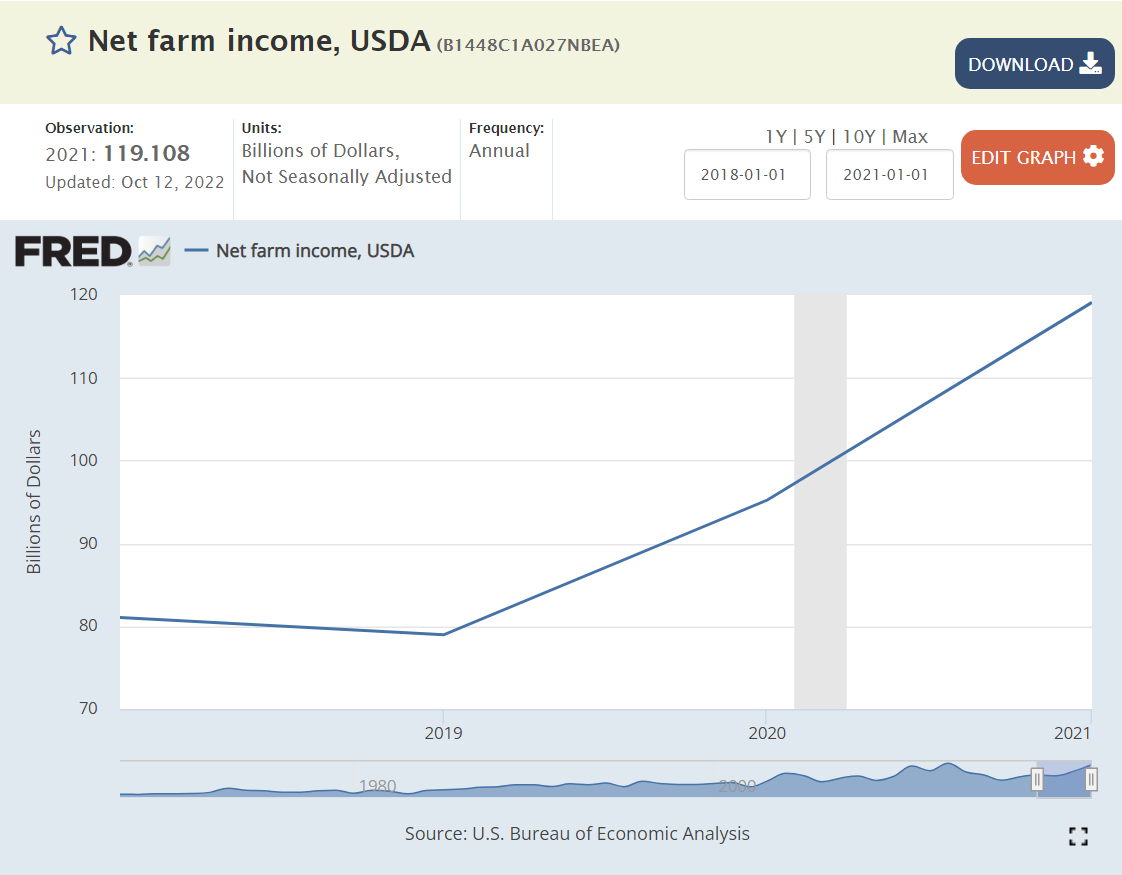
The overall US economy continues to grow, faster than other countries, including China. Exports are up by 20% as US companies continue their competitive wins. This is in spite of a much stronger US dollar. Imports are also up by more than 20%, providing consumers with the best of all global choices. Manufacturing output and employment have recovered to pre-pandemic levels. Farm incomes and output are up significantly.
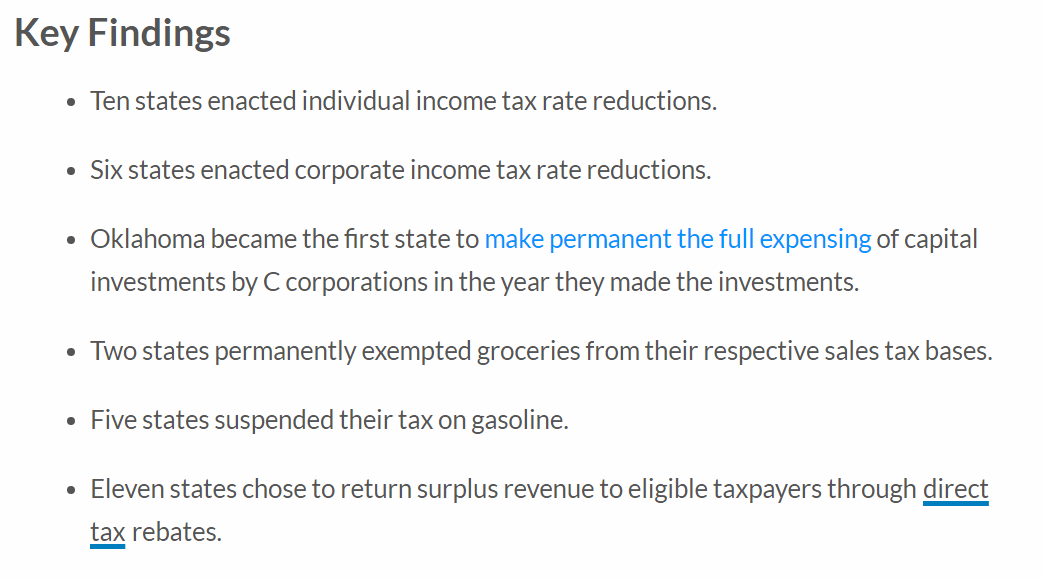
The federal budget deficit has been cut in half, with fiscal year 2022 back to the 2019 level. States have strongly recovered from the pandemic with increased revenues and slowly growing expenditures. State reserve funds are at record levels. 11 states had enough reserves to provide rebates to their taxpayers.
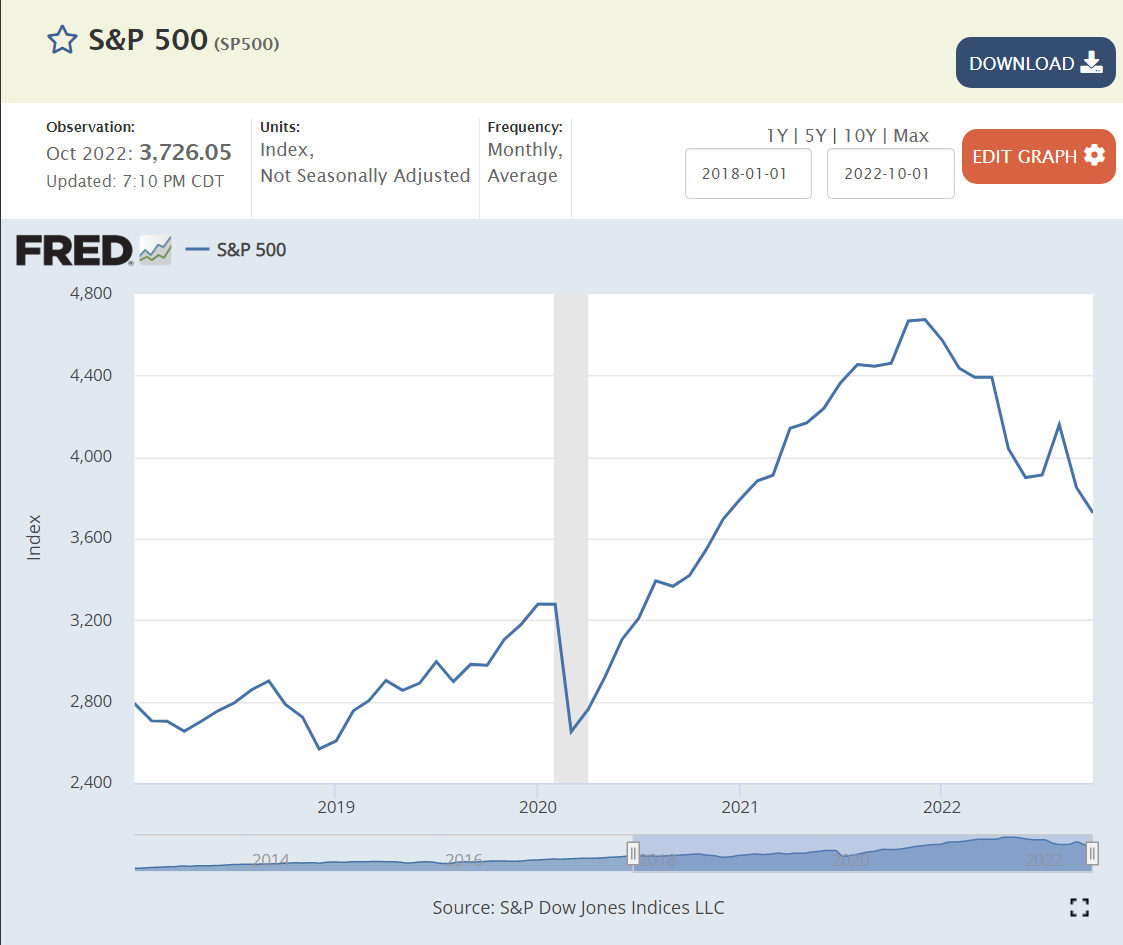
Retirement savings is at a record high. House values are up by one-third. The US stock market is up by one-third, despite the significant declines in 2022. Used car values are up by one-third. Retirement after age 55 remains very attainable for a majority of individuals. This growth in personal asset values has taken place while corporate profits have increased by one-half.
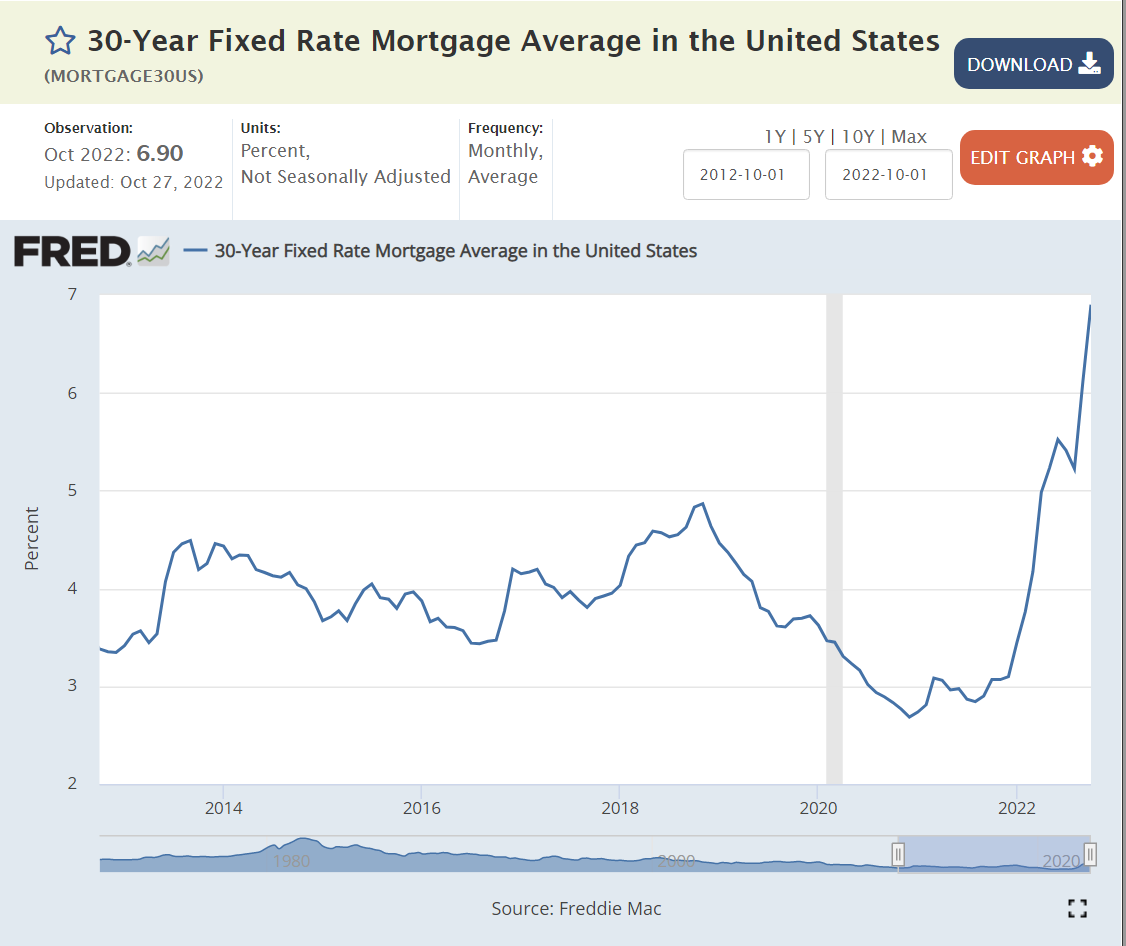
Most Americans today have fixed rate mortgages at 2.5%-3%-4%, locking in advantageous low mortgage payments for 10-30 years. New home buyers and those who must move and get a new mortgage do face 7% interest rates. Mortgage delinquencies are down by 80% and credit card delinquencies are down by one-third. Child poverty, after transfers, is at a record low.
Summary/Interpretation
The news media and politicians want to highlight the negative aspects of the US economy: higher inflation, lower personal savings rates, higher mortgage rates, higher home and apartment rents and prices (lower affordability).
It’s important to put all of the pieces in perspective. Inflation is higher and threatens fixed income and low-income households. Households are using up their extra pandemic period savings. The real estate market is slowing, but prices remain high. Economic growth is close to zero, so there are relatively fewer open positions and net new jobs created. There is a threat of a mild recession continuing through the second half of 2023. BUT …
The overall economy has quickly recovered from the pandemic and exceeded record pre-pandemic levels. Recall that the post-Great Recession recovery continued for almost a full decade. The economy recovered from the record pandemic lock downs and “lost jobs” faster than anyone expected.
Economic growth was low, marginally below the arbitrary 0.0% level in the first and second quarters, but recovered to 2% in the third quarter. Annual GDP growth is likely to be in the -1% to +1% level for the next 3-4 quarters as the Federal Reserve Bank’s increased interest rates work through the economy. We may have an “official recession”, but households will encounter limited negative effects.
The labor market is likely to continue its very positive status. Firms still have 10 million open positions that they expect will EACH deliver positive net economic results. We have a labor shortage. At some point, business Republicans will join Democrats to revise restrictive immigration rules and other policies that limit labor force participation.
Firms, businesses, retirement plans and state governments are in very solid economic shape. Assets are very high, liabilities are low. Net assets are at record levels. The Federal government budget deficit is back to the pre-pandemic level.
There is no evidence of a wage-price spiral of inflation. The president and most Democrats seem to accept the Federal Reserve Bank’s actions to increase interest rates, slow the economy and return inflation to its prior 30 years of modest 2%.
Behavioral economists have repeatedly shown that most people are much more sensitive to losses and risks than they are to economic gains. Hence, it is natural to focus on higher inflation and slower growth and discount the many other positive results.
The US economy quickly recovered from the severe pandemic recession with less collateral damage than anyone expected. The growth in the money supply and federal spending/transfers to ensure that we avoided a business, banking and personal meltdown drove a faster than expected recovery resulting in supply chain disruptions, labor shortages and inflation. The “experts” were slow to identify this situation and take offsetting policy steps. Fortunately, fiscal and monetary policy during 2022 have been tight, slowing the economy. We are in the difficult months of transition. No one knows if the steps taken so far are adequate, exactly right or too much. We need another 3 quarters to decide.
Napa and Sonoma wines command premium prices (deservedly). North Coast and Central Coast wines are great everyday wines at much lower prices. A half dozen other California appellations today produce wines that compete well with Napa/Sonoma, with a shrinking price advantage as wine buyers become increasingly sophisticated. The Willamette Valley and Columbia River Valley regions are also becoming direct competitors with California wines, with significant discounts for most comparable Columbia River Valley labels.
Wine is grown across North America today. The best regions include the New York Finger Lakes, Lake Erie, Northern Michigan, Texas Hill Country and Northern Virginia. Canada’s British Columbian Okanagan Valley wines are becoming more competitive, and the Niagara ice wines fill a sweet niche.
The majority of “top 40” hits or “top 100” annual hits in 1967 were melodic and similar to the last 5 years of music. But a subset of 50 less popular songs pointed towards a very different future.
Most of these songs could not be created 5 years earlier or played on the radio in 1962. It’s very hard to explain the break from traditional music and views that began in 1967. Here goes …
“Folk music” was clearly becoming countercultural in 1967, questioning societal norms.
Classic R&B was adopting a sharper edge.
R&B/Soul/Jazz was starting to become much more funky.
The Beatles continued to crank out singles. Less pop, more questions.
The “rockers” were becoming much more “edgy”.
The Stones were adapting …
Jimi Hendrix offered a once in a lifetime music lesson.
Countercultural rock emerged as a major force in 1967, for good or for bad.
Summary
50 edgy new singles in 1967. 1967. 1967. The British invasion continued, with the Beatles, Stones and others making their music and lyrics more current, dynamic and experimental. Core US R&B/Motown/Soul groups adopted a more experimental and critical tone. Folk music poked at societal norms. Rock ‘n Roll leveraged the sharper, electronic riffs. The San Francisco sound wailed. The Doors “broke on through” to the other side. Jimi Hendrix emerged.
The world would never be the same. Music belonged to the young. The sound would be somewhat discordant. The message would be challenging. Musical standards would forever be so much higher.
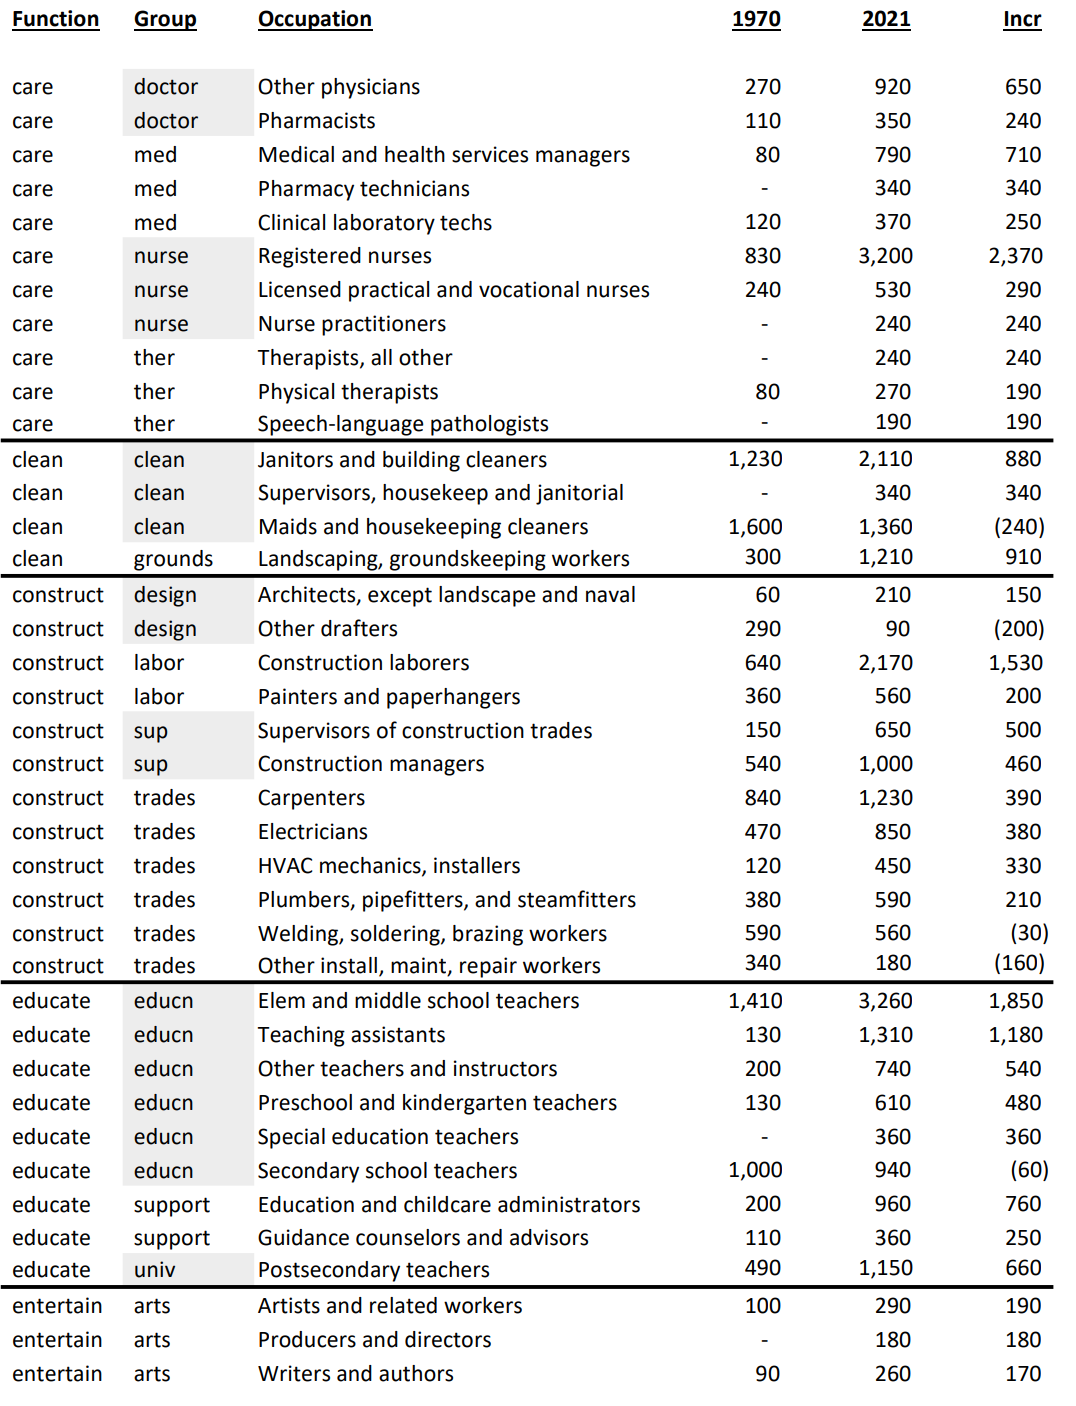
This is a follow-up article to my recent post on “A Very Robust Long-term US Labor Market (1970-2021). Rather than focus on total growth or the “skill-level” of jobs in the labor market, I want to focus on the roles or functions (like career clusters, similar to industries) played by the 150 million US workers in 2021. I’ve grouped the 500 detailed occupations into 17 categories so that we can look at subtotals ranging from 1% to 20% of the total, with an average of 16%. Enough detail to highlight the very significant changes in the last half-century.
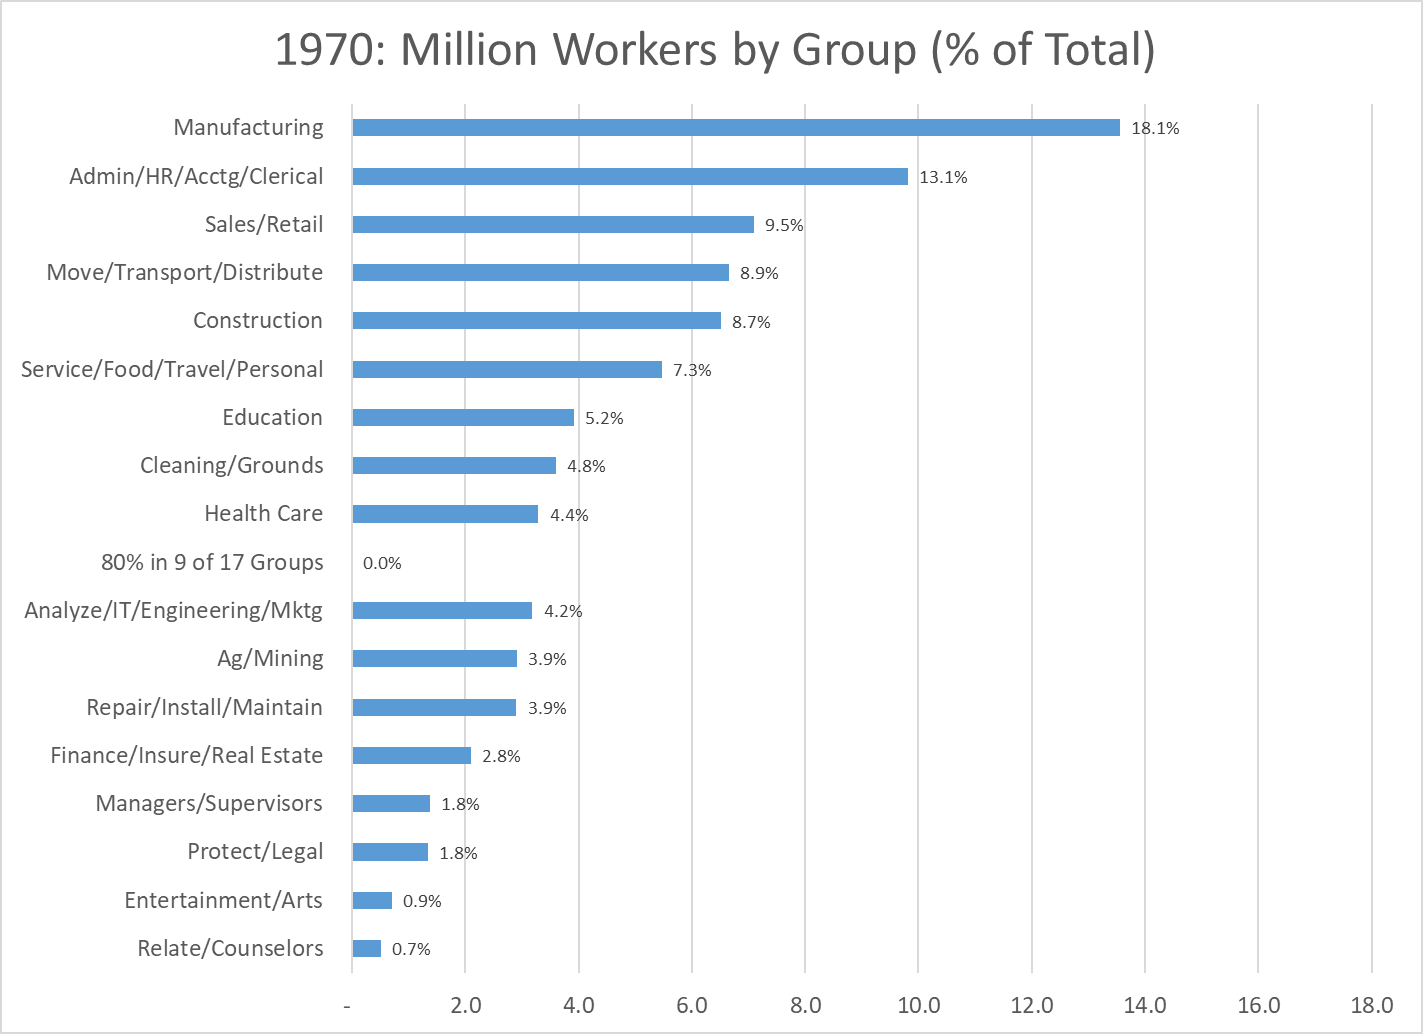
Let’s start with the 1970 data. 75 million employees. Manufacturing was the “big dog”, with almost 14 million workers, 18% of the total, a little less than one out of five.
Administrative workers, including clerical, HR and accounting staff at all job levels were the second largest group, with 10 million people and 13% of the total, one out of eight jobs. These two traditional categories accounted for 31% of the total, not quite one-third.
The next three groups each accounted for 9% of the total, one of every eleven employees. Sales workers, at managerial, professional and retail/clerical levels. Members of the logistics industry broadly defined, including both transportation and distribution staff. Employees of the construction industry. Once again, classic job functions in 1970 that would have been familiar in 1930.
The narrowly defined “service sector”, combining staff in the food service, travel and personal services industries contained 5.5 million workers, or 7% of the total. These six together included 70% of all workers.
Six other categories were each a much smaller 4-5% of the total: Education (KG-post secondary), Cleaning and Groundskeeping, Health Care, Analysis (finance, IT, operations, engineering and marketing), Ag/Mining and Repair/Installation/Maintenance.
The final five categories each averaged just 1.5% of total jobs: Finance/Insurance/Real Estate, Managers/Supervisors, Protection/Legal, Entertainment/Arts and Relating/Counselors.
By 1970 production agriculture had already declined to an immaterial share of the economy. The historically male and blue collar dominated Manufacturing, Logistics, Construction and Repair categories combined to account for 40% of all jobs; two out of five. The historically more female friendly Administration and Sales functions held 25% of all jobs, one in four. Education was the largest “information industry” at 5%, largely dominated by traditional elementary and secondary school teachers. A more broadly defined service group of food service, travel, personal service, cleaning/grounds and health care summed to 17% of the total, or one in six jobs.
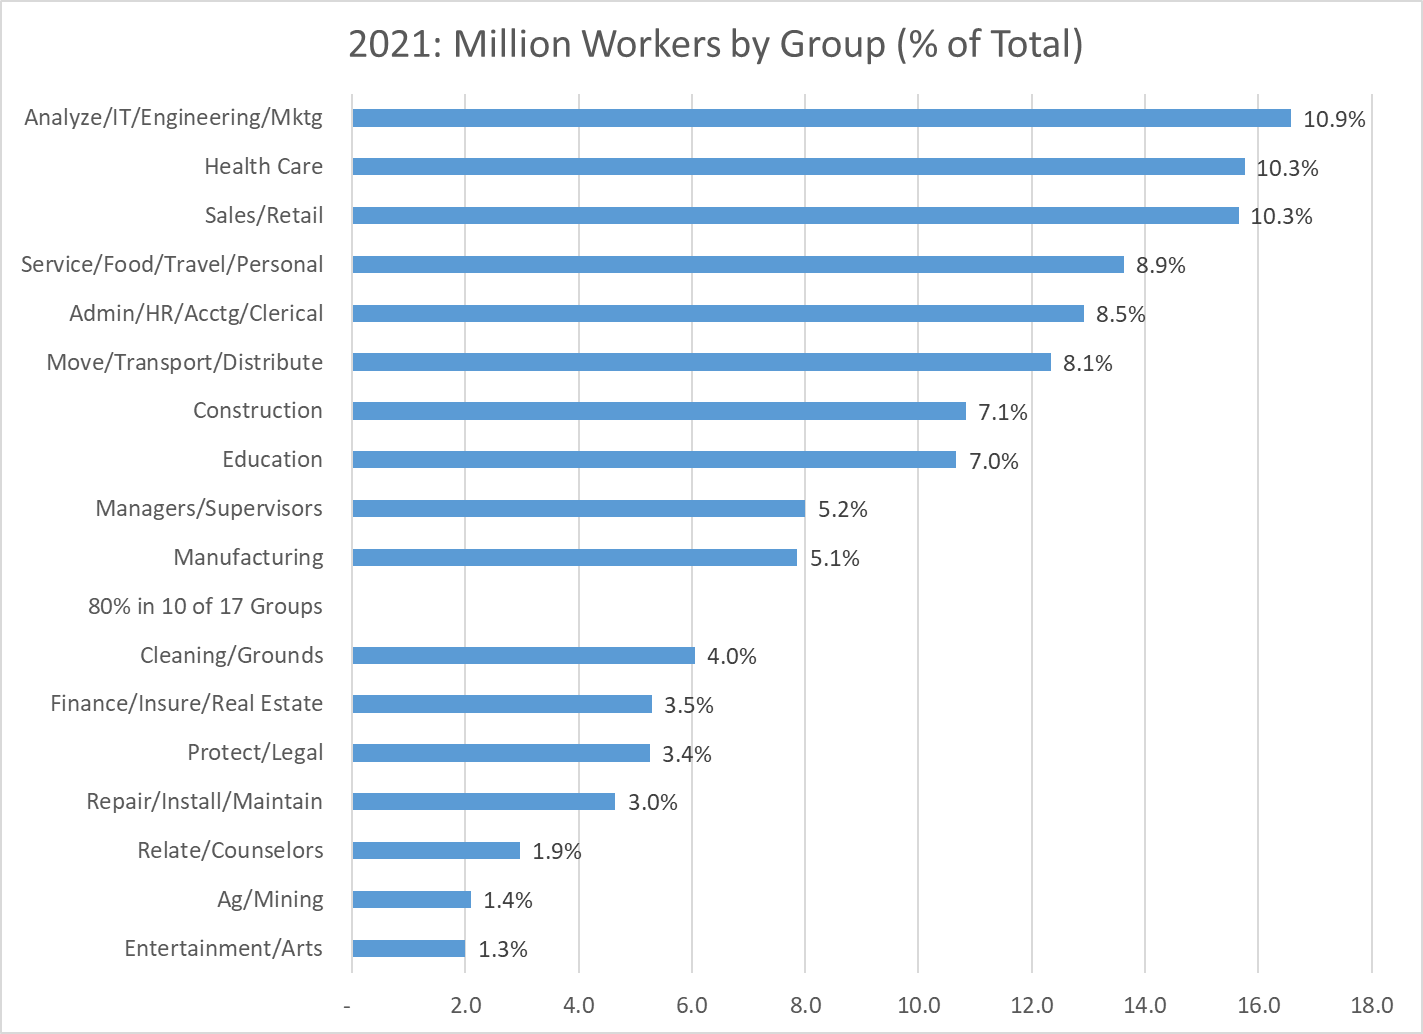
Six categories changed very significantly between 1970 and 2021. Manufacturing dropped from first place to tenth place, from 18% to just 5% of employment, from 14 to 8 million employees. US firms improved labor and overall productivity throughout this period, keeping the most productive firms and factories open, while closing and outsourcing work from the others. This was a tremendous change in the labor market, completed in just two generations of workers.
The Administrative category also declined markedly, from second place to fifth place, shrinking from 13% to less than 9% of total employment, but increasing slightly from 10 to 13 million staff. Process, computer and telecom changes drove improved productivity. Some administrative jobs were outsourced. While the Manufacturing sector lost two-thirds of its labor market share, the Administrative sector lost one-third.
The Ag/Mining group was the third losing category, dropping by nearly two-thirds from 3.9% to 1.4% of all employment. When politicians talk about “reviving” manufacturing, mining or production agriculture they are working against very strong long-term trends.
The largest growth was in the “Analysis” category, which grew by two and one-half times as a share of the total, from 4% to 10%. There was incremental growth in the existing Engineering sub-category, adding 2 million roles. The IT category grew added almost 6 million roles from a base near zero. The operations, finance, marketing analysis group added another 6 million positions to its base of 1.5 million. The “Analysts” category rose from tenth place to first place as firms became more complex and found ways to better employ the talents of individuals with high level analytical skills. At 11% of the economy, one out of every nine jobs falls into the analysis category.
Health Care increased from ninth place to second place, moving from 4.4% to 10.3% of all jobs (2.5X). The number of jobs grew by 13 million, from 3 to 16 million.
The Managers/Supervisors category climbed from fourteenth to ninth place, rising from 1.8% to 5.2% of the economy, adding almost 7 million jobs. The 1970 detailed coding was somewhat different from the modern approach, with many supervisors and managers grouped with other professions or industries. My best guess is that on a comparable basis, the 1970 category would have been closer to 2.5 million than the reported 1.4 million managers and supervisors. This would have put this group in thirteenth place in 1970. Hence, the growth as a share of the total market would be smaller, from 3.3% to 5.2%, but still quite significant. Once again, larger firms with more complexity demanded more managers and supervisors.
In total, we have 20% (1/5 workers) leaving the Manufacturing, Administration and Ag/Mining sectors and 16% (1/6 workers) joining the Analysis, Health Care and Managers sectors.
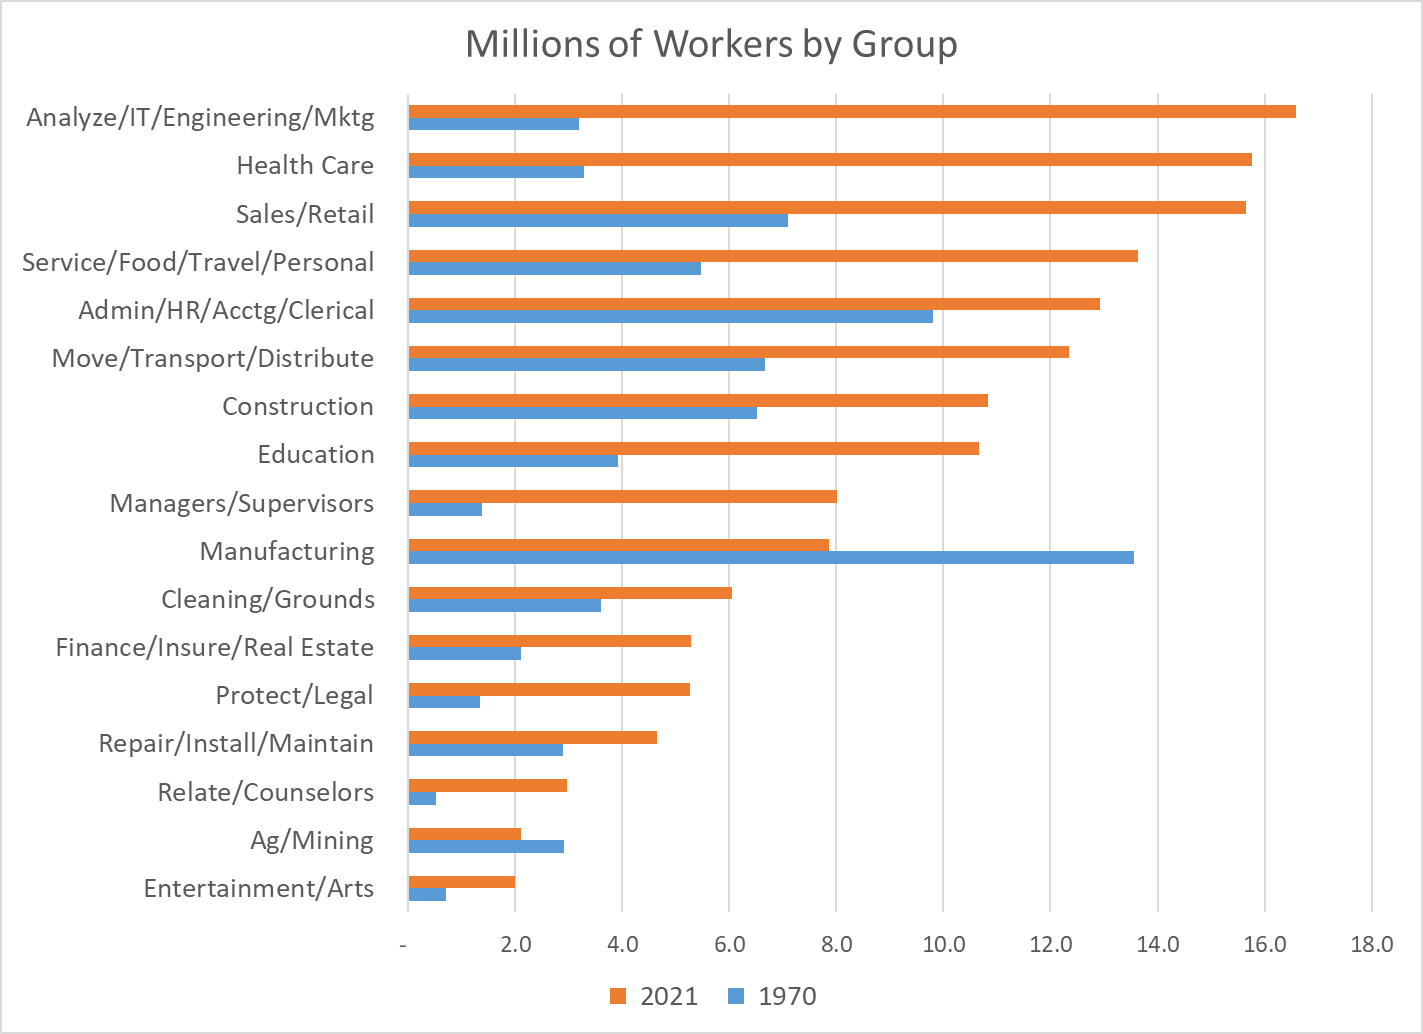
Comparing the millions of employees in 1970 to 2021 by sector clearly shows the massive changes in the labor market. The Health Care and Analysis sectors leapt from a small 3 million workers each to 16 million workers each. Manufacturing fell in absolute terms from 14 to 8 million workers. The Sales and Service sectors began as large sectors, so their relatively normal growth still added about 8 million roles each. Construction and Administration began as larger sectors and were able to add 3 million employees each, despite slower than average growth rates. Logistics grew slightly slower than the market, but added 6 million workers. Education grew faster than average, adding 6 million colleagues.
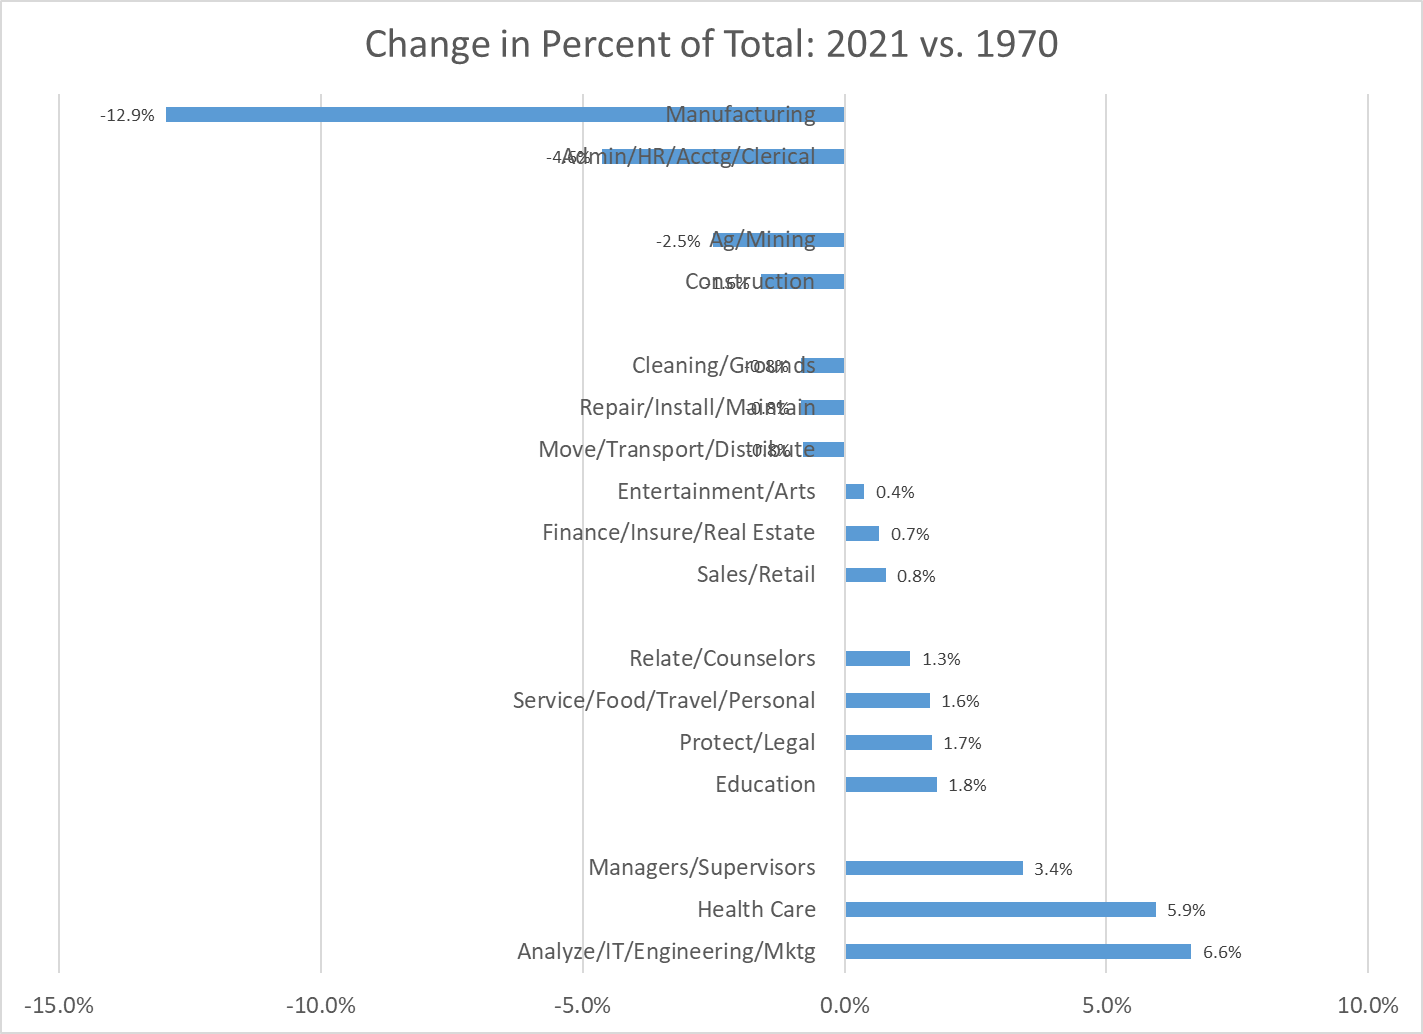
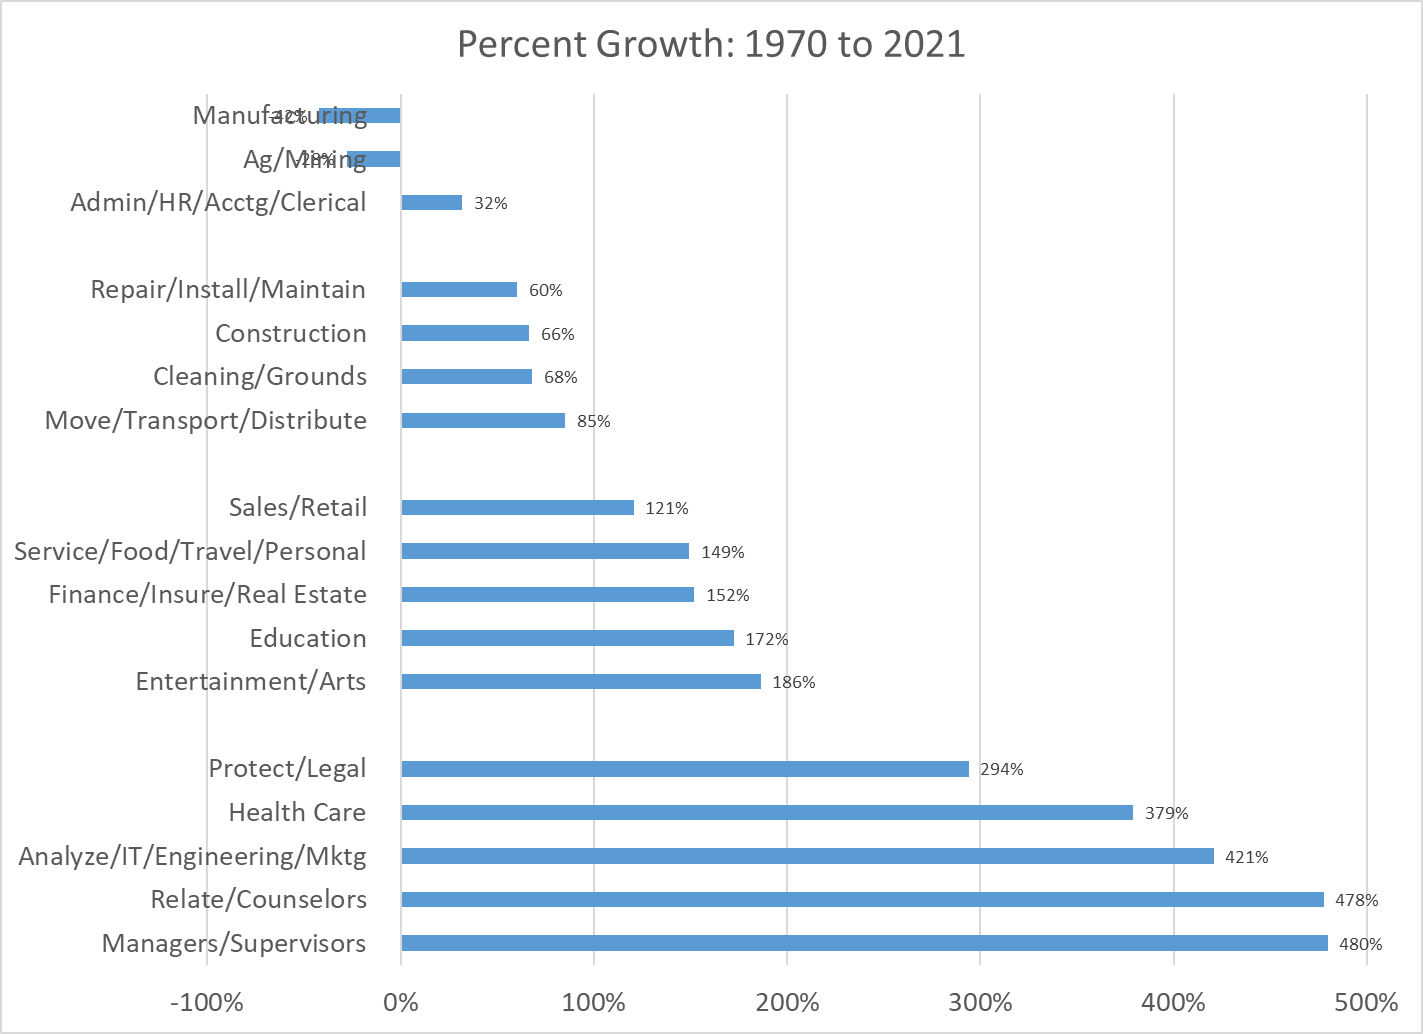
Relative growth rates as a percentage of the 1970 base or as a percentage of the total mostly tell the same story. Manufacturing, Administration and Ag/Mining have declined sharply. Analysis, Health Care and Management have grown materially.
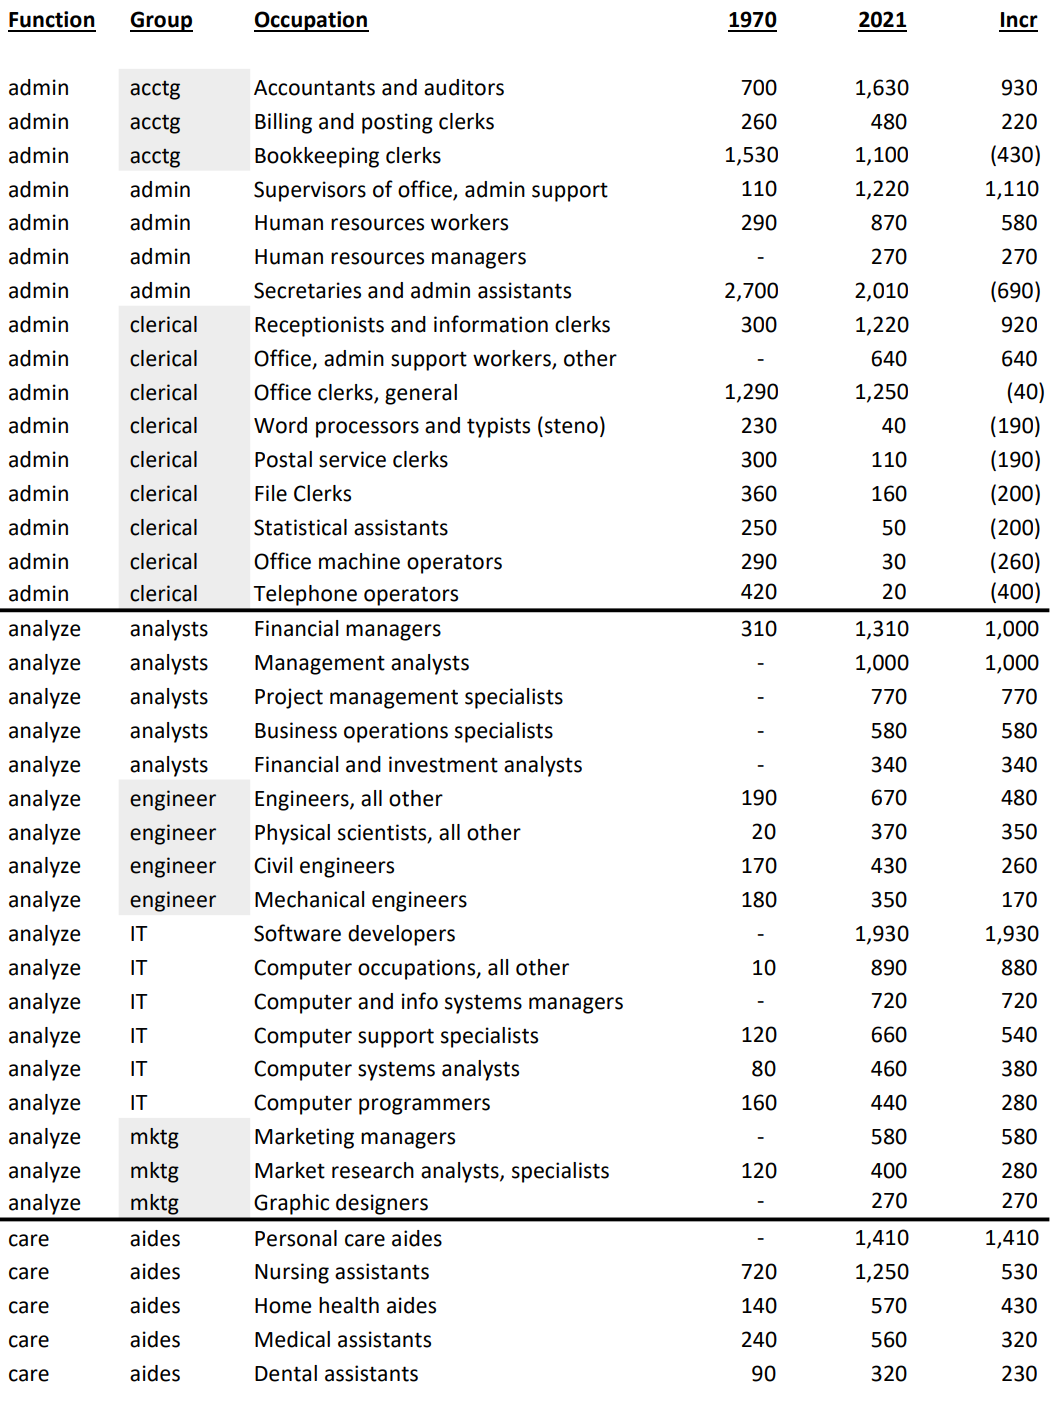
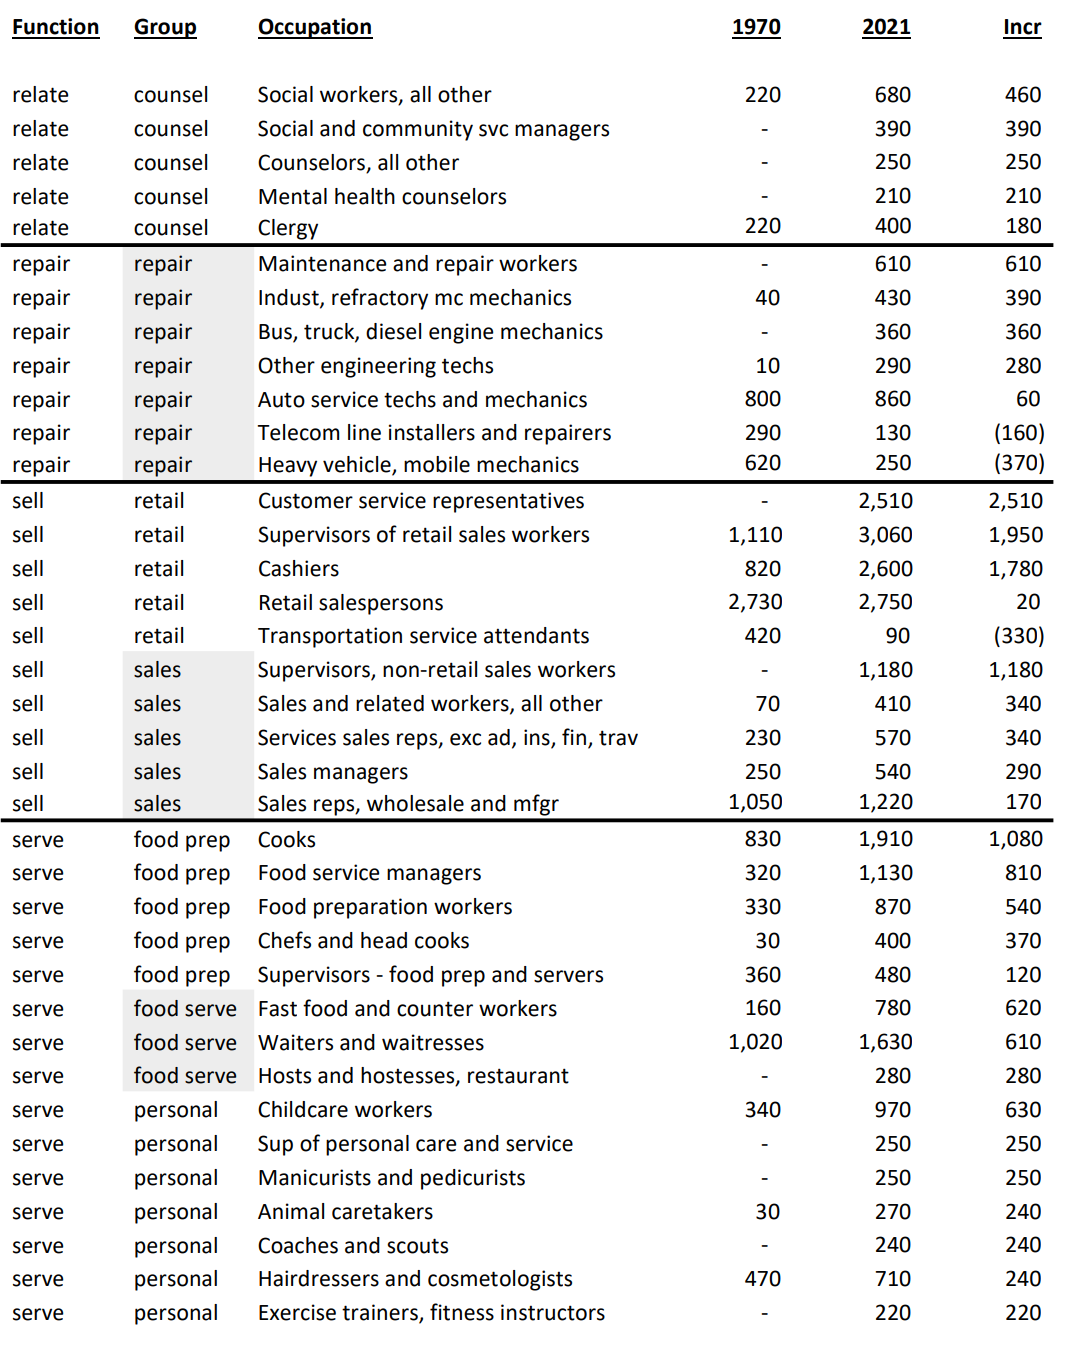
The 152 largest detailed occupations and those with the greatest change in employment are documented below. They account for 91 million jobs, 59% of the 2021 total.
Economists assert that the principles of comparative advantage drive national economic activity. In essence, nations, firms and individuals rationally do what they are “relatively” best at, which changes through time. We see this reduction in the role of agriculture, manufacturing and mining across long periods in the US.
Economists assert that consumers’ tastes change as they have higher income and the relative prices of goods change. Once basic “food, clothing and shelter” needs are met, people turn to other “needs” and “wants”. These tend to be “services” and we also see this transformation.
Economists assert that profit maximizing firms will employ labor that provides a return on the investment based on the marginal or incremental value added by the labor resource. In a more complex economy, professional and managerial skills are in greater demand. Firms (and not-for-profits and governments) have adapted very well to these major changes in the last 50 years.
These changes are not without major pain to individuals, firms and local economies. The general trends in the economy (more automation, greater trade/outsourcing, more services, more personal care, greater role for analytical skills) are clear. Nations, firms, individuals and regions that adapt to the trends will be relatively successful. This requires wise individual and political choices and investments.