The last official forecast of Indiana’s population was made in 2012, estimating growth from 6.5M in 2010 to 7.5M in 2050. The actual population was a little higher than this forecast in 2020. My forecast is for 7.7M in 2050.
Indiana was and is an agriculture and manufacturing intensive state. Population growth slowed in the 1970’s and 1980’s before recovering in the 1990’s. Indiana added 1.2M people in the 30 years from 1990 to 2020, growing by 7% per decade, about one-half of the national average, but faster than its neighbors.
I expect the 2010-2020 growth levels to continue for the next 3 decades.
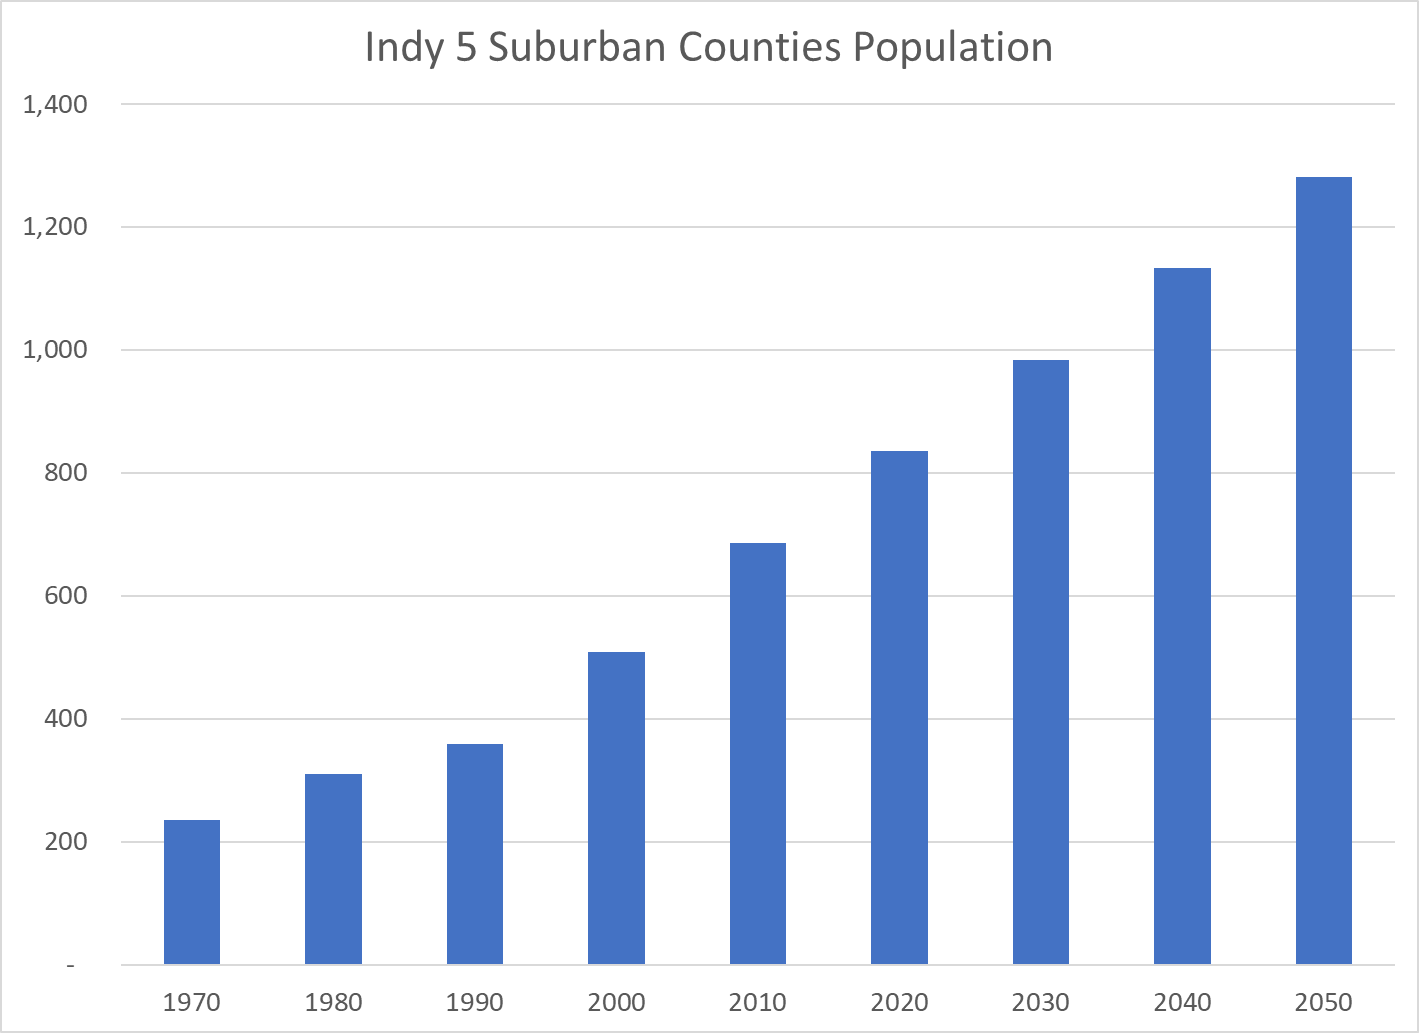
Indianapolis (Marion County) is the only major city in Indiana. It was also manufacturing intensive at the end of the 20th century. Its population growth stagnated in the 1980’s and 1990’s before recovering.
Indy’s suburbs were immaterial in 1970, but have grown to be nearly as large as the main city in 2020.
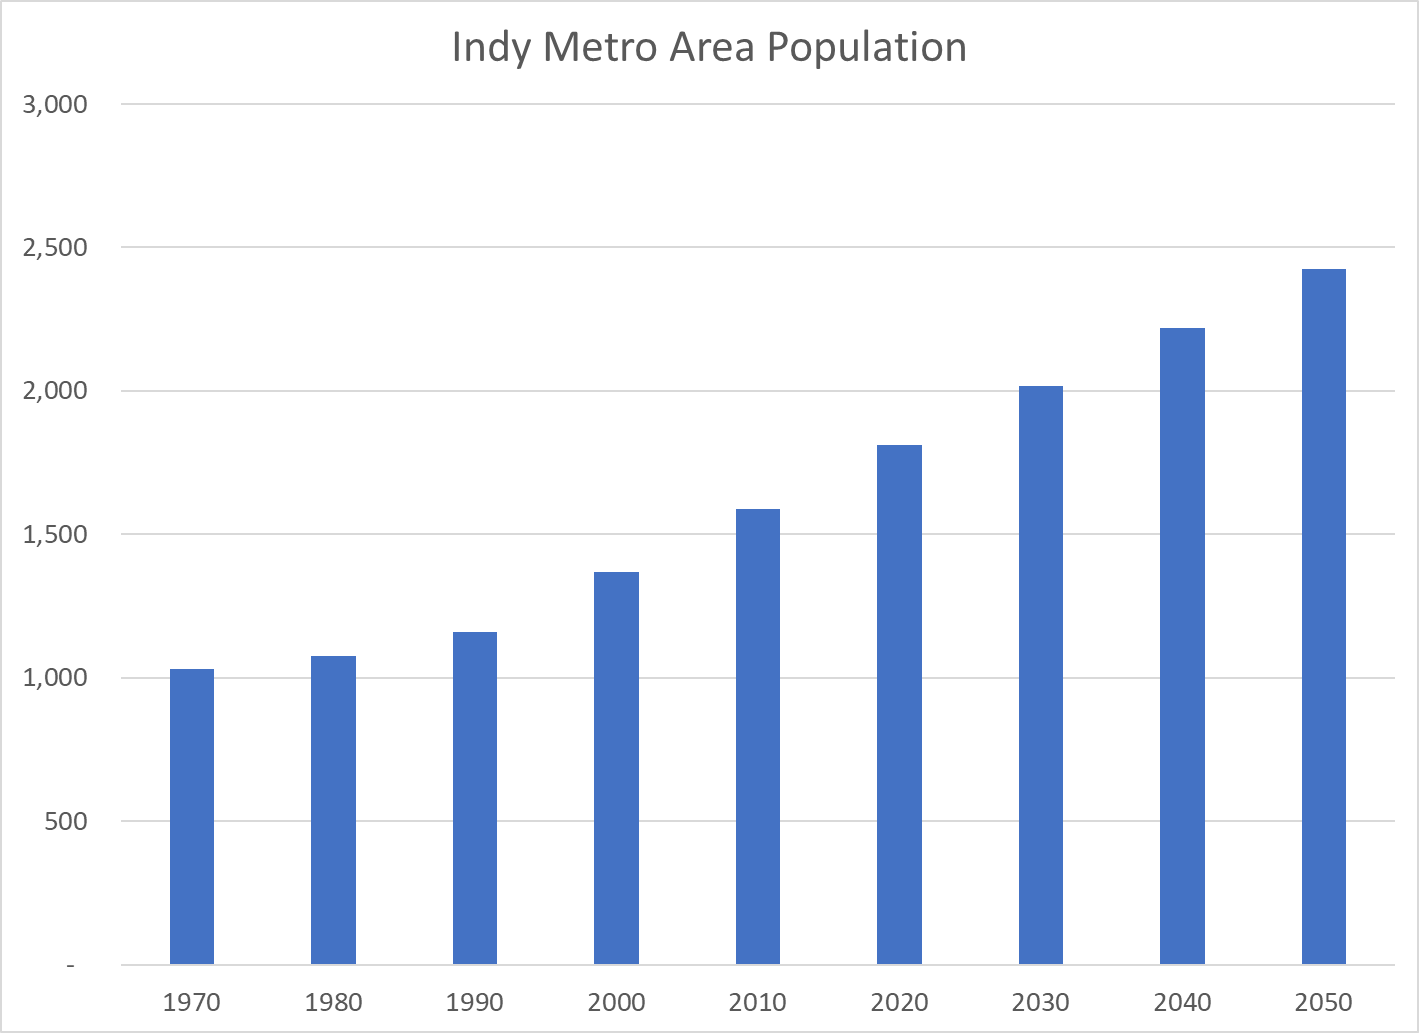
The total Indy metro area grew by 80% from 1990 to 2020 and is expected to grow at the same rate for the next few decades.
Like metro areas across the country, Indianapolis has grown much faster than the rural counties of Indiana.
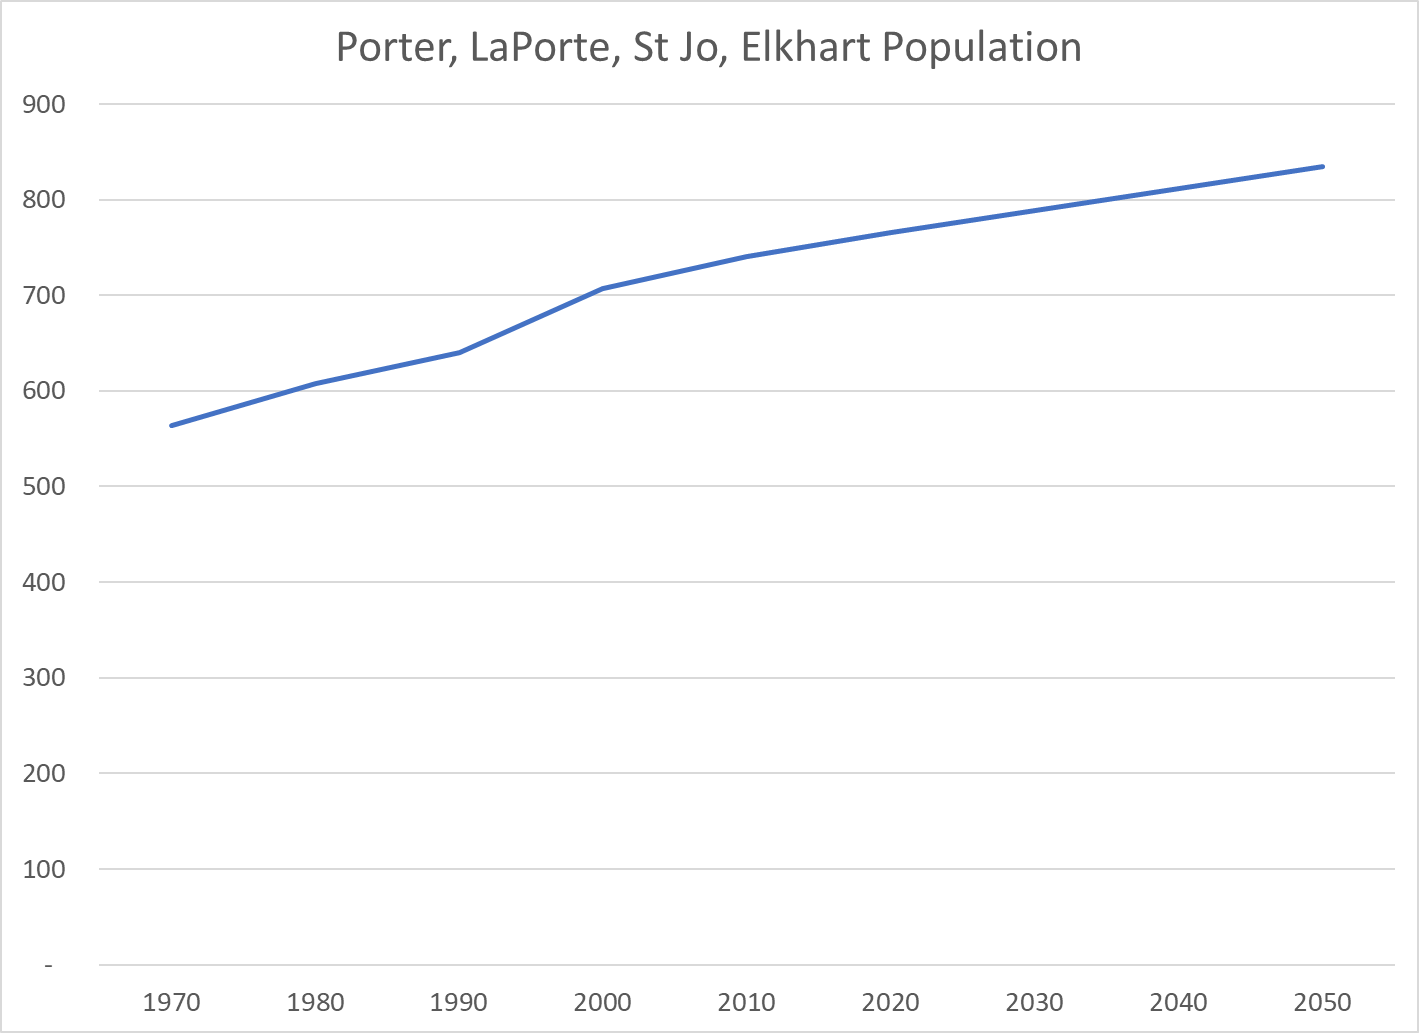
Lake County (Gary) in the northwest corner of Indiana is the second largest metro area of Indiana. Its population dropped drastically from 1970 to 1990 and has slowly recovered. This manufacturing intensive area is not considered a highly attractive Chicago suburb, but it has found sources of growth.
The four counties east of Lake County are a separate economic area and have grown since 1970 at a reasonable pace.
The I-90 corridor’s population was the same size as metro Indianapolis from 1970-1990, but their growth paths diverged afterwards.
Historically, Ft Wayne has been the third largest Indiana city. It was also a manufacturing leader, which slowed its growth in the 1980’s and 1990’s. It has since recovered and established a strong growth rate.
Indiana has 6 other minor cities that have collectively accelerated their growth since 1990. Tippecanoe and Monroe Counties benefit from their state universities. Columbus (Bartholomew) is a manufacturing leader supported by its proximity to IU and Indianapolis. Clark County is a suburb of Louisville. Evansville (Vanderburgh) has struggled to find a new economic engine due to its small size and remote location, despite the extension of I-69. Terre Haute (Vigo) has also been slow to find new engines of growth to replace its historic manufacturing strengths.
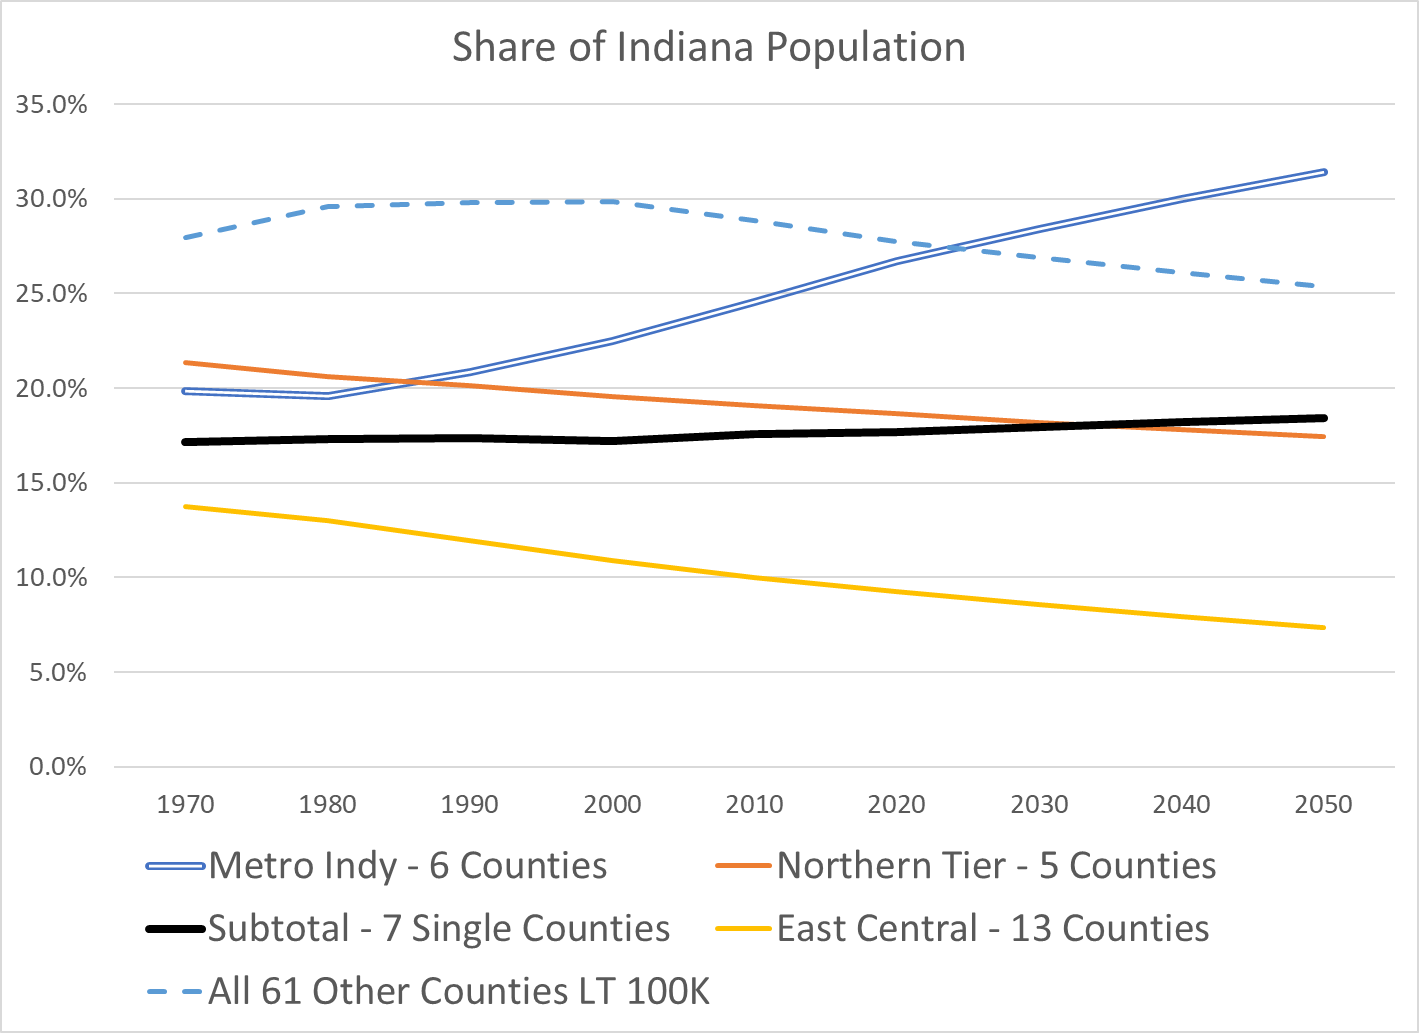
These 18 larger counties (of 92) have collectively driven almost all of the population growth in Indiana for the last 30 years. These trends are expected to continue for the next 30 years.
A broad swath of 13 counties north, east and northeast of Indianapolis have seen population declines in the last half century and will likely experience further declines. The natural gas boom, Wabash River transportation advantage and national road (US 40, I-70) advantage drove manufacturing in these areas in the early twentieth century. General Motors grew and then declined. The Ball Corporation grew and declined. Muncie was the subject of the famous Middletown sociology studies of the typical American community and this area, and the greater Indianapolis area have remained targets of marketing and political research studies. Logansport, Peru and Wabash along the river. Marion, Anderson and Muncie. Hartford City, Portland, Randolph, Richmond, Connersville, Newcastle and Rushville. The 61 other Indiana agricultural counties managed to grow slowly from 1970 to 2000 but found their limits afterwards.
In the modern world, local economies must find “critical mass” in order to succeed. Metro Indy is doing well. The I-90 corridor near Notre Dame is surviving as are the other mini-metro areas. The other 74 counties are stagnant.
Since WW II, the US and the world have been on a tear, inventing at a pace never seen before. We have dozens of breakthroughs in basic science/materials, medicine/biotechnology, space, electronics, computers, networks, the internet and artificial intelligence. I’ve set aside advances in business processes and pure science, math, social sciences, philosophy and the humanities. I’m not addressing the potential costs and risks of a more technologically advanced civilization. I just want to briefly outline the major technical innovations of the last 75 years. I have grouped them into 3 buckets: traditional industries, medicine and computers.
The computer advances account for 54 of the 115 items, a little less than one-half. There are 21 hardware and network items, about one-sixth of the total (18%). Software broadly defined to include the internet and artificial intelligence sum to 33 items, a solid 3 out of 10 (29%). The 22 medical innovations represent roughly one-sixth of the total (19%). The 39 traditional, historical areas combine for one-third of the inventions.
I won’t describe the innovations in detail. I’ll append web links at the bottom which provide thumbnail sketches of this history and its importance. I expect that my readers know and use these innovations. I’m attempting to summarize then in order to provide perspective. The dominance of computer and communications advances is the biggest takeaway. I expect to see both incremental advances in each category and innovative combinations of computer software, communications, medicine and basic science in the next 25 years.
Agriculture
The green revolution, high yield varieties of rice and other crops
Electricity generation, turbines, batteries, electric motors.
Steam engine, turbine.
Internal combustion engine, automobile, tractor.
Railroad, locomotive.
Anesthesia.
Distilled oil products, diesel, kerosene and gasoline.
Telephone.
Circa 1900
Airplane
Automobile
Camera; digital camera
Electric light bulb; fluorescent, LCD, LED
Moving pictures
Phonograph
Radio
Refrigeration
Vaccines
Medical diagnostics: X-Ray; MRI, CT scan
Antibiotics, penicillin
Circa 1950
Electronic computer, Turing machine, personal computer; after arithmetical machines, abacus and slide rule.
Contraceptives
Geographical positioning system, (GPS) and mapping.
Vacuum tubes, integrated circuits, semiconductors and microprocessors.
Nuclear fission, fusion, power and bombs.
Television.
Circa 2000
Genetics, gene editing, DNA.
Mobile phone networks, infrastructure and personal devices.
Internet communications network.
World wide web addressing structure.
Artificial intelligence.
Smartphones.
Summary
The greatest technical innovations of humanity cover a broad range of life: food/cooking, construction, travel, transport, household, finance, science, power, medicine, entertainment and calculation.
We have a dozen major inventions in both of the 19th and 20th centuries. Change appears to be accelerating…
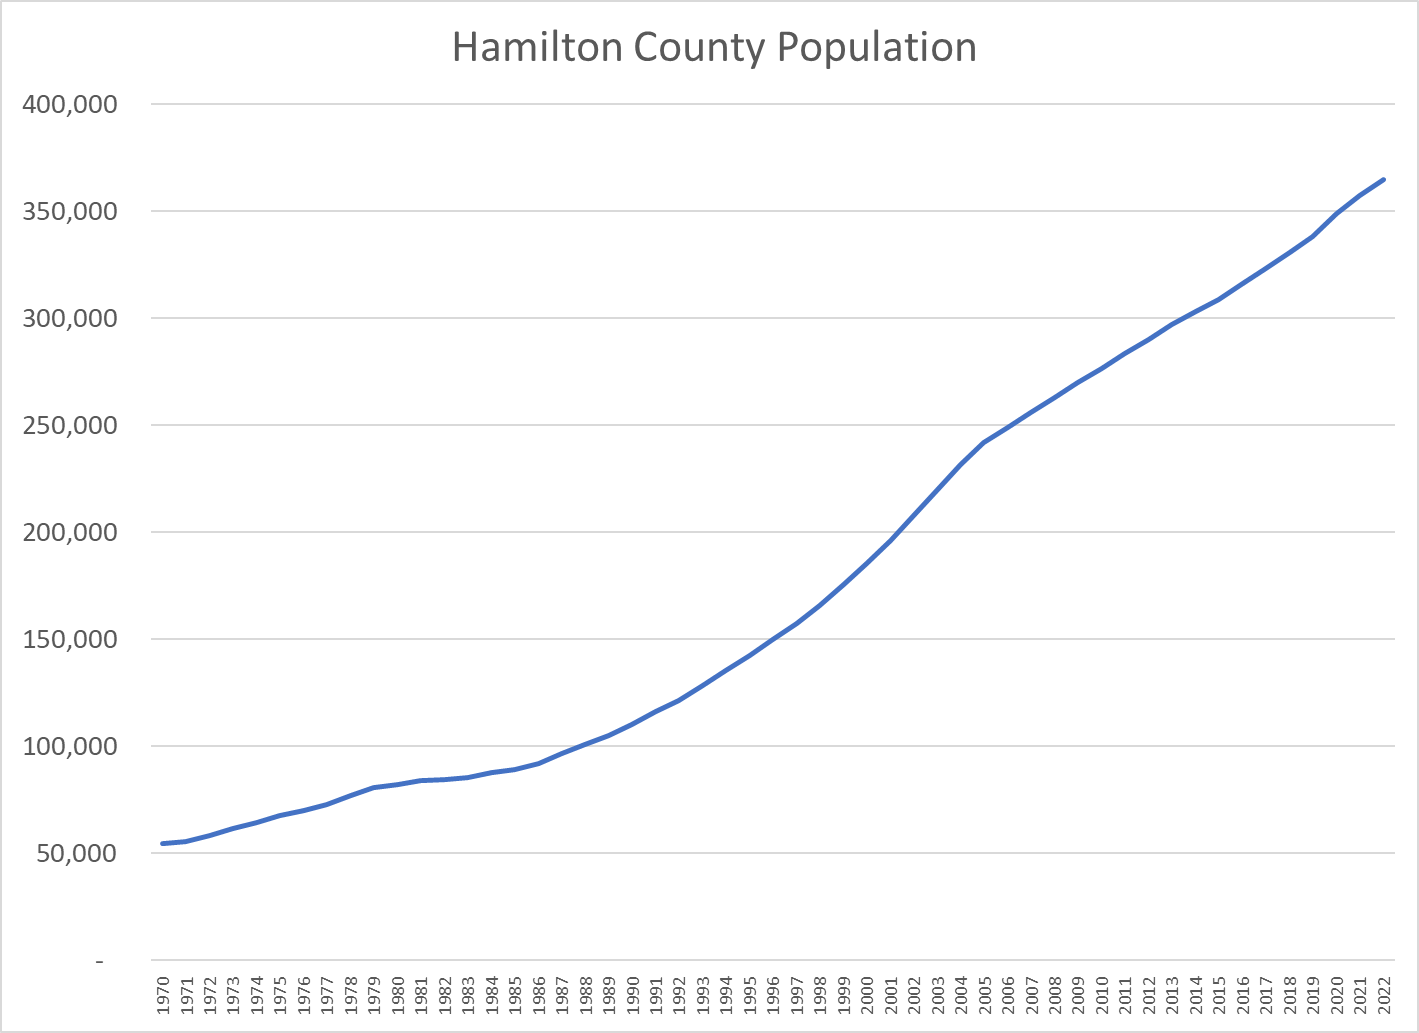
Hamilton County, Indiana is north of Marion County and Indianapolis. It has grown seven-fold since 1970, from 54,000 to more than 365,000 people. It now ranks in the top 7% as the 209th largest county of the 3,142 in the US. It is the fourth largest of Indiana’s 92 counties, trailing Marion (Indianapolis), Chicago’s suburban Lake County and Allen County (Ft. Wayne) which it will surpass for third place in 2029.
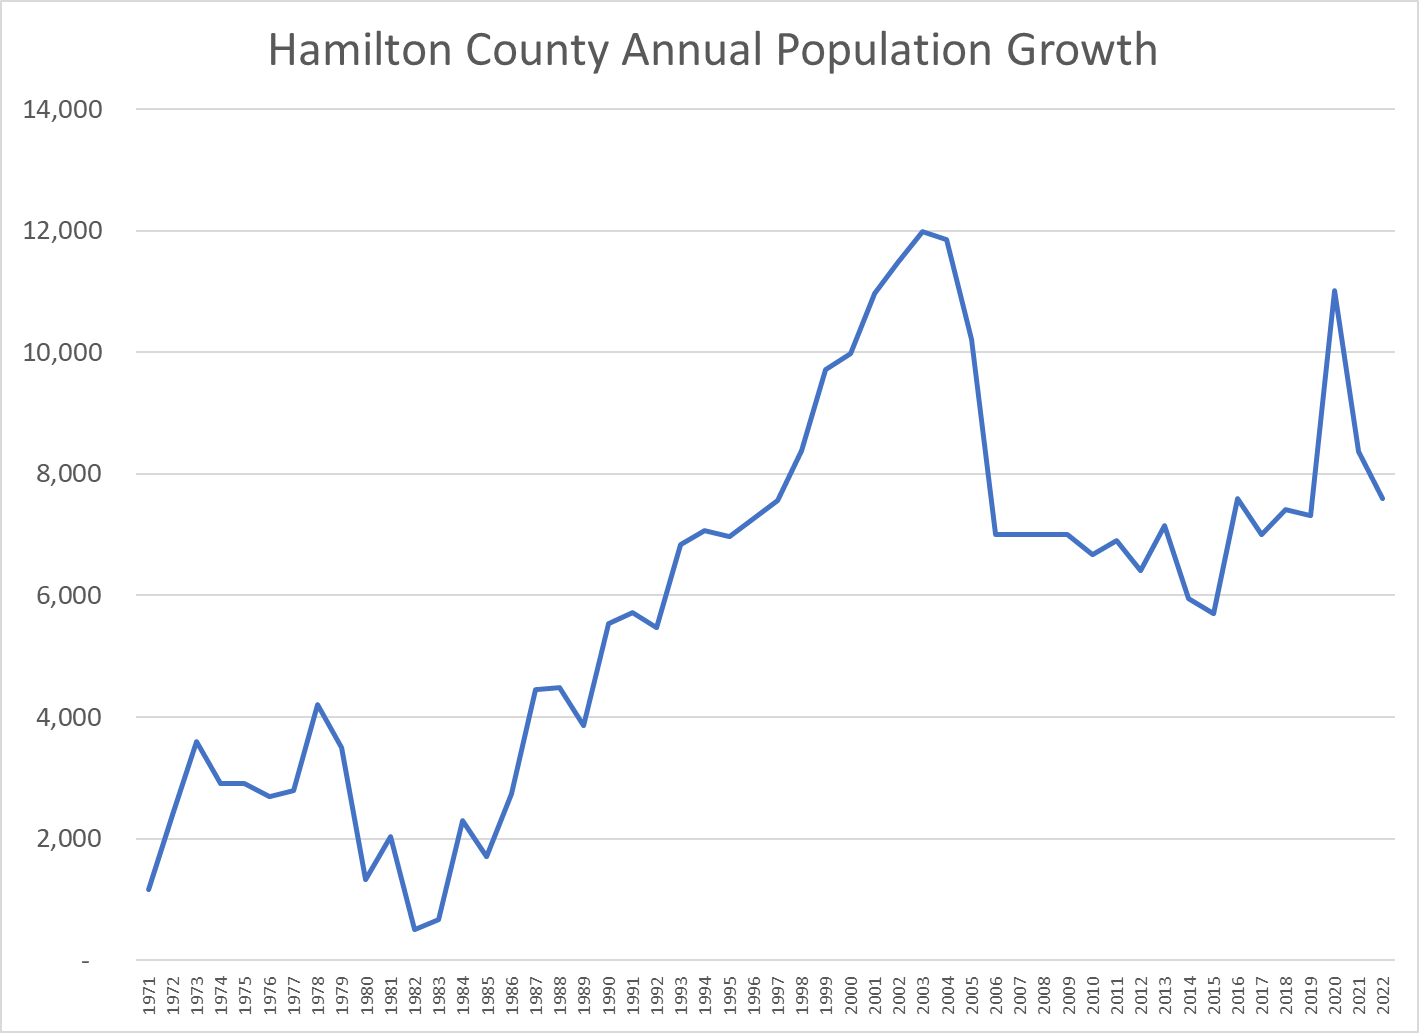
The county has averaged a 7,800 person annual increase since 1990 and has maintained a 7,500-person annual increase in the last decade.
Growth reached a peak of 12,000 per year prior to the Great Recession, dropped back to 7,000 per year and has slowly grown to 8,000 per year.
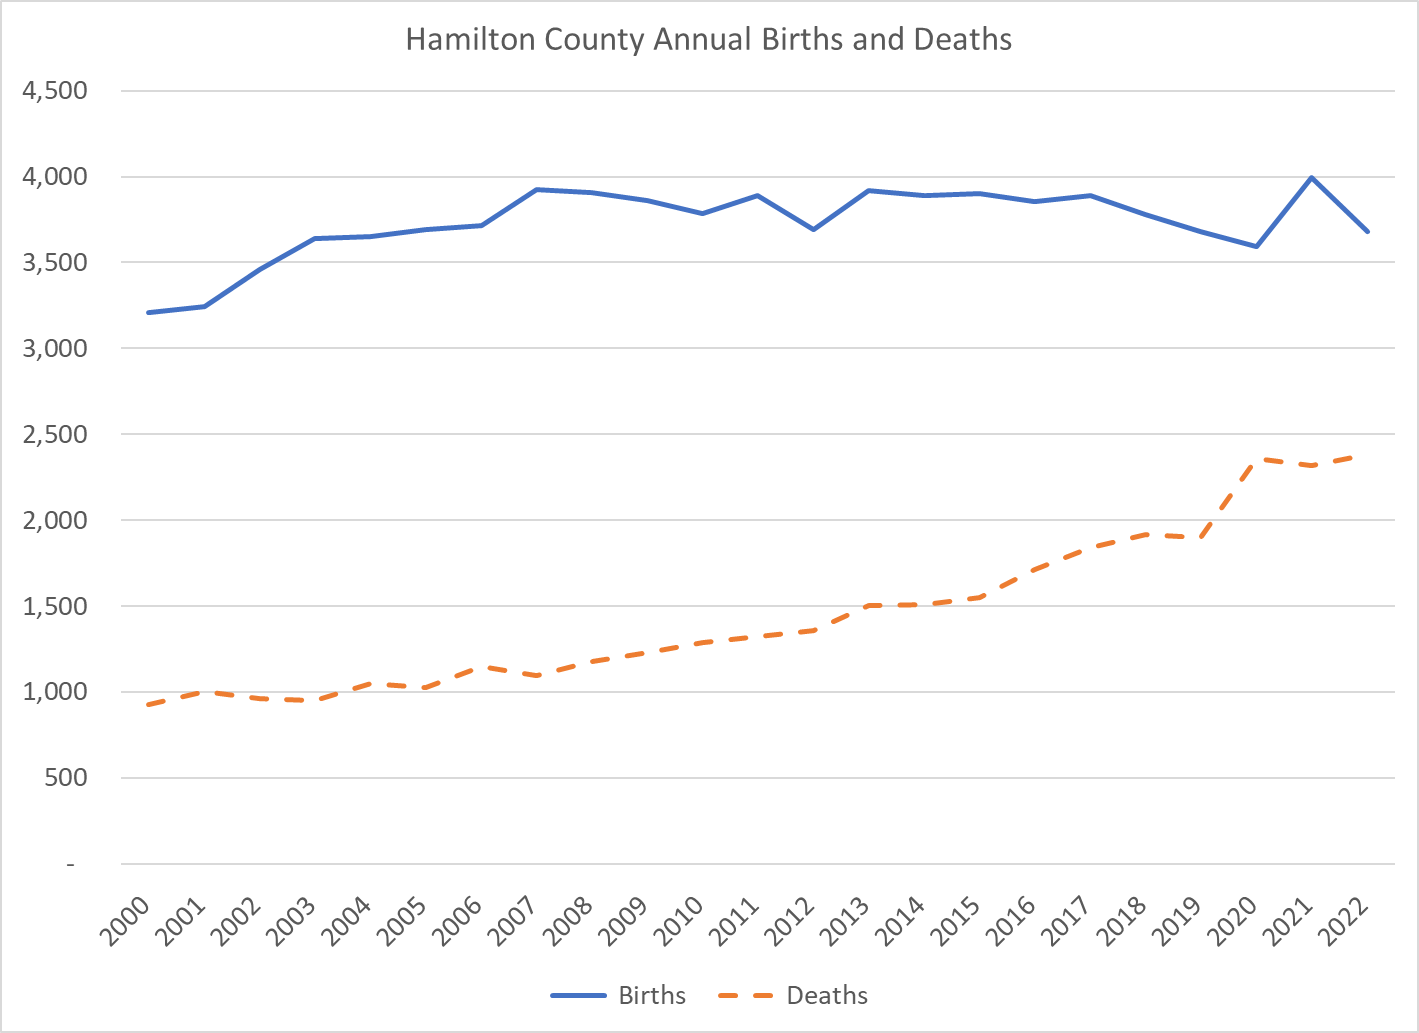
As a growing suburban area, the county has benefitted from a younger population with relatively more births and less deaths. This demographic advantage has decreased through time.
On average, this natural increase advantage has provided 2,000 additional people each year for the last two decades. The net in-migration level was over 8,000 before the Great Recession, dropped in half to 4,000 before recovering to about 6,000 people per year.
The US Census Bureau’s American Community Survey (ACS) attempts to measure the annual migration flows between all 3,142 counties! It’s survey techniques generally require a 3-5 year sampling period to have statistical reliability. The US Census Data and the Indiana Vital Statistics Data (Births and Deaths) show an implicit net in-migration to Hamilton County from 2011-20 of 4,575 annually. The ACS reports just 3,124. The actual increase is 144% of the surveyed increase.
Hamilton County’s population ranged from 283-346,000 between 2011-20, for an average of 314,000. Inbound migration averaged 23,600 per year or 7.6% of the population. Outbound migration averaged 20,400 per year or 6.6% of the population. On average, the county’s population turns over every 15 years. The net in-migration in the ACS survey was 3,100, a little more than two-thirds of the implicit 4,600 net in-migration per year. I compared the 2011-2015 and 2016-2020 data and found that they were generally consistent. I believe that the proportions reported are generally accurate.
International In-Migration
ACS reports an annual average of 1,800 international immigrants. This is 59% of the net 3,100 figure; quite material. On an annual basis, this is just 0.6% of the county population, but for a decade it is 6%. 61% of Hamilton County’s international immigrants report Asia as their home continent.
Total US Migration
Net in-migration to Hamilton County from the US is a positive 1,300 per year in the ACS survey, perhaps 1,900 including the 1.46X factor. Net domestic net in-migration is two-thirds the size of international net in-migration; 0.4% annually or 4% per decade.
48 States Aside from Indiana and Illinois
Net in-migration to Hamilton County from the other 91 counties in Indiana plus Illinois averages 3,004 per year, essentially equal to all of the total net in-migration. Net in-migration to Hamilton County from the other 48 states is a negative 1,700 per year, roughly one-half of the positive overall net in-migration figure. Hamilton County receives minor positive inflows from the adjacent states of Ohio, Michigan and Kentucky. It sends 1,000 residents to Texas each year and receives just 400 in return. Texas accounts for one-third of Hamilton County’s net out-migration aside from Indiana and Illinois. Hamilton County exports 1,200 residents annually to Florida but an equal 1,200 return each year.
Chicago, Illinois
In the last decade 1,500 people annually moved to Hamilton County from Illinois (Chicago) and just 700 returned the favor. Hamilton County received a net 800 residents from Illinois each year in the past decade. This is one-fourth of the net in-migration to Hamilton County. Many Hamilton County college graduates make Illinois their first professional home, so the flow of experienced professionals from Chicago to Hamilton County is probably more than 1,500 per year.
Marion County, Indiana (Indianapolis)
Hamilton County’s Carmel, Fishers, Westfield and Noblesville claim that they are “edge cities” somewhat independent of Indianapolis. In the last decade a net 3,300 migrants from Marion County chose to make Hamilton County their home each year, accounting for more than ALL of the ACS survey’s 3,100 annual increase. Marion County has nearly 1 million people and continues to grow slowly despite this 0.3% annual leakage to Hamilton County.
College Students
Hamilton County school graduates have very high college attendance rates. Hamilton County exports 2,600 students each year to IU, Purdue and Ball State and receives 1,000 back, for a net out-migration of 1,600 per year, about one-half of the net in-migration figure.
Indiana
Hamilton County has a minor net in-migration from sparsely populated Boone County to its west (300/year). It’s net in-migration with the 8 nearby counties, including Boone, is a 500 loss. Hamilton County is an attractive suburban destination, but net net it loses 500 residents annually to nearby counties other than Marion.
Setting aside Marion County and the 3 university counties, Hamilton County attracts 500 new residents annually from the other 87 Indiana counties.
Summary
Hamilton County enjoys a 2,000-person annual natural population increase due to its relatively young age profile. Half of its 6,000-person annual net in-migration is driven by international immigrants attracted to its schools, amenities, services and culture. Most of its remaining growth is driven by nearby Marion County residents who are seeking the same results. Hamilton County is attracting residents from Chicago as retirees, commuting residents or transplants. Hamilton County loses about 2,000 college students each year who migrate into a national labor market. This is an opportunity for further population growth. It also shows that the net 3,100 growth per year figure understates the attractiveness of this county to all potential migrants.
Kindly set Joe Biden aside. As of today, he is clearly most likely to be nominated.
Four others show up on the pundits’ “most likely” lists but will probably not be nominated. New Orleans’ mayor Mitch Landrieu is a career politician from a red state. Kamala Harris has not taken advantage of her VP post. Elizabeth Warren and Alexandria Ocasio-Cortez are too far left.
Like Joe Biden, Bernie Sanders, Michael Bloomberg and Jim Webb may have aged out of contention.
Robert Kennedy, Jr and John bel Edwards are too far right.
Sherrod Brown, Marianne Williamson, Phil Murphy and Tammy Baldwin are too far left.
Terry McAuliffe, Beto O’Rourke and Stacy Abrams have incurred political losses that require them to re-establish their bona fides.
Seven candidates floated “trial balloons” in 2016 or 2020 but failed to gain traction. They each need to define a “compelling reason” to return to the national spotlight. Michael Bennet and Jay Hickenlooper in Colorado. Martin O’Malley, Tom Steyer and Deval Patrick on the east coast. Jay Inslee on the west coast. Julian Castro in Texas.
Four candidates are branded with the liberal “red L” of Chicago or New York. Rahm Emmanuel and JB Pritzker. Kirstin Gillenbrand (perhaps unfairly) and Bill de Blasio. Tom Steyer and Michael Bloomberg are handicapped again.
I don’t see the national case for Gina Raimondo, Andrew Yang or Andy Bashear.
Mark Kelly, Josh Shapiro, Jared Polis and Wes Moore are relative newcomers to the national stage.
I present 4 “sleepers” who don’t have consensus national media support.
Booker, Buttigieg, Cooper, Klobuchar, Newsom and Whitmer are attractive presidential primary candidates for Democratic voters. Warner, Kaine, Hassan and Warnock could also become realistic candidates.
McAuliffe, O’Rourke, Abrams, Bennet, Hickenlooper, O’Malley, Steyer, Patrick, Inslee and Castro have political assets that could be appeal on the national primary stage.
Breaking away from the pack is difficult today. Ironically, the larger-than-life dimensions of Trump and Biden may prepare the way for competitive future primaries between relatively equal candidates.