
In 1974, when I graduated from high school, there were 3 national TV networks that delivered “over the air” content from major city TV stations. Major cities usually had a public broadcasting station focused on “educational TV” and perhaps an “independent” TV station that catered to reruns of movies, cartoons and TV shows, local news and weather, variety shows, political commentators, sports and traffic. At night, you might sometimes be able to get a fuzzy picture from 2-3 other TV stations 60-100 miles away if you moved the roof or tv antenna around a bit. “Maximum TV” was 10 stations.
We now have cable, satellite and internet connections to provide hundreds or thousands of channels to most citizens for viewing now or later. It is challenging to convey this “two orders of magnitude” change.
Rise of Cable TV Delivery

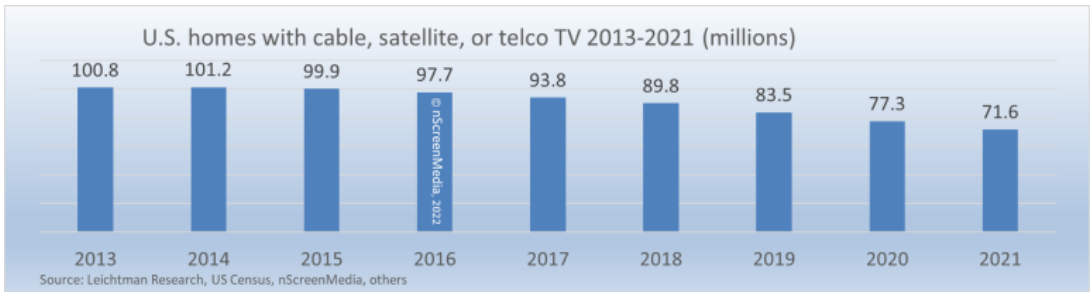

The US TV market grew from zero to 100M homes with cable access by 2005, before beginning a slow decline in direct connections replaced by internet connections.
Now or Later: Streaming Increases
Close to 30% of TV content is now consumed in a time-shifted manner versus zero historically. When “The Wizard of Oz” was played on TV every 2-3 years, we all watched it.
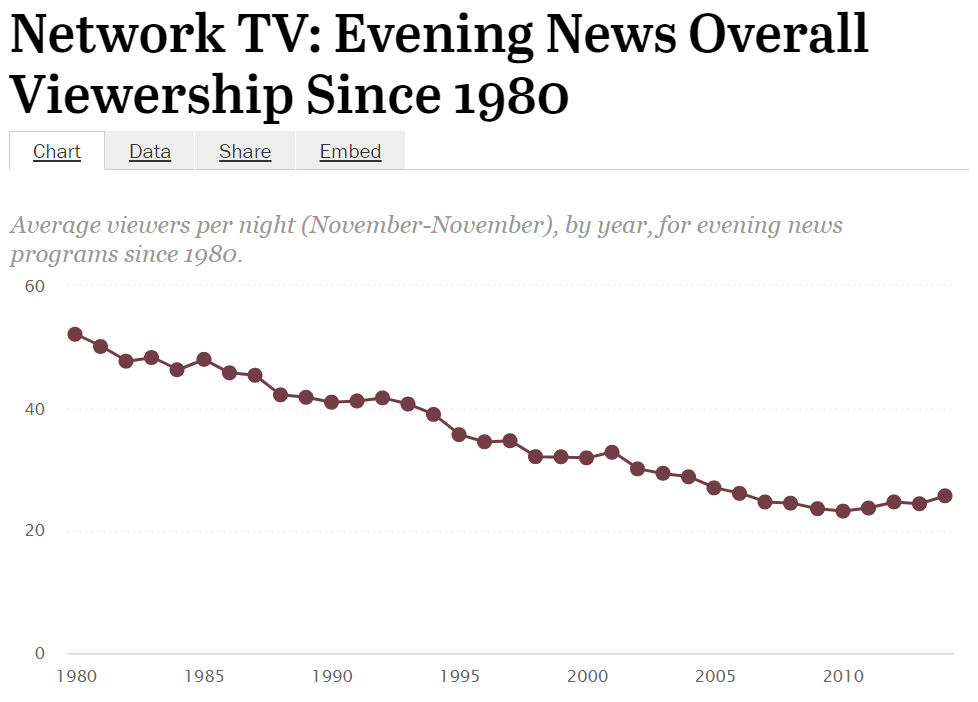
Decline of the Big 3/4 Networks’ TV Market Share
1980 – 85-90%
1990 – 60%
2000 – 40%
2010 – 35%
2021 – 30%
Conversely, this means that “independent” content increased from 10% to 70% of available programs.
https://www.latimes.com/archives/la-xpm-1991-04-17-ca-128-story.html
https://www.tvguide.com/news/2010-11-ratings-1033838/
https://apnews.com/article/eff68f5c5a5a15bcbc17cf788a17556d
http://www.thetvratingsguide.com/1991/08/2000-01-ratings-history.html
Decline in Ratings of 10th Ranked Major Network Shows
1950 Mama 40
1960 Jack Benny 26
1970 FBI 23
1980 Little House 22
1990 Golden Girls 17
2000 The Practice 12
2010 Criminal Minds 9
2019 Good Doctor 7
https://en.wikipedia.org/wiki/Top-rated_United_States_television_programs_of_1950%E2%80%9351
https://en.wikipedia.org/wiki/Top-rated_United_States_television_programs_of_1960%E2%80%9361
https://en.wikipedia.org/wiki/Top-rated_United_States_television_programs_of_1970%E2%80%9371
https://en.wikipedia.org/wiki/Top-rated_United_States_television_programs_of_1980%E2%80%9381
https://en.wikipedia.org/wiki/Top-rated_United_States_television_programs_of_1990%E2%80%9391
https://en.wikipedia.org/wiki/Top-rated_United_States_television_programs_of_2000%E2%80%9301
https://en.wikipedia.org/wiki/Top-rated_United_States_television_programs_of_2010%E2%80%9311
https://en.wikipedia.org/wiki/Top-rated_United_States_television_programs_of_2018%E2%80%9319
1980 – Still Just 3 Networks
50 news items. Just 4 cable items. USA Network, BET, ESPN, Cinemax.
49 debut programs. 3 PBS, 1 ESPN, 2 CNN, 1 Nickelodeon. 42 (6/7ths) major networks.
https://en.wikipedia.org/wiki/1980_in_American_television
Other Network Options Grew Exponentially
5 in 1970-80.
153 networks in 2021. 97 with “material” average daily viewership of 100,000+.
https://variety.com/2021/tv/news/network-ratings-2021-top-channels-1235143630/
29 largest networks in 2010.
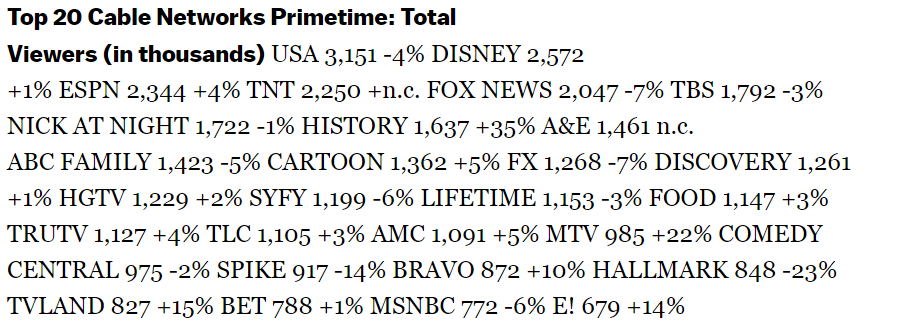
Of the top 29 in 2010, 14 remain strong competitors in 2021. ESPN, Fox News, TBS, History, Ion, Discovery, HGTV, Lifetime, Food, TLC, Bravo, Hallmark, TV Land, MSNBC. 5 retain more than 500K average daily visitors, but dropped by at least 50% from 2010 to 2021: USA, TNT, A&E, FX and AMC. 10 dropped by more than 50% to less than 500K daily viewers: Disney, Nick, Cartoon, SyFy, TruTV, MTV, Comedy, Spice, BET and E! 8 networks moved up to more than 500K viewers per day: CNN, telemundo, CW, Insp, Me, Invest, Hallmark movie and Unimas. This is a very competitive marketplace.
https://variety.com/2021/tv/news/network-ratings-2021-top-channels-1235143630/
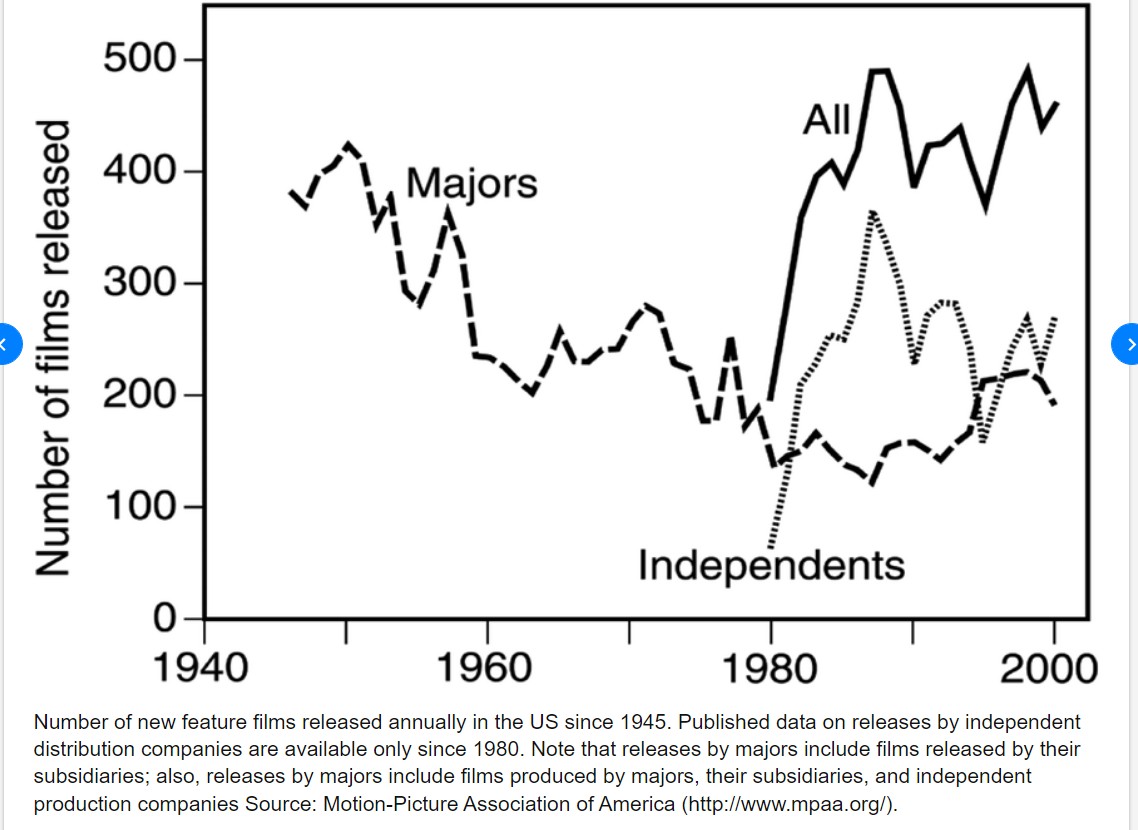
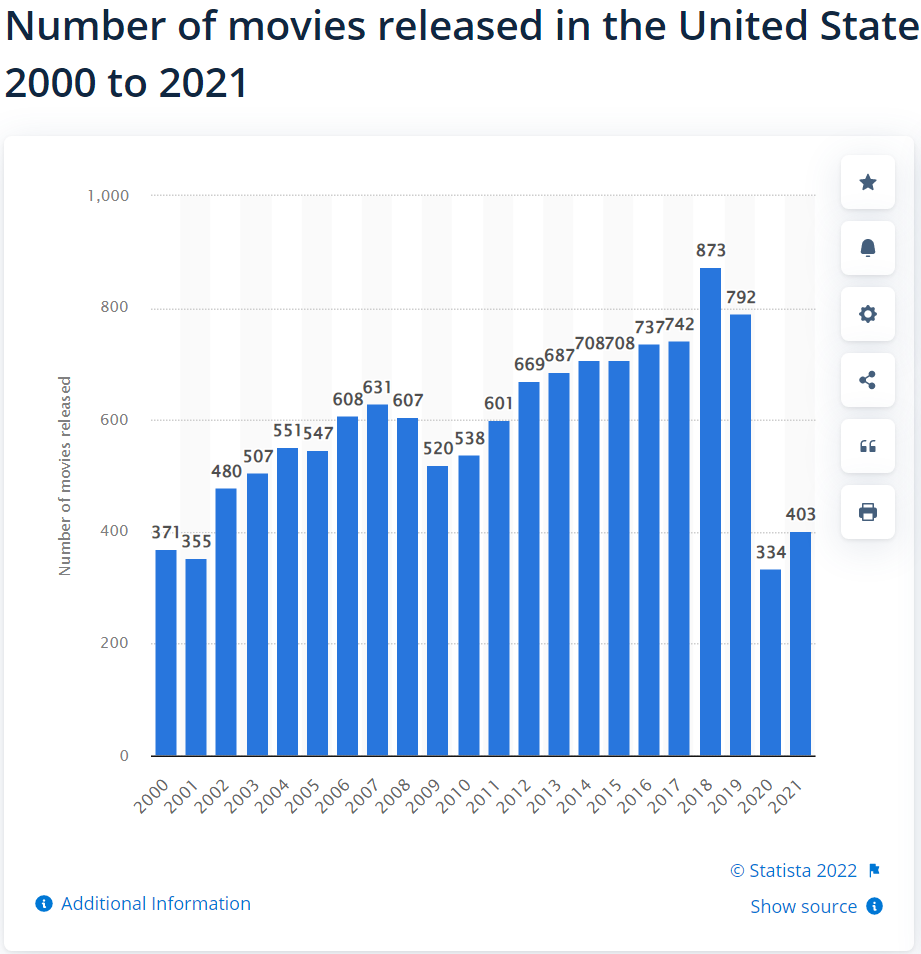
Much More Original Content is Now Provided


[…] Pop Music: Atlanta Rhythm Section Classics IV Besame Mucho: A Classic Song, 16 Good News: Amazing Visual Media Choices Women Vocalists of the 1960’s Good News: God is NOT Dead In the US Cleveland […]
[…] Good News: We’re (Almost) All On-line Good News: God is NOT Dead In the US Good News: Amazing Visual Media Choices Trust in the DOJ and the FBI Good News: More Retirees Good News: Great American […]
[…] Exceeds National Average, First Time in 50 Years Good News: US Taxes Remain Low Good News: Amazing Visual Media Choices Good News: The US Economy is a Job Creating Machine Good News: Better Refrigerator […]