Our Kids: The American Dream in Crisis (2015)

Author Robert Putnam also wrote the award-winning Bowling Alone (1999) and The Upswing (2022) summarizing the mountains of social science research on American Community and related topics. The first book documented the large, steady and widespread decline in community participation in the second half of the 20th century. The second book extended the timeframe back to the 1850’s to document that community participation was very low in the post-Civil War era, but that institutional innovations plus social, economic and political changes aligned to promote greater community participation throughout the next 75 years, before declines began in the post-WW II era.

This book is also data-intensive and primarily focused on the role of “community” in driving divergent opportunities for lower socioeconomic status (SES) versus higher SES children. Five chapters focus on the American Dream, Families, Parenting, Schooling and Community before a final chapter on why we should care and what we might do. The author provides paired case studies of higher (top 1/3rd) and lower (bottom 1/3rd) SES families in his hometown of Port Clinton, Ohio (near Toledo), Bend, OR, Atlanta, Orange County, CA and Philadelphia to illustrate how the various factors interact and apply.

The author chooses to frame his story under the heading of upward mobility or equal opportunity because this is a very widely held American value with supporters in both political parties. His liberal/Democratic party bias shows in various places, but his mastery of the data, case studies and sequencing make this a powerful book describing how American communities, families, kids and neighborhoods were actually functioning in 2015 contrasted with those in 1955-75.

In summary, the reduction in community activities documented in Bowling Alone is mostly felt by the bottom half of the SES groups. Poor/poverty class, working class and middle-class families have been very negatively impacted by both lower absolute and relative economic opportunity and weaker community support, while professional, upper middle and wealthy class families have maintained economic and community resources to guide their children to positive outcomes. Upward mobility in the US has fallen as income and wealth inequality have increased, leading to greater divisions in society, lower trust, weaker institutions and polarized politics.

Putnam tries not to shout, but the clear implication is that American civilization, per se, is at risk! If one-third or one-half or two-thirds of Americans do not benefit widely from social institutions, choose to not participate in them, lose trust in their neighbors, fail to raise their children and turn to populist political candidates for solutions, The American Dream is at risk. The author does quietly note that the measurements of intergenerational mobility lag by 20 years, so what we are seeing today is somewhat based upon the social, economic, political and economic conditions of the late 1990s. The next two decades of community, institution and parent formation have already taken place and shaped childhood development.

“Sociologists”, like Dr Putnam, are often commingled with “socialists” and other leftwing political groups in the public mind; and the profession is clearly leftward leaning in universities today. However, the discipline also has an inherent rightwing slant. Sociologists devote their time to analyzing the roles of community, family, kin, religion, neighborhood, voluntary groups, institutions, unions, employers, political parties and other groups on human behavior. The focus is on the group as a counterweight to the purely individualist, commercial, scientific, rational, transactional, computing, materialist conceptions of human beings. Classical conservatives have often tried to “conserve” the delivered group history, traditions, culture, value, art and institutions (civilization) of the past against the various progressive, experimental, enlightened proposals of liberals. A successful civilization must have successful groups and institutions.

As my 1972 high school general business teacher, Mr. Dunlap, often said, “we have much, much to do today”.

The American Dream

The 1950’s can be improperly idealized, but the contrast between 1950’s and 2010 Port Clinton, Ohio shows massive changes in economic opportunities and living conditions between the “haves” and the “have nots”. The author compares the top and bottom one-third of society using case studies and data. For data slices, he typically uses educational achievement, comparing high school graduates or less education groups with college degree achieved groups. His home village of 7,000 is between Toledo and Cleveland on the shores of Lake Erie, not far from the site of fictional Winesburg, Ohio. The small town thrived with manufacturing, fishing, farming, mining and government sites in the post-WW II era, but declined quickly after the 1970’s except for the addition of a string of lakeside second homes. Relatively small income and status differences, school and activity mingling between classes and widespread economic and educational advances characterized the 1950s. By the 2010’s, the poor had become poorer and the wealthy were of a different economic stratum, with less formal institutional support, class intermixing or intermarriage, informal mentoring or upward mobility.

Don 1959 – working class upbringing, dad worked 2 jobs, mom a homemaker, neither parent HS grad, top 1/4th academically, sports star, local minister guided him to liberal arts college, became a minister, married a high school teacher and his daughter became a librarian. Emphasis on economic and social stability of home life, assistance of community in upward mobility.

Frank 1959 – son of local business owner (fishing) and college educated mom from Chicago, lived 4 blocks from Don, modest school results, worked summers in family restaurant, not considered socially different even though dad was commodore at yacht club and mom “did charity work”, attended Ohio liberal arts college, played sports, worked as a journalist in Columbus for 25 years. Comparable results to Don.

1959 class – “we were poor, but we didn’t know it”. Of the parents, 5% held college degrees and one-third had not completed high school. Three-quarters of the high school graduates obtained more education than their parents. Half of the children of high school dropouts went to college. Absolute and relative upward mobility was high. On average, the children of the class of 1959 (1980s HS grads) equaled their parents in educational attainment but did not exceed them.

Libby 1959 – one of 10 children born to farmer/craftsman and homemaker without HS degrees. Parents actively involved at school. English teacher helped Libby attend U Toledo, but she dropped out of freshman year to marry hometown boy and become a homemaker. Divorced 20 years later, Libby worked as a clerk, writer and manager before winning a countywide political seat which she held for 30 years. Male and female opportunities and participation were quite similar for this cohort through joining college, but only 22% of women completed degrees versus 88% of men.

Jesse and Cheryl 1959 – only two black graduates out of 150. Families had moved from the South, dads worked in manufacturing and mining, moms worked as maids. Jesse excelled in sports, served as student council president, attended college on a sports scholarship, earned master’s degree in education and served as a high school teacher. Cheryl was hardworking, academic achiever and class officer. She also earned a master’s degree and taught high school. Both families lived in the poorest parts of town. The students interacted with their classmates, but knew that there were limits for dating, travel and recreational activities. The students were guided/assisted by local adults to attend college. While race and gender restrictions have fallen since 1959 in the US, class-based differences in opportunity have increased.

1950’s and 1960’s forward to 2010- one-half of high school grads to college and one-half to work. 1,000 employee factory trimmed jobs, then closed in 1993. Army base and gypsum mines closed. Manufacturing fell from 55% to 25% of jobs. Real wage in 2012 was 16% below that of 1970. Population had grown by 50% from 1940-70, flattened through 1990, then dropped by 17% by 2010. 2010 juvenile delinquency rates 3 times national average, up from just average in 1980’s. Net departures of 30-39 year olds doubled from 13% in 1970’s to 27% in 2000’s. Single parent households doubled, divorce rate up 5X, unwed births doubled, child poverty up 4X. At the same time, second homes now covered 20 miles of the lake shore. Small town “rust belt” story has same social impact as large city “rust belt” stories.

Chelsea 2014 – lives on the lake, dad is a national sales manager, mom has graduate degree and does part-time special education work. They own a second home. Mom is very active in shaping kids’ school life, intervening, investing and coaching. Chelsea is “most active person” at school, leading many extracurricular activities. She attends a big 10 university and plans to become a lawyer.

David 2014 – dad a HS drop out, worked periodically in odd jobs, imprisoned, angry, many women, drugs, moved from place to place. Mom moved out when David was preschooler. David has 9 step siblings. Finished HS through career classes. Juvenile detention record begins with age 13 store break-ins and continues for drug and alcohol violations. Lived with dad and grandparents at different times. Passed each grade, but never engaged in school. Worked in retail, factory and landscaping. Became a father at 18, did not marry, shares custody of child. Invests time helping his stepsiblings. Wants further education but has no plans. Bitter that community did not help him through his childhood when it was clear that his imprisoned dad and absent mom were incapable of raising him.

Equality of income and wealth is different from equality of opportunity and social mobility. The first is widely discussed in the media and rising inequality bemoaned by many. However, proposed government initiatives to address it, especially income or wealth transfers, are hotly debated by the two main political parties. While this form of inequality and changes in it clearly impacts equality of opportunity, the author focuses on the second measure.

“Do youth coming from different social and economic backgrounds in fact have roughly equal life chances, and has that changed in recent decades?” “A bedrock American principle is the idea that all individuals should have the opportunity to succeed on the basis of their own effort, skill and ingenuity” according to Fed chair Ben Bernanke. Faith in equal rights is embedded in the American founding documents and stories, American history, especially due to the growing economy of the US across more than two centuries. The Horatio Alger story of “rags to riches” has been told since formal public education began in the US in the 1840’s. Public opinion surveys from the 1940s through the 1980’s recorded an American public that believed that they and their children could pursue The American Dream with confidence.

95% of Americans repeatedly endorse equality of opportunity – “everyone in America should have an equal opportunity to get ahead”.

3 stages. 1875-1945, less inequality of wealth and income, growth of wealth and income, modest equality of opportunity for non-minority men. 1945-75, much less inequality of wealth and income, rapid economic growth, strong absolute growth of opportunities for all and very open opportunities for economic growth and social mobility. 1975-2015, intermittent periods of economic growth, increased inequality of wealth and income, limited absolute economic opportunity and sharply reduced relative economic opportunity and social mobility. The contrast between 1959 and the post-Great Recession 2010 highlights the very different economic and social environments.

Income inequality within each racial/ethnic group increased from 1967-2011.

From 1979-2005, real after-tax income for bottom 1/5th up $1,000; for middle 1/5th up $9,000; for top 1% up $750,000.

From 1980-2012, real earnings of college educated males rose 35%, while high school graduates lost 11% and high school dropouts fell 22%.

From 1992-2013, real wealth of high school graduates or less education remained in $150-175,000 range while wealth of college graduates increased from $600-700,000 range to $1.1 million range. A 3.5 to 1 ratio increased to 6 to 1 in 20 years.

Neighborhoods are more clearly sorted into high, middle and low income. Between 1970 and 2009, high-income neighborhoods doubled from 15% to 30% of the total while low-income neighborhoods increased by one-half, from 20% to 30% of the total, leaving middle-income neighborhoods to shrink from 65% to 40%.

Neighborhood segregation drives educational segregation. In large cities, “neighborhood schools” policies ensure that lower and higher income groups mix less. Within schools, top third SES students disproportionately enroll in advanced tracks and complete AP courses. These differences have even greater disproportionate effects on college attendance, college graduations and especially selective college admissions.

Clustering in neighborhoods, schools and colleges leads to “assortive mating”, with higher SES students marrying each other much more often than in the post WW II era when interactions between the classes were more common. Combining all of these factors leads to extended families and kinship networks that are largely or solely comprised of similar SES people, further reducing the interaction of Americans from different walks of life.

Putnam notes that absolute mobility, completing more education, earning more and holding higher level positions than your parents, is the primary component of “upward mobility” in history. The growth of economies, movement to new locations, development of new industries, technologies and professions does tend to benefit many across society. Relative upward mobility, with the lower classes moving ahead (education, income, jobs) faster than the upper classes, is not as a big a driver because it is less common in history, and even when it occurs it does not mean than bus drivers and surgeons change places, only that bus drivers’ daughters become transportation analysts while surgeons’ daughters become pharmacists.

The social scientist standard measure of mobility compares the income or education of a 30-40 year old with their parents at 30-40 years old, assuming that lifetime career success is largely settled at this age. Putnam asks the reader to not wait for the high school graduates of 2005 to be measured in 2020 but instead to look at their situations in 2005 and project the results, adding urgency to the time period in which absolute and relative mobility have been so much below that experienced after WW II.

2. Families

Putnam next focuses on the rapidly growing mid-sized town of Bend, Oregon, a largely white representative of prosperous western towns driven by their outdoors assets. The logging industry has been replaced by tourism, retirees and second homes. Area population is up from 30,000 to 165,000 between 1970 and 2013. Per capita income is up 50% in one decade. Usual side effects of rapid growth are seen. Wealth is made in real estate and construction. But, even in this growing environment, income inequality has widened by 75%. Poor neighborhoods are clustered on the east side of town.

Andrew – 2015. Parents from modest middle-class backgrounds near Bend. Dad Earl a fair student, graduated from state college. Married classmate Patty, who left college. Earl worked as a stockbroker, Patty as a florist’s assistant. Earl moved into construction and built a solid business worth millions. Patty left work, had 2 kids and thrived as a homemaker. Children attended a new HS with 15% drop-out rate, contrasted with east-side HS with 50% drop-out rate. Parents focused on kids, school, building their marriage. Andrew lacked for little. Parents involved in school, activities and career steps. Andrew a modest student and not driven like dad, working towards a firefighting career. Feels secure in pursuing his future.

Kayla – 2015. Parents Darleen and Joe have both lead troubled lives. Darleen raised on a small ranch a few hours from Bend. Finished HS with modest record, worked in fast food and at a fuel station. Married by 20 with 2 kids to abusive man but left him. Met Joe in new job at Pizza Hut where he was the manager. Soon pregnant with Kayla. Joe’s father was mostly in prison while growing up, mom was an alcoholic who Joe helped from an early age. Experienced some structure and care in 6 years in a foster home. Dropped out of eighth grade. Cared for mom. Married at 18, 2 kids with drug abuser. Left woman, kept kids, moved back in with his mom and mom’s latest boyfriend. Met Darleen in Bend at Pizza Hut. Joe moved from job to job, unskilled, low wage. Kayla grew up with the 4 step-siblings. Always poor, little parental support for school or extras. Mom Darleen left with a new boyfriend when Kayla was 7, living across the west and becoming homeless. Kayla mostly lived with Joe but some of the time traveled with Darleen and her friend. Kayla has essentially lived “alone” due to limited prospects and parenting skills of Darleen and Joe. Kayla drifted in school, found some support in troubled youth and job corps programs and legally finished HS. Some school administrators helped Kayla with medical, counseling and educational support. She has taken some community college classes, has a new boyfriend who lives with her at Joe’s. Kayla is depressed and worried about her future but doesn’t know what to do.

The post WW II norm was a breadwinner dad and a homemaker mom. Relative stability. Modest income or extras, but owned home and settled in a neighborhood. Working- and middle-class wages were adequate to support this model. Only 4% of births were outside of marriage due to social norms and pressured marriages of new parents to be.

Family structure changed during the 1970’s. More divorce, more women working for pay, greater cohabitation, more unwed births resulting in more kids in single parent homes. These changes accelerated for decades. Birth control, feminist views, female job opportunities, working class male job insecurity and individualist, self-fulfillment norms all contributed to these major changes in expectations and actual family structures.

In time, the bottom half of the social classes continued to shun the traditional model, but the top half maintained a high rate of marriage, modest rate of divorce, delayed first births and raised kids in stable two-parent households. These women increased their college attendance rates and worked in higher skilled jobs before and after their children’s pre-school years.

Lower educated moms’ first birth age was relatively stable at 19-20 years from 1960-2010, but higher educated moms delayed child responsibilities from age 24 to age 30, providing time for dating, prospecting and cohabitating before marriage and maturing socially, completing education and career milestones before the responsibilities of motherhood.

Births to unmarried women with college degree completion status doubled from 5% to 10% between 1977 and 2007, making it still a relatively infrequent occurrence (1 in 10). For young mothers with high school credentials or less, the 1970’s rate was already much higher at 20% (1 in 5), but has grown consistently since then to more than 60% (approaching 2 in 3). This is a revolutionary change within the high school grad population — and between them and the college educated group.

By 2010, the high school graduates’ divorced percentage reached 28% versus 14% for the college graduates. Among the one-third of high school graduates who were married when their kids were born, 28% of the families experienced divorce.

Fathers with HS credentials are four times as likely to have children that do not live with them as fathers with college degrees.

The percentage of college educated families with children under age 7 lead by a single parent doubled from 5% to 10% between the 1950’s to 1970’s period and the 1990’s to 2010’s. It was a slightly higher 12% in the late 1980’s and early 1990’s. The high school graduate lead families started at 20% in the early decades and has grown to more than 60%, the same pattern as births to unmarried women.

Lower education moms’ employment percentage grew from 18% to 32% between 1960 and 2010, a 70% increase. Higher education moms started at 20% in 1960 and rocketed up to almost 70% in the 1990’s — another gigantic change within this group and between the groups. In 1960, one in five moms worked throughout the classes. More lower education moms joined the paid work force, but more than two-thirds did not work in the 2010’s. More than two-thirds of college educated mothers rejoined the labor force, making that the usual situation for their peer group. On average, high paid college educated families have one and two-thirds earners while lower paid high school grad families have one and one-third earners, a further income difference of 20%, on average. Working moms today spend as much time with their kids as “stay at home” moms did in the 1970’s by cutting out other competing uses of time. Black Americans show this same split towards two-earner married couples at the top and single moms at the bottom. Recent immigrants and Hispanic families look more like the traditional model.

The two-tier model is driven by culture and economics. It is socially possible to have children without being, getting or remaining married. The social prohibitions against birth control, premarital relations, cohabitation and childbirth outside of marriage fell quickly and have little impact for most American today. Motherhood is open to young women irrespective of their economic, educational or social status and is considered a “good”. Young women can choose motherhood and romance over marriage and do so frequently in the lower half of society. Poor and working-class men today have relatively lower wealth, earnings, stability and prospects than their post WW II peers. Young women have greater economic resources and generally believe that marriage requires a solid economic foundation, so often choose to not make that commitment. For less well-off partners economic instability and risks prevent and threaten family stability. For fortunate partners their economic security reinforces family stability despite life’s challenges. This is an essential take-away. Economic differences are translated into social factors which magnify the different opportunities and security experienced by higher and lower income, wealth and education families.

Putnam does not believe that overly attractive welfare benefits play a major role in preventing or disrupting family formation. Technical studies show small effects. The overall change in structure is orders of magnitude larger than those effected by benefits. Welfare benefit policy changes do not correlate with the changes in family formation. Benefits do matter economically and have an impact, but this is not a primary driver of changes in family structure.

The social changes of the 1960’s and 1970’s and the overall trend towards a more secular public society and norms is correlated with the breakdown in family structure overall and for the lower SES groups. Putnam argues that correlation is not causation. The massive split between the top and bottom halves argues against this simple explanation. State and county level correlations indicate an opposite effect, with more rural and religious areas having even greater rates of family decay.

Policy choices in the 1980’s to criminalize drug infractions, increase sentences, reduce sentencing options and increase enforcement led to a five-fold incarceration rate increase between 1970 and 2000. Since young men account for 90% of offenses, this has directly removed many men from actual or prospective marriage. This is not the main driver of fragile families, but an aggravating factor.

The two-tier system has improved outcomes for the top half or two-thirds of society, with married two-income families devoting more time and money to a smaller number of children. The bottom one-quarter or one-third is increasingly comprised of single mother families with part-time, family or government support during the crucial preschool years followed by lower earnings thereafter, so their children receive less financial and social support throughout childhood and lower lifetime opportunities.

From a sociologist’s point of view, these are qualitative differences or “order of magnitude differences” not merely the “differences of degree” experienced in the post WW II period.

3. Parenting

Putnam uses metro Atlanta as the backdrop for this chapter. Fast growing, deep poverty, variety of suburbs, racially segregated, racially mixed in some suburbs, second largest number of African Americans in the US, second weakest upward mobility scores, northern transplants, income inequality within Black community, Black political power, highly educated Black population. But income/class differences have a large impact, perhaps more than race.

Simone, Carl and Desmond – 2015 – Mom Simone from New York City, upwardly mobile family, father a Merrill Lynch manager, mother a medical secretary, married 50 years, moved to New Jersey suburb. Simone earned BA industrial psychology at CUNY. Dad Carl born in Suriname to black and Dutch parents, moved to New York as a child. Dad worked for Alcoa, mom at UN. Dad built a warehousing business. Parents married 33 years. Close family, dinner table discussions, religion important, friends welcome. Simone and Carl met at CUNY, married, waited 5 years to start family per religious counselor’s advice. Simone worked as receptionist and paralegal before becoming at home mom. Carl is an IT manager, brings kids to work, shows role models, he advises them to be productive. Education a priority, in school, out of school, reading, flashcards, outings, activities, sports, music, diet choices. Parents shopped for schools, moved further out in NJ, then to Atlanta, chose HS first, then home. Chose diverse school district to prepare Desmond for world. Mom deeply involved in school activities. Sensitive and firm parenting style; claims never punished son. Dad emphasized autonomy. Religious faith, activities, interactions shaped Desmond’s friendships, activities and thinking. Family adapted to diabetes challenge. Racism acknowledged, but you “have to work a little bit harder”. Simone reflects that “you never stop parenting”. Desmond was top ranked HS student, in college, interning at CDC, moving forward on professional career path.

Stephanie, Lauren and Michelle – 2015 – Mom Stephanie a hardworking office manager in the hospitality industry, grew up in Detroit. Her alcoholic mom left her alcoholic father in Georgia, worked as an RN, lived with an alcoholic Chrysler factory worker. Stephanie grew up in middle class Detroit neighborhood but mixed with project kids, joined a gang, fought, went to juvenile detention center, suspended from school, barely completed grades, stole. Her mom died when Stephanie was 15, she moved in with an aunt who offered more structure and gained Stephanie’s respect. Left aunt and dropped out of 12th grade, moved to Atlanta, earned GED, got pregnant and married. Shared 4 children with her first husband. Caring for first child changed perspective to being responsible for her kids. Worked at fast food, supermarket, discount department store, earned promotions and living salary. Husband left, Stephanie married a forklift driver and has a good marriage with him but they keep financial responsibility for his kids and her 4 kids separate.

Stephanie has been a customer service manager for 15 years where she excels due to her social interaction skills and hard work. Her 4 kids were financially provided for. Mom tried to keep kids safe and used tough love parenting approach. You have to be hard, parents are in charge, not my children’s friend, kids need to be tough and know the world is tough, few conversations and hugs. Family moved twice to better neighborhoods to get further away from trouble. Some education support for kids in elementary and high school, financial support for community college. Eldest son is succeeding, challenging youngest son works at recycling center with his dad. Lauren is completing associates degree in counseling. Michelle dropped out of community college, had struggled with speech and reading in high school. Hopes to attend trade school and be a day care teacher. Currently at a pause in life, hanging out with HS drop out boyfriend. Stephanie claims that racism has never been an issue in her family’s life. Is proud that her kids are “respectable”.

Elijah -2015 – born in Germany to Army parents, mom left family when Elijah was 3, moved in with his grandparents in New Orleans projects. Saw and experienced violence frequently including shootings and murders. Taught by close cousin James how to be a burglar at age 7. James taught him to fight, be a thug and a bully. First re-encountered his dad at age 10, who had been in prison and fathering more children. Moved to Charleston, SC at age 10 to live with mom, then back to New Orleans for 2 years, then back to his mom, new boyfriend and year-old twins in Atlanta at 13. Elijah arrested for arson at age 14, beaten by his dad (moved to Atlanta) after he was bailed out. His father had become a “preacher” and tried to influence Elijah positively, but mom remained verbally abusive throughout his childhood. Elijah tried to reset his life several times after age 14, with limited success. He finished HS with much effort at age 19. He has lived with mom, dad or friends since high school. Worked. Stayed high. Focused on music. Stayed clean. Dreams of being a preacher or hip-hop hero. Influenced by religious teachings but still attracted to violence. Bagging groceries at Kroger, saving money for an apartment and school. Elijah is a survivor against the odds, just barely.

Child development. Experience + environment => neurological development.

Prenatal through early childhood environment => brain circuitry and capacity for empathy.

Contingent reciprocity = “serve and return” experiences matter most. Consistent and caring adult interaction. Development is a social experience.

Much early learning is preverbal but it drives later verbal and math skills.

Early learning also drives “executive functions”: concentration, impulse control, mental flexibility and working memory.

Intellectual and socioemotional development are intertwined. Soft skills may be as important as academic skills: grit, social sensitivity, optimism, self-control, conscientiousness and emotional stability.

Unstable or inconsistently responsive parenting, physical or emotional abuse, substance abuse and lack of affection produce negative neurological changes.

Individuals differ on their inherent resilience, but negative factors have negative effects on children.

Early childhood care drives cognitive and soft skills which drive school performance.

Parental income, education and class are closely correlated with healthy brain development. Differences emerge at very early ages and remain stable through life (on average), operating most strongly in the preschool years.

Dr. Spock’s “permissive parenting” has been replaced by “intensive parenting” in response to this new understanding, especially by higher income, education and social class parents. Concerted cultivation of children’s skills by both parents is the new norm replacing an earlier theory that natural growth by a child would be good enough.

High school graduates prioritize obedience above self-reliance in their children by 55% to 35%, while college graduates seek self-reliance above obedience by 55% to 25%. Upper class parents have adopted the new parenting approach faster than lower class parents.

Working class parents provide their children with a 3/2 ratio of encouragement to discouragement, while professional class parents offer 6/1 positive to negative feedback, consistent with the goal of creating autonomous young adults accustomed to making good decisions and choices. Putnam notes that these differences reflect historical parental experience and the need to help students in threatening environments survive.

Trends in the percentage of parents who say their family usually eats together also shows that college graduate parents are retaining their interactive style better than high school graduate parents, with the first group declining from 80% to 75% since the 1980’s while the second dropped from 77% to 65%. Both groups saw a decline in a busier time, but college educated parents preserved this family time better.

Personal spending on children for educational activities reflects this split as well. Families in the bottom one-third of incomes invested about $1,000 of real dollars per child annually in the 1970s through 2010. The eight decile (higher) income families increased their investment from $1,700 to $2,600 while the top decile families more than doubled their investments from $3,000 to $6,500.

High school graduate parents increased their time in developmental childcare from 35 minutes to 75 minutes per day between 1990 and 2010 while college graduate parents surged from 50 minutes to 130 minutes per day. In rough terms, both groups doubled their investment, but the lower educated parents went from a half-hour to an hour while the greater educated parents moved from an hour to two hours, further increasing the care giving gap.

For their 4-6 year old children, college educated moms chose professional day care 70% of the time versus high school educated moms who “chose” it 40% of the time. Similar differences exist for younger children and for the availability of formal pre-K education.

Parenting differs significantly between American social classes and these differences drive large differences in child development, educational results and preparation for careers and life.

4. Schooling

Putnam next focuses on Orange County, CA, once the epicenter of suburban (and Republican) America. The county kept growing from its early 1960’s rise to prominence reaching 3 million people as the sixth most populous county in the nation. Its demographics have changed. 46% speak a language other than English at home. Latino immigrants account for almost one-half of K-12 students. Within the county, incomes and demographics vary widely. The author contrasts Santa Ana at $17,000 per capita income (95% Latino) with Fullerton at $100,000 per capita income (25% Latino). He compares the school districts and shows that school resources (inputs) are similar but outputs diverge. 65% vs 20% take the SAT test and score 1917 versus 1285. Top 10% versus bottom 20% on California standardized tests. 2% versus 33% truancy rate.

Clara, Ricardo and Isabella – 2015 – mom Clara and dad Ricardo grew up in an LA ghetto in the 1970’s. Both managed to attend college and then graduate, Clara advancing through a social work and counseling career and Ricardo succeeding as an architect and project manager. Clara’s first marriage failed and she managed as a single mom of one son in her late twenties. She married Ricardo before turning 30. Clara’s Mexican parents moved to LA during WWII and settled their family in Watts. Clara and her brother recall racial strains, good family and school support. Their family moved away from the poorer parts of town twice. Clara noted “We’re pretty Mexican at home, but at work we’re totally Americanized”.

When Isabella reached school age, her family also moved further from the poor neighborhoods and cities to Fullerton, noted for its university and high school excellence. Clara researched schools in depth before their move and continued as a highly involved parent, ensuring that her daughter was always engaged in learning. Troy HS in Fullerton is a public magnet school and ranked among the 100 “best” in the US. The environment is “pressure cooker”, but the kids complement their long hours of homework with extracurricular activities. Both parents helped with homework reviews. SAT prep classes are common. Parents easily raise money to support activities. School counselors and parents guided the college application and choice process. Isabella chose to attend a California university to “save money”, while her brother attended an Ivy League school.

Lola and Sofia – 2015 – The young ladies’ birth mom was drug addicted, a gang member and prisoner, dying when they were 10 and 2 years old. Their different fathers were also drug addicts and gang members. One disappeared altogether and one lives in Orange County but played no role in their lives. They were raised by their grandmother (mom’s mom) and step-grandfather in a solid working-class neighborhood in Santa Ana. The girls claim “we had the normal suburban life”. Grandma died when they were 14 and 6. Step-grandad continued to live with them until they were 19 and 11 before moving out, but allowed them to stay in the house and supported them financially. Lola became the “mom” for her sister before starting high school. She dropped out as a junior and eventually completed her GED. She works as a clerk in a discount clothing store.

Both girls had positive stories about elementary school but horror stories about high school. Gangs, disengaged teachers, no academics, no extracurricular options except for a few “honors” students, fights and shootings. Lola persevered and moved Sofia into a remedial “continuation school” for her last two years and she flourished in this “guided” independent study program mostly done at home. Sofia passed the California graduation test and attends the local community college in a teacher-training program, but many obstacles remain to obtaining a professional position.

Putnam uses his statistical approach to answer interrelated questions about public schools. He concludes that different schools provide very different environments and results, but that the different resources, teachers and academic programs have less impact on results than the differing financial and class backgrounds of the students who attend and the support of their parents. He believes that some school changes could improve results to help less advantaged students to compete and thrive.

The achievement gap between low- and high-income students is one-third wider in 2000 than it was in 1975. This is equal to several years of extra schooling. The class gap has been growing within racial groups while it has been narrowing between racial groups. Putnam takes great steps throughout the text explaining how measuring results within racial groups to support his claims that “class” is very important in no way should be seen as saying that differences across race are unimportant or that racism does not play a role in equal opportunity or social mobility. Research finds that gaps in school achievement at age 6 are essentially the same as at age 18 when compared by the mother’s level of educational achievement. Schools don’t seem to narrow or expand these differences. Again, Dr. Putnam walks a fine line. As much as he might like to criticize lower SES schools for their “less” effective programs and results, he must recognize that schools start with students of a given level of preparation, support, habits and expectations and might not be expected to deliver greater results for lower SES kids than for their higher SES counterparts. On the other hand, given their lower academic skills at the start of any school year, it ought to be possible to help some students to learn more than the usual “one year” of progress.

Residential sorting accounts for the differential results by school. Higher and lower SES pupils increasingly live in different neighborhoods and attend different school districts and schools. Higher SES parents have the information and resources to move into the more highly rated school zones, leaving lower SES parents and their children behind. Dr. Putnam acknowledges that “school choice” can have a positive impact for lower SES students who attend higher SES schools, but notes that the evidence is weak and that lower SES parents are not as skilled at identifying the best choices. Putnam cites research that shows that poor kids achieve significantly more in high-income schools, supporting his argument that class is at least as important as income or race in determining student results.

School funding per pupil is equal or subsidizes poorer districts in most states today. Student-teacher ratios and salaries are similar. Putnam suggests that a form of “teacher sorting” explains some of the different program quality across schools and school districts, citing higher turnover rates in lower rated districts as a result of more motivated teachers leaving them and moving to higher rated districts. He recommends investing more money in better teachers to improve results in lower SES programs.

However, the main takeaway is that what students bring to school with them matters most: skills, habits, expectations, curriculum demands, English language skills, medical diagnosis and care, parenting structures, encouragement, drugs, stress, disorder, parents, support, involvement, volunteers, fundraising, networks, etc. “Whom you go to school with matters a lot”. Peer pressure from students and parents complement the efforts of teachers. The “distractions”, discipline and make-up work required in low SES schools reduces the hours teachers invest in teaching.

Assignment of students to main/advanced academic tracks is less common today. Historically, it provided some advantages to higher SES kids who disproportionately qualified for the highest track. Most remaining schools with tracks do identify “higher potential” students from lower SES backgrounds. Schools with and without tracking show insignificant differences in social mobility.

Private school attendance has declined from 10% to 8% of students in the last two generations. The gap in private school attendance between college educated (10%) and high school educated (5%) families has remained the same. Private schools disproportionately benefit higher SES children, but no more today than earlier.

Differences in extracurricular activities offered, participation and leadership roles stand out when lower- and higher-SES schools and students are compared. Research links this participation to the development of soft-skills, education and career success. Five-sixths (86%) of top-quartile SES students participate in activities while only two-thirds (66%) of lowest-quartile students do so, down from a 77% participation rate in the 1970’s and 1980’s. High-poverty schools offer half as many team sports as low-poverty schools. Average and low-income school districts increasingly require “pay to play” funding for more expensive programs while higher income districts pay the fees or convince booster clubs to raise the money for all students.

American high school graduation rates rose throughout the twentieth century from 6% to 80% in 1970. Graduation rates in 1930 and 1950 favored the financially well-to-do, but closed through time to near 100% graduation rates at the top and 75% graduation rates for the poorest quartile by the year 2000. Solid progress. However, GED’s make-up one out of eight (12%) high school credentials and are clearly not the equivalent of a traditional high school diploma. Students with GED’s have some career doors opened, but GED holders have lower career results. Some of the progress in HS completion is real while some is unclear.

Economic, education and career standards have advanced in the last century. A high school diploma is not what it once was. The college degree wage bonus was 50% in 1980, but nearly 100% in 2008.

Rates of high school completion, college application and enrollment have converged in the last half century, with 45% of lower-SES students enrolling in college versus 90% of higher-SES students. Lower-SES students disproportionately enroll in community colleges and “for-profit” schools which have very low completion rates. Lower-SES students have lower graduation rates within 4-year colleges. Their low acceptance into selective colleges is even more disproportionate.

In 2012, 45% of the lower-SES students enrolled in college but only 12% completed degrees, while 90% of higher-SES students enrolled and 58% finished. Twice as many higher-SES students started degree programs, but more than four times as many finished. About one-third of higher SES students had not yet completed degrees within 8 years, while almost three-fourths of lower SES students had not reached their goal.

The gaps in college degree completion by family income have widened throughout the period. Lower-SES students increased from a 5% to a 10% graduation rate. Lower-middle SES students increased from 10% to 16%. The above-middle group improved from 16% to 33%. Higher SES students doubled their completion rate like the others, from 40% to 80%. In ratio terms, things are the same! But 80% versus 10% is clearly a wider gap than 40% versus 5%.

A final comparison shows that test scores play a role in achievement, but less of a role than family income. For the lower-SES quartile, degree completion improves from 3% to 8% to 29% for low, middle and high-test score students. For top-SES quartile students the comparable figures are 30%, 51% and 74%. A middle test score student of low means has an 8% chance of earning a degree (1/12) while a comparable student of high financial means has 50% odds (1/2). A high-test score student of the lowest financial quartile has essentially the same odds of college graduation as a low-test score student from an advantaged family (29-30%).

5. Community

The author turns to Philadelphia, a large and historically important city for America’s upper and working classes. He selects a pair of single moms with two daughters each for his biographical sketches. Like Port Clinton, Philadelphia had a long history of stable manufacturing jobs and mixed class white neighborhoods in the post WWII era, providing opportunities for upward mobility to children in all classes. The loss of manufacturing jobs and aging of housing, infrastructure and institutions lead to a break down of the formerly stable culture after the 1970’s.

Marnie, Eleanor and Madeline – 2015 – mom Marnie was raised in Beverly Hills and lived in suburban Philadephia for most of her adult life, daughter of an alcoholic film producer and wife who divorced and remarried three times. Marnie was academically gifted and despite her home turmoil earned an economics degree and MBA from Ivy League schools. The girls’ father earned similar professional credentials, succeeded as an entrepreneur, but when his business failed a dozen years later, he became depressed, was divorced by Marnie and moved “out West” when the daughters were in middle school.

Marnie worked for a consulting firm after graduate school. She struck out as an independent consultant, after her husband melted down, in order to maintain the lifestyle to which she and her daughters had become accustomed. She succeeded financially and despite a demanding work and travel schedule was able to raise her girls with the help of several caretakers. The daughters were distraught by the divorce and loss of their dad and absence of their mom. Private schools, boarding school, tutors and counselors were used to supplement mom and the caretakers. The daughters had challenges with drugs, sex, motivation and status but were supported by mom and her network of adult friends. Eleanor is majoring in business at a Midwest university while Madeline is pursuing French and International Development concentrations at a Canadian university.

Molly, Lisa and Amy – 2015 – mom Molly has lived in the inner-city Kensington neighborhood her whole life following earlier generations of her family. After her father’s death when she was young, the nine children in her family were placed in foster homes. She was placed in an orphanage for six years. She returned to her mother’s home as a teen but basically raised herself. She became pregnant in twelfth grade and dropped out of high school. Molly married and had a second child, Lisa, but her marriage ended in a few years as dad was an alcoholic and drug addict. Molly supported her family as a waitress and a construction worker for a decade. She had Amy and another child with a man who worked as a roofer, but he too became hooked on drugs and left to become a homeless neighbor.

Molly suffered additional injuries: multiple sclerosis and a stroke, restricting her to a wheelchair. Her youngest son was autistic and required extensive medical help. She did her best to use public welfare programs to get by but suffered from depression. A local church helped her with counseling, housing and programs.

Lisa was damaged by her poverty and parents’ woes. She struggled in school and to make and keep friends. She skipped school often, drank and used drugs. She became pregnant in twelfth grade with a local drug dealer but refused to marry him. She married another boy (John) from her church and lived with his alcoholic family. The church helped John find a job and the couple find an apartment. John finished high school but dropped out of community college. Lisa did graduate from high school and attended a for profit school to earn a pharmacy technician degree but has never worked in this field despite incurring $50,000 of debt.

Amy showed early promise in music and made some solid steps forward during middle and high school. She too fell for alcohol, drugs and boys. Due to cheating and truancy, she was expelled, was home schooled and then returned to public school. She became pregnant in tenth grade. She moved to a “pregnant moms” high school and excelled academically with the extra support provided to her. She has not married. She plans to attend a college with special programs for young moms.

Both families faced challenges. Marnie had enough personal, financial and community assets to guide her daughters to success. Amy lacked these support systems but was able to leverage public school, agency and church resources to help her daughters barely survive their difficult circumstances.

“Social capital” is used to refer to an asset in parallel with financial and human capital assets. It is the social connectedness held by an individual – who they know and what help they can be as mentors, advisors, guarantors, examples, insurers, job leads, system navigators, friends, trusted people, offering a sense of belonging and community, etc. Social capital provides economic and personal benefits. Research ties it to health, happiness, educational and career success, public safety and child welfare. Sociologists have made it a primary focus of their studies for more than a century documenting how migration, urbanization, globalization, family structures, work environments, neighborhoods, social institutions, social norms, religious practices, diversity and homogeneity effect people. In general, sociologists bemoan the loss of small-scale cohesion that existed in an earlier time replaced by large scale cities, secular ethics and a materialist, transactional culture. As noted above, sociologists tend to lean leftward politically, but much of the content of their work focuses on the human dimension that many political conservatives try to preserve or revive.

More educated individuals have more close friends and more contacts. Their friends and contact networks cover a wider range of classes, industries, professions and institutions. More educated individuals are able to leverage these networks as needed and provide reciprocal help to others when approached. The advantage in close friends is only 15-20%, but the informal network advantage ranges from 25-100%. The smaller and weaker networks of less educated parents, even when there is a married couple, provide less support to children in the key high school years when they are making the transition to career training and education. The children have met fewer people, in fewer places, mostly of lower professional levels. Their parents know fewer people and their teachers and counselors are less likely to plug the gap. Formal mentoring programs can help, but their availability and duration make them partial replacements even for the students with such support. Informal mentors and contacts can also help to guide students regarding social choices – drugs, alcohol, sex, church and activities. “It takes a village to raise a child”. Higher SES kids have 50% more mentoring contacts, including almost twice as many teachers, friends of family, religious leaders and coaches.

Neighborhoods are increasingly segregated by class and the character of the neighborhood shapes daily life. Crime, poverty, health, safety, institutions, schools, norms, civic engagement, disorder, decay, trust, responsibility, collective ownership and care vary by neighborhood and shape perceptions, habits, norms and opportunities. Neighborhood differences harm lower class kids at all ages and accumulate with years in a more challenging setting. These effects can accumulate across generations. Some of the effects come from the skills, beliefs, habits, behavior and attitudes of individuals while others are transmitted through the quality of local institutions like schools, programs, libraries, parks, childcare and churches.

60% of affluent citizens say that they trust their neighbors. Only 25% of poor citizens agree. Strong social trust has fallen for top-third educated parents from 37% to 25%, a one-third decline from 1970 to 2010. It fell more sharply, from 30% to 17%, for the bottom-third educated group. Hopefulness versus hopelessness varies by class.

Church attendance and participation has been shown to have strong benefits to the participants, their neighbors and their community. Church attendance has been falling for all social classes but has dropped faster for lower education families. Top-third educated families have reduced church attendance by one-seventh (14%) between 1975 and 2010 from an average of 35 weeks per year to 30. Bottom-third educated families started at 30 weeks per year but dropped by 30% to 21 weeks per year. Given the trend to economic self-sufficiency where higher income families can support themselves (partially) while lower income families struggle, this disengagement from religious organizations is a significant loss for those with the greatest needs.

6. What is to be Done?

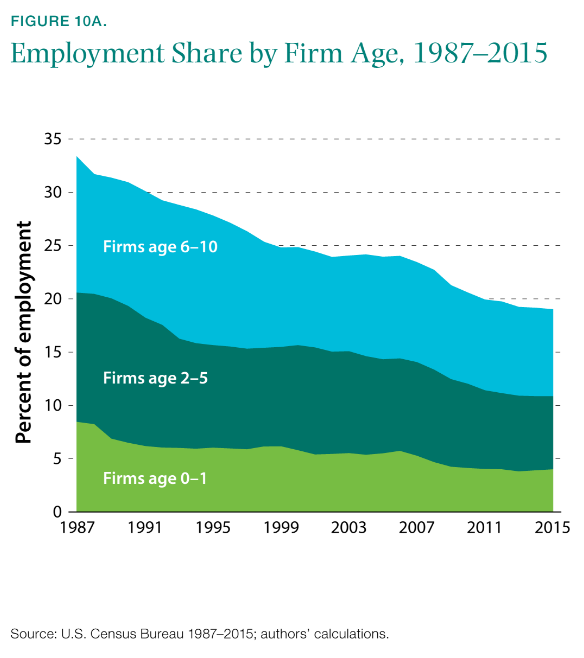
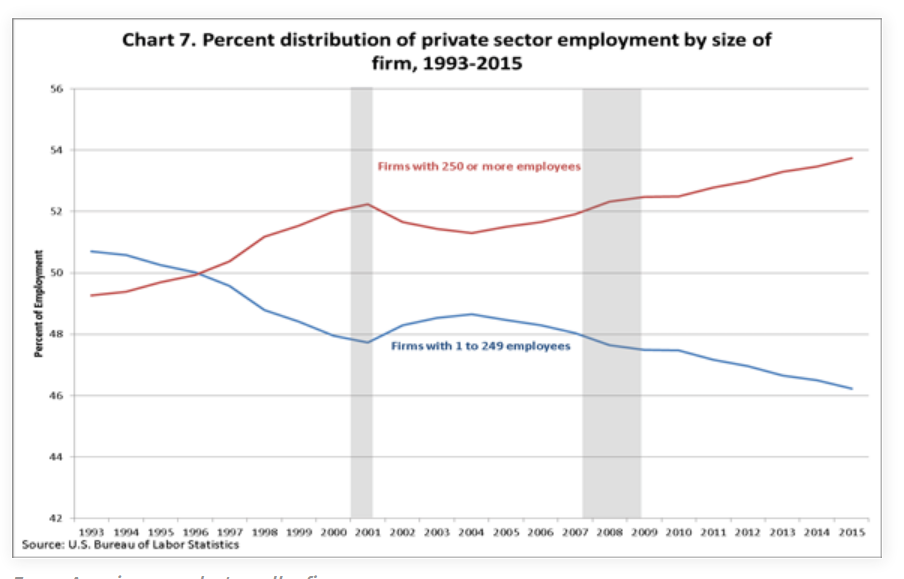
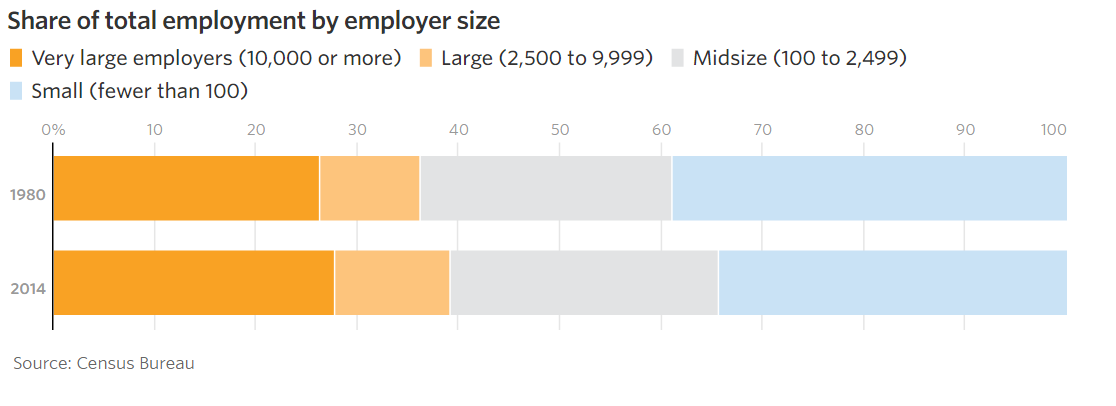
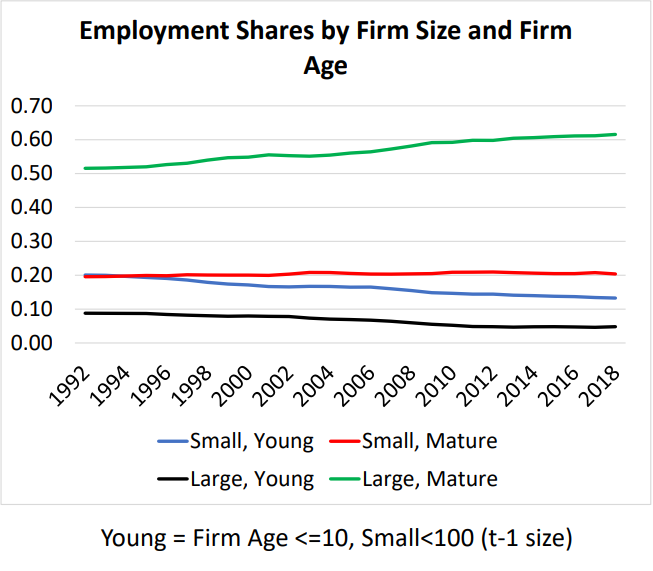
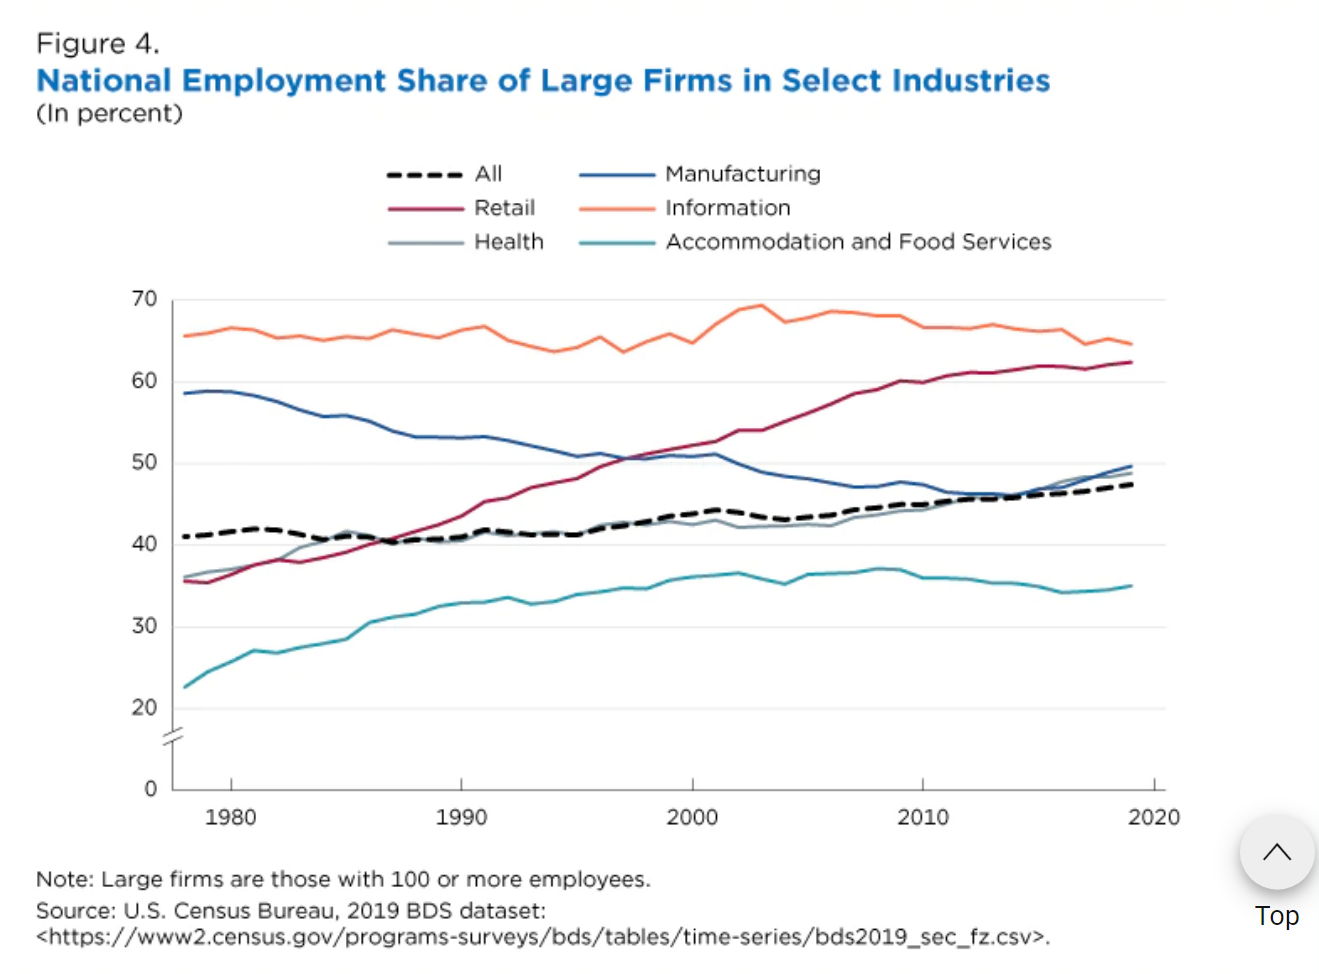
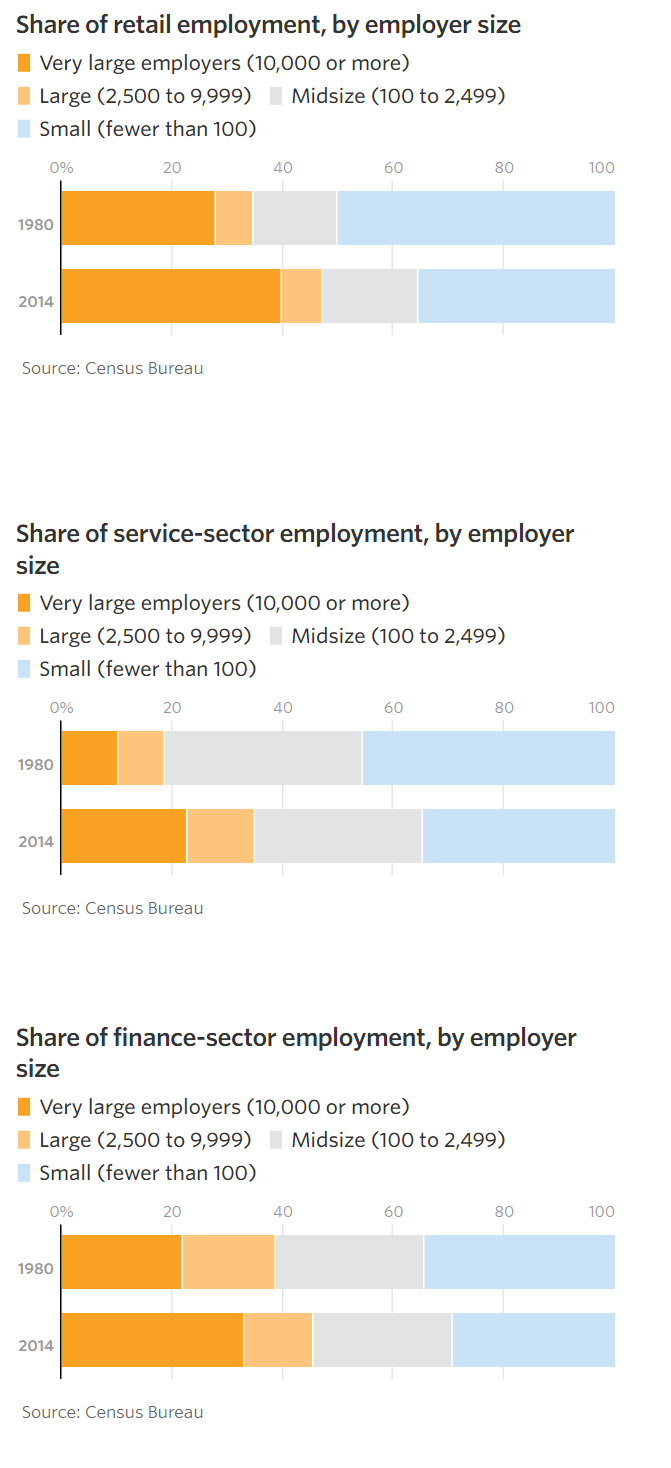
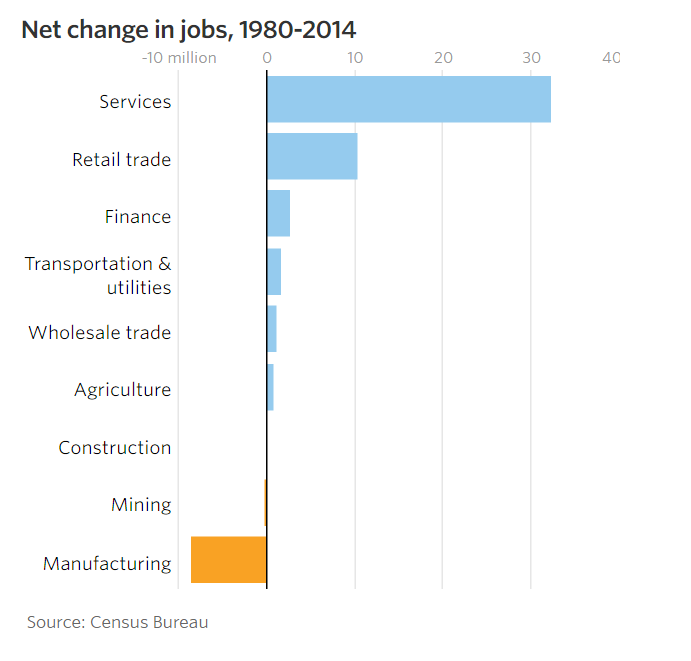
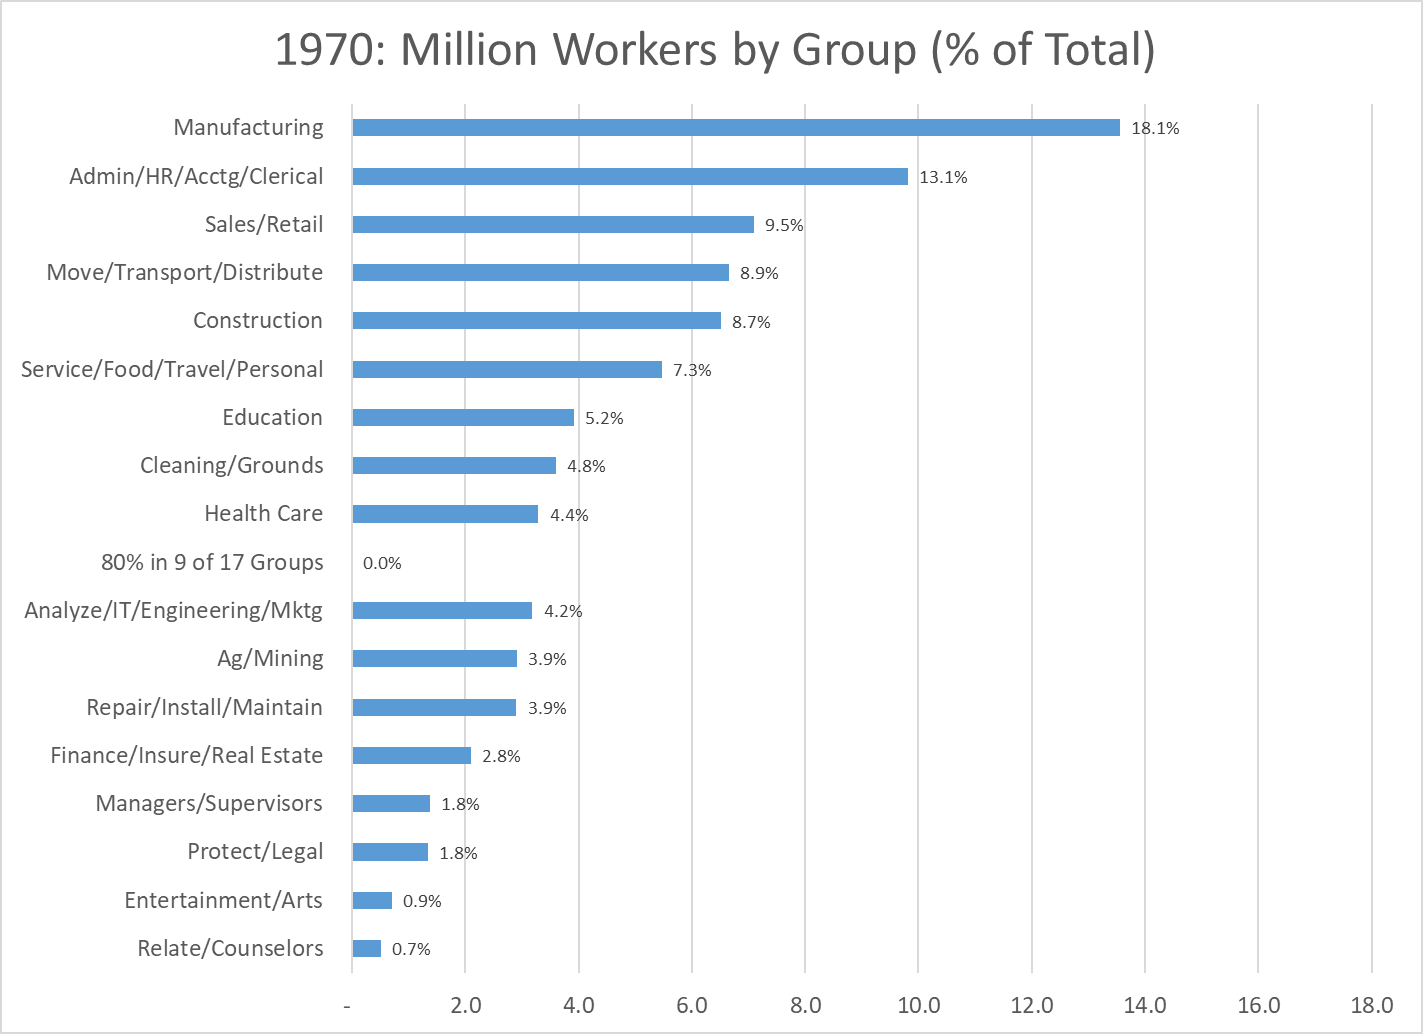
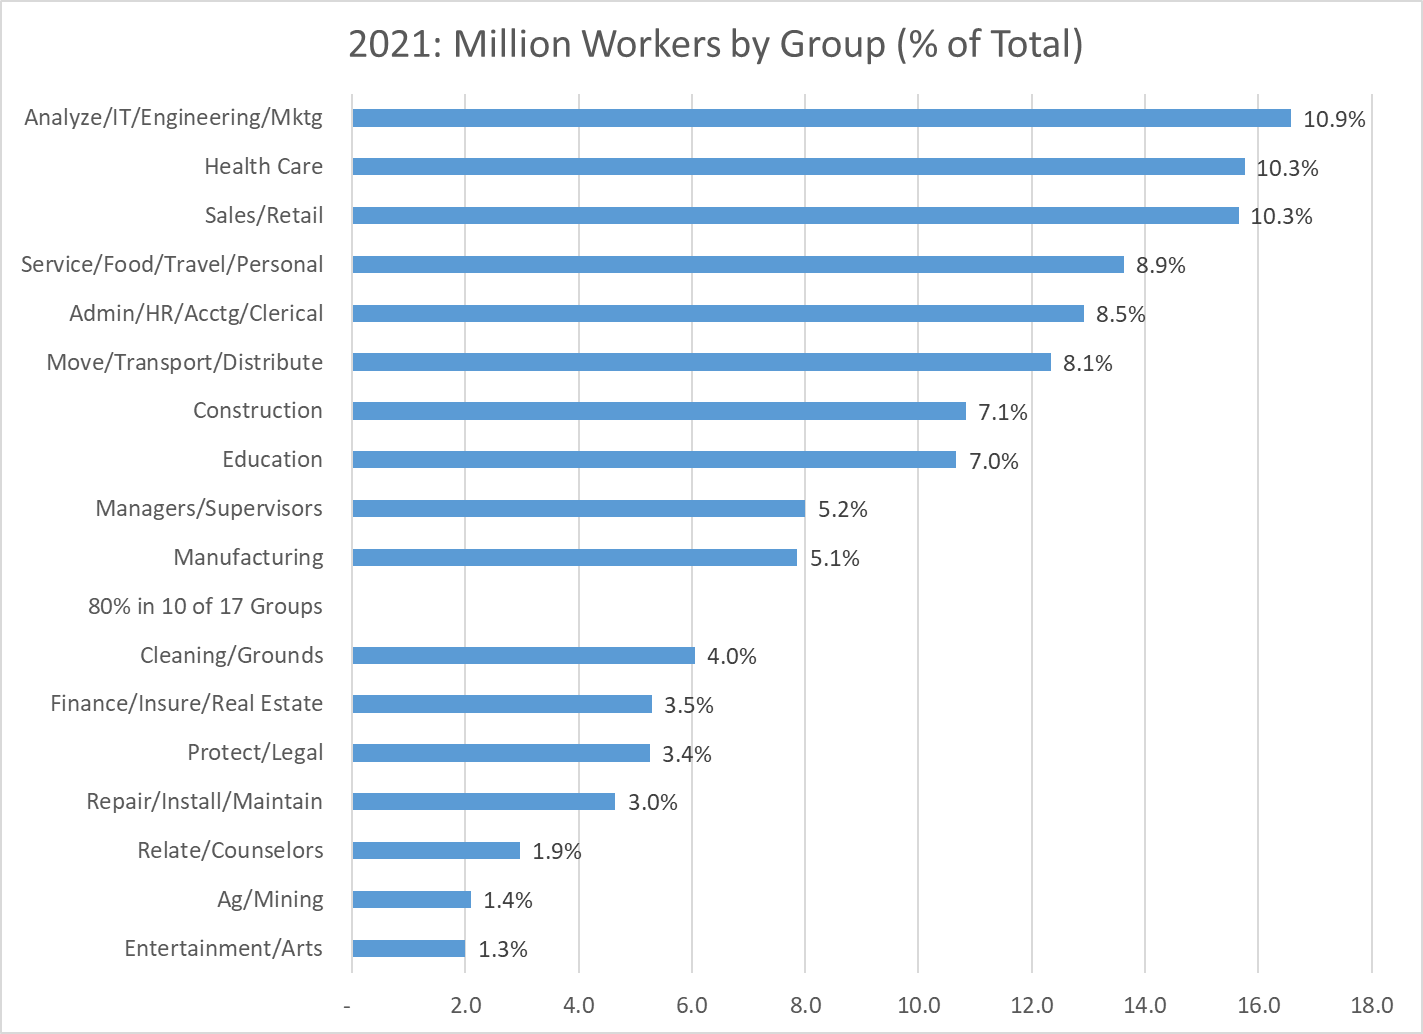
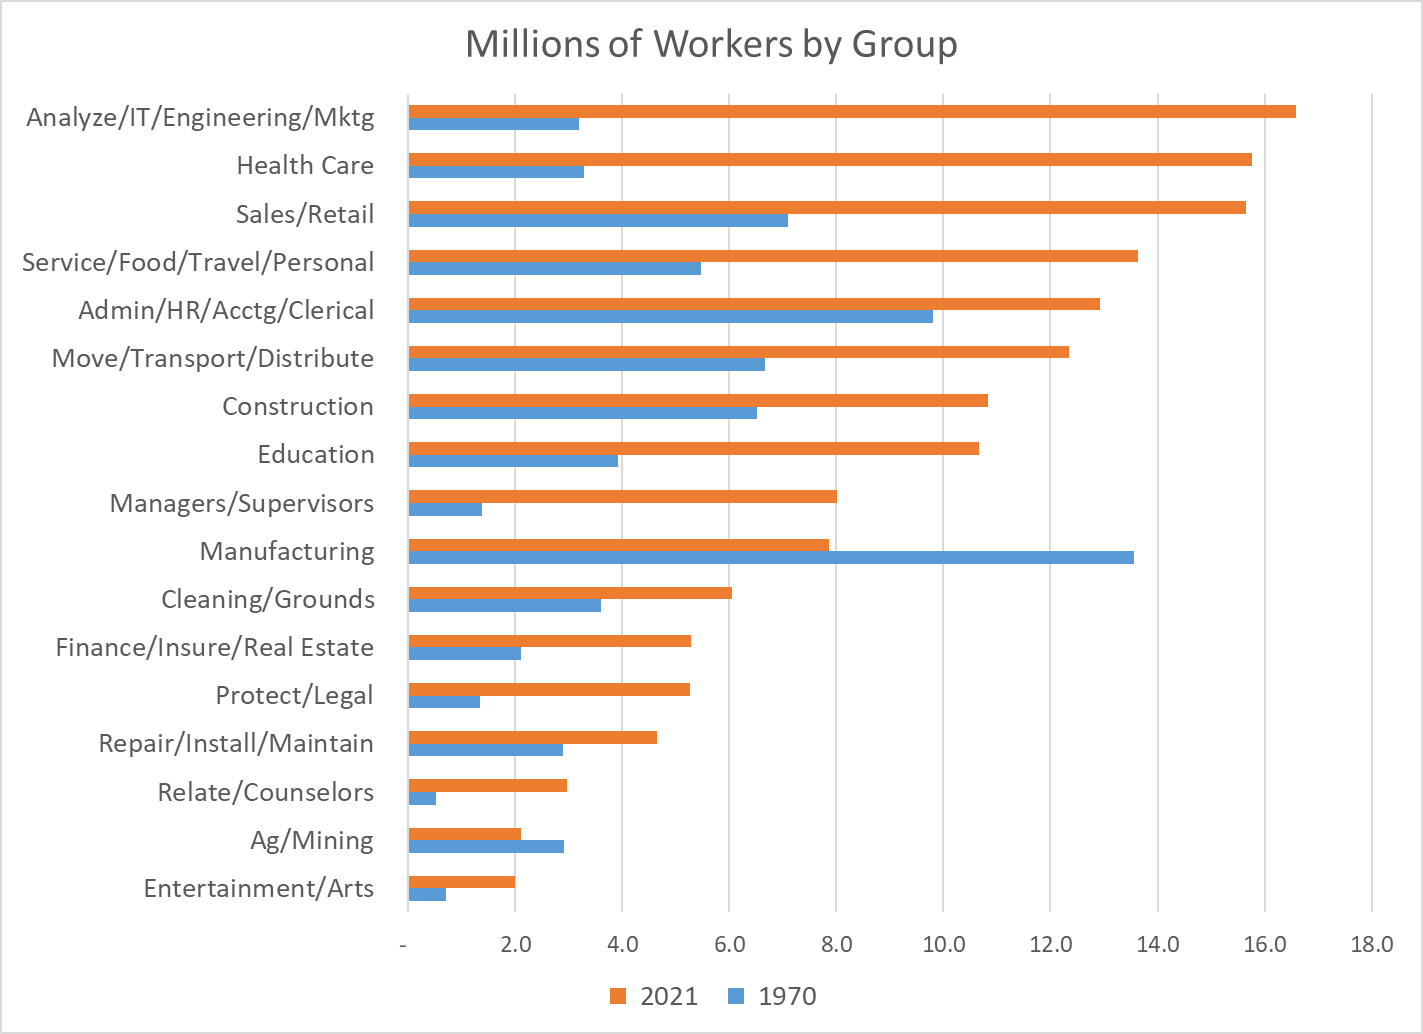
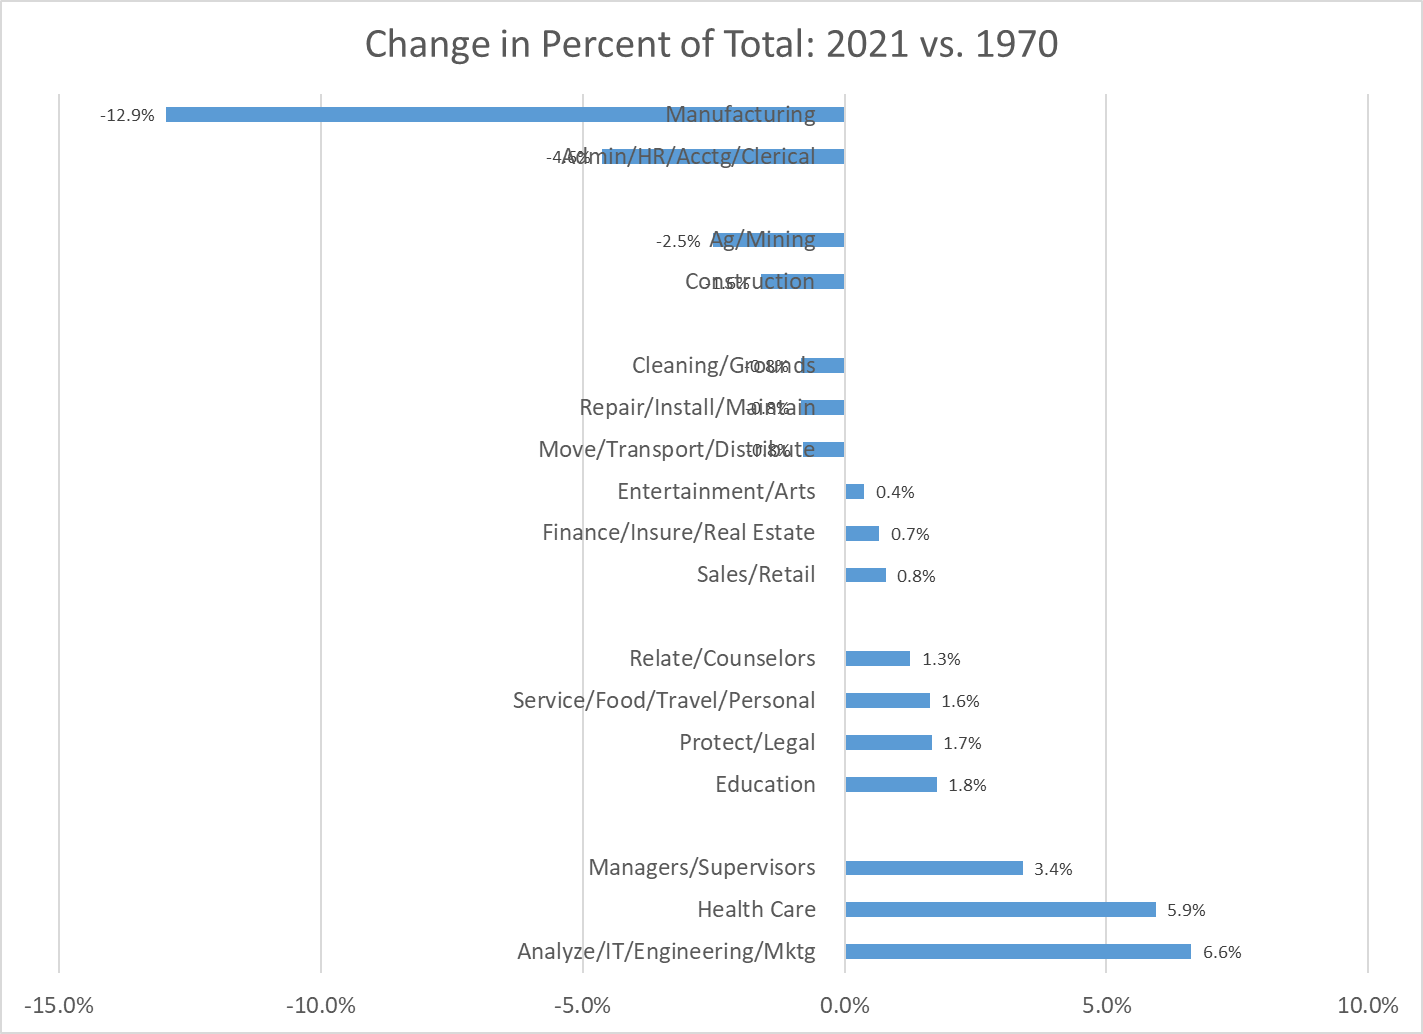
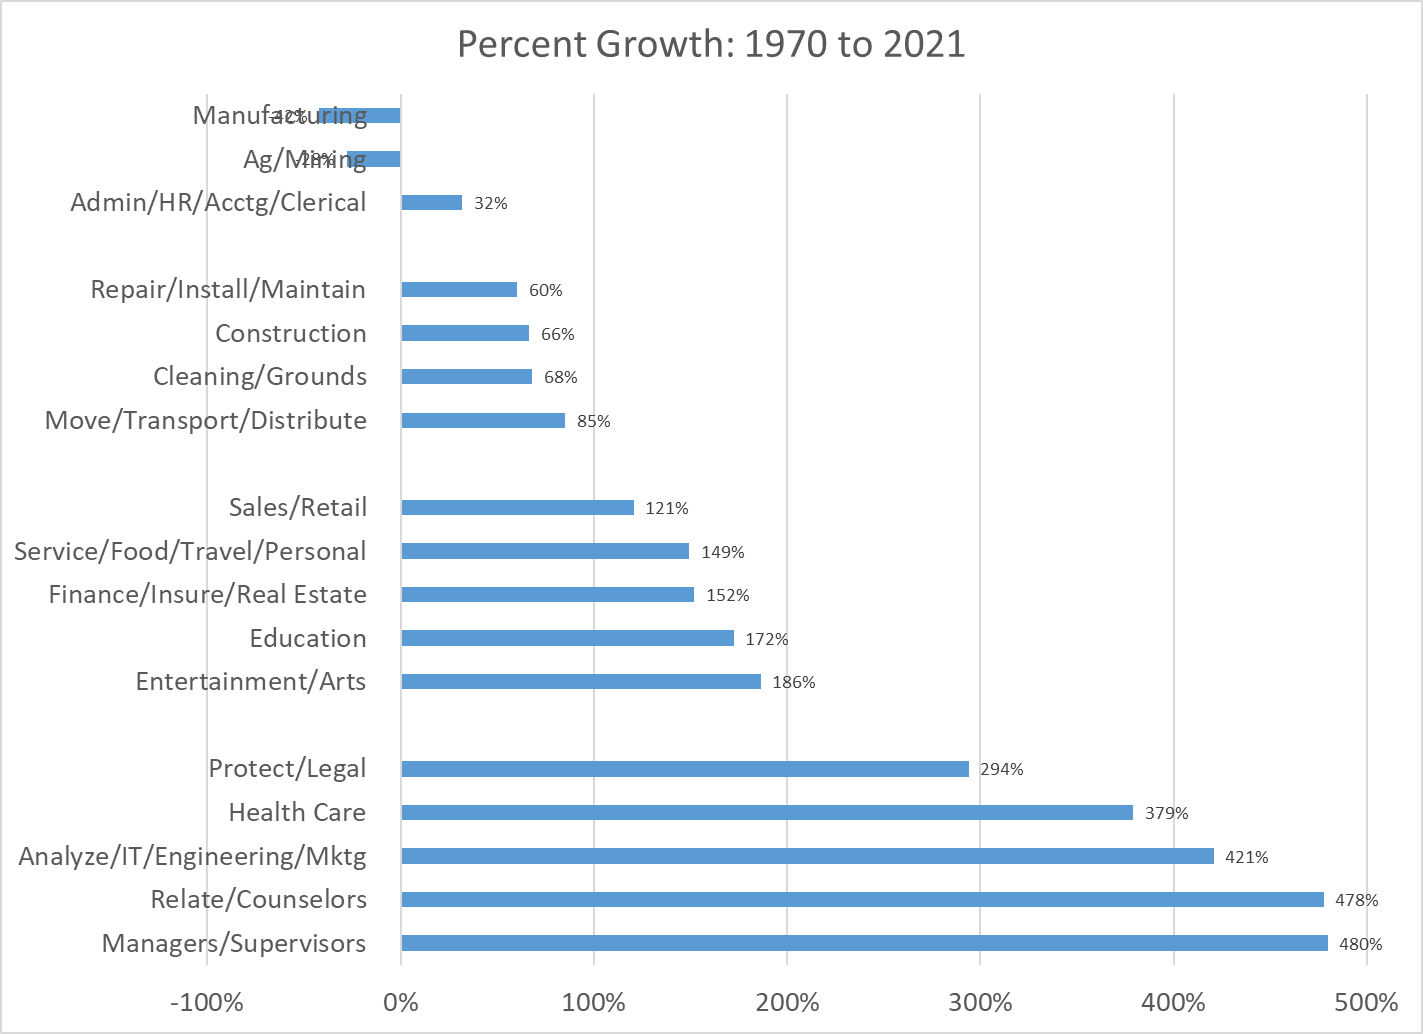
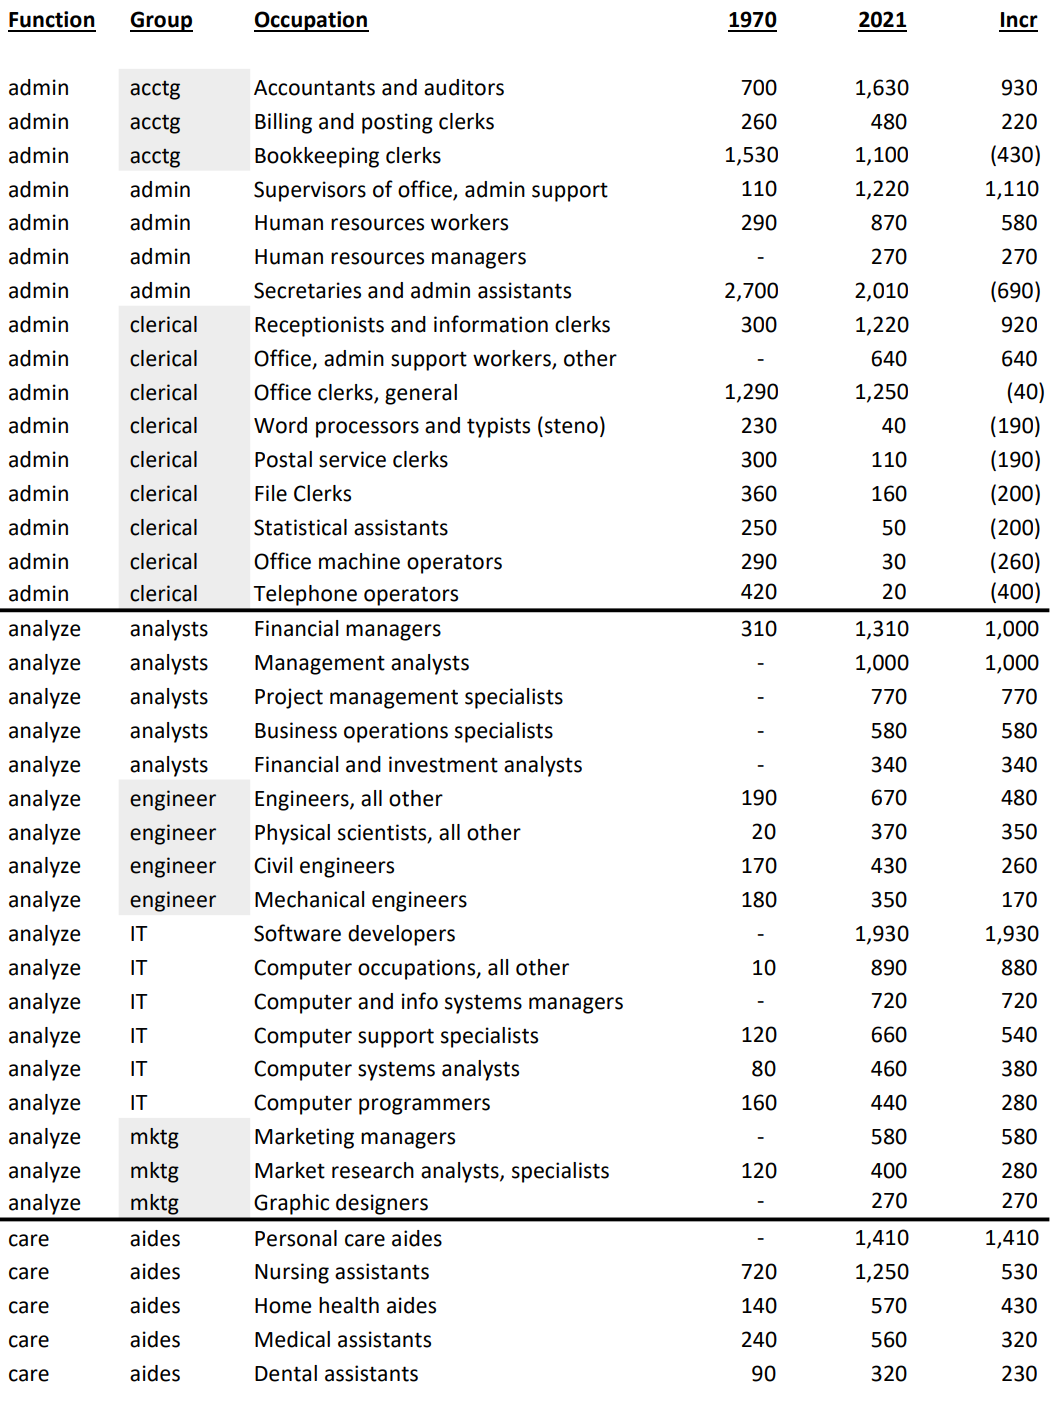
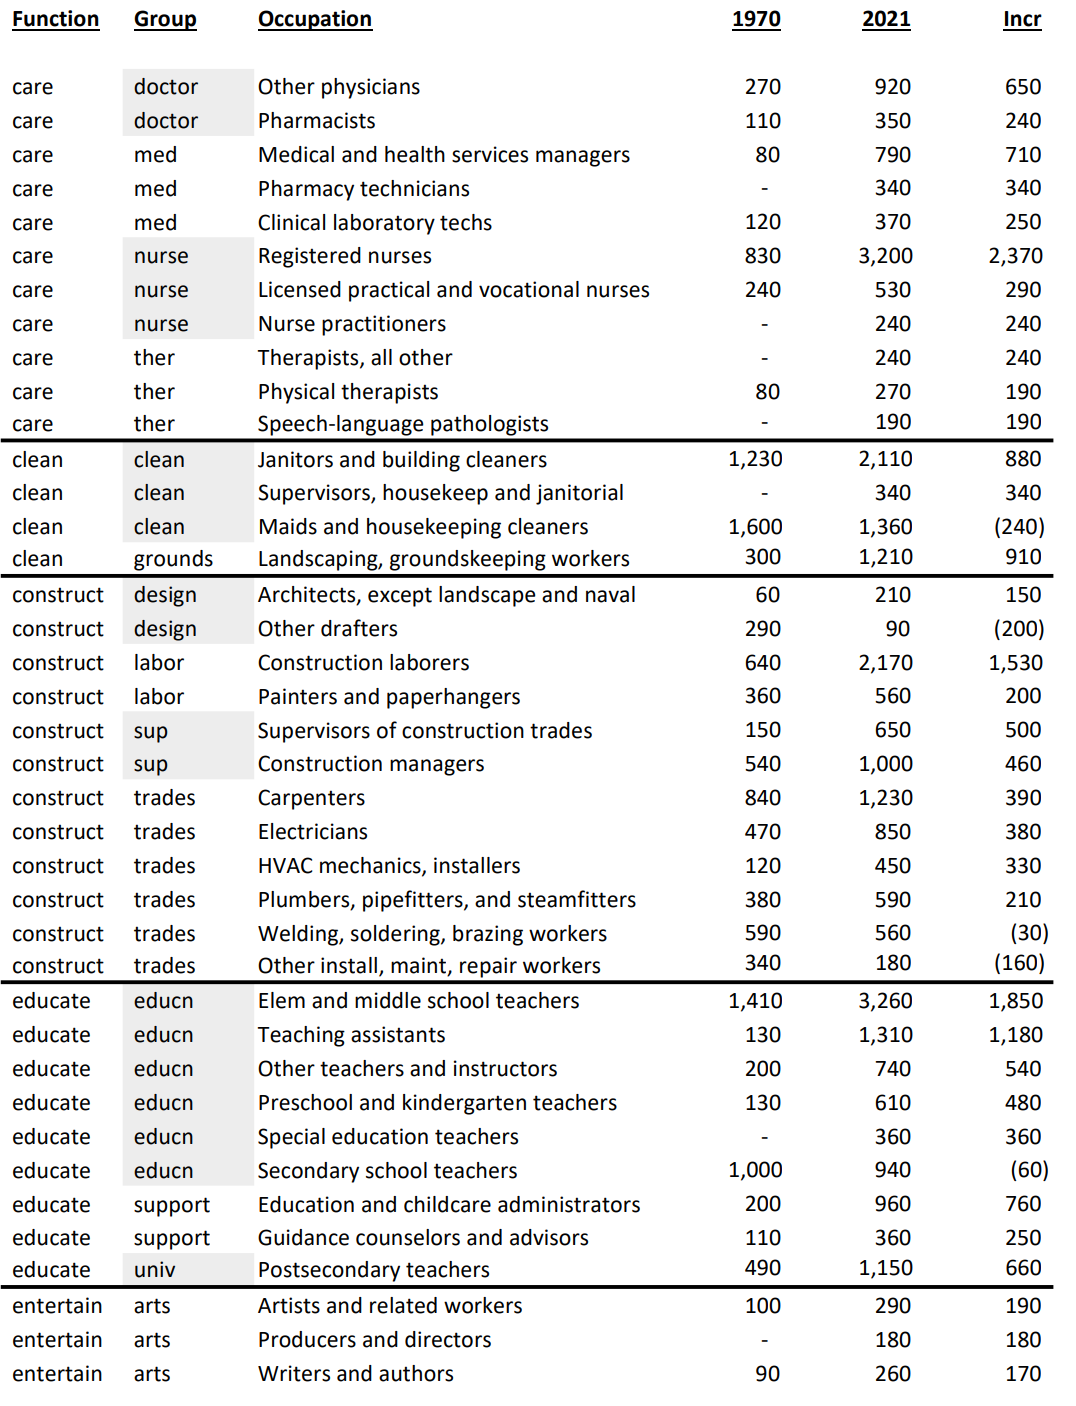
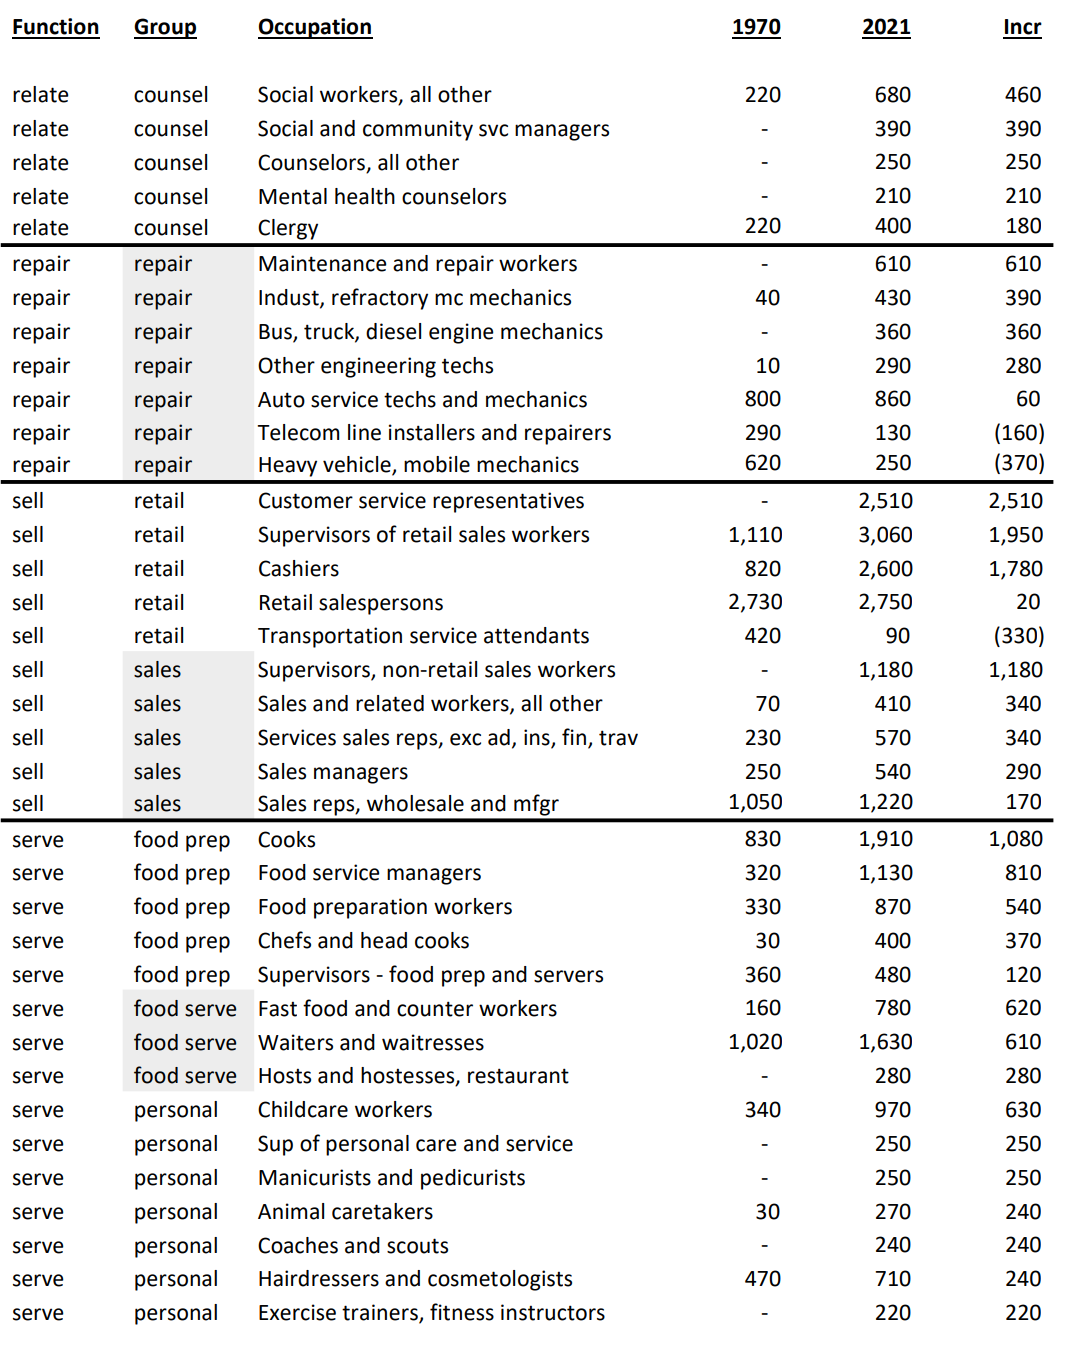
Growing income and wealth inequality is a problem. It is a root cause, but the book sidesteps this broad topic. Related to this issue, but slightly different, is the growth in scale and international competitiveness of the US economy that makes the gap between various economic roles much greater. Leaders, VP’s, directors and managers lead much larger firms. The complexity of modern production and commerce requires advanced STEM and other professional roles. Supervisors and technicians increasingly fill the middle jobs. Service and remaining clerical, distribution and manufacturing jobs fill the bottom. The complexity, required education, skills and experience required for higher jobs has increased much faster than that required in the lower half. Hence, the gap in “value added” between different levels is much higher. Upward economic and social mobility requires an even greater “leap forward” than it did in 1959.

The other drivers of lesser “equal opportunity” are the huge differences in family structures, parenting, schools and community support across American social classes.

As Americans, we hesitate to even use the term or concept “social class”, because our country was founded in opposition to the “social classes” of Europe and has embraced the heroic individualism of Jefferson, Jackson, Horatio Alger and the Republican Party for almost 150 years. We don’t have a king or a landed aristocracy. The typical American of either party and any income level is happy to take “pot shots” at the Rockefellers, robber barons, bankers and the corporate elite. Even with the rise of entrepreneurship, “rock star” CEO’s, and “the lifestyles of the rich and famous”, few Americans see a permanent upper class. Sociologists inevitably create social classes as tools for their work: sometimes 3 or 5 or 7, based on income, wealth, education, property, advantages, power, social standing and influence. Putnam’s statistics usually slice the country into 3 or 4 categories. As he noted at the beginning, education serves as a good proxy for class. Today we have 3 roughly equal size classes, defined by high school graduates or less (lower), college grads or more (higher) and the middle.

Putnam’s main conclusion is that social institutions and policies in the post WWII era promoted social mobility and economic opportunity by investing in the lower and middle classes, but that today we don’t make that investment. Our growing economic disparities are further leveraged into weak equality of opportunity and social mobility by our changed norms, institutions and public investments.

He notes that these differences have been felt sooner in marginal communities, especially nonwhite communities. As his Port Clinton chapter documents, I believe that they have also been seen earlier and deeper in small town America as well.

Putnam asserts that there are no “upper-class villains”. Social critics, leftists and populists might “beg to differ”. The increase in income inequality and the disproportionate value of public institutions for the “upper middle class” or the “professional class” or “suburban America” or “the boomers” makes this an increasingly controversial issue.

Putnam says we should address this challenge because of its impact on economic growth, democracy and morality. Failing to invest in lower- and middle-class students and institutions results in less development of their economic potential, lower productivity, lower output, lower earnings, lower growth and greater social costs (crime, welfare, police). Lower education and income citizens are much less engaged in the democratic processes. They have less buy-in to the system. They tend to not participate and undercut the legitimacy of government institutions and become more attracted to populist, authoritarian figures. Most religions and the US founding documents emphasize the inherent equality of individuals as human beings and the need for societies to invest in all citizens. There is an American consensus that “equal opportunity” is essential. This book documents that we clearly do not have “equal opportunity”.

The collapse of the working-class family is the central contributor to the growing opportunity gap. This should be in “ALL CAPS“. “Bowling Alone” documented the decline in community across many measures of participation in America between 1950 and 2000. “Our Kids” refines this analysis to show that the “upper middle class” is quite doing fine, thank you, on most measures of community engagement, participation and support, but that the working class has lost its historical moorings in the neighborhood, parish, ethnic group, union hall, union steward, precinct captain, extended family, social norms, religious enforcement, cooperatives, schools, social hall, VFW, township trustee, political boss, fraternal organization, social and athletic allegiances. The author accepts that these historical sources of working-class cohesion and support are mostly leaving the modern world but “hopes” that new social replacements will be found.

Putnam eliminates policy responses in several areas because they have not worked. Marriage enticements, abstinence, contraception, delayed childbirth, etc, seem to be beyond state influence. Policies that provide more cash to poor families are preferred: cash transfers, earned income tax credits, child tax credits and dollars for existing programs are suggested. Reducing incarceration could help dads to be better providers.

Putnam advocates for public support for children in the critical first 6 years of life. First year parental leave. Childcare subsidies for ages 2-4. Public funded and provided pre-K education. Parenting skills training and promotion.

Class based residential segregation drives different school results. Mixed income residential development policies could help. Invest in more guidance counselors and better teachers in low-income schools. Extend school hours and invest in extracurricular programs in poorer schools. Encourage neighborhood-based charter schools. Encourage Catholic schools to remain and grow in poor areas where they have historically been very successful. Invest in vocational education and locally controlled community colleges with vocational focuses. Eliminate “pay to play” from sports and activities. Invest in mentoring programs.

Postscript

In the last 40 years we were distracted by surface level debates about left versus right, liberal versus conservative. Republicans have clearly won the “framing” battle, contrasting the “free market” with “socialism”, “communism”, “bureaucrats”, “government”, “intellectuals”, “elites”, “planned economy”, “theft” and “taxation”. Schumpeter, Hayek, Rand and Friedman have eclipsed Keynes, Samuelson and Galbraith. The virtues of “capitalist creative destruction”, avoiding “the road to serfdom”, elevating economic results and values above all others and eliminating any national economic policy choices have captured the public imagination. The technocratic details of minimizing business cycles, managing a “mixed economy”, counterbalancing economic powers, balancing inflation and employment, managing the banking system, optimizing international trade and making real economic choices have become political “losers”.

Yet, the nation surely knows that “free market” economics is not the only solution. Real people are affected by our economic and social systems. We have a political system that is intended to manage these competing claims on society’s resources. Putnam describes this as the fundamental contrast between individual and group/community claims. American society has leaned to the individualist side historically but has often considered the community perspective as well. In the last 50 years it has leaned hard towards the individualist perspective alone.

This book shows what has happened. In 1964 with per capita GDP at $20,000, as a nation, we were able to invest in local, state and national institutions that ensured that all individuals in the bottom two-thirds could pursue upward mobility. Today at $60,000 real per capita income, we don’t have effective institutions or programs that support “our kids”. This is an economic, democratic and moral tragedy. I don’t think that politicians or citizens intended this result. I think that this is an unintended byproduct of the pendulum swing towards individual values alone.

Liberalism and Its Discontents – Francis Fukuyama 2022

US politics are very polarized. Left and Democrat are nearly synonymous. Right and Republican are nearly synonymous. Professor Fukuyama sees an even greater threat from the challenges of the “New Left” and the “Hard Right” to the core principles of the “classical liberal” political system of the United States.

The book is a defense of “classical liberalism”. Limited government power. Legal institutions protect individual rights.

Not US center-left political liberals or EU center-right political liberals.

Classical liberalism is under attack from right – nationalist, cultural, authoritarian and from the left – postmodern theory, inequality, identity politics, group rights.

Classical liberalism born of history, 1700-1800, rationalism, science of enlightenment, anti-conservative aristocracy, church, tradition, favored groups. Partial solution to the post-Reformation religious wars. Dominant world view 1945-1990 as communism and fascism lost war of ideas. But, also opposed by romantic movement 1800’s, nationalism late 1800’s, communism 1900, fundamentalist religion, etc.

Inherently a practical solution to a world with unavoidable diversity of opinion and interests: religious, ethnic, state, culture, race, gender, class, etc. Privileges individual over community. Privileges institutions (law, military) over individual political actors. Privileges pragmatism over theoretical cleanliness. Privileges conflict avoidance above utopian justice. Privileges incremental change to revolution. Privileges all individuals’ rights versus just the most valuable individuals’ rights.

In a more diverse, global world, “classical liberalism” remains a solid choice for organizing society. The burden for promoting change lies with the critics.

1. What Is Classical Liberalism?

A. Individualist. Claims and rights of individual get priority over claims of any group.

B. Egalitarian. All individuals have an equal legal and moral standing in society. This contrasts with systems and philosophies where groups are more important. Nations, monarchies, aristocracies, oligarchies, autocracies, religion, class, race, etc.

C. Universalist. Humanity as a species is first. Specific historical forms, institutions, groups, leaders, cultures, etc. are secondary.

D. Meliorist. Social and political institutions and arrangements are imperfect, subject to improvement or decay. Liberalism is inherently pragmatic, accepting that no system or policy will meet the needs or reflect the values of all citizens. Compromise and tolerance are required to govern a state with unreconcilable differences. Liberalism sought to end the “wars of religion” where opposing sides were certain they were right and willing to fight. Liberalism accepts the need for a “strong state” to militarily offset the powers of “strong men” or “strong groups”, echoing Thomas Hobbes.

Individuals have rights because they are human. These rights are more important than social, political, economic and cultural institutions. Freedom of speech, association, belief and politics. Right to own private property and transact by choice. The right to vote and influence political decisions were added through time. Starting with these principles, governments are freely formed by individuals (contract theory) in order to protect individuals and preserve these rights.

Critically, “liberalism” is based on ideas, rational philosophical ideas, rather than history, tradition or power, per se. It is not only based on ideas, but also on history and experience. The “rational” dimension of “liberalism” can cause proponents and defenders to take positions that are considered “extreme” by others.

Contrast “liberalism” with “democracy” which is “rule by the people”. Democracies provide voting rights to most citizens and limit the power of strong groups to restrict the vote of the people. Not all liberal states are democracies. Democracy has expanded greatly during the 20th century. “Liberalism” provides an infrastructure that supports democracies and buffers attacks on them.

The emphasis on individual rights in “liberalism” causes an emphasis on laws and the rule of law, independent of the exercise of direct political power. The history of powerful rulers disregarding any inconvenient “rights” made the early proponents and adopters of “liberalism” champions of this “checks and balances” approach to governance. Again, critics of “liberalism” point out that highlighting just legal rights can lead to unbalanced political systems and societies that downplay other values and interests.

“Liberalism” claims to be a moral system. It honors human dignity, autonomy and choice. Individual choice is supported in most areas of life, constrained only by legal and regulatory limits agreed upon by political representatives. This right to choose applies to all people.

Economic benefits stem from property rights, freedom to transaction, legal institutions and the “rule of law”. Individuals invest in potentially profitable opportunities because they are confident that they will be able to capture and maintain most of the benefits from successful ventures. Historically, this has delivered strong economic growth with positive spillover benefits. Some critics question the use of economic measures such as GDP and growth as proxies for society, but the “order of magnitude” growth levels under “liberal” economic systems clearly provide enough benefits to allow society to prosper and redistribute as desired. Liberals also tend to support “free trade” policies for the movement of goods, services, finances and people because these voluntary trades result in net added benefits to both sides.

“Liberalism” is strongly associated with the “enlightenment” and the “scientific revolution”, relying upon logic and evidence to make objective decisions. It is also linked with the “scientific method”, noting that the free marketplace of ideas is effective in evaluating competing claims and drawing conclusions, even if those conclusions are only formally probablistic, rather than certain.

Liberalism emphasizes tolerance and compromise as virtues in order to defuse strongly held differences of opinion. Hence, it is inherently in conflict with any religious or political view or system that believes that it holds the only “truth” and that this “truth” must be consistently reflected in political, regulatory, judicial and social decisions. This tolerance for differences aligns liberalism with ecumenical religious groups and “relativist” ethical philosophies. It also aligns liberalism with a more dovish foreign policy approach recognizing the “rights” of all states and the global community as valid. Because of its tolerance for diverse religious views, liberal secular states are sometimes seen as opposing religion or supporting atheist or agnostic religious positions.

Historically, liberal states have resorted to war to protect what they saw as essential national interests.

Liberal states focus on the philosophical principles that shape nation-states (freedoms, rights, liberties) rather than religious, ethnic or cultural dimensions (blood and soil).

Equal rights for all people was slow to develop in liberal states, even when the principles were enshrined in declarations, constitutions and bills of rights. On the other hand, the ideals of equality played a role in expanding equality through time.

Historically, the new “liberal” systems were supported by groups opposed to the existing, “conservative” powers: monarchy, state churches, aristicracy, landed gentry. Capitalists, property holders, traders, urbanites and professionals supported “liberal” systems which provided them with greater economic, political and social rights than the received systems. Through time, the more ancient powers lost influence and the new “middle class” accumulated power and influence in the “liberal” system.

“Liberals” celebrated the defeat of fascism and Nazism after WWII and the defeat of Soviet communism in 1990. Fukuyama’s 1992 book “The End of History and the Last Man” documented this achievement. The widespread adoption of basic liberal principles and “mixed capitalist” states was a clear economic success and no clear competitor remained in 1992.

Left- and right-wing political groups emphasize different parts of autonomy or free choice in the “liberal” state. Conservatives and neoliberals (Reagan, Thatcher, free marketers) emphasize free economic choices and a corresponding limit to government economic roles. Democrats, leftists and progressives emphasize personal social autonomy. Libertarians emphasize all freedoms and oppose large government roles of any kind.

2. From Liberalism to Neoliberalism

The post-WWII “good times” rolled for 3 decades, but the growth of government activities, slower economic growth, stagflation, international crises and growing political opposition to the “status quo” lead to a reaction against the general economic and political consensus that a “mixed economy” was “good enough”. Reagan and Thatcher won solid election victories with clear messages of “less government”.

This pro-business, anti-government philosophy became known as neoliberalism and was broadly adopted in many western countries, with left-leaning parties adapting with more pro-business policies and less government activism (Clinton).

Fukuyama points to inefficient, ineffective and overreaching government as drivers of this major change in political views. He notes that reduced regulations, outsourcing, divestiture and lower taxes did lead to more competitive industries and economies leading to increased growth and employment.

He also paints neoliberalism as an extreme view, discounting any role for government and unduly emphasizing just the economic dimension of public policy. He doesn’t see a close tie between “classical liberal” political states and neoliberal political philosophy and tactics. Like most “liberals” and economists, he sees various roles for the government in a modern state due to inherent “market failures”. Basic consumer and environmental regulations, military and public safety, anti-trust, financial market regulation, public goods (education, infrastructure), regulated natural monopolies, limits to inequality. He suggests that public policy should focus on the effectiveness of government services first and the share of government services second, without and demonization of government or lionizing of “free enterprise”. He notes that the share of government services provided is a political choice made within a “liberal” system that could be very low (20%) or very high (80%).

Fukuyama outlines the basic economic argument for “free trade” (opportunity to make both parties and societies better off) and notes that this is of little succor to those who lose from free trade (workers, businesses, localities), especially when policies and programs to help them recover are non-existent, underfunded or ineffective.

He observes that the political failures to ensure efficient governments, effective politics (vetocracy), limits to inequality, proper financial regulation and balanced trade have driven opposition to government, politicians and political parties on the left and the right from critics on the left and the right!

3. The Selfish Individual

The author sees neoliberalism and its libertarian cousin as distortions of “liberalism”, focusing solely on an extreme view of individual economic results alone.

Property rights matter, but no more than other rights of choice. Property rights are supported by government institutions, so the quality of government matters. The original distribution of property is an important factor which cannot be “assumed away”. There is no reason to prioritize financial rights or physical property rights over intangible property rights or other things which humans value. Economic efficiency and growth are valuable, but tradeoffs exist with other socially valuable goals: peace, security, opportunity, expression, speech, association, equality, fairness, solidarity, growth, etc.

Consumption is not the highest priority. Production matters, not supply-side economics, but human connection to producing. Pride of authorship.

Anti-trust regulation is required to offset monopoly power. Political action is needed to offset regulatory capture.

Libertarian approved theory of “spontaneous order” has little historical or theoretical support. Markets, common law and social Darwinism are not simply “facts”.

The state also has a role in international trade policy, industrial policy, R&D, defense, public goods airports, etc. Not either/or.

The economics discipline’s reliance on selfish utility maximizing agents is not supported by casual observation or behavioral economics. People use crutches to make decisions. They work from habit. They are OK with “good enough”. Individuals value social goods like friends, status, respect, pride, safety and power. They consider “fairness” and other principles. Choices are influenced by social norms.

People play various roles in groups. The simple rational model of principal-agent is inadequate to explain behavior. People follow leaders, norms and procedures. They discriminate based upon prejudices even when it is economically irrational. People belong to many groups which influence their behavior: nation, class, religion, family, neighborhood, profession, gender, gender preference, age, marital status, civic, artistic, political, social, athletics, etc. The materialist, determinist, rationalist, objective, calculating model of human behavior is clearly inadequate.

4. The Sovereign Self

The individual, good inner self evolves to become a self-worshipping god.

When the “liberal” model first evolved, a Christian (or at least deist) religious framework existed in most societies which provided a moral basis for politics and society. Freedom of choice was made within a largely fixed moral framework for most citizens. Through time, the individual grew relative to the community and individuals were then positioned to choose their own moral framework. This positioned individual autonomy to be the supreme virtue, above all others.

Autonomy evolved from individual choice to group choice and rights. This resulted in questions about the underlying basis of “liberalism”: individual versus group, universal human rights or differences, and the requirement of tolerance.

Martin Luther’s focus on “salvation by grace alone” focused on the individual, especially the internal individual’s thoughts in contrast with the mediation of salvation through the authority of the church and priests and the works of man. Jean-Jacques Rousseau’s vision of uncivilized man as inherently good further focused attention on the individual, since it was possible to shape this blank slate which could be perfected, in contrast with the doctrine of “original sin”. Immanuel Kant used reason to define the limits of reason and to develop a rational basis for morality, essentially the golden rule, optionally expressed in the maxim that man should always be an “end”, but never just a “means”. Again, the individual was highlighted and separated from religion. In this context, the ability of each man to reason and make choices was elevated as a supreme virtue, potentially above morality itself.

Fukuyama indicates that the basis for extreme individualism was available from the start, but only in the 20th century, after two world wars, Darwin, Freud, Marx and Hitler, was this variety able to blossom. He stresses the growth of the self-help movement as a key accompaniment to the philosophical, political and academic evolution. Therapists replaced priests and ministers as the guides for personal growth.

The author focuses on the philosophy of John Rawls in his 1971 “Theory of Justice”. Rawls provides a theoretical framework of choosing society’s rules in a “veil of ignorance”, where each individual does not know what his or her abilities, talents, wealth and opportunities will be. Rawls argues that a “rational man” in this situation would set rules that would protect him from the worst-case circumstances, even if that required transfers of resources and limits to opportunity and overall output. This matches the rational “mini-max” principle developed in post-WWII game theory. This provided American political liberals with a justification for their preference to reduce inequalities of income and wealth through government redistribution.

Fukuyama argues that Rawls goes “too far” in removing any moral basis from society. This “moral” choice is made almost mechanically on the basis of thought alone. The political influence of real individuals is ignored. “Justice” is defined without reference to “the good”. Rawls says that the human subject is separate from his attributes (wealth, status, character, genes) which are assigned arbitrarily. Hence, all property belongs to the state and can be redistributed as required.

Robert Nozick’s 1975 book “Anarchy, State and Utopia” challenges this view, arguing that individual rights cannot so easily be acquired by the state based upon a philosopher’s story. Resurgent libertarians argue that the individual owns all property before the state has any rights. Philosophers since that time have been busy contrasting the “individualist” and “communitarian” views of ethics ever since. Even left-leaning philosophers like Michael Sandel criticize this “thin moral world” of choices without communities, traditions or other moral values. Fukuyama says that this most modern view of ethics compared with historical ethics is parallel to the evolution of liberalism to neoliberalism. A valid principle has been elevated to an absolute standing and lost its rationale and practical effectiveness.

Fukuyama claims that Rawls’ provides a philosophical basis for moral choice that is solely individual, independent of society. He notes that many commentators on “liberal” political systems see a requirement for some level of shared moral belief, including tolerance and public-spiritedness. The growth of the self-help movement, personal growth and self-actualization in the postwar era provided practical experience of the self, detached from religious and social norms. Rawls’ philosophy said that is “fine”. Existentialist philosophy evolved into postmodernism and complemented Rawls’ political and ethical philosophy. Fukuyama argues that these views undercut the social basis required for a liberal political system and that individuals lured into believing that total personal autonomy is possible will be dismayed when they learn this is not so and thereby reject historical individual based political views and pursue group-based views (next chapter).

5. Liberalism Turns on Itself

In the next two chapters the author outlines how modern “new left” thinkers have created a political theory that is quite opposed to “classical liberalism”, especially as outlined by John Rawls. “Critical theories” and postmodern philosophy reject any strong individualistic philosophy that does not give strong weight to groups, communities and society. Ironically, in this debate, classic conservatives and “new left” progressives are aligned, raising up the group as a critical basis for ethics, morality and a just political state.

Fukuyama focuses on the nature of the individual self in Rawls’ philosophy compared with that of others who propose “critical theories”. While most citizens don’t really want to dig this deep, Fukuyama and other philosophically minded academics, critics and political leaders consider this essential. In the Rawls model, and in other “classic liberal” models, the focus is on the rational individual facing a world of choices. From this existential situation, the need and desire for certain rights and freedoms to support these choices by the “choosing being” are developed and a consistent political and ethical model is developed. As with the ultra-skeptical Rene Descartes, the mathematical Newton and the medieval philosopher of science Occam, “less is presumed to be more” in “classical liberal” philosophies. If a few assumptions and observations about individuals are sufficient to create a robust and effective model, why make reference to groups or specific moral goods, especially after many philosophers wrestled with the distinction between facts and values, is and ought, descriptive and evaluative claims and concluded that these two groups of ideas simply don’t exist in ways that they can be combined and evaluated. In practical politics, liberals of all stripes are ready to insert and advocate for their “progressive” values, including the importance of groups and specific moral values. But this is missing from the philosophical model.

Philosophers have long seen individual identity as a crucial aspect of being a person, especially as a choice making agent. Without self-awareness and a personal identity, how can one make choices? For “liberals” the choosing agent makes choices which build that identity, preferences and moral framework to guide choices. Per Rousseau, the individual starts with a “blank slate” and constructs this identity. The individual is first; the environment, including family, groups and society is secondary.

For “critical theorists”, some group characteristics that are imposed upon the individual (race, ethnicity, gender, gender preference, culture) are much more fundamental. The individual may begin with a “blank slate”, but society forces its perceptions and values regarding these group characteristics upon the individual no matter how hard he or she may try to choose for him- or herself. The critical role of society, the group, the system, the power structure is unavoidable.

To the common man, even a very interested “John Q Public”, this seems to be “much ado about nothing”, senseless quarreling over “nature versus nurture” or “which came first, the chicken or the egg?”. But for philosophers, academics, theorists and advocates, getting to the “root cause” is precisely the most important topic.

“Identity politics” is aligned with the view that an individual’s identity based on these key groups is essential. Those with power in any society use that power to create ideologies, structures and norms that define these group identities in ways that benefit the elites of that society. Hence, individuals in the non-preferred categories are unwittingly deprived of their rightful power and marginalized. Individuals shaped and governed by society’s messages, institutions, laws, thoughts and actions must be re-educated to understand the “real” situation and combat their exploitation. This sounds very much like the Marxist view of western society before communism was discredited by the real-world actions and results of the Soviet Union. The marginalized groups replace the marginalized workers, both needing to be enlightened by the few who have “true insight”.

From the 1960’s “New Left” forward, proponents of “critical theories” and “identity politics” have rejected “classic liberalism” as being an ideology of the powerful classes designed to maintain power and exploit the “masses”. The progressive left rejects individualism alone as a valid basis for any meaningful political philosophy. It observes little progress on reducing inequality or helping individuals to develop their true identities free from socially imposed masks. Unconstrained capitalism is linked to “classical liberalism” and found guilty of supporting the elites and oppressing the marginalized groups. The divide between the center-left and far-left is very deep.

In 1964 Herbert Marcuse outlined the basics of this transition from Marxist to “new left” political thought in “One Dimensional Man”. So-called liberal democracies did not promote equality or autonomy. The elites captured the corporations and legislatures and controlled society to maintain political, economic and social control by the elites. Charles Reich’s 1971 The Greening of America provided a more digestible best-seller with a similar message. “Free speech” was deemed a tool of the powerful and questioned. The “working class” was determined to be coopted in a consumer society where Vance Packard’s “hidden persuaders” forced them to consume ever more, work ever more and envy others. Individuals didn’t really choose; they only had the illusion of choice.

The New Left questioned the individualistic “contract theory” underlying “classic liberalism’s” political model, highlighting examples of slavery, worker and marriage contracts that were clearly imposed rather than negotiated. They argued that the exploitation of society by capitalists, dominance of neoliberal ideology and capture of regulatory agencies were inevitable. They outlined the long history of colonialism, imperialism, destruction of natives and presumption of a superior “western civilization” as evidence that the powerful groups would always do whatever is required to maintain control. They documented the ways in which political “checks and balances” provided the ruling elites with additional levers of power. They concluded that “classical liberalism” was intellectually and historically bankrupt.

Fukuyama presents some counterevidence to oppose these claims. Liberalism does not exclude groups, morals, society or other values. Real-world liberal political systems incorporate these values. An extreme form of liberal philosophy (Rawls) is just a straw-man, not representative of how actual liberal political systems work. Liberal states have made social progress through time, voluntarily investing more individuals and groups with greater rights. Economic progress is obvious. Liberal states invest heavily in social welfare programs. Liberal political states make it possible for progressives, liberals, conservatives and hard right groups to all have voice and political influence. International trade and economic growth make possible individual choices, health, art, safety, security and self-actualization. The individual focus of the liberal state frees individuals from the constraints of traditional family, kin and religious bonds. Meritocracy is consistent with a wide range of human development and actualization ideals. Migration continues to flow from states with limited individual rights to those with liberal rights, the rule of law and economic advantages. Liberal states support multicultural societies. The worst “sins” of “western civilization” and liberal states, including colonialism, are receding into history. Eastern European, East Asian and other states have successfully adopted the liberal state model. “Checks and balances” result in sustainable political changes and prevent authoritarian rule.

6. The Critique of Rationality

“Classical liberalism” is also closely associated with a rational approach to determining truth. Historically, logically and currently it uses and supports the “scientific method”. An objective reality exists and can be discovered by observation. Theories begin with self-evident assumptions and are fleshed out using logic. Theories are evaluated by the testing of predictions. Theories build credence as they develop more testable hypotheses which are validated or not invalidated. Humans can understand this objective reality and use science and technology to control nature. Scientists keep facts and values separated. Scientific conclusions (theories) are inherently probabilistic, but relative confidence can be determined and agreed upon. Techniques to verify propositions are agreed upon by professional scientists. Evidence is more highly regarded than individual assertions. Testing is defined so that it can be repeated and verified. Progress accumulates, although changes in scientific theories do occur. Science, like the courts, journalism and the military, is led by professionals who are largely independent of political power.

“Critical theory” proponents treat science and rational discourse as another social institution subject to control by the powerful elite.

In 1882 Friedrich Nietzche proclaimed “God is dead”. The decline in religious belief and influence in western Europe, especially in elite circles, allowed this to be stated and analyzed. Nietzche was saying that society had substitutes for the concept of God as a way to explain the world and manage suffering, so God was no longer necessary. He saw that Christian morality underpinned western society and politics and that the loss of this framework was a radical and threatening change. In such a world without shared morality, the only virtue or value was power. Nietzche outlined the contrasting lives of those living by the Christian “slave morality” and those of a noble superman who sees himself as the measure of all things. He concluded that “there are no facts, only interpretations”. Nietzsche did not convince many of his views then or now, but he opened the door to considering such different viewpoints. No morality. Only power. No objectivity.

Nietzche was a precursor to the philosophical approaches that lead to postmodernism. Nietzsche’s professional training was in philology, the study of a language’s grammar, history and literary tradition. His contemporary, Ferdinand Saussure, was a pioneer in the development of linguistics as the science of language. He separated words from a direct link to reality. For him, the human process of speaking is dynamic and the meaning of words are shaped by the speaker, disrupting the naive view that words simply signify things. The act of speaking also shapes the worldview of the speaker, making language a subjective entity.

Saussare’s subjective approach to language and meaning lead a series of French intellectuals including Jacques Derrida in the 1960’s and 1970’s to develop an extension of this view. The claimed that the external world is actually created by the words that we use to describe it. Other philosophers had considered what was “really real” previously and some had proposed that reality is really a subjective creation of the mind rather than an objective, material fact but this approach had limited impact outside of philosophy. As philosophers focused on language as a primary topic during the twentieth century, this idea became more attractive and, in some sense, “plausible”. The next step was to link language back to the power structures which determine language. Now, we have the power structure determining language which determines thought which creates reality. With this “structure”, a critic could “deconstruct” the underlying meaning of any important writings and show how the power structure guided the writer to reinforce the beliefs and interests of the power structure. Many doctoral dissertations could be written to show that all of “the western canon” was comprised of individuals unwittingly working for the power structure.

Michel Foucault expanded from this criticism of the true meaning of written language to a broader attack on all modes of thinking done within the framework of language guided by the “powers that be”. A subject like cross-cultural studies was inherently defective due to assumptions shared by the ruling western culture. The liberal idea that all individuals share an underlying moral core was rejected by Foucalt and the postmodernists. Instead, the shared lived experience of group identity is considered most important and differs from person to person. A privileged white American male simply cannot understand the experience of a marginalized non-white non-American female. The group experience is most important. The combination of various dimensions results in the concept of intersectionality which defines the most relevant group in even finer terms. By denying the ruling group member’s ability to understand the experience of the minority group member, this approach undercuts any authority of the ruling group member.

Fukuyama says that some of these insights about the role of language, subjectivity, tools of power, self-deception, alignment of interests, hidden biases, unconscious prejudices, etc. are valid in some historical situations. However, he does not agree with the philosophical or political conclusions that have been drawn. He notes that the deconstructionists and postmodernists have written in ways to make their theories difficult to describe or evaluate. He asserts that the extremely broad use of power as the driver of all activity is inherently flawed, asking if Foucalt’s analysis is also driven by the power structure. He notes that this framework can be used effectively for political purposes, to fence off criticism from others with differing views and to force others to consider societal or systematic components of social challenges instead of focusing on individual moral choices.

The author concludes the chapter by noting that modern identity politics can be a tactic used to help left-leaning partisans increase the sharing of equal rights, opportunities and outcomes for all members of less-privileged groups within the framework of the liberal state model. Or identity politics can be a threat to the liberal model, denying universal modes of comprehension and experiencing reality and promoting groups as the primary political actors. He notes that the hard right often takes this same point of view, denying the authority of science or elites, creating its own language, denying free speech, challenging facts and elevating racial and national groups above the rule of law and universal rights of individuals.

8. Are There Alternatives?

The author summarizes some of the major criticisms of liberal states from the right and the left. He acknowledges that liberal states are imperfect at delivering these desired outcomes, even when they might be broadly accepted by the citizenry. He does not really address the true strength of this criticism. He has three responses. Better results could be delivered within the existing system through more effective political strategies and improved rules. The far left and far right usually don’t offer structural solutions that are better conceptually or practically. The solutions that are offered are typically offensive to the liberal state’s individual protecting principles and a majority of the citizens’ political opinions.

Social conservatives say that the liberal state offers no moral core beyond a soft nationalism, universal human rights, rationality, tolerance, respect for the rule of law, deliberation and compromise. The state “allows” morality and allegiance to groups but does not promote them. Hence, society has weak communities, low trust, diluted morality, limited responsibility and the absence of any overarching purpose. The bureaucratic state tends to overreach, prioritizing secular over religious views and empowering judicial and administrative actors to intrude on individuals. Unchecked market capitalism undermines family, community and tradition. The emphasis on individual rights undermines the efforts of groups to maintain ethnic, religious or other group cohesiveness.

Progressives focus on the lack of progress on addressing equal rights, opportunities and results for the broad population, but especially marginalized groups.

10. Principles for a Liberal Society

A. The quality of government matters, as does trust and support.

B. Inequality of opportunity, rights and outcomes matters.

C. Federalism is an important tool for controversial, non-critical issues.

D. Freedom of speech is a core value that supports other freedoms.

E. Privacy is a core right requiring protection.

F. The scientific method and rational problem solving matter.

G. Individual rights are fundamental. Group rights are problematic.

H. Human autonomy/independent choice is not a trump card. Groups, ethics, morality, nation matter too.

I. The liberal state rests upon the commitment and participation of its citizens.

J. Moderation is a virtue.

New College of Florida: Not WOKE

https://www.latimes.com/world-nation/story/2023-02-05/florida-liberal-arts-college-gov-ron-desantis-wants-to-take-over

The New College trustees could benefit from reviewing the actual current state of affairs. It’s easy to caricature New College as left and woke, indoctrinating students and not preparing them for careers. The college might take a random sample of students who graduated in 2012, 2002 and 1992 and summarize their experience, education and career results to provide some perspective.

I’ve taken my own non-random sample of 13 students from my time at New College: 6 that did a state legislature internship with me, 6 roommates/housemates and me. I’ll share their New College graduation status, major, senior thesis title, other education and quick career highlights.

Stephen Duprey. 1974. Public Policy. “The Concept of Representation”. JD, Cornell. New Hampshire State Representative. Investor. NH State Republican Party Chairperson. Advisor to many presidential candidates.

Josie Coster Martin. 1978. Political Science. “Candidates and the Mythic Presidency”. Republican New Hampshire State Representative. US House and Senate staff member. Lobbyist and communications director for a half-dozen national associations, including Pharmaceutical Research and Manufacturing of America (PhRMA). VP, Communications, Steward Health Care.

Darcy Ashman. 1978. International Relations. “Neighborhood Action”. Masters, International Relations, Fletcher/Tufts. DBA, Organizational Behavior, Boston University. Prolific author of academic papers. 30 years as project manager and consultant to international agencies. Recently, Technical Director, Management Systems International.

Betsy Crabtree. 1978. American Studies. “Split Seeds”. Recently President, SF Arts Media and Board Chair, Head-Royce School.

Janet Weisenford. 1977. Public Policy. “Things We Dreamt We Died For”. Masters, Public & International Affairs, U. Pittsburgh. 20 years Navy program manager. Senior Director, ICF Consulting.

Rick Kint. Music and IT. BM, Music, George Mason. MS, Info Systems, George Mason. Systems engineer, including a decade at Google.

Tab Uno. Political Science. BS, Political Science, Utah. MPA, Public Administration, Utah. MSW, Social Work, Utah. Therapist, licensed clinical social worker, candidate for Utah House of Representatives.

Bryan Sachse. 1979. Economics. “Inflation and Consumer Behavior”. MS, Finance, Cornell. MBA, Cornell. Vietnam Vet. Salesman.

Bridget Patton. 1978. Economics. “A Direct Test of the Tiebout Hypothesis”. law courses, CWRU.

Julia Carrasquero. 1978. Political Science. “Chief Justice Warren’s Legal and Socio-Political Theory”. Legal and post-grad studies at Sanford University. 30-year Army veteran. Training supervisor.

Glenn Hendrix. 1982. Political Science. “Islam and Politics in Egypt and Iran”. JD, Emory. Chair, Atlanta law firm Arnall, Golden Gregory.

Jane Marie Pinzino. Humanities. PhD, Religious Studies, U Pennsylvania. Humanities Librarian, Tulane U and Earlham College.

Tom Kapostasy. 1978. Economics. “Determinants of Migration”. MBA, CWRU. CPA. Executive finance and operations roles.

Summary

Some serious academic work in this sample. Ten of 13 completed New College degrees and defended their senior theses. Eleven added graduate degrees, a professional certification and other post-graduate work.

We have an arts executive, therapist, librarian and home professional, somewhat aligned with the New College stereotype. But we also have an international consultant, systems engineer, lawyer, investor, lobbyist, accountant, salesman, Navy program manager and Army trainer.

New College in the 1970’s had little “wokeness” and no “indoctrination”. Given the opportunity to focus on relevant coursework, we were highly engaged in learning and building learning skills. We argued politics. The faculty made sure that we always looked at multiple perspectives. There is always “room for improvements”, but I urge the trustees to apply their critical thinking skills to the current situation.

New College of Florida: A Matter of Perspective

https://www.foxnews.com/media/ron-desantis-shakes-liberal-university-appoints-six-new-members-new-college-florida

Florida governor and presidential aspirant Ron DeSantis decided that my alma mater, 700 student New College in Sarasota, Florida needs a makeover. He appointed 6 new trustees and expressed his desire for the publicly funded liberal arts college to be overhauled to better provide for the public good and to eliminate “woke” policies, practices and culture.

New College was founded in 1964 as an alternative private college with an innovative program of study emphasizing personal responsibility for learning using all available resources without the usual bureaucratic constraints. Private New College was folded into the University of South Florida in 1975 and eventually set up as New College of Florida, branded as “the honors college” of the Florida state university system. New College’s very low student faculty ratio (7-1 to 10-1) has made it an inherently costly investment. In 2021 Florida politicians introduced bills to fold it into some other state university. A new president was hired in 2021 to help the small college re-evaluate its academic, financial and political strategies in order to re-establish its long-term viability.

The college has continued to attract very high potential students, its graduates have a truly enviable record of graduate and professional study and fellowships, but its 5-year graduation rate is low versus comparable schools and its graduates disproportionately pursue academic, not-for-profit, small business and other non-traditional career paths so that the average measured financial success of graduates is not competitive with schools which produce students who pursue more conventional professional careers.

I hope that the 6 new trustees will invest some time to analyze the “current state” before seeking to overhaul, makeover or revolutionize the curriculum, culture, faculty and leadership. I believe that there is a large overlap between what really matters at New College historically and today and what conservative leaning Florida politicians, citizens and voters value.

The Individual Matters

New College curriculum and culture emphasize the central role of the individual in making life choices.

Personal responsibility for the student’s program of study is at the heart of the curriculum.

Freedom of thought is honored. Left, Right or Center. Various shades of left.

Freedom of expression. Academic freedom. Free discussion. Free beliefs. Changes. Exploration.

Humility. Great thinkers among classmates, professors and writers. Chances are good that your views are not “simply the best”. In a post-Freudian world we only “know” so much. Many have a “piece of the truth”. Pride is risky.

Authenticity. Consistency. Self-awareness. Embracing feedback and interaction.

Ideals Matter

Ideals matter. The unexamined life is not worth living. Politics, community, philosophy, religion and spirituality matter. Dead serious. It’s important to proactively explore options and make choices. Evaluate choices versus experience, data and new frameworks, paradigms and world views. Individuals are responsible for developing personal philosophies.

Growth and Learning Matter

College provides an opportunity for tremendous learning in many dimensions. So much to learn. Consider all possibilities. Personal quest. No limits to growth. The journey matters. There is no end to growth and learning, so develop those skills. “Still there’s more”. Embrace feedback and interaction, even when it hurts.

Community Matters

Community of learners and seekers of knowledge, wisdom, truth, beauty and meaning. Small scale community where “everybody knows your name”. Forced to interact and be authentic. Academic discipline and profession matter. Generation matters. Groups matter. Politics matters. Service matters.

Character Matters

Classical philosophy focused on “living a good life”. Authenticity. Humility. Respect for others. Openness. Personal responsibility. Tolerance/acceptance of differences. Dead serious. Excellence. Merit.

Competency Matters

Demonstrated learning. The Western Canon. Mastery. Results. Achievement. Research. Critical thinking. Written expression. Debate. Progress. Examination.

Creativity Matters

“Both/and” perspective. Multiple intelligences. Multiple perspectives. Interdisciplinary views. Paradigms. Two cultures. Theory and practice. Local and global.

Founded in 1964

The post-war economic expansion was followed by a culturally conservative 1950’s and then concerns about the role of the individual in a world where big business and big government dominated. World War I and World War II shattered simplistic modern expectations of “progress”. Romanticism and utopian socialism were in decline. Cultural critics worried about the sameness of suburbia, the organization man, the man in the grey flannel suit and “the lonely crowd”. Existentialist philosophy was very influential at the time. I think that New College’s curriculum and culture were shaped by this founding period. Existentialism focused on the individual in a different way than Ayn Rand, but clearly on the individual. The key insight was that “in spite of” the challenges provided by modern knowledge and society, an individual could move forward (maybe).

The relation between the individual and various communities was a clear focus. The contrast between existential “existence” and the historical emphasis on “essence” by philosophers and religions alike was unavoidable. The “solution” was to study, learn and grow, while accepting that final, deterministic answers were very unlikely. The best a person could do was to work through life considering the conflicting viewpoints and holding on to whatever he or she thought was best. This is a fundamentally “liberal” view, even if many/most of the implications greatly support historical conservative views that aim to preserve individual character and institutions.

Unavoidable Conflicts Between New College and Modern Conservatism (The Rub)

Rejection of civil and religious authorities. Belief that the individual must choose (and live with the consequences).

Inherently a “relativistic” perspective. There are many ways to frame situations, decisions, politics, religion, etc. No one view, perspective or paradigm is clearly correct. Individuals may embrace fixed perspectives but should accept that others might make different choices.

The classic western canon of received literature and science continues to evolve. There is value in having “everyone” share in the study of “the classics” but diverse perspectives also have an important role to play.

Individuals belong to many “communities of limited liability”. The nation or church does not automatically take dominant priority.

The global community and priorities may be as important as the national and commercial perspectives.

No one deterministic religious perspective is fully adequate.

Individual “rights” compete with the community’s rights and interests.

There is an intolerance of “intolerance” by left-leaning institutions like New College and its students, faculty and leadership.

Summary

New College was founded in the early 1960’s within a culture that raised up the individual in contrast to the conformist social norms of the state, community and businesses. Yet, it was a child of the US which embraced individualism even as it promoted patriotism. The New College curriculum and culture which I experienced in the 1970’s and which largely continues today supports this individual centered model of learning and personal growth. Most of the curriculum and culture is compatible with classic conservative views. Some of the beliefs are incompatible with more fundamentalist conservative views. New College has recently become a pawn in the national “culture wars”. I hope that the trustees will see the very positive role which New College can play in helping a small share of students to wrestle with the difficult questions posed today and contribute mightily to society.

Firms and Jobs 3: It’s Complicated

The relationships between firm size, age, growth, survival, death, locations and job creation and retention are many, complex and politicized. However, the core relationships expressed in my 2 recent posts are well supported by data and theory. I’d like to share more background information.

The 10-year job survival rate for startups is roughly 80% and has improved in the last 10 years. However, the FIRM survival rate is much lower. The surviving firms, through economic natural selection, grow rapidly from a low (4 average employees) initial base.

This study of 2011-14 highlights the initial start-up job surge, followed by 10 years of net job attrition and then modest net job growth by mature firms when low firm death rates (5%) are exceeded by decent levels of net jobs added.

The Small Business Administration (SBA) reports the average firm survival rates for 1994-2019 as roughly two-thirds for 2 years, one-half for 5 years, one-third for 10 years and one-fourth for 15 years.

My review of the 10-year data confirmed the 33% rate for most of the period, with an increase to 36% for firms that began after the Great Recession in 2010-12.

https://www.chicagobooth.edu/review/surprising-numbers-behind-start-survival-rates

This post-recession improvement was widespread, across most industries.

In 2010, Kauffman Foundation researchers summarized the detailed Business Dynamics Statistics (BDS) data, showing the relatively slow decline in net added employment from 100% initially to 80% at 5 years to 70% at 15 years and the rapid decline in the surviving firms rate to one-half at 5 years, 40% at 10 years and just 20% at 25 years.

Another Kauffman report from 2010 shared similar results. The universe of firms is dominated by young firms because the cumulative attrition makes “mature” firms quite rare.

Another Kauffman report in 2009 summarizes this competition between dying firms killing jobs and surviving firms adding jobs. In the first 5 years, the firm failure rate is so high that it overwhelms the high job growth rate of those successful startups. In years 6-10, the death rate is still winning, but the total net job destruction is much smaller. For this 18-year data set, firm deaths exceed added jobs at every age, although 29+ year-old firms basically break-even. This is a critical insight when thinking about the claim that all or nearly jobs are added by startups. It is “true” due to the firm survival and jobs added rates at different ages. It is possible to have quite different results, with existing firms accounting for relatively more jobs, but that would require either the firm/establishment death rates to fall or the job creation rates of surviving firms to increase significantly. It looks like there has been some of that change after the Great Recession. This chart also helps to show that the “net, net” addition of jobs from start-ups, when considered as the sum of their first 5 years is in the 75-80% range, because the net jobs lost in those early years is only 5% per year, despite the more rapid loss of firms.

My summary of the last 30 years of data shows that startup firms do account for “all” new job growth. As others note, in a way this is almost “by definition”, because this is the only age group that only has “adds”, but no “losses”. It always must be positive. As we’ve seen in the details on job departures/hires, jobs created/lost, firms created/lost and establishments created/lost the positive and negative flows tend to be “roughly equal”. Hence, even a single year which is not burdened with an offset will stand out as the “big winner”. So, on the one hand we can discount the critical, essential, vital role of startup job creation, but we can’t ignore it. It is a necessary part of the life cycle of firms that delivers a growing economy.

The 2010 Kauffman study combined the initial jobs created with the jobs lost in the next years to emphasize the vital role of startups, using 2007 data. Mature firms also made a small contribution to jobs added.

Click to access size_age_paper_R&R_Aug_16_2011.pdf

A follow-up report in 2011 by Dr. Haltiwanger summarized the data slightly differently but tells the same story. New firms, nearly all “small”, account for almost all job growth. Other small firms destroy jobs in their first 10 years at a high rate and as mature firms at a modestly high rate. Middle-aged firms lose jobs while successful firms grow to more than 500 employees and become large firms! Young large firms add a few net jobs. Old large firms lose a small percentage of jobs for this time period (1992-2005).

The same author updated the calculation with more recent data and found the same basic results.

https://www.census.gov/library/stories/2022/02/united-states-startups-create-jobs-at-higher-rates-older-large-firms-employ-most-workers.html

The central takeaway remains valid with more recent data across industries. The initial growth of jobs is not offset by the net losses in the next 5 years. Firms more than 6 years old do not add jobs overall.

https://www.bls.gov/opub/ted/2018/over-the-last-decade-large-firms-responsible-for-48-percent-of-net-job-growth.htm

A different set of data indicates that about one-half of net jobs added come from firms with 250 or more employees.

Another analysis indicated that nearly all added jobs were at “middle market” firms rather than startups.

https://www.bizjournals.com/bizjournals/washingtonbureau/2015/04/middle-market-companies-create-most-net-new-jobs.html

I don’t know how to reconcile these competing claims but expect that the time periods chosen, and firm sizes chosen, are keys to understanding the significantly different claims.

https://www.bls.gov/spotlight/2022/business-employment-dynamics-by-age-and-size/home.htm

The most recent BLS report shows that startups and large mature firms add jobs.

In the early papers the Kauffman Foundation explains that it is new firms that drive new jobs. There is an overlap between new firms and small size that makes an analysis based on size alone appear to say that “small firms create most new jobs”; but the “newness” logically comes first. Existing small employment firms tend to shed jobs through firm death or internal job reduction.

Click to access size_age_paper_R&R_Aug_16_2011.pdf

A simple model focuses on just the first 5 years of a firm’s life after the initial startup year and defines four buckets of job growth and loss due to adding new establishments or experiencing deaths versus internal job growth (up or down) at the survivors. All four buckets matter. New establishments are infrequent for startup firms. Deaths are a major job killer. Job creating firms outweigh job losing firms. But the net gains from internal job growth is less than the drag from firm deaths.

Kauffman also created a complete theoretical model of job changes through time based on the key parameters and demonstrated that the model was a good match with the observed relative consistency of the parameters and the net output of jobs created. In a prior life, we called this the “layer cake” graph, using it to explain the composition of revenues or profits in a business based upon the year of customer contracts signed or new products introduced. At any point in time, there is a history of additions of various ages. Employment tends to decline over time based upon the combination of firm deaths, establishment gains/losses and internal job growth. Each year a new group of firms is added, all with job gains in the first year. This group too follows the pattern of job erosion in the first 5 years, smaller erosion in the next 5 years, close to break-even by age 20 and small net job creation for the mature surviving firms. Again, the parameters could be different, and the results would be different. But this framework provides economists and statisticians with the tools to analyze the components.

Another author created a dynamic model which illustrates how this process works through time.

https://www.cbpp.org/blog/startups-fuel-job-growth-animated

The Small Business Administration promotes the view that small businesses (less than 500 employees) are essential to the US economy and create a majority of all jobs. As noted above, startups are the key. Size is a byproduct.

https://bipartisanpolicy.org/blog/trends-in-new-business-creation/

In my earlier post I discounted the importance of the decline in the share of new to total firmsbecause the corresponding decline in failure rates and improved job creation by mature firms was still delivering solid annual job creation. However, this warning signal is worth monitoring together with the other measures. The Brookings Institution provides some other “warning signals” about the health of the new firm/job creating capacity of the economy in light of reduced measurable competition in many industries (a topic for another day).

Startup rates are down in most industries.

New firms account for a smaller share of total employment.

Business formation takes longer. Recent Kauffman reports shows that this trend has continued.

The entrepreneurship rate of college educated Americans has fallen most significantly.

One professor analyzed this and concluded that it was the result of American firms taking advantage of the low cost of capital and paying the higher salaries and incentives needed to attract and retain high potential employees. He says that job creation is happening more in existing firms and less in startups with no negative overall effect. He says that “marginal” (low return) entrepreneurs have been removed with little negative impact on the economy as a whole.

The slowdown in the new firm/job creation rate after the Great Recession attracted much attention from the media and politicians. Two representative articles are listed below, mostly bemoaning the decline of startups/small firms and the relative growth of large firms.

https://www.inc.com/magazine/201505/leigh-buchanan/the-vanishing-startups-in-decline.html

With the renewed emphasis on small firms and public policy to support them, others have responded by emphasizing the benefits of large firm growth and questioning the need to support/subsidize small firm growth.

https://thereader.mitpress.mit.edu/small-business-job-creation-myth/

https://hbr.org/2016/06/do-startups-really-create-lots-of-good-jobs

https://www.washingtonpost.com/business/on-small-business/who-actually-creates-jobs-start-ups-small-businesses-or-big-corporations/2013/04/24/d373ef08-ac2b-11e2-a8b9-2a63d75b5459_story.html

Using less than 250 employees to define “small business”, this article shows a 4% decline in small business share and 4% increase in large business share.

https://www.wsj.com/graphics/big-companies-get-bigger/

The Wall Street Journal reports that there are now more employees at very large (2,500+) versus small (<100) firms.

Professor Haltiwanger reports that large, mature firms have increased their share of total employees from 50% to 60% between 1992 and 2018. Both large and small young firms have lost offsetting market share.

https://www.census.gov/library/stories/2022/02/united-states-startups-create-jobs-at-higher-rates-older-large-firms-employ-most-workers.html

A recent Census Bureau article documents the increased employment share of older firms (6 years+) in many key industries.

It also highlights the increased concentration of workers in large firms in the retail, health care, accommodation and food services sectors.

The WSJ articles itemizes the increased concentration of employment in large firms in the retail, services and finance sectors and documents that these are the growing segments of the economy.

Summary (It’s Complicated)

The Business Dynamics Statistics database provides researchers with the consistently defined and reported data since 1977 to document the key role of startup firms in adding net new jobs to the US economy. Startup firms are one part of an ecosystem of firm, establishment and job creation and destruction that plays out through time in relatively predictable ways. The death rates of young, middle age and mature firms play a similarly important role. The growth and decline of new establishments in existing firms matters. The internal job growth rates of young, middle age and mature firms matter. The relatively small size of startups compared to mature firms has an impact on job growth. Historical parameters are generally similar and change slowly, causing the layers of employment by firm age to be similar in this 50-year period. The model and framework for measuring firms, establishments and jobs is solid. Startup firms are essential, but they are not the only driver of success.

“Jobs created by firm size” is similarly shaped by all of these factors which describe the typical firm life cycle. Small firms are not superior job creators. New firms are job creators, and they happen to have small individual employment levels (4 on average), so small firms have higher measured rates of job creation.

In the last 10-20 years there has been a significant decline in the rate of new firm creation as a share of total firms. New firms created have not lost as many jobs due to firm deaths in their first 5-10 years. Mature firms continued to shed a disproportionate number of jobs during recessions, but after the Great Recession began to add more net jobs due to internal growth than they had in the prior 40 years. The overall number of jobs created has remained in the 2-4 million per year range across the 50 years.

The conservative SBA, Kauffman Foundation, WSJ and Republicans promote policies to ensure a thriving entrepreneurial environment for new and small businesses. The more liberal Brookings Institute, college professors and Democrats have an instinctive distrust of big business and concentrated economic power, so also lend support to some pro-small business policies. If job creation falters during periods of economic prosperity, this may be a rare place where bipartisan agreements could be reached to promote new firm and job creation.

DeSantis’ Revolutionary Board Appointments

During 2021-22, Florida Governor Ron DeSantis appointed 29 people to various Florida state college and university boards.

They included 8 business leaders, 3 real estate professionals, 5 doctors, 3 lawyers, 2 accountants, 3 educators, a banker, a farmer, a government leader, a not-for-profit leader and a public relations leader.

The 11 news articles emphasized the nominees’ professional and civic achievements. None mentioned any strategic agenda or revolution desired by the governor.

22 men and 7 women.

Every nominee was a Florida resident, with most highlighting their long ties to the state. One was touted as a “fifth generation” Okeechobee resident. Most highlighted their Florida college degrees. A handful listed experience with national US firms or military experience. Many listed their other board of director experience. Only 3 had obvious political roles in their biographies. Dr. Madhu Sasidhar, president of Cleveland Clinic, Port St. Lucie is the only nominee with limited Florida ties.

A Revolution Only at New College of Florida

https://www.foxnews.com/media/ron-desantis-shakes-liberal-university-appoints-six-new-members-new-college-florida

The governor’s office, board nominees, journalists and advocates from both parties highlight that the 6 recent 2023 appointments to New College of Florida’s board are intended to “revolutionize” the small (700 student) college in Florida.

The governor is only revolutionizing one institution. This appears to be for national political purposes. Florida voters, visitors, alumni and politicians need to consider what their response would be if the governor, of his own accord, decided that it was time to “revolutionize” an institution that they attended or supported.

https://www.seminolestate.edu/newsroom/article/6361/governor-desantis-appoints-two-to-seminole-state-s-board-of-trustees

https://news.ufl.edu/2021/02/governor-appointed-bot-members/

https://irsc.edu/news/articles/governor_appoiints_six_to_the_irsc_district_board_of_trustees_121622.html

https://www.sjrstate.edu/press2021/21-buchanan-board.html

https://ssrnews.com/governor-desantis-appoints-three-to-the-university-of-west-florida-board-of-trustees/
https://www.gulfshorebusiness.com/gb_daily/desantis-appoints-four-to-fgcu-board-of-trustees/

https://floridant.com/dfl/governor-ron-desantis-appoints-lauran-monbarren-to-the-university-of-south-florida-board-of-trustees-floridant-10138371

New College of Florida, Founded 1956-64

https://www.heraldtribune.com/story/news/local/sarasota/2019/05/17/im-pei-left-his-mark-on-sarasotas-new-college/5142336007/

A Very “New” Educational Program for 1964

The “contract system” replaces distribution requirements. Students cooperate/negotiate with a faculty sponsor to define their “program of study”, term by term. Foreign language requirements gone. Western civilization gone. Religion gone. Humanities gone. Science gone. Each student will have a “major” in order to graduate, but the first 1-2 years can be very flexible. The student-faculty relation/interaction is essential. Starting with just 100 “high potential” 18-year-olds in 1964.

Narrative evaluations replace letter grades. Pass, fail or incomplete. Faculty try to clearly define “mastery” up front for each course, tutorial or project. Real feedback is provided in person and in writing regarding progress and “opportunities for improvement”. Faculty and students are fellow learners, but standards are high; basically elite graduate school level.

Many independent study projects are required for all students. Tutorials with significant “independent study” components are offered by faculty to cover subjects not frequently offered. Students are encouraged to ” define their program of study, including the creation of interdisciplinary majors.

A senior “honors thesis” is required for graduation. The ability to research and write at a high level is required. Students must pass an oral examination of their thesis and related “major” program of study. Quasi-graduate school for undergraduates.

https://en.wikipedia.org/wiki/New_College_of_Florida

http://www.sarasotahistoryalive.com/index.php?src=directory&srctype=detail&refno=1488&category=Articles&view=history&back=history

Economic Context Circa 1960

The US is leaving behind the pains of the 1930’s and 1940’s, enjoying more than a decade of solid economic growth. The business cycle is still very relevant. Rapid and extended post-war growth was unexpected once the economic demand of the war fell off. General economic growth into the future is now generally expected by 1964. The Keynesian economic model and policy prescriptions appear to be working. But true poverty continues in both urban and rural areas, especially among the elderly. Union-management relations remain tense, with strikes and labor actions frequently in the news.

Social Context

This is a conformist period where most individuals are willing to “go along to get along” in a world that is generally deemed positive by most. Religious attendance increases and conformist symbols on money “in God we trust” and the pledge of allegiance are adopted in the context of the Cold War. There is no 4th religious “Great Awakening”, but Pentecostal and fundamentalist churches see rapid growth. The Roman Catholic Church works through the second Vatican Conference to reform, update, reorganize and modernize the church. Mainstream Protestant churches are at the peak of their membership and influence. Liberal Paul Tillich is the representative theologian, emphasizing “matters of ultimate concern” and “the courage to be”. “Rock and Roll” music grows as an expression of teenage independence, but the “British Invasion” is yet to come. Racial justice is growing as a major topic, south and north. National and regional politicians take small steps forward on race as liberal judges take controversial larger steps ahead.

Global Context

The Cold War is topic A, B and C. The threat of nuclear war is omnipresent with students learning to “duck and cover” and citizens and communities building “bomb shelters”. Oppenheimer and other scientists who wish to “limit” further development are sidelined by the military and national leaders. Eisenhower warns about the power of the military-industrialist complex as he retires. The United Nations fills some global functions and Europe begins its long journey of integration. The US builds NATO into a strong alliance and supports the recovery of Germany, Japan and Europe through the Marshall Plan. Imperial/colonial holdings are released around the world within the context of the Cold War. Military technology continues to advance. The US is shocked by Soviet rocket, nuclear and satellite advances and invests in programs to recapture the lead. Displaced people and immigrants are resettled. Limited food production, oil availability and unlimited population growth are highlighted as a new Malthusian challenge. The pain is mostly felt in the “less developed” world, but policy elites highlight the risks. The Peace Corps is founded.

Political Context

Truman rode FDR’s goodwill to victory in 1948. Eisenhower accepted the New Deal and governed in a low-key, centrist manner for two terms. Populism and McCarthyism (nationalism) were largely eliminated in the 1950’s, but the existential threat of “Red” communism in Russia, China and its allies remained as a major political debate. Modern conservativism began with the academic scribblings of Russel Kirk (1953), the voice of William Buckley (1955) and the political moxie of Barry Goldwater and Ronald Reagan. However, John Kennedy squeaked out a narrow win over Richard Nixon in 1960 and provided that time with an idealistic, progressive, academically supported New Frontier and Camelot.

Intellectual Context

Some academics were walking away from the party line Marxism of China and the USSR by 1960 as the shortcomings of the economic, political and social systems were becoming apparent. They were very focused on the French existentialism of Sartre and Camus. In the shadow of “mutually assured destruction”, this was not surprising. The structuralism and post-modernist philosophies emerged at this time but did not quickly impact American cultural life. Universities were growing rapidly in this period, fueled by the GI Bill and the coming Baby Boom freshmen.

Public intellectuals were still a significant part of national debates about politics, technology, the economy and culture. The mainstream media provided print, radio and TV stages for public debate.

https://www.smithsonianmag.com/history/what-happened-americas-public-intellectuals-180963668/

https://magazine.nd.edu/stories/where-have-all-the-thinkers-gone/

https://lareviewofbooks.org/article/dilettantes-and-connoisseurs-the-public-intellectual-in-the-united-states/

The “popular” intellectual debate was largely focused on the eclipse of the individual versus the power of the group, whether that group was society, advertisers, corporations, neighbors, property developers or government.

https://en.wikipedia.org/wiki/The_Power_Elite

https://en.wikipedia.org/wiki/The_Organization_Man

https://en.wikipedia.org/wiki/The_Man_in_the_Gray_Flannel_Suit

https://en.wikipedia.org/wiki/The_Lonely_Crowd

https://en.wikipedia.org/wiki/Vance_Packard

Book

https://en.wikipedia.org/wiki/The_Catcher_in_the_Rye

The continued growth of science and technology as practical applied science and theory was also a major concern at this time. The split between scientists and the humanities scholars was emphasized. The changing view of “science” as a firm, fixed, objective body of work conducted by objective scientists was also called into question.

https://en.wikipedia.org/wiki/The_Two_Cultures

https://www.theguardian.com/science/2012/aug/19/thomas-kuhn-structure-scientific-revolutions

Birth of New College

The local (Sarasota and Florida) and national founders of the college were shaped by the context of the period. In hindsight, it is clear that they worried about growing “individuals” who could resist the power of the various social and organizational forces that demanded compliance. This was not a left- or right-wing political initiative. These were business, government and university elites doing their best in a patriotic American way to shape a new institution in a growing city, state and country.

60 years later, it’s not clear that these founding principles were “leaning left”. The focus was on the individual, not on the community, society, nation, state, religion, history or culture. The founders: well-minded business, religious and academic elites, emphasized this dimension of education because they believed that a simple, patriotic, conventional, practical, productive, well-defined, professional, feasible, traditional model of education was simply inadequate. It’s 1960. Two dozen successful people got together to form a new college in a resort town. They did a quick SWOT analysis (strengths, weaknesses, opportunities and threats) of colleges and universities. They chose to innovate. Let’s “reach for the moon”. We want to attract the “best and the brightest”. (Ouch).

https://en.wikipedia.org/wiki/The_Best_and_the_Brightest

College freshmen today (1960) are unduly shaped by society’s expectations. Let’s “turn them loose”. Young people are much more mature today due to their exposure to the “mass media”. They are very well educated in many high schools. Faculty and administrators are also much more highly qualified to lead the education process. Let’s fully engage them in the learning process.

This was an idealistic birth process only possible in a positive period of confident national growth.

I don’t see any incompatibility between New College’s historical educational program and associated learning environment with Florida Governor DeSantis’s stated desire to improve the critical thinking skills of students, making them less influenced by “trendy” philosophies. I believe that New College already provides a solid base in those skills. The burden of proof is on new trustees or new programs of study to better deliver the desired results.

Inflation is Slowing

Brief Analysis Below Each Chart:

Since July, overall inflation is immaterial (1%), about 2% on an annual basis.

The Services sector is the most concerning, with annual inflation still running near 6%. The recovery from the pandemic started with the goods sector and then slowly rotated into the services sector as “in person” services re-emerged.

Since March, 2022 durable goods have reassumed their long-term price Deflation.

Nondurable goods are back to 0% inflation.

Energy prices are clearly falling now.

Gas prices have retreated back to $3 per gallon as quickly as they increased.

Food prices have fallen but remain abnormally high, growing at 6% annually. Global pressures may keep this category above normal during 2023.

Wage-push inflation remains a thing of the past. Real wages remain flat.

Strong economies with solid currencies are able to import cheaper goods and reduce domestic inflation.

Producer prices have fallen by 6% from their peak.

US fiscal policy for 2022 was at the same expansionary level as pre-pandemic 2019. I think it was a little too expansionary, but this level of deficit did not significantly drive the increased inflation in 2022. The budget deficit for fiscal year ending September, 2023 is expected to increase by a small amount, even though the latest official CBO forecast showed a smaller deficit.

https://www.cbo.gov/publication/58470

Monetary policy was very loose in 2020, attempting to offset the many threats to the economy. It has since been closer to “neutral”. There is no solid historical or theoretical basis to carefully predict the effect of this huge increase in the money supply two and a half years later.

The Federal Reserve Bank has increased interest rates and the housing, stocks, bonds, construction and commercial investment markets have been impacted, slowing aggregate demand for assets, goods and services.

https://www.federalreserve.gov/econres/notes/feds-notes/excess-savings-during-the-covid-19-pandemic-20221021.html#:~:text=By%20the%20third%20quarter%20of,%241.7%20trillion%20by%20mid%2D2022.

The stock of “excess savings” which supported the rapid recovery from the pandemic peaked in early 2021 at $2.25T. It had fallen by 20% to $1.75B by the 3rd quarter of 2022 and continues to fall, reducing aggregate demand.

Summary

The scariest inflation scenarios are no longer plausible. Durable goods, nondurable goods, producer and energy prices are falling. Food and services prices remain elevated at 6% but are not in double digits and are not increasing. Real wages spiked briefly during the heart of the pandemic but quickly returned to pre-pandemic levels where they have remained.

The federal budget deficit in 2022 was the same as in 2019 when inflation remained low. Even with a slowing economy, the forecast 2023 budget deficit remains about the same as in 2022, not adding materially to excess demand. Monetary policy in 2022 has consistently been tighter and tighter, with the Federal Reserve chairman promising to “do whatever it takes” and highlighting the much greater negative consequences of inflation that does not return to the target level. Weakened fiscal and monetary policy should help to further reduce any remaining supply chain constraints in the global economy. The housing and capital investment sectors are declining. The impacts of changed monetary and fiscal policies are seen 6-24 months later.

Double-digit and accelerating inflation are no longer credible. Deflation is the rule in a large part of the US economy. Monetary and fiscal policies are tightening. Overall inflation is falling. The economy has already slowed, so we may even be entering a period of self-reinforcing lower rates of inflation.

2022 US Election Participation Rates: Fair

Record High Voting Rates in 2018 and 2022

2018 and 2022 elections showed widespread increased voter participation. Increases were seen by all races, genders, income, ages, states and education levels. Increased voting by the youngest age group and Hispanic Americans were most notable.

2022 Voting Higher than Recent Decades, but Lower than Record 2018 and 2022

https://www.washingtonpost.com/politics/interactive/2022/voter-turnout-2022-by-state/

Complete detailed breakdowns are not yet available.

https://www.washingtonpost.com/politics/interactive/2022/voter-turnout-2022-by-state/

Only 8 of 50 states had increased voter participation versus 2018.

https://www.statista.com/statistics/1184621/presidential-election-voter-turnout-rate-state/

https://circle.tufts.edu/latest-research/millions-youth-cast-ballots-decide-key-2022-races

https://circle.tufts.edu/latest-research/half-youth-voted-2020-11-point-increase-2016

Young-adult voting remained above history, but less than the record 2018 performance.

Alternative/Early Voting Remains High

https://www.usnews.com/news/articles/2022-11-04/early-vote-totals-point-toward-record-breaking-turnout-for-midterm-elections

https://www.axios.com/2022/10/22/2022-midterms-early-voter-turnout-numbers-2018

https://www.cnn.com/2022/10/20/politics/voter-turnout-analysis

The 2020 and 2022 elections both relied heavily upon mail-in and early voting options. Early voting participation, especially in competitive states, was equal to or ahead of 2018. Hence, election day participation in 2022 was somewhat lower than in the record year.

Voter Registration is as Important as Participation

https://www.census.gov/library/visualizations/2020/comm/participation-congress-election.html

Voter registration in the states with party-preference records increased from 108 million in 2017 to 117 million in 2021 and then a little to 120 million in 2022. Registrations have increased a little faster than voting age population, but have not made a material difference.

https://ballotpedia.org/Partisan_affiliations_of_registered_voters

The Democratic party share has declined significantly in the last 2 decades, replaced by “independent” voters. The Republican party share has declined by just 3%.

Voting Rules Encourage and Discourage Voting

https://www.bbc.com/news/60309566

https://graphics.reuters.com/USA-ELECTION/VOTING-RESTRICTIONS/znvnbdjbkvl/index.html

Good data on the impact of various voting law changes is not yet available. Anecdotal media reporting of the 2022 election did not indicate extremely large changes in voter behavior.

US Registration and Net Participation is Low versus other Advanced Economies

Summary

Voting participation in the US varies significantly by gender, race, age, state, income and education level. It recovered to some degree in 2018-22 following a 40-year low period. Voter registration has increased by a small amount in the last 10 years, but increased participation among registered voters has been the driver of overall results. The availability of mail-in and expanded early voting clearly boosted turn-out in 2020 and 2022. The impact of additional voting restrictions is unclear, but obviously intended to reduce turnout. Polarized politics in the US has increasing voter turnout, but only by 10-15% versus recent history. Presidential years boost turnout by 15%. State by state participation in election years ranges from 58% to 76% (excluding a few extremes), based on habits, demography and state laws. Presidential elections could have 10% higher participation if all states followed the examples of the high participation states.

Government has an increased impact on all citizens. Democracy requires participation to make the decisions and programs of governments (at all levels) legitimate. The US can do better.

A Very Responsive US Labor Market: 1970 – 2021

https://www.staffordschools.net/Page/20853

This is a follow-up article to my recent post on “A Very Robust Long-term US Labor Market (1970-2021). Rather than focus on total growth or the “skill-level” of jobs in the labor market, I want to focus on the roles or functions (like career clusters, similar to industries) played by the 150 million US workers in 2021. I’ve grouped the 500 detailed occupations into 17 categories so that we can look at subtotals ranging from 1% to 20% of the total, with an average of 16%. Enough detail to highlight the very significant changes in the last half-century.

Let’s start with the 1970 data. 75 million employees. Manufacturing was the “big dog”, with almost 14 million workers, 18% of the total, a little less than one out of five.

Administrative workers, including clerical, HR and accounting staff at all job levels were the second largest group, with 10 million people and 13% of the total, one out of eight jobs. These two traditional categories accounted for 31% of the total, not quite one-third.

The next three groups each accounted for 9% of the total, one of every eleven employees. Sales workers, at managerial, professional and retail/clerical levels. Members of the logistics industry broadly defined, including both transportation and distribution staff. Employees of the construction industry. Once again, classic job functions in 1970 that would have been familiar in 1930.

The narrowly defined “service sector”, combining staff in the food service, travel and personal services industries contained 5.5 million workers, or 7% of the total. These six together included 70% of all workers.

Six other categories were each a much smaller 4-5% of the total: Education (KG-post secondary), Cleaning and Groundskeeping, Health Care, Analysis (finance, IT, operations, engineering and marketing), Ag/Mining and Repair/Installation/Maintenance.

The final five categories each averaged just 1.5% of total jobs: Finance/Insurance/Real Estate, Managers/Supervisors, Protection/Legal, Entertainment/Arts and Relating/Counselors.

By 1970 production agriculture had already declined to an immaterial share of the economy. The historically male and blue collar dominated Manufacturing, Logistics, Construction and Repair categories combined to account for 40% of all jobs; two out of five. The historically more female friendly Administration and Sales functions held 25% of all jobs, one in four. Education was the largest “information industry” at 5%, largely dominated by traditional elementary and secondary school teachers. A more broadly defined service group of food service, travel, personal service, cleaning/grounds and health care summed to 17% of the total, or one in six jobs.

Six categories changed very significantly between 1970 and 2021. Manufacturing dropped from first place to tenth place, from 18% to just 5% of employment, from 14 to 8 million employees. US firms improved labor and overall productivity throughout this period, keeping the most productive firms and factories open, while closing and outsourcing work from the others. This was a tremendous change in the labor market, completed in just two generations of workers.

The Administrative category also declined markedly, from second place to fifth place, shrinking from 13% to less than 9% of total employment, but increasing slightly from 10 to 13 million staff. Process, computer and telecom changes drove improved productivity. Some administrative jobs were outsourced. While the Manufacturing sector lost two-thirds of its labor market share, the Administrative sector lost one-third.

The Ag/Mining group was the third losing category, dropping by nearly two-thirds from 3.9% to 1.4% of all employment. When politicians talk about “reviving” manufacturing, mining or production agriculture they are working against very strong long-term trends.

The largest growth was in the “Analysis” category, which grew by two and one-half times as a share of the total, from 4% to 10%. There was incremental growth in the existing Engineering sub-category, adding 2 million roles. The IT category grew added almost 6 million roles from a base near zero. The operations, finance, marketing analysis group added another 6 million positions to its base of 1.5 million. The “Analysts” category rose from tenth place to first place as firms became more complex and found ways to better employ the talents of individuals with high level analytical skills. At 11% of the economy, one out of every nine jobs falls into the analysis category.

Health Care increased from ninth place to second place, moving from 4.4% to 10.3% of all jobs (2.5X). The number of jobs grew by 13 million, from 3 to 16 million.

The Managers/Supervisors category climbed from fourteenth to ninth place, rising from 1.8% to 5.2% of the economy, adding almost 7 million jobs. The 1970 detailed coding was somewhat different from the modern approach, with many supervisors and managers grouped with other professions or industries. My best guess is that on a comparable basis, the 1970 category would have been closer to 2.5 million than the reported 1.4 million managers and supervisors. This would have put this group in thirteenth place in 1970. Hence, the growth as a share of the total market would be smaller, from 3.3% to 5.2%, but still quite significant. Once again, larger firms with more complexity demanded more managers and supervisors.

In total, we have 20% (1/5 workers) leaving the Manufacturing, Administration and Ag/Mining sectors and 16% (1/6 workers) joining the Analysis, Health Care and Managers sectors.

Comparing the millions of employees in 1970 to 2021 by sector clearly shows the massive changes in the labor market. The Health Care and Analysis sectors leapt from a small 3 million workers each to 16 million workers each. Manufacturing fell in absolute terms from 14 to 8 million workers. The Sales and Service sectors began as large sectors, so their relatively normal growth still added about 8 million roles each. Construction and Administration began as larger sectors and were able to add 3 million employees each, despite slower than average growth rates. Logistics grew slightly slower than the market, but added 6 million workers. Education grew faster than average, adding 6 million colleagues.

Relative growth rates as a percentage of the 1970 base or as a percentage of the total mostly tell the same story. Manufacturing, Administration and Ag/Mining have declined sharply. Analysis, Health Care and Management have grown materially.

The 152 largest detailed occupations and those with the greatest change in employment are documented below. They account for 91 million jobs, 59% of the 2021 total.

https://view.officeapps.live.com/op/view.aspx?src=https%3A%2F%2Fwww.bls.gov%2Fcps%2Fcpsaat11.xlsx&wdOrigin=BROWSELINK

Summary

Economists assert that the principles of comparative advantage drive national economic activity. In essence, nations, firms and individuals rationally do what they are “relatively” best at, which changes through time. We see this reduction in the role of agriculture, manufacturing and mining across long periods in the US.

Economists assert that consumers’ tastes change as they have higher income and the relative prices of goods change. Once basic “food, clothing and shelter” needs are met, people turn to other “needs” and “wants”. These tend to be “services” and we also see this transformation.

Economists assert that profit maximizing firms will employ labor that provides a return on the investment based on the marginal or incremental value added by the labor resource. In a more complex economy, professional and managerial skills are in greater demand. Firms (and not-for-profits and governments) have adapted very well to these major changes in the last 50 years.

These changes are not without major pain to individuals, firms and local economies. The general trends in the economy (more automation, greater trade/outsourcing, more services, more personal care, greater role for analytical skills) are clear. Nations, firms, individuals and regions that adapt to the trends will be relatively successful. This requires wise individual and political choices and investments.

Appendix: Other Reference Articles/Sources

https://www.bls.gov/oes/current/area_emp_chart/area_emp_chart.htm

https://stacker.com/stories/3487/most-common-jobs-america

https://stacker.com/stories/3494/most-common-jobs-america-100-years-ago

https://www.usatoday.com/story/money/business/2014/04/28/americas-most-and-least-common-jobs/8285441/

https://billshander.com/dataviz/occupations/

https://www.bls.gov/cps/cpsaat09.htm

https://www.bls.gov/cps/cpsaat11.htm

https://www.dol.gov/agencies/wb/data/occupations-decades-100