

Background
Most states and local governments have chosen to pay their employees less than market salaries and higher than market fringe benefits since the WW II era. The Republican focus on reducing the size, pay and power of government has increased significantly in the post-Reagan era. Grover Norquist summarized this in 2001: “I don’t want to abolish government. I simply want to reduce it to the size where I can drag it into the bathroom and drown it in the bathtub.” Hence, Republicans have focused the spotlight on the “underfunded” status of state and local government fringe benefit plans, especially defined benefit pension plans.
Although the rhetoric is sometimes grating to the “left” ear, this spotlight does serve as a disinfectant, requiring political leaders to be more accountable for their decisions, especially in “one party” states where accountability was lacking historically.
On the other hand, pension accounting, funding, goals and policies are inherently complex and difficult to simply summarize or explain. This is true for both government and corporate defined benefit pension plans. It is easy to “cherry pick” pension statistics and overexaggerate the “crisis” in state pensions.
I will focus on the data and commentary from just 2 sources: Reason.org, a right-leaning policy group that cleverly adopted a left-side name and Pew Research, a centrist research group that has chosen to emphasize right-leaning data and commentary on this topic.
Current (2021) Good News
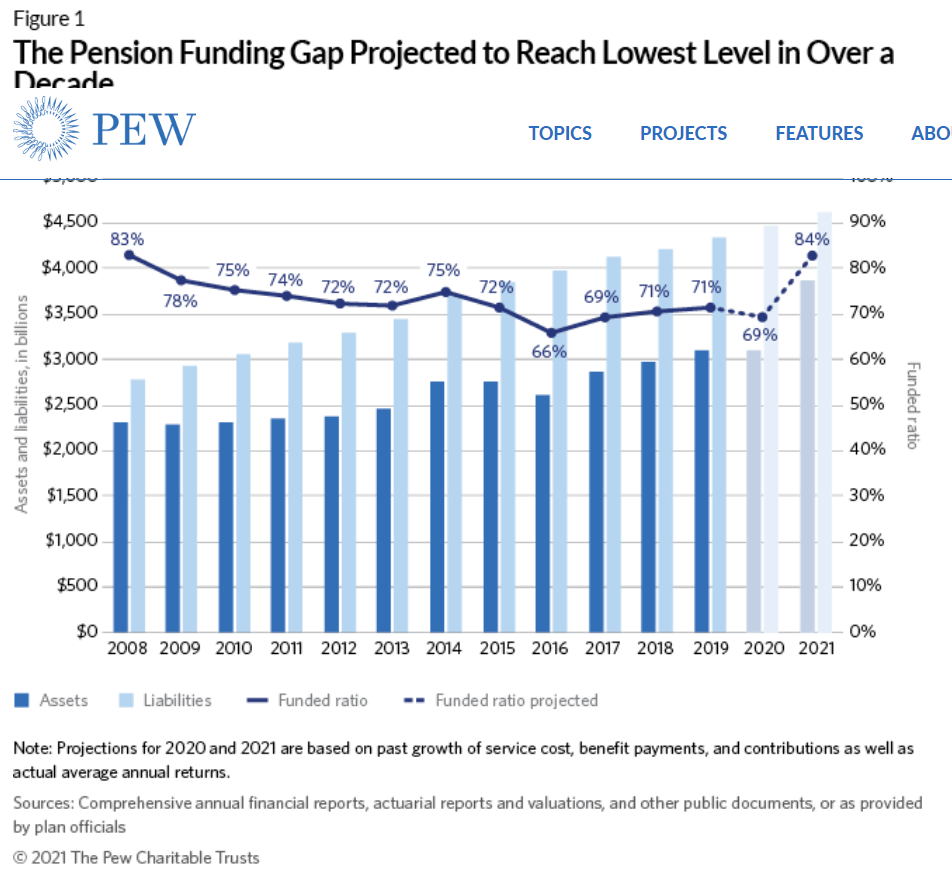
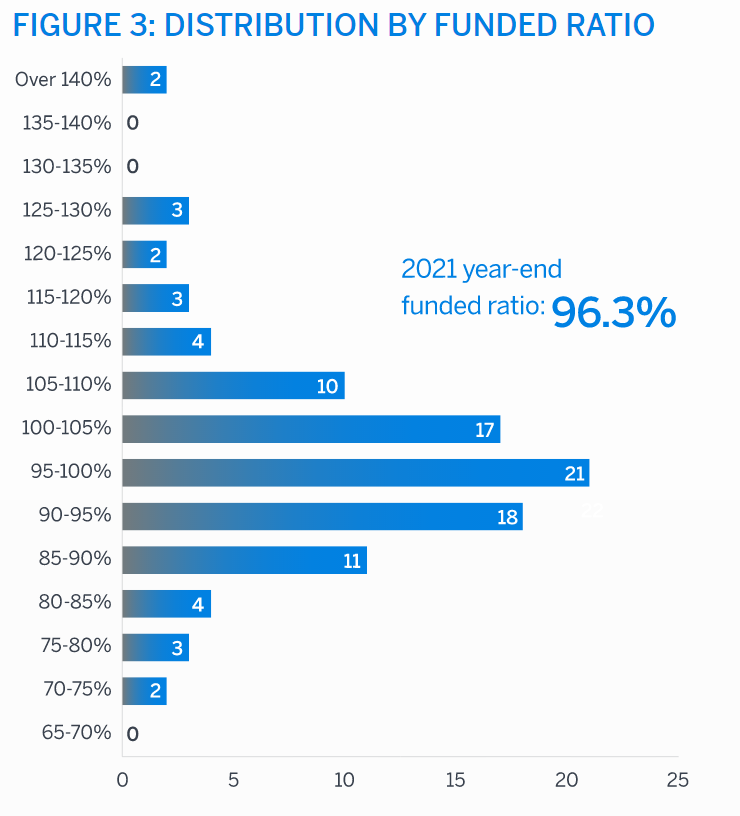
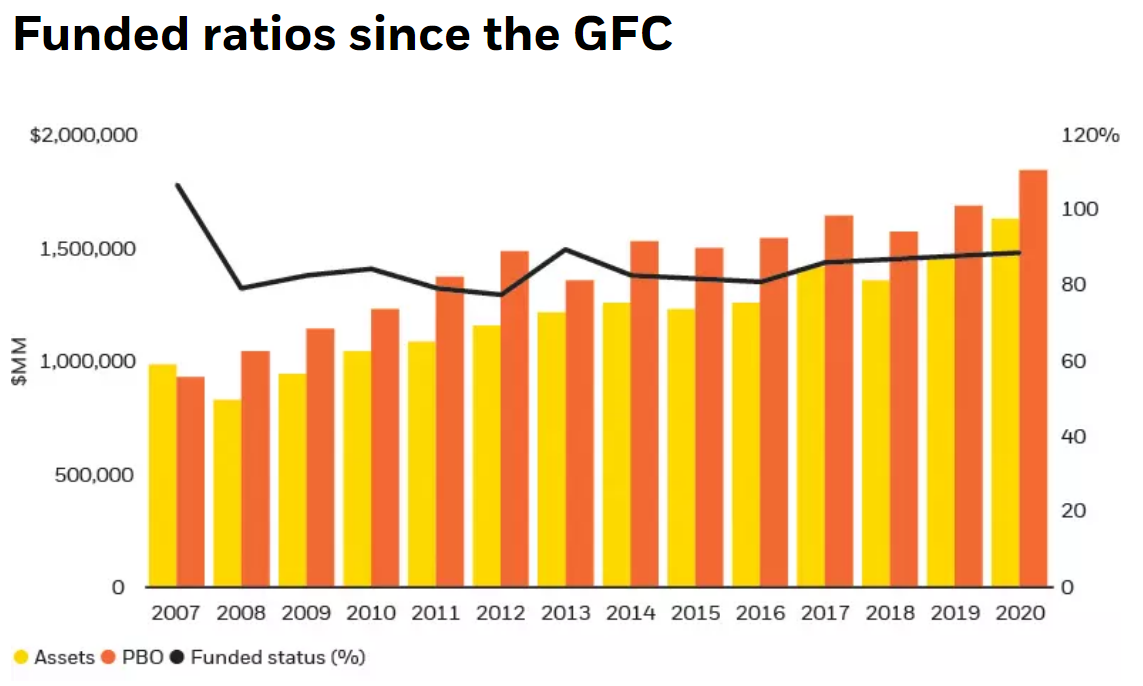
- The average state pension plan funding level, the ratio of assets to forecast liabilities, is expected to reach 84% when final 2021 data is summarized. This is a huge improvement from the 70% average of the prior 5 years. It is the highest level since 2008.
2. The system is working. Plan assets were $2.3T versus $2.8T in 2008. Assets grew by $1.5T to $3.8T, while liabilities grew by $1.8T to $4.6T. Since the added $1.5T/$1.8T is 5/6ths or 86%, the overall ratio increased. The “system” of policies, accounting, audits, contributions, investment strategies and actual investment returns, etc. appears to be functional across a quite challenging economic period. The funding ratio was relatively consistent throughout this period, even if it was not at the 100% level highlighted by some as “the goal”.
3. The gap between estimated liabilities and funded assets is less than $1T for the first time since 2014.
4. For the first time in this time period, the minimum expected funding level has been met. This is defined as a year in which contributions exceed benefits plus the “amortized” funding requirements based on past funding shortfalls. In 2014 only 17 states met this standard. In 2019, 35 states complied. Again, this is not perfection, but it is significant progress.

5. Overall contributions have increased by 8% annually. The states with the lowest funding ratios have increased their contributions even faster. The lowest 10 rated states growing by 15% annually and the 4 worst states by 16%.
6. A measure of benefits paid minus funding contributions, as a percentage of plan assets, has improved from 3% more benefits to 2.5% more benefits paid versus new funding contributions.

Historical Commentary
The Trillion Dollar Gap (2010)
https://www.pewtrusts.org/en/research-and-analysis/reports/2010/02/10/the-trillion-dollar-gap
The Funding Gap (2016). Funding ratio 66%. Few states reach 90%.

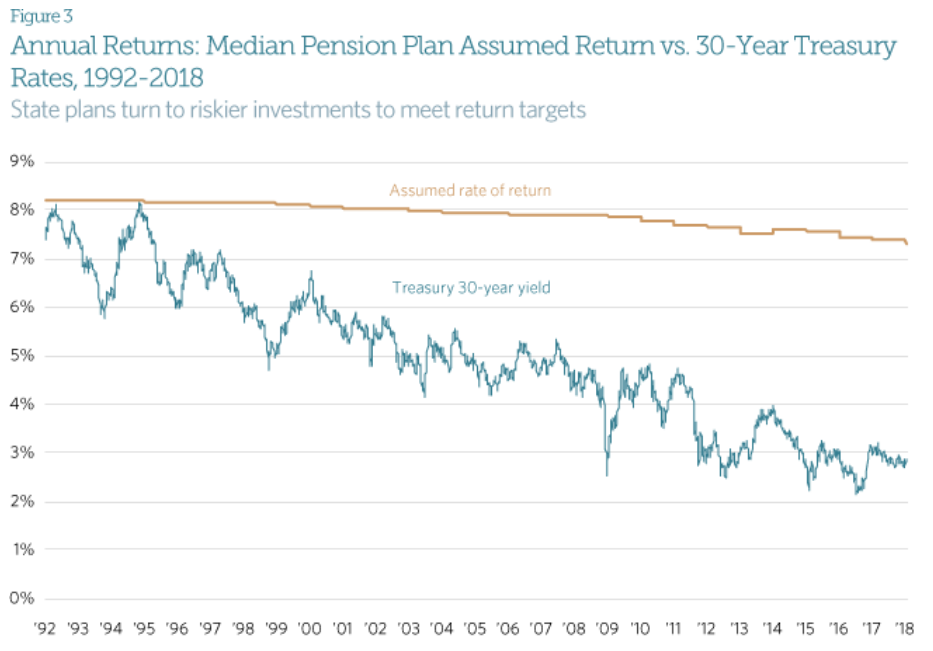
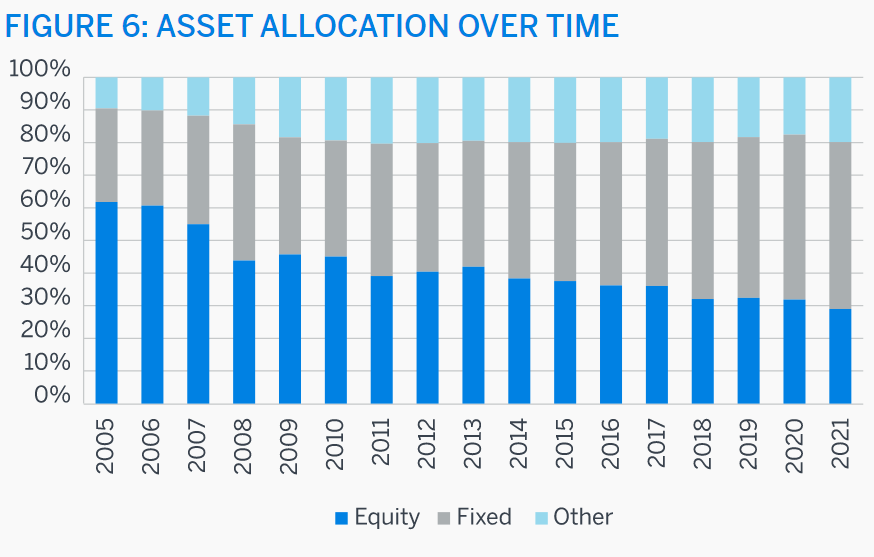
Bond interest rates have fallen faster than pension plan expected returns. Of course, because equity returns are much higher, more volatile, difficult to forecast and a higher share of plan assets.
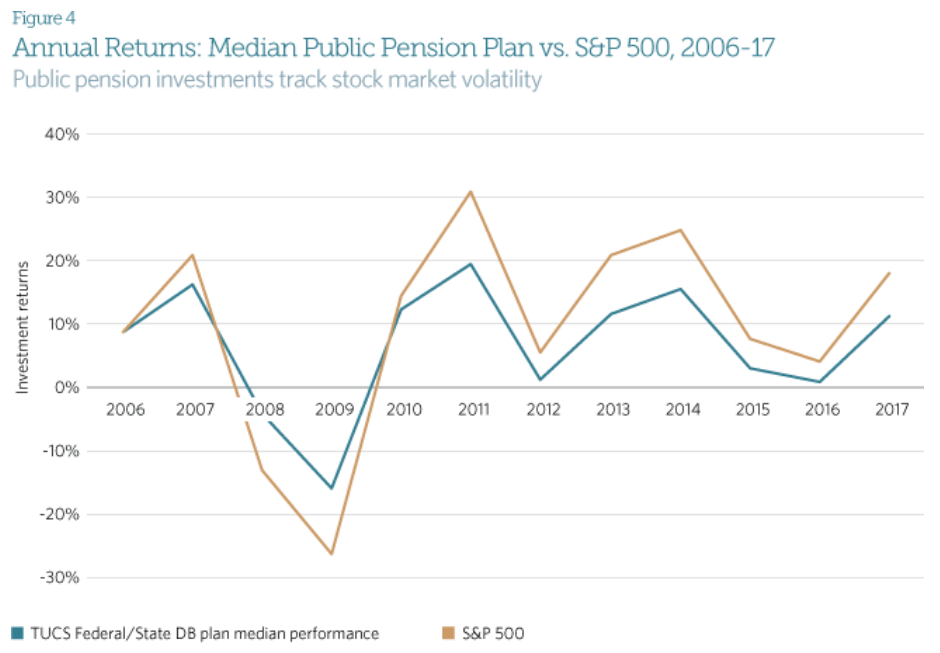
State pension plan returns trail the S&P 500 returns. Of course, because plans hold significant (30-40-50%) in lower yielding bonds.
A lower “discount rate”, the assumed future interest rate used to calculate the present value of future pension benefits/liabilities, will increase current liabilities and the current net liability. Yes, this is how discounting works. As market interest rates and stock returns have been reduced with lower inflation rates, the discount rate used by financial professionals in all applications has slowly declined for the last 20 years. This “sensitivity analysis” is misleading. The sensitivity of present liabilities is inherent, it cannot be avoided.

Some states have amortization rates, the amount of new contributions required to eventually offset prior funding or investment return shortages, that are quite high compared to their annual payrolls. This is true. 7 are above 5% deficits, but 7 are above 5% surpluses.

Pew highlights what they call the “operating cash flow” ratio as another sign of trouble. Contributions minus benefits paid as a ratio to assets is the definition. The result is negative!!!! And increasing to negative 3%! Contributions should almost always be less than benefits paid in a long-term (20-30-40 year) pension plan because the plan trustees assume that there will be some positive return on plan assets. Given a 2/1 equity to debt mix, with 7% to 3% expected returns, the expected plan return is more than 5%, so a 3% “negative” return is not a concern. The insurance industry operates in the same way with “negative” operating ratios being offset by investment returns.

Reason.org Graphics
This group highlights the extraordinary 100% ratio in 2001 versus the more normal ratios of 82% in 2005, the quite low level of 66% in 2012 and the still below average 74% level in 2019. They provide state by state graphics to highlight the decline since the very high 2001 baseline and to emphasize the count of states that are below 90%, 80% and 60% “funded”.
Their websites do not allow their graphs to be linked/captured.
Reason.org breaks 2 rules. First, they implicitly assume that a 100% funding level is the “obvious” goal. That is untrue. Historically, US corporations and actuaries considered 80% to be a “fully funded” target. More was better. A little less was worth watching (70-75%). Much lower required increased focus and contributions. Due to the inherent uncertainties in investment returns and participant assumptions (lifespan, retirement dates, turnover, average salaries, etc.) short-term movements of 2-3-5% were never considered to be an issue. Long-term or persistent ratios significantly below 80% were considered to be a concern.
Second, they assume that all states will perform at the same level. The “laws” of probability prohibit this “ideal” result. In a normally shaped (bell curve) probability distribution, there will always be underperforming and overperforming states. This is inherent in a multiple probability-based system. Of course, if a state remains at the bottom of the funded percentage list for more than 5 years, it probably does have a challenge to face.
Pew Emphasizes Risks in 2021
- Greater state pension contributions have “crowded out” other spending and reduced states’ ability to respond to emergencies. Well, you can’t have it “both ways”. States have responded to the shortfalls highlighted since 2000 with greater contributions. This has improved the funding level despite the Great Recession, the slow recovery and the pandemic challenge.
- The recent funding level improvement is due to a “one-time” stock market return in 2021. Yes, stock market returns, both gains and losses, are volatile. That is why pension plans use long-term expected returns for stocks and bonds. That is why pension funds use longer time periods (10 years) to amortize the annually calculated gains or losses into the “required” contributions. Yes, a significant part of the increase from 70% to 84% funded is a short-term increase of investment returns, and probably unsustainable.
- The stock market is volatile. Recently. Yes, a once in a century pandemic drives increased volatility. Stock market volatility through time and across markets is well understood as a probability function with mean expected real percentage returns and a predictable range of returns volatility. All investors face this volatility and manage portfolios accordingly. As state pension plans have grown in value, they have been able to hire competent investment advisors.

4. Economic growth is slowing. Some assert this. Others disagree.
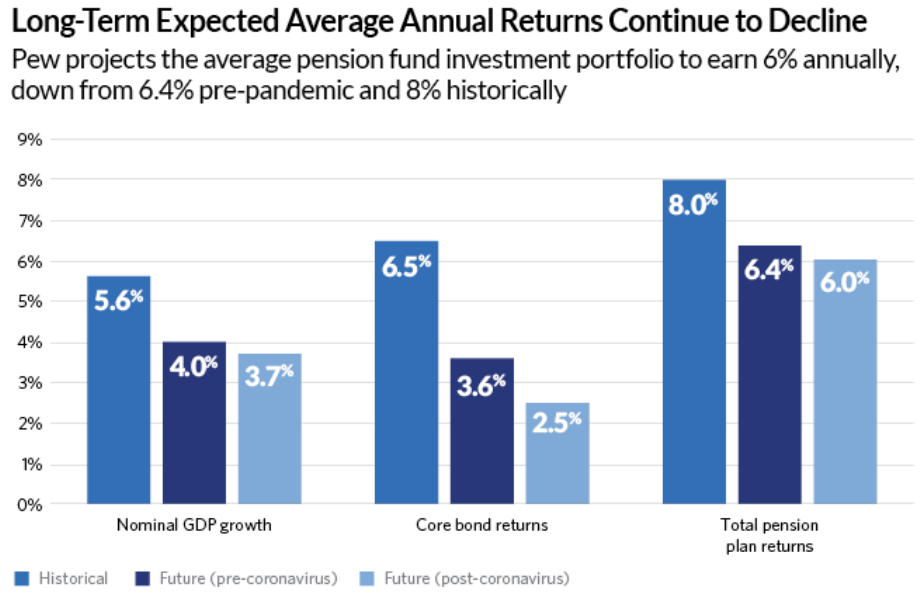
5. Future stock and bond returns will be lower, per Pew. The long-term decline in inflation does drive investment returns lower. The increased efficiency of financial markets, including global investment flows, also drives returns lower. However, pension plans have reduced their expected annual returns. Recent stock market volatility indicates that equity returns may not decline.
6. Increased funding of underfunded pension plans can be portrayed as “increased spending”, rather than the required adjustments for those plans which had historically lower investment returns, contributions or higher ultimate benefits.
Summary
State and local governments are faced with managing inherently variable pension plan decisions. They have choices to make about plan policies, goals, funding, investment policies, audits, advisors, etc. An 80% funded level goal (not 100%) is supported by 100 years of experience around the globe, in public, private and not for profit sectors. The increased publicity/focus on underperforming states and municipalities has forced these public bodies to make tough choices regarding defined benefit versus defined contribution plans, benefit levels, retirement ages, investment policies and advisors. Following the Great Recession, states struggled to increase their funding, but they did not allow the average funding level to fall below 70% for more than a year at a time. On a cumulative basis, they have increased their contributions, reduced benefits and captured the long-run benefits of equity investments.
The increased scrutiny of funding levels in state and local government defined benefit pension plans has forced elected officials and their professional advisors to address shortfalls in pension funding. This is very good news.


