
The Indy Metro Area is comprised of Marion County plus the 7 surrounding “donut” counties. Marion has grown throughout the half-century, adding 175,000 people (22%). Rural Morgan and Shelby counties have not grown much. Hancock, Boone and Johnson counties have doubled their populations. Hendricks has grown from 50,000 to 175,000. Hamilton has grown exponentially from 50,000 to 350,000. This relatively rapid growth has made the metro area grow from 21% to 28% of the state total, adding state senators and representatives and causing increasing tensions between the one large, growing area and the slower growing, largely rural, rest of the state. There are suburban Chicago, Louisville and Cincinnati counties that have shown decent percentage growth, but they are a small share of the state. Lake County (Gary) is a special case, declining in population decade after decade.

The Indy Metro counties started 1970 with slightly higher per capita personal incomes, so the share of the state total was 24%, a bit above the 21% population share. By 2020, the Indy Metro area had captured one-third of the state’s personal income (34%), much higher than its 28% share of the population. Per capita incomes and population had both grown in the capital region.
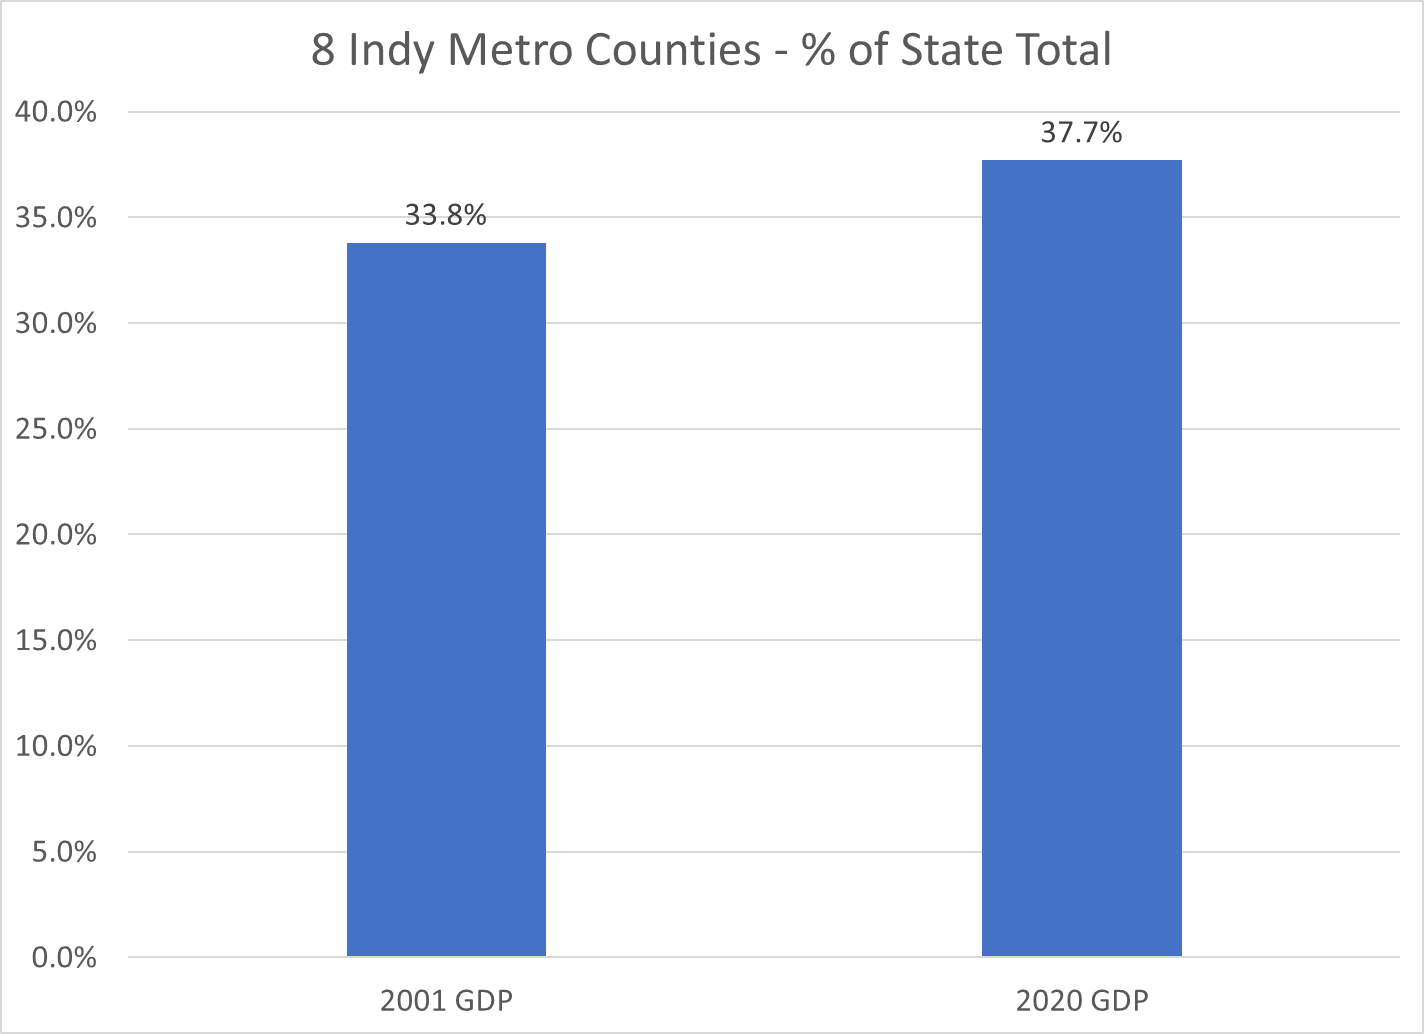
Gross Domestic Product, the value of goods and services produced in Metro Indy, was one-third of the state total in 2001, the first year of available statistics. This measure increased to 38% by 2020. Nearly 2 out of every 5 dollars of statewide value-added output was generated by the Indy Metro area in 2020.

Indiana is a mostly rural state with Indy, a dozen small cities, a cluster of northern Indiana manufacturing counties, Gary (Lake County), Ft. Wayne (Allen) and Evansville (Vanderburgh). The Indy Metro Region has 9 times the density of people, income and production as the most rural counties. For example, it takes the 67 lowest population counties to equal the 1.9 million people living in the Indy Metro area.

The Indianapolis Metro area grew by a respectable 72% during this period, above the national average of 63%. The other Indiana counties grew by only 19%, about one-fourth as fast.

The Indy Metro area added 900,000 people, the same growth as the rest of the state.

With population and per capita income gains, the Indy Metro area’s real personal income grew almost four-fold, while the rest of the state grew by roughly 150%.

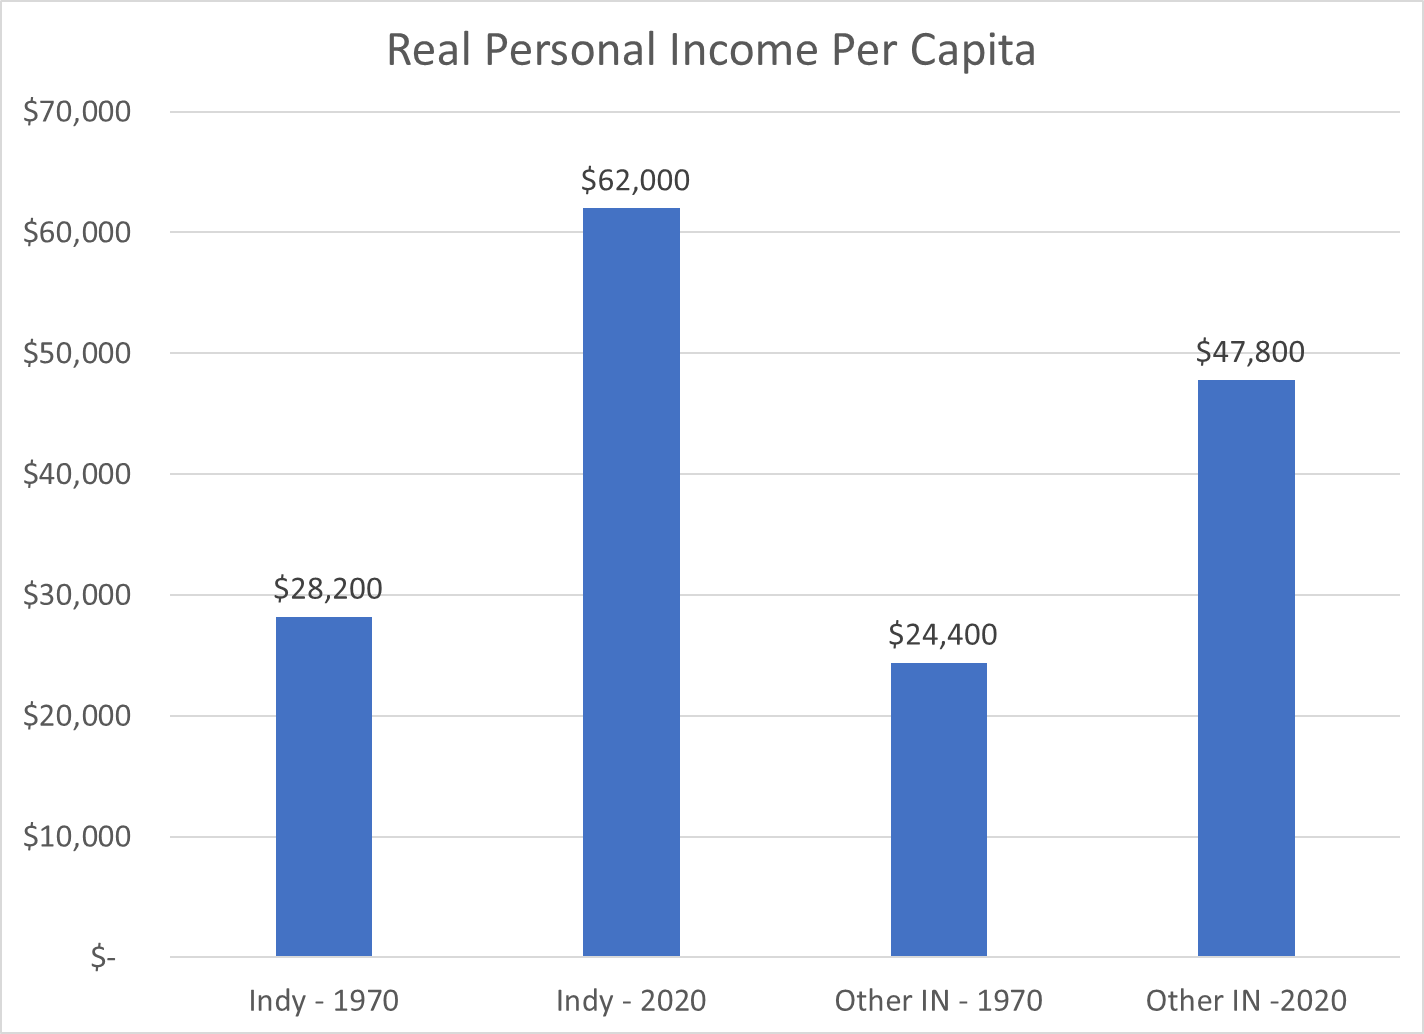
Indy Metro per capita income was 15% above the rest of the state in 1970 and twice as high (30%) by 2020.
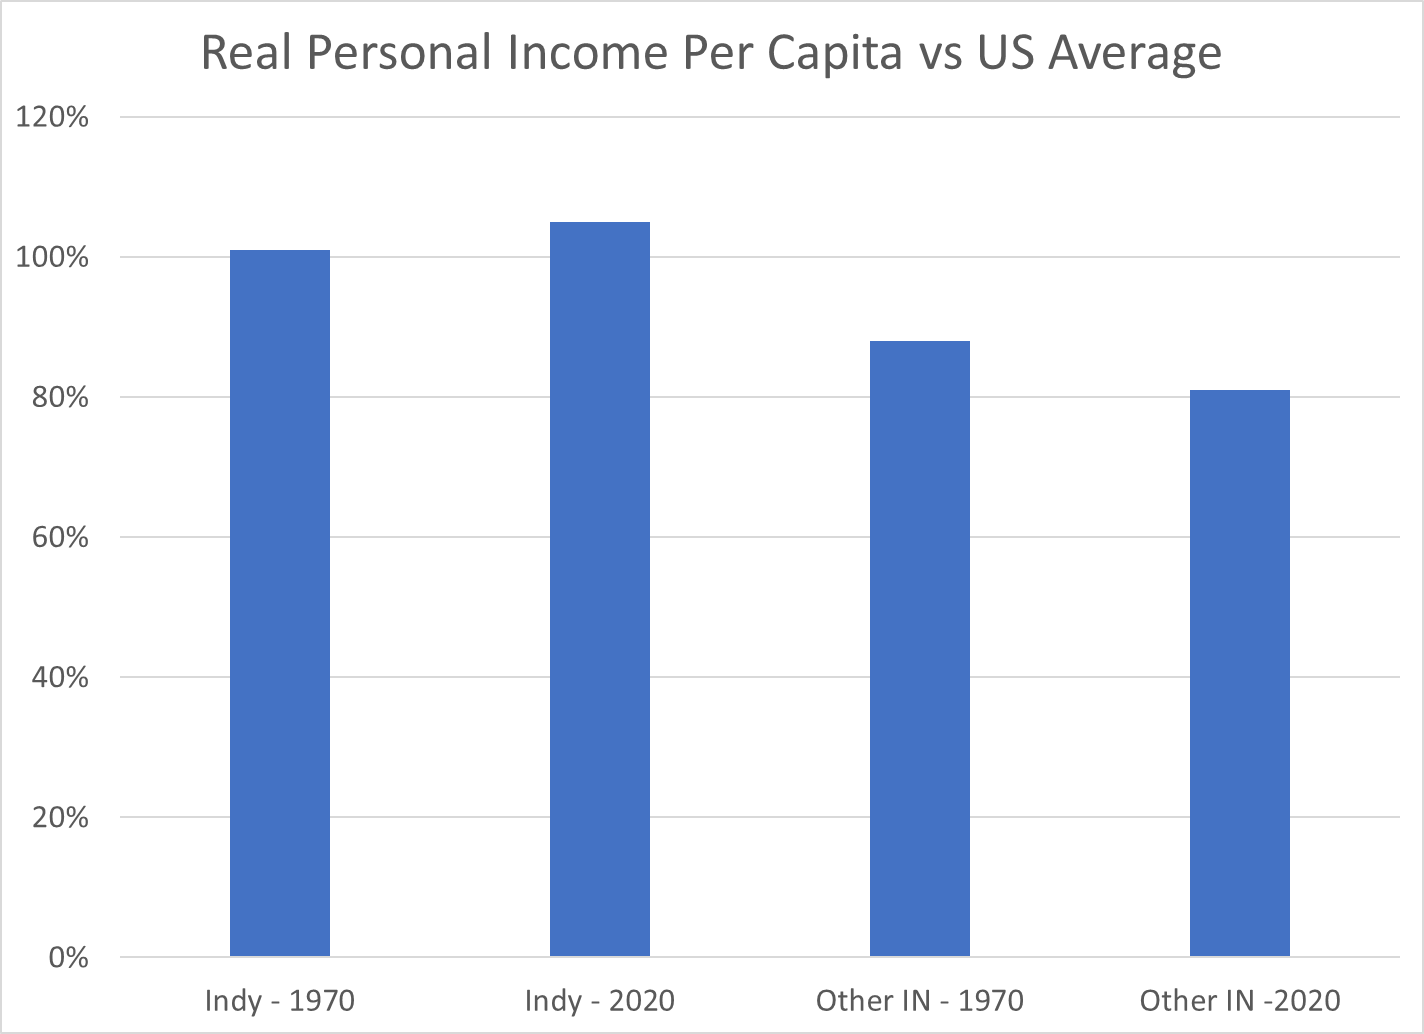
The Indy Metro area has improved its per capita income versus the US average by 4 points, from 101 to 105. The other-Indiana counties have declined from 88% to 81% of the national average.

While the per capita income in the Indy Metro area is 30% higher than the rest of the state, the value of goods and services produced (GDP) per person is more than 50% higher than the rest of the state.
These wide, and growing, disparities in economic results may lead to increasing tensions between the relatively prosperous center and the largely “left behind” periphery. Fortunately, the real personal income per capita in the “other” counties did increase by 95%, from 24 to 48K during these 5 decades, even though the Indy folk’s income grew by 120%, from 28 to 62K.
https://www.stats.indiana.edu/population/PopTotals/historic_counts_counties.asp