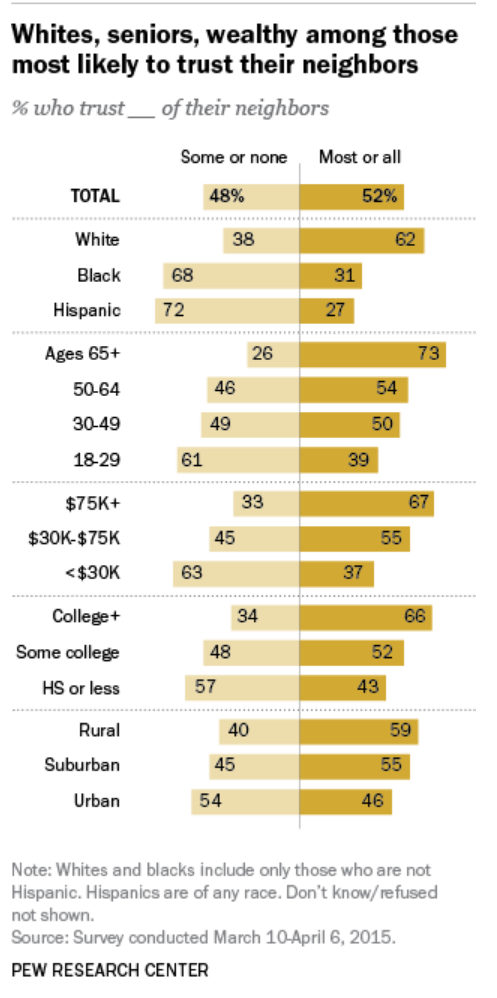
The US Bureau of Justice recently revised its definitions of urban, suburban and rural locations. The rural violent crime rate appears to be 20-25% lower than the urban crime rate. Note that rural property crime rates are 60% lower than urban rates.
Rural Versus Urban Violent Crime Trends
I’m not finding any consistent long-term “rural versus urban” crime rate statistics. As a substitute, I’m comparing the 15 most rural states versus the 15 most urban states based upon the “538” definition.
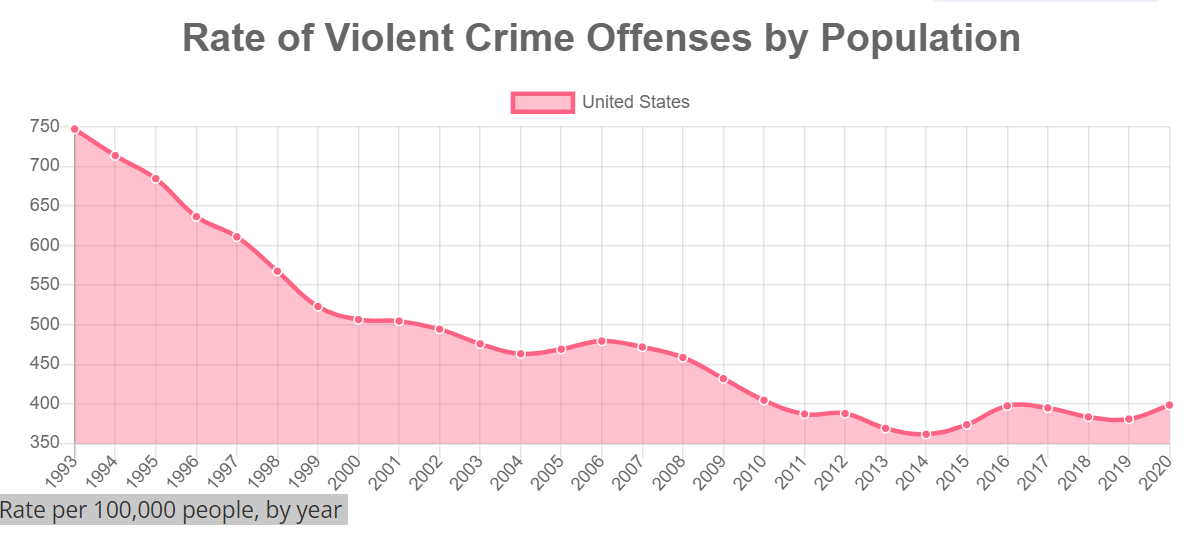
I’m choosing to focus on 2000-2010-2020 to simplify the analysis. Crime rates were dropping “like a rock” from 1993-2000 everywhere (see above).
The total US violent crime rate dropped by an additional 22% from 2000 to 2010. It was flat between 2010 and 2020.
15 Urban States
The 15 most “urban” states averaged 508 events/100,000 people in 2000, above the national average. This group dropped by 19% in the first decade to 413 incidents per 100K people. This subset of states continued its downward trend by 13% in the next decade, reaching 361 reported violent crimes per 100K in 2020. At 361 incidents, these 15 relatively urban states had a violent crime rate 10% below the national average of 400.
Urban 15: WA, PA, CO, TX, AZ, CT, FL, IL, MD, RI, NV, MA, CA, NJ, NY.
The greatest reductions in violent crime rates in these “urban” states occurred in Florida, Maryland, New Jersey and Connecticut.
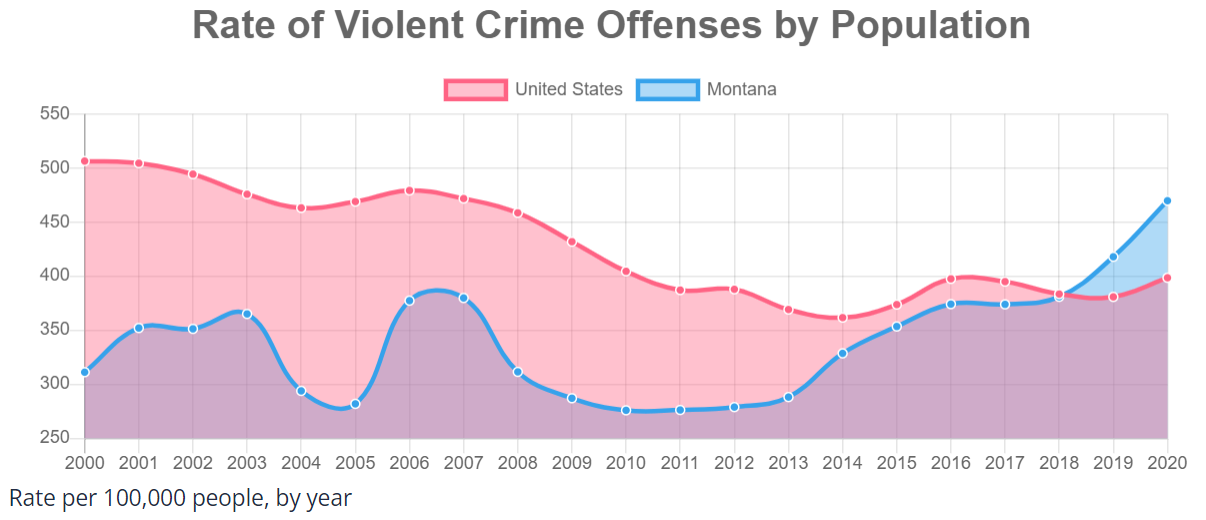
The 15 most rural states had crime rates of 321, 309 and 400 versus the national averages of 510, 400 and 400. The 15 rural states in 2000 had violent crime rates more than one-third lower than the national average. By 2020, they had increased to match the national average.
Six of the 15 states had very high violent crime rate increases. North Dakota and South Dakota based upon the “fracking” boom disruptions and Vermont, Montana, Arkansas and Alaska based upon other drivers.
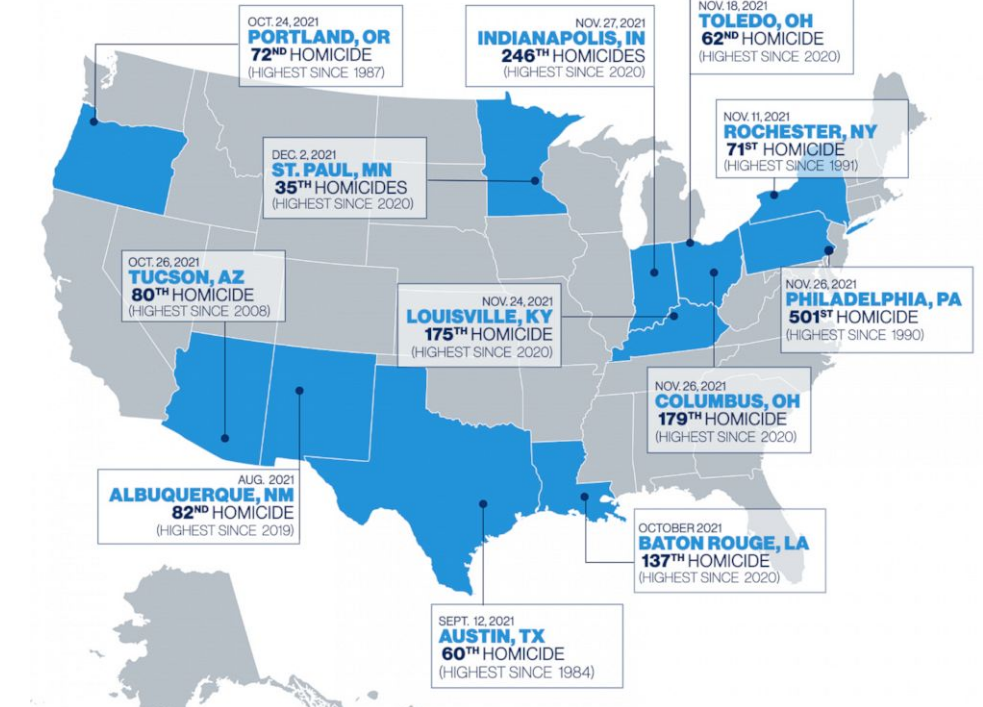
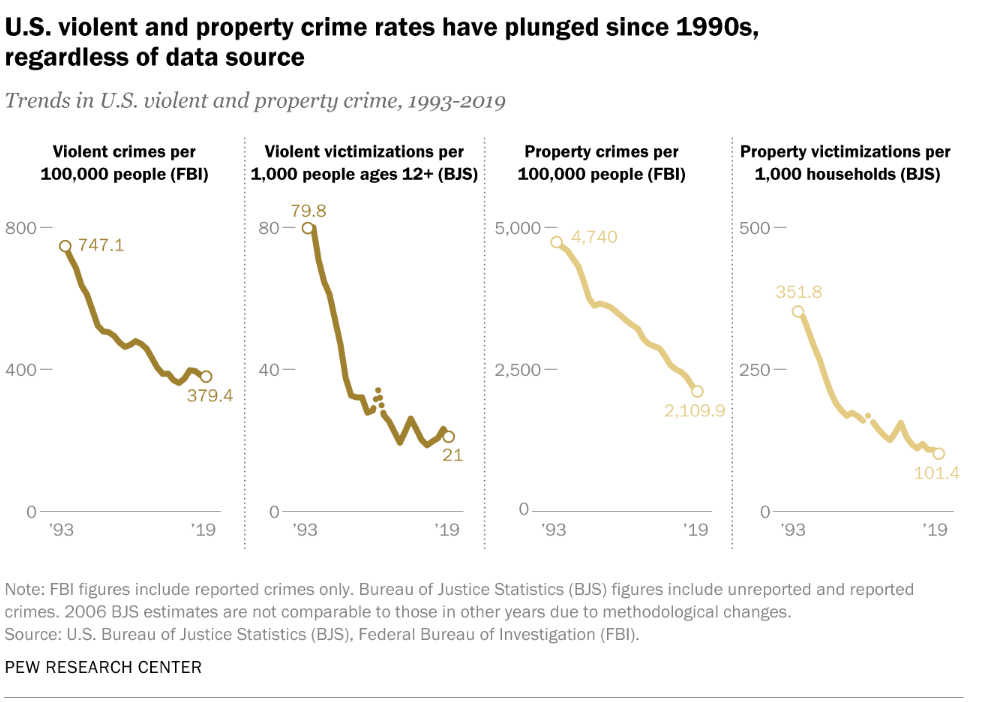
Despite the news media’s focus on urban homicide rates in 2019-20-21, the overall US violent crime rate continued to fall from 2000-2010 after an amazing drop from 1993-2000 and then stayed constant/flat for the next 10 years. This “flat” crime rate from 2010 to 2020 was AFTER a 40% drop in violent crime measured by the FBI stats and a 75% drop measured by the Bureau of Justice surveys of crime victims from 1993-2010.
The 15 urban states’ violent crime rates fell by 29% between 2000 and 2020. The 15 rural states’ violent crime rates INCREASED by 25% between 2000 and 2020, then roughly equaling the national average.
Violent crime rates fell by another 10% between 2010 and 2014, reaching a modern low. Unfortunately, they increased back to the 2010 level in 2020.
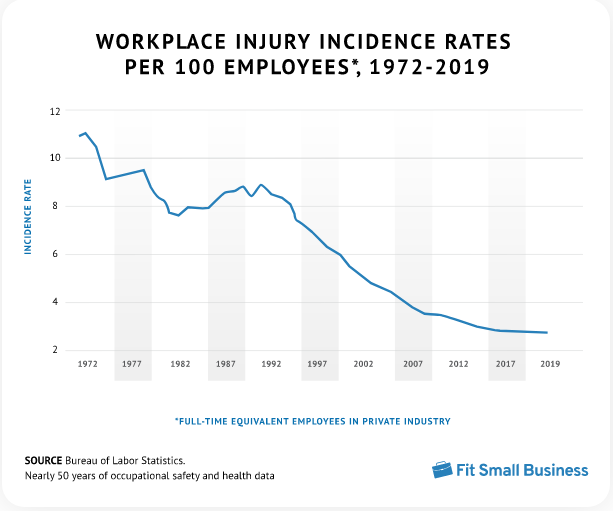
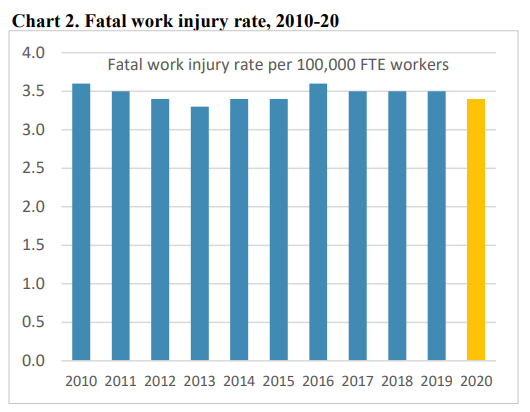
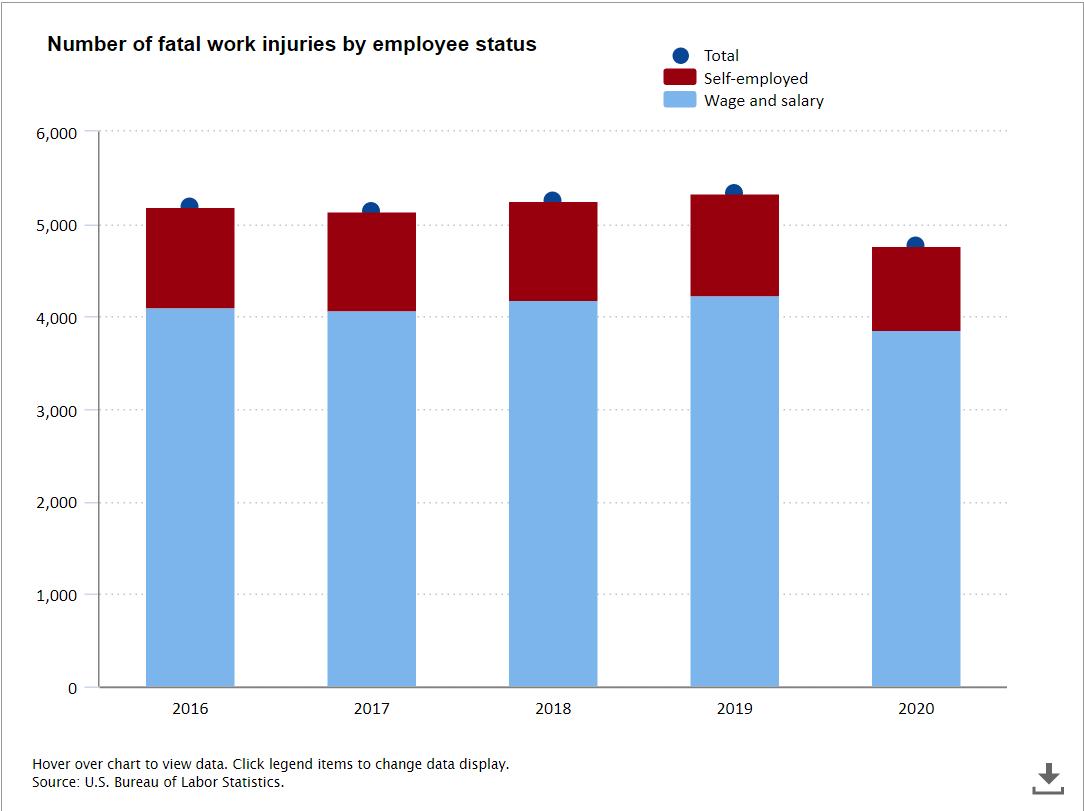
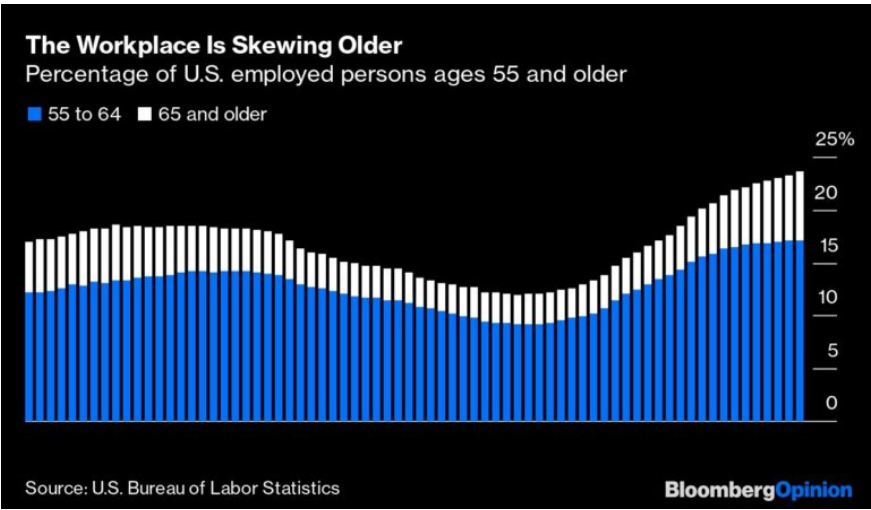
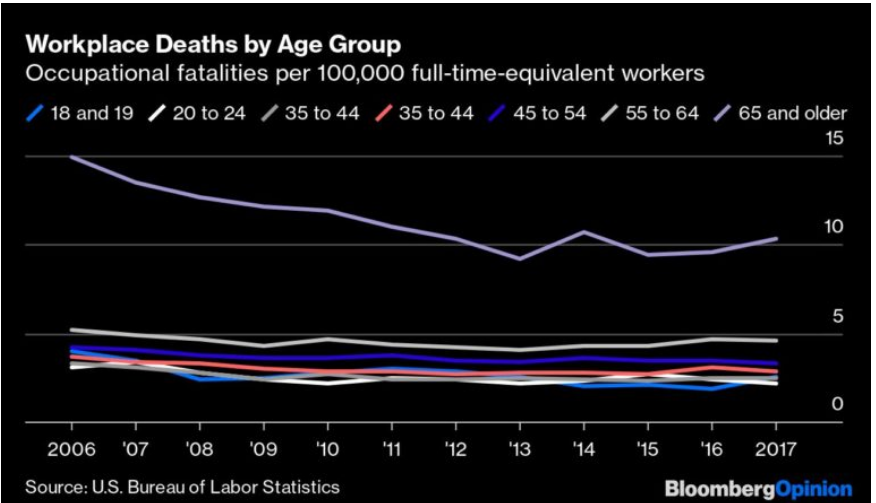
The baby boomers have caused the relatively higher death rate aged 55+ groups to almost double their share of total workers. While the death rate for EACH age group has gone down in the last 20 years, the blended average has been flat for the last decade.
Covid Provided Special Challenges and the Results Could Always Be Even Better
The US averaged 35,000 annual cases of polio in the 1940’s. The disease was eradicated in the US by 1979.
Global cases were 350,000 in 1988. Concerted efforts by governments, health care professionals, philanthropists and civic organizations (Rotary) eliminated polio from 5 continents by 2020. The last African case was reported in Nigeria in 2016.
Active cases were reported in only Afghanistan and Pakistan last year.
Soon, this will be the second ever human infecting disease to be eliminated (after smallpox).
The Indy Metro Area is comprised of Marion County plus the 7 surrounding “donut” counties. Marion has grown throughout the half-century, adding 175,000 people (22%). Rural Morgan and Shelby counties have not grown much. Hancock, Boone and Johnson counties have doubled their populations. Hendricks has grown from 50,000 to 175,000. Hamilton has grown exponentially from 50,000 to 350,000. This relatively rapid growth has made the metro area grow from 21% to 28% of the state total, adding state senators and representatives and causing increasing tensions between the one large, growing area and the slower growing, largely rural, rest of the state. There are suburban Chicago, Louisville and Cincinnati counties that have shown decent percentage growth, but they are a small share of the state. Lake County (Gary) is a special case, declining in population decade after decade.
The Indy Metro counties started 1970 with slightly higher per capita personal incomes, so the share of the state total was 24%, a bit above the 21% population share. By 2020, the Indy Metro area had captured one-third of the state’s personal income (34%), much higher than its 28% share of the population. Per capita incomes and population had both grown in the capital region.
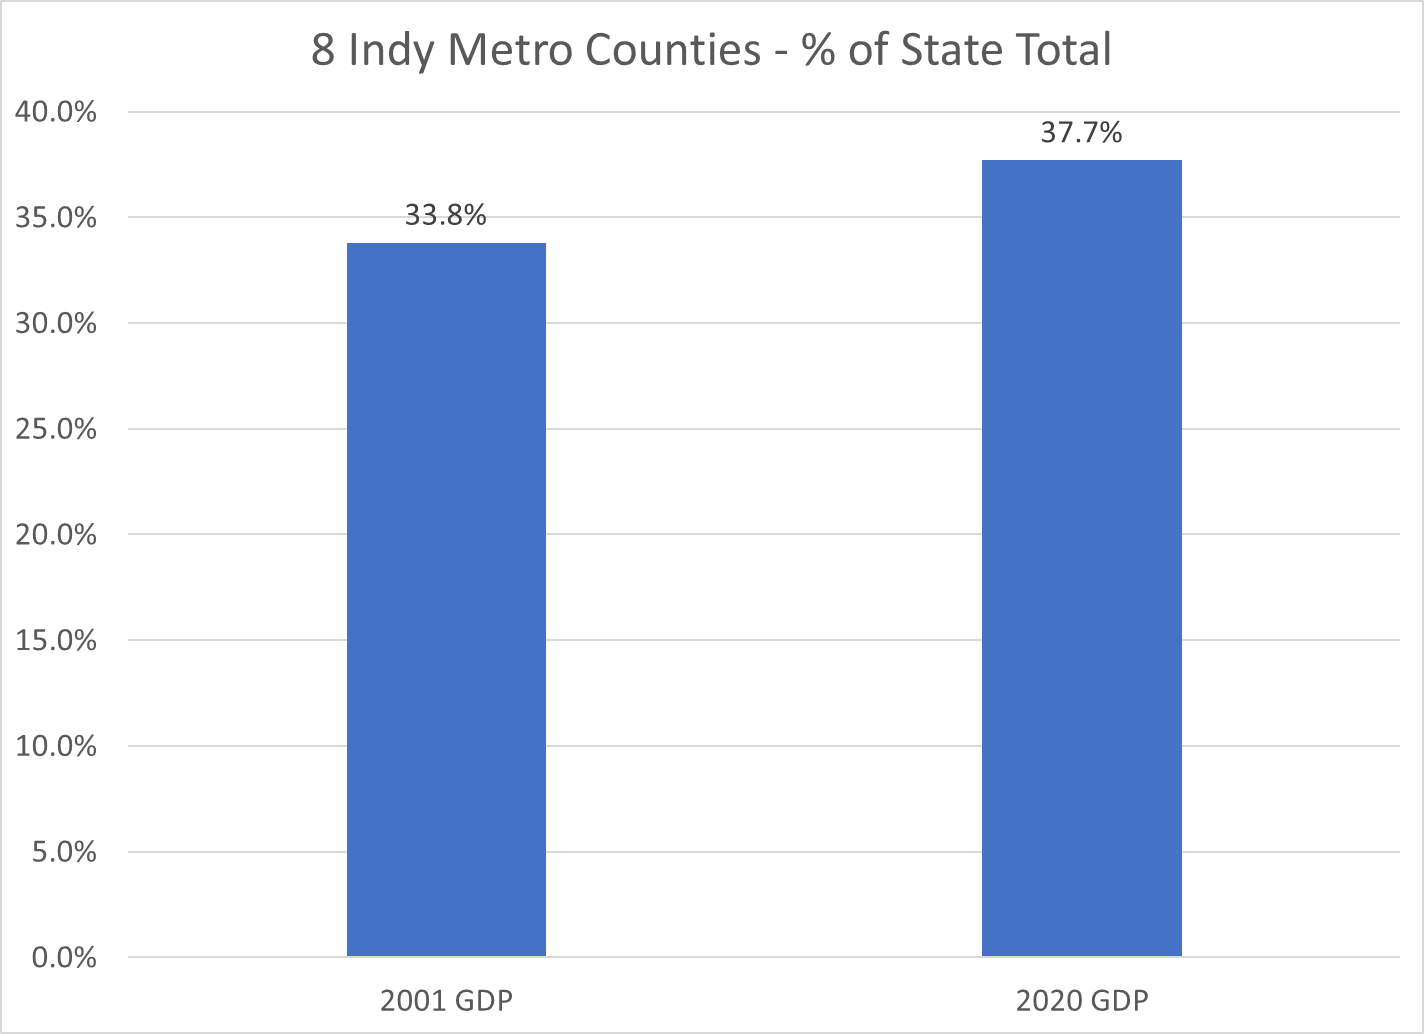
Gross Domestic Product, the value of goods and services produced in Metro Indy, was one-third of the state total in 2001, the first year of available statistics. This measure increased to 38% by 2020. Nearly 2 out of every 5 dollars of statewide value-added output was generated by the Indy Metro area in 2020.
Indiana is a mostly rural state with Indy, a dozen small cities, a cluster of northern Indiana manufacturing counties, Gary (Lake County), Ft. Wayne (Allen) and Evansville (Vanderburgh). The Indy Metro Region has 9 times the density of people, income and production as the most rural counties. For example, it takes the 67 lowest population counties to equal the 1.9 million people living in the Indy Metro area.
The Indianapolis Metro area grew by a respectable 72% during this period, above the national average of 63%. The other Indiana counties grew by only 19%, about one-fourth as fast.
The Indy Metro area added 900,000 people, the same growth as the rest of the state.
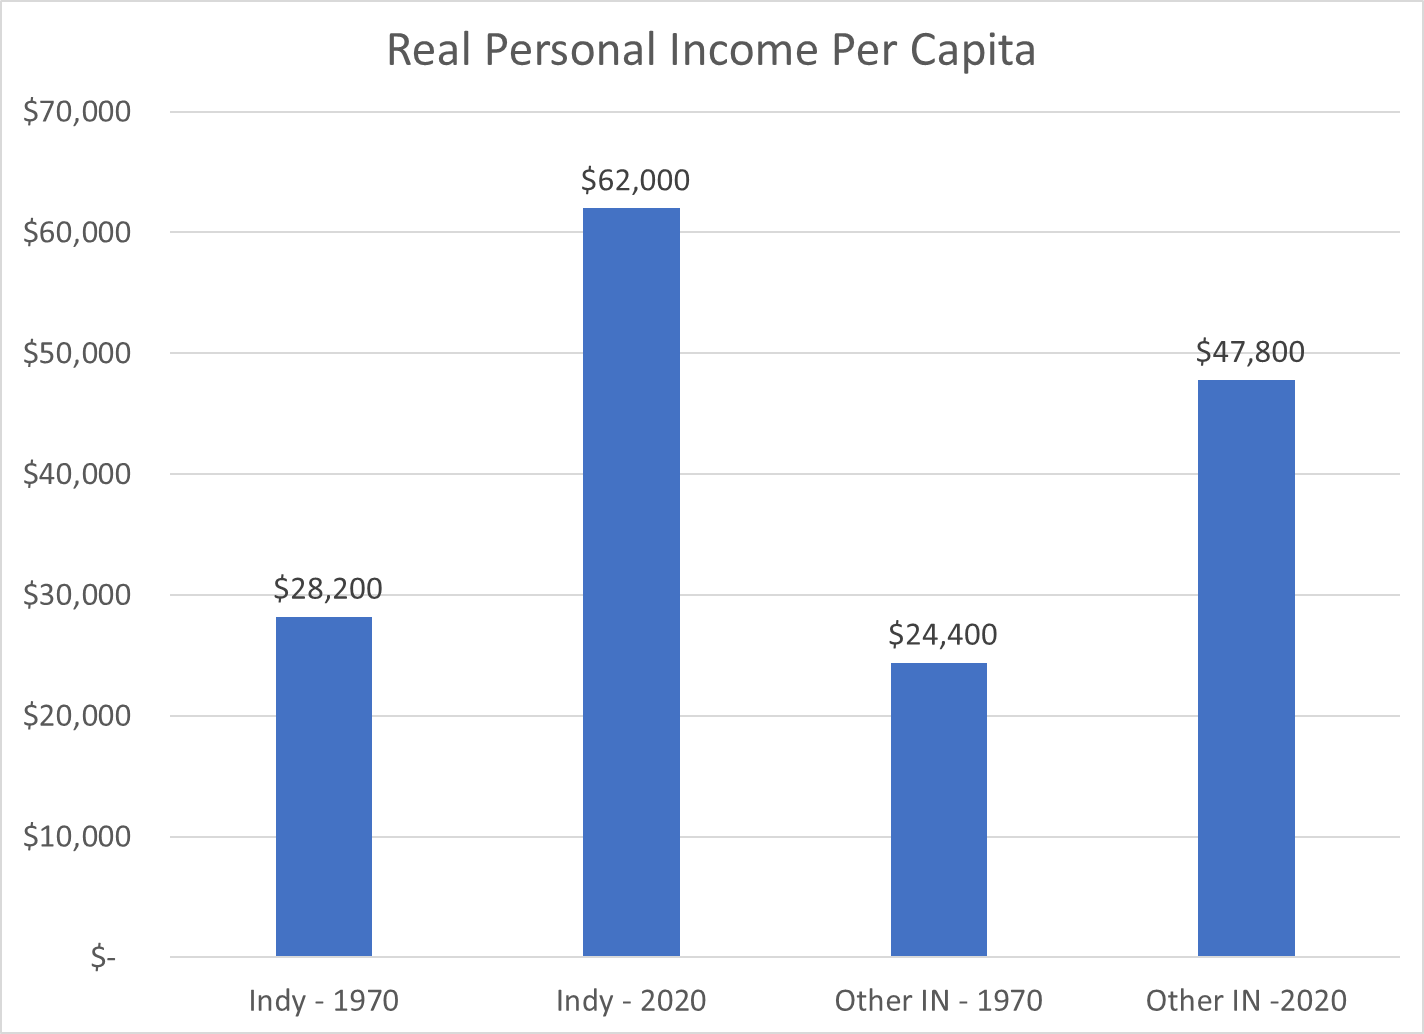
With population and per capita income gains, the Indy Metro area’s real personal income grew almost four-fold, while the rest of the state grew by roughly 150%.
Indy Metro per capita income was 15% above the rest of the state in 1970 and twice as high (30%) by 2020.
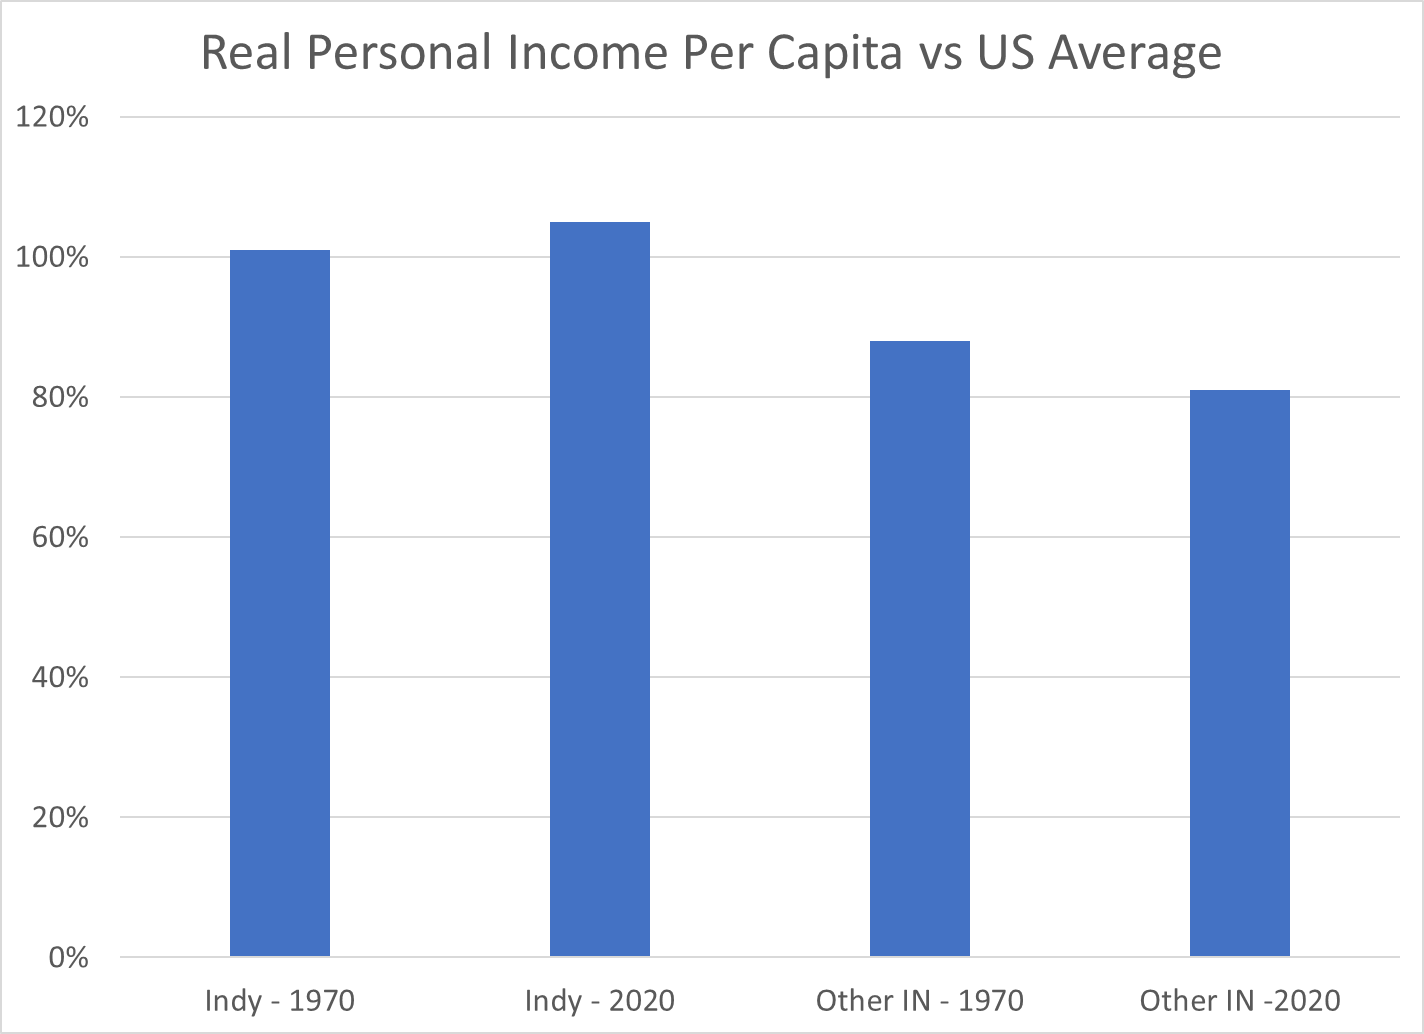
The Indy Metro area has improved its per capita income versus the US average by 4 points, from 101 to 105. The other-Indiana counties have declined from 88% to 81% of the national average.
While the per capita income in the Indy Metro area is 30% higher than the rest of the state, the value of goods and services produced (GDP) per person is more than 50% higher than the rest of the state.
These wide, and growing, disparities in economic results may lead to increasing tensions between the relatively prosperous center and the largely “left behind” periphery. Fortunately, the real personal income per capita in the “other” counties did increase by 95%, from 24 to 48K during these 5 decades, even though the Indy folk’s income grew by 120%, from 28 to 62K.
“Many challenges are associated with drought, wildfire, invasive species, and outbreaks of insects and disease—all made worse by climate change. Warming temperatures mean more energy in the atmosphere, which is consistent with severe weather events, such as floods, tornadoes, blizzards, ice storms, and hurricanes.”


