Claims of election fraud have a long history in the US. They exist for 3 reasons. Losers hate to lose. Fraud claims support efforts to restrict voting by opponents. Fraud claims undermine the legitimacy of US democratic processes (Russia).
TRUTH
Historically, without “checks and balances” or other controls, political parties and machines had taken advantage to ensure that they won. We’re mostly talking about 1820-1900. Even in the 20th century, there were states and cities where one party had control and could “deliver” votes at the city, state or national level. This kind of fraud largely ended by the 1960’s based on journalists, lawyers, political opponents and activists overturning this corruption of democracy. Then and now, the numbers of fraudulent votes were very small as a percentage of the votes cast, less than 1%. Fraudulent votes are effective in a democracy only when their small share can tip the election. Most claims of voter fraud are based on a misunderstanding of voting, statistics or logic.
History
In 2007, before the partisan push for photo-ID’s and Trump’s 2016 and 2020 pre-emptive and post-emptive claims of fraud, the Brennan Institute consolidated the research and concluded that voter fraud was statistically irrelevant, 1 in 10,000 or 1 in 1,000 at the most.
We are blessed with an incredibly low level of election fraud in the US for the last 50 years. With a simple two-party system, partisans from both sides have ensured that fraudulent voting is difficult to do, highly punished if discovered and easy to discover (and therefor highly disincentivized). US voting is largely managed at the lowest levels: counties, cities, precincts, where citizens know their neighbors. It is effective because enough Americans of various political beliefs today believe in this process and volunteer their time to make it effective.
Analysis
Republicans generally take a negative view of human nature, expecting individuals to actively pursue their self-interest. Hence, they expect that Democrats, with influence over the election process in some venues, will take steps to optimize their results. In an earlier age this was partially true. But, in the modern world (post 1920’s), several factors work against this direct pursuit of self-interest. The country’s laws make voting fraud a felony with significant penalties. Local election officials are elected. In a two-party system it is relatively easy to engage both parties to monitor the election process. The US has very many lawyers ready to assist their preferred party. Election results are public. Statistically improbable results are very easy to identify today. Each precinct has a historical preference which is unlikely to change materially in any single election, so any fraudulent voting is easily identified.
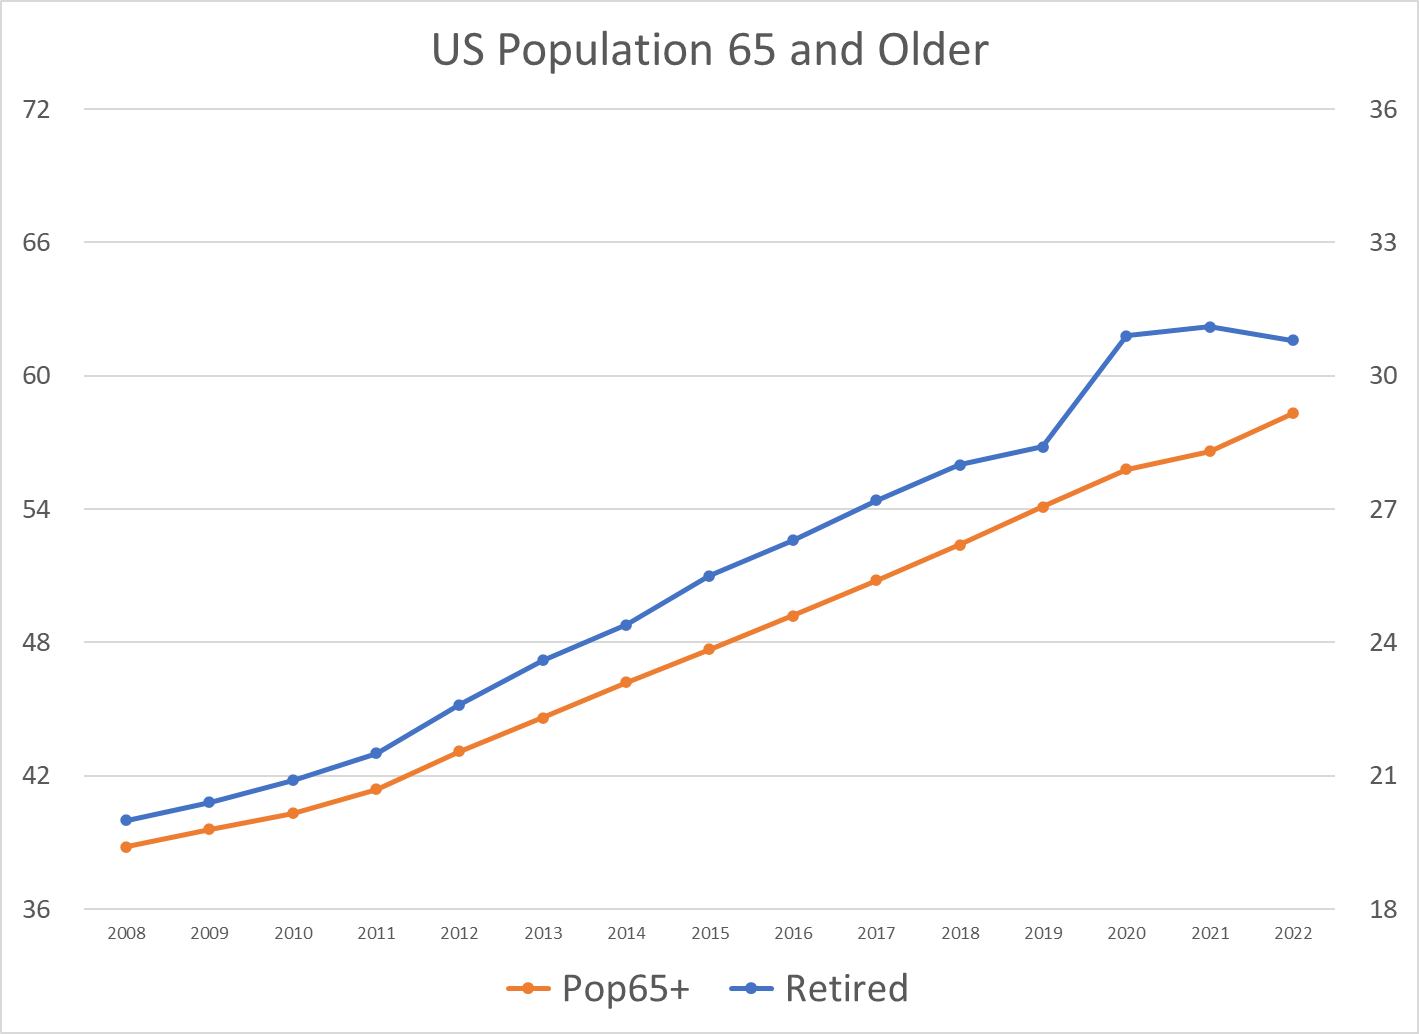
The number of retirees, aged 65+, has increased by more than 50% since 2008, from 20M to almost 31M.
The retirement age population has grown by 4% of the total population in the last 14 years.
The retired 65+ population has grown a little faster than the total 65+ age group. The initial pandemic impact in 2020 was a 5% increase in the retirement rate, indicating about a 2.6M increase in early retirements in 2020.
The retirement rate in 2020 was about 2% higher than the trend, indicating an extra 1.2M extra retirees. The percentage of retired individuals has since fallen back below the trend line.
Later estimates indicated about 1M early retirements, and then a reversal in late 2021 – 22 as individuals chose to defer their retirements due to the uncertain economic conditions.
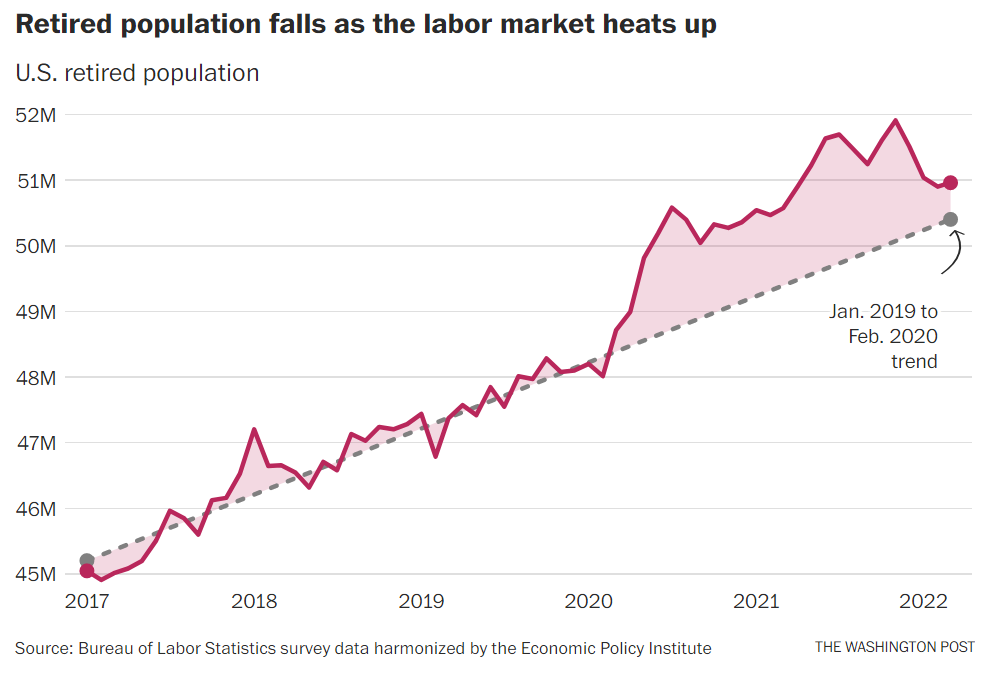
Bloomberg noted that new Social Security filings did not increase, so even though there were some retirement candidates with adequate resources to delay claiming Social Security benefits, it was unlikely that there were 3M extra early retirees.
CNBC documented the late Pandemic swing towards more potential retirees deferring this step.
The Washington Post’s approach shows a peak of 2 million extra retirees, falling back to about one-half million in 2022.
Summary
The US economy, political system and social norms have supported the number of aged 65+ retirees growing from 20 million to more than 30 million since 2008. Some of the increase in “retirees” at the start of the pandemic was not voluntary and some retirees have returned to work in the last year as the labor market remains tight and workers worry more about economic conditions. However, overall, an extra 10 million individuals have chosen to retire from active employment and enjoy their retirement years.
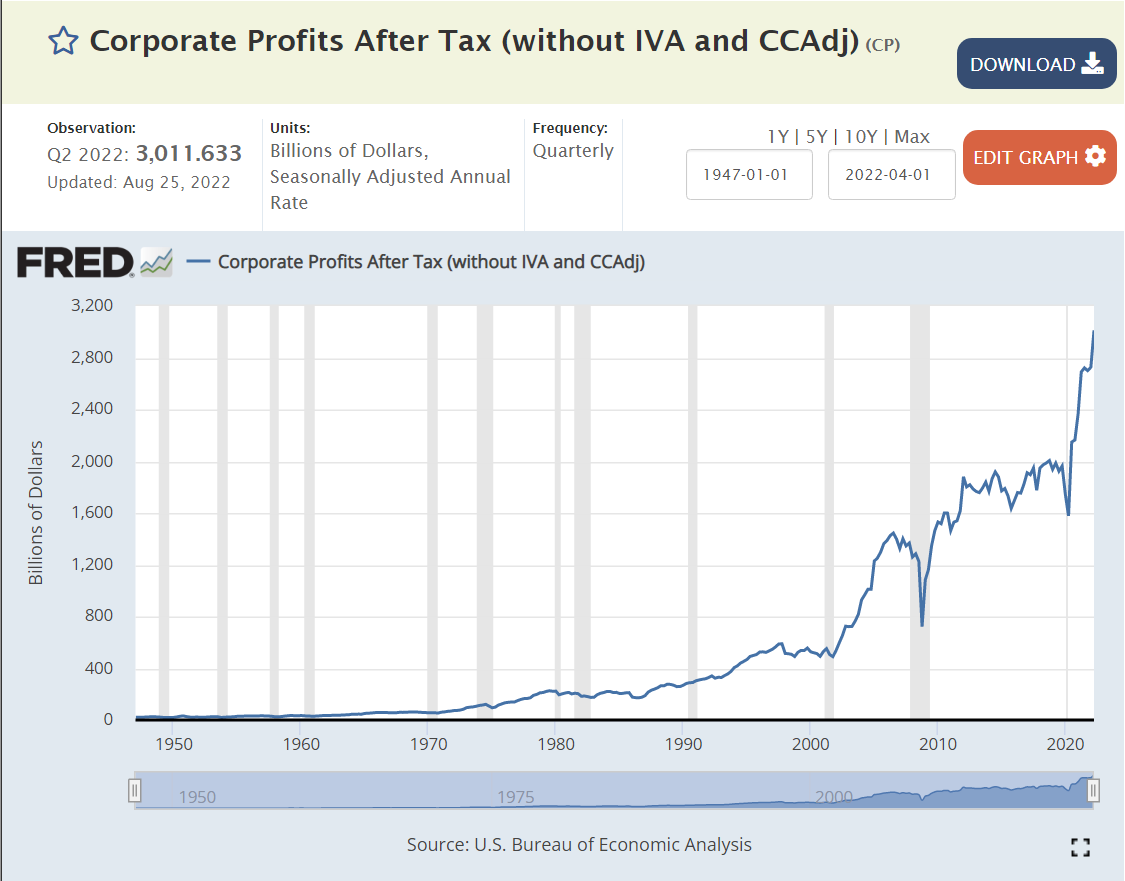
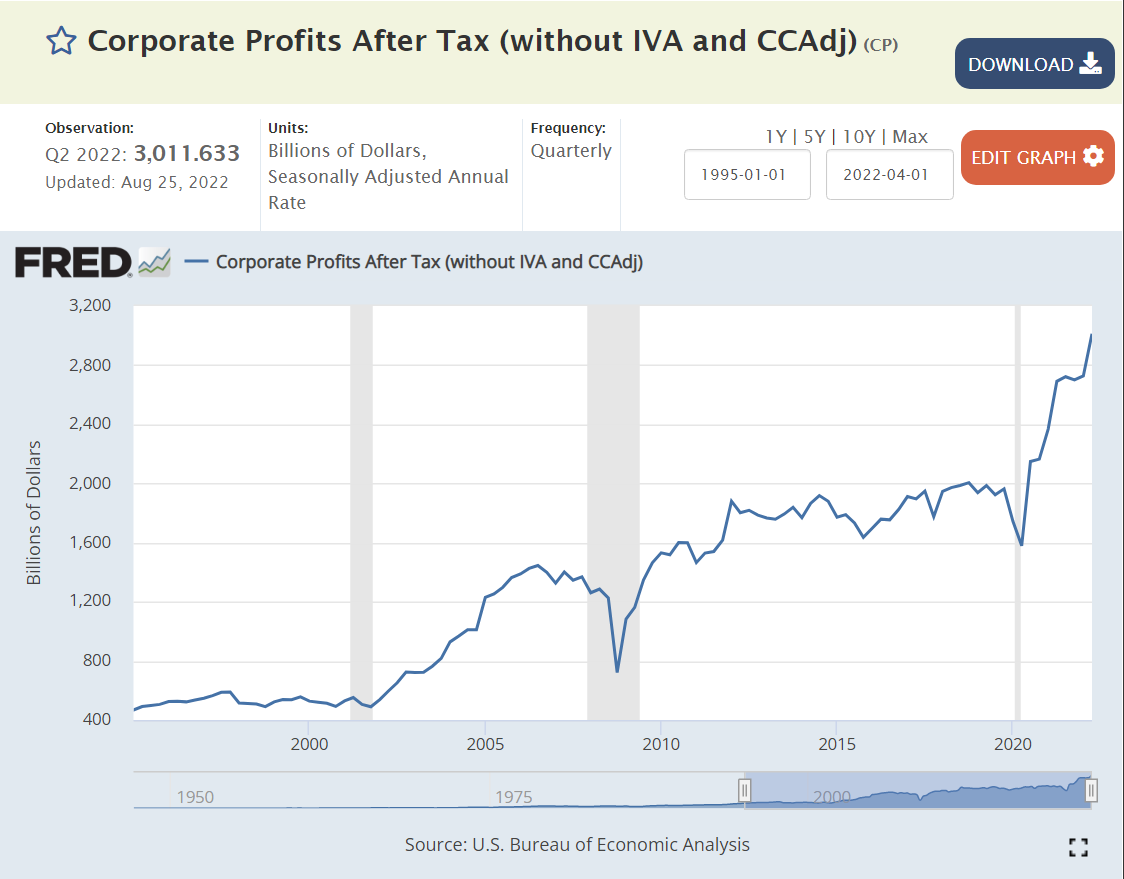
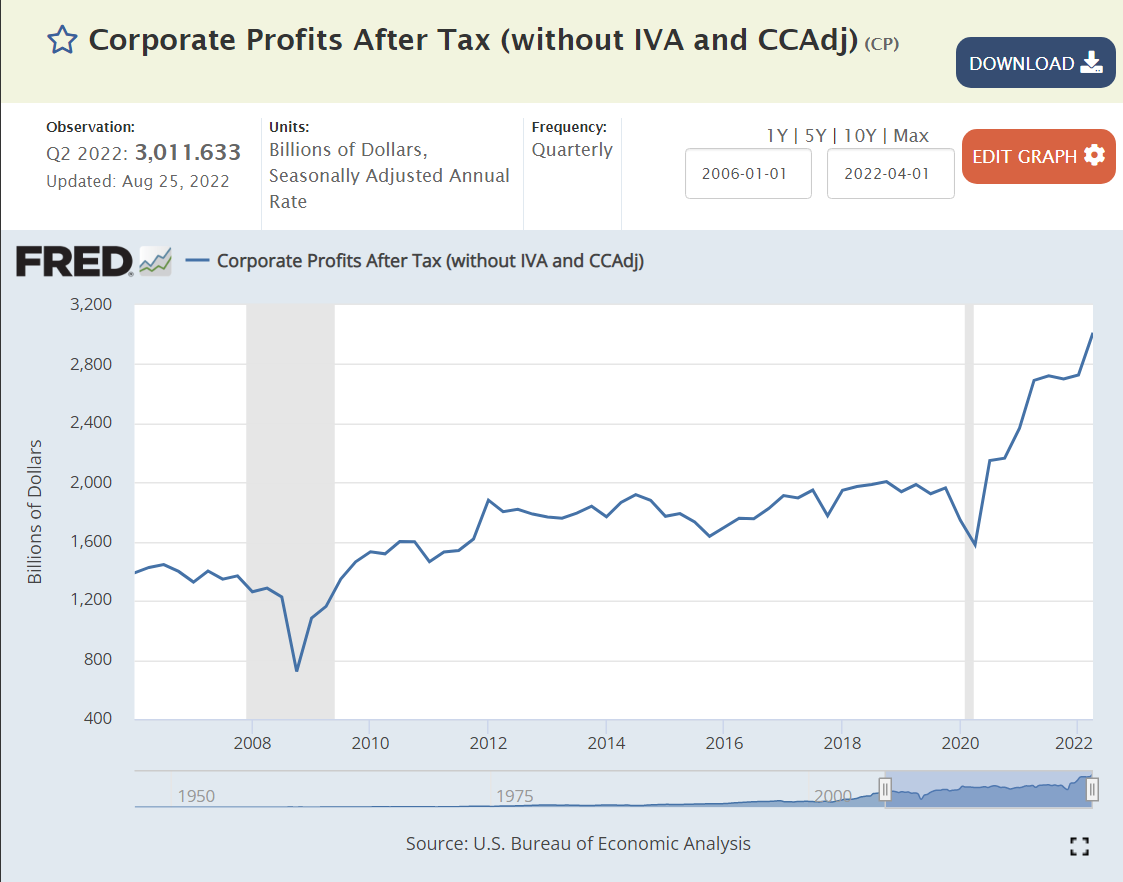
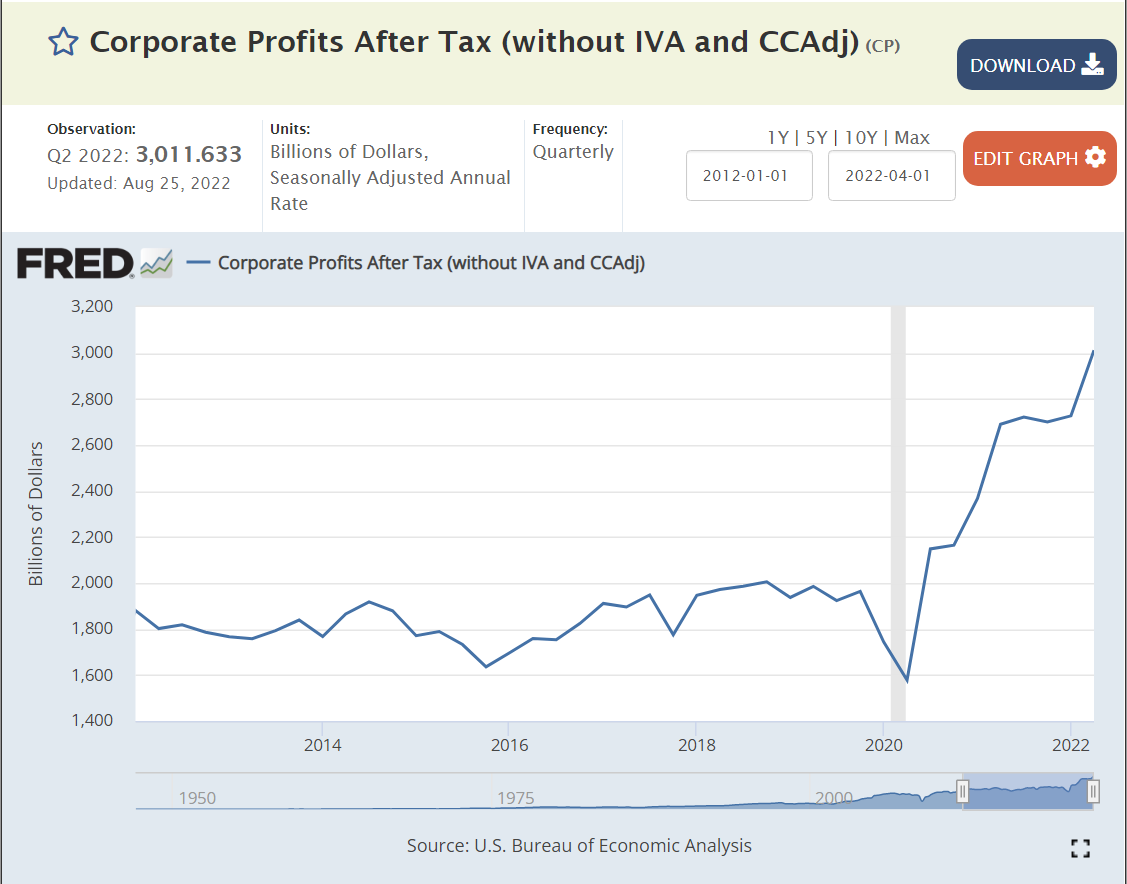
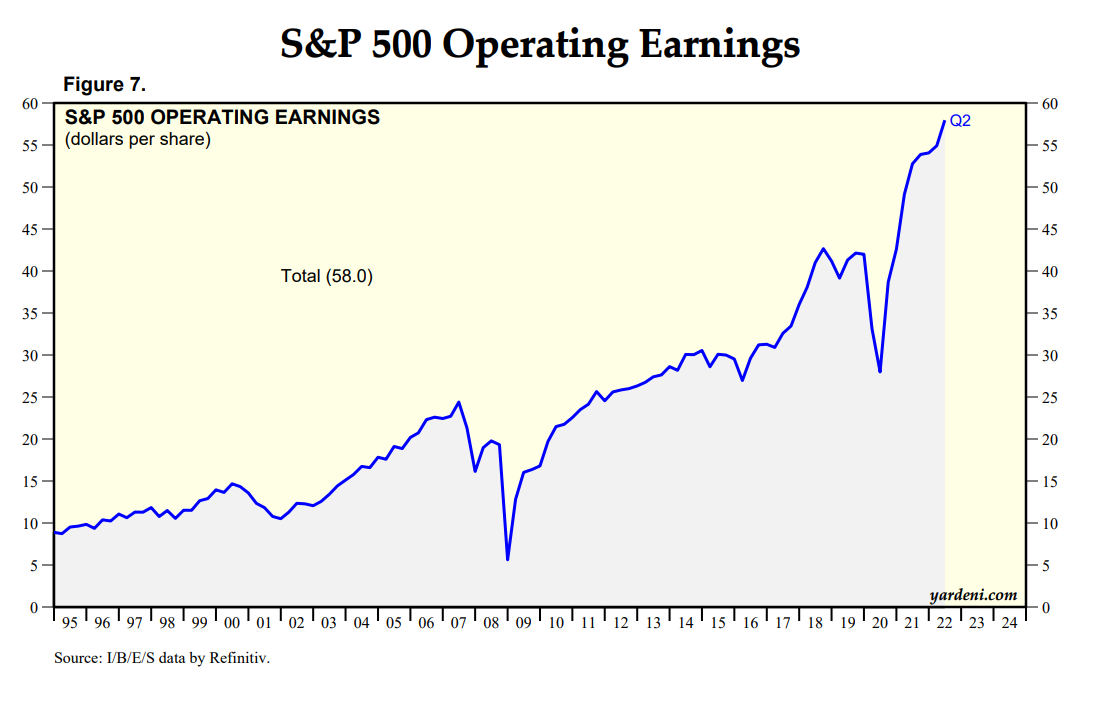
US Corporate profits grew from $1.9 Trillion(T) on an annual basis in the second quarter of 2019 before the pandemic to $3.0T in the second quarter of 2022; plus $1.1T (+57%)!!! US nominal gross domestic product (GDP) grew by 17%, from $21.3T to $24.9T, an increase of $3.6T. Real, inflation-adjusted, GDP grew by just 4%, accounting for a $0.8T increase in the real economy. Inflation grew by 13%, causing the other $2.8T of measured GDP. The $1.1T of increased corporate profits represents 39% of the inflation which has occurred in the last 3 years.
Analysis
Let’s look at the growth of US corporate profits from a half-dozen starting points to try to put this into perspective.
US corporate profits reached $3 Trillion in 2022, up from essentially zero in 1950. I’ve selected 7 peak profit years to outline this growth. Nominal profits increased from $55B in 1970 to $3.0T in 2022. In real, inflation-adjusted terms, profits have grown from $142B to $1,023B, a 7-fold increase in 52 years! Annual profit growth has been erratic, increasing by a high of 8% from 1995 to 2006 and a low of -1% from 2012 to 2018. The cumulative annual real profit growth has stayed near 4% throughout the period. 4% compounded for 52 years is a little more than 7x.
The US population grew from 200.3M to 338.3M during this period, 1.0% per year. So, corporate earnings grew by 3% per year above the rate of population growth for 52 years!!!! This kind of compound growth rate cannot continue for long periods of time without greatly impacting other sectors of the economy.
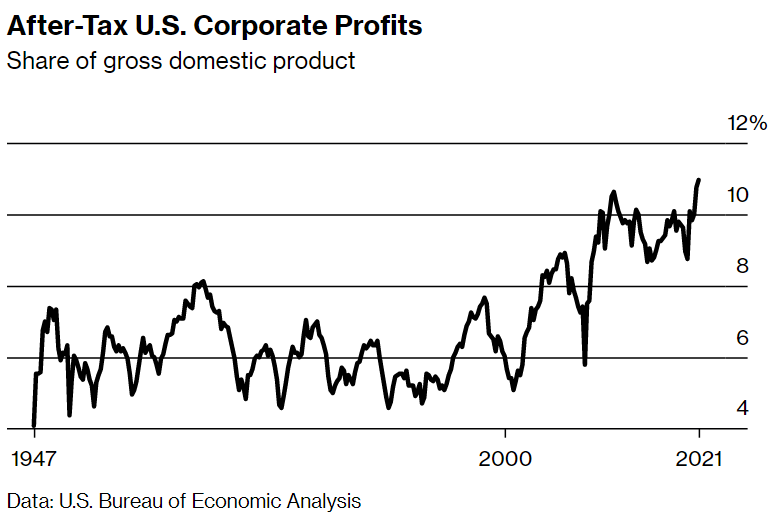
Corporate profits fluctuated in the 4-6% of GDP range from 1947 through 2000. Profits jumped up to 10% of GDP by 2010 and have largely remained at this two-fold elevated level for a decade. Profits reached a new record of 12% in 2022!
This measure shows profits growing eight-fold since 1970. (I’m going to ignore the detailed differences between the various measures of profit. They are important, but not necessary to see the major growth in profits, which is broadly consistent across the various measures.)
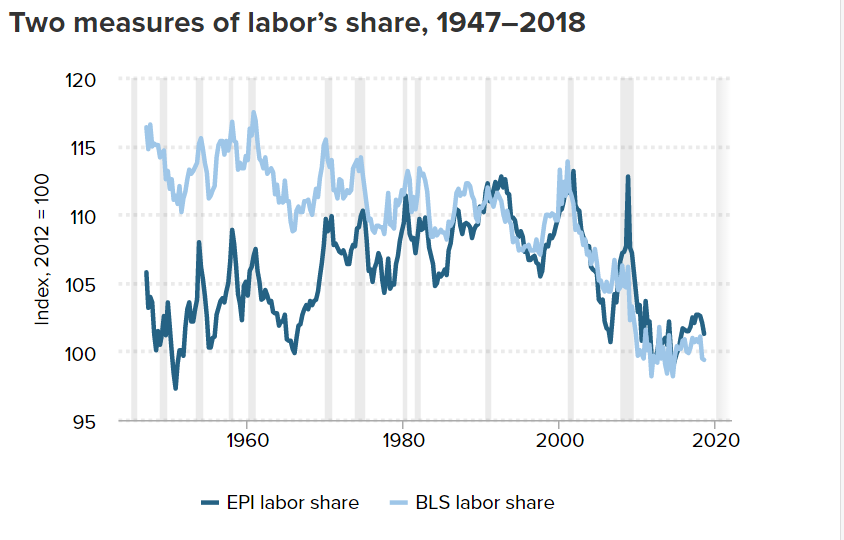
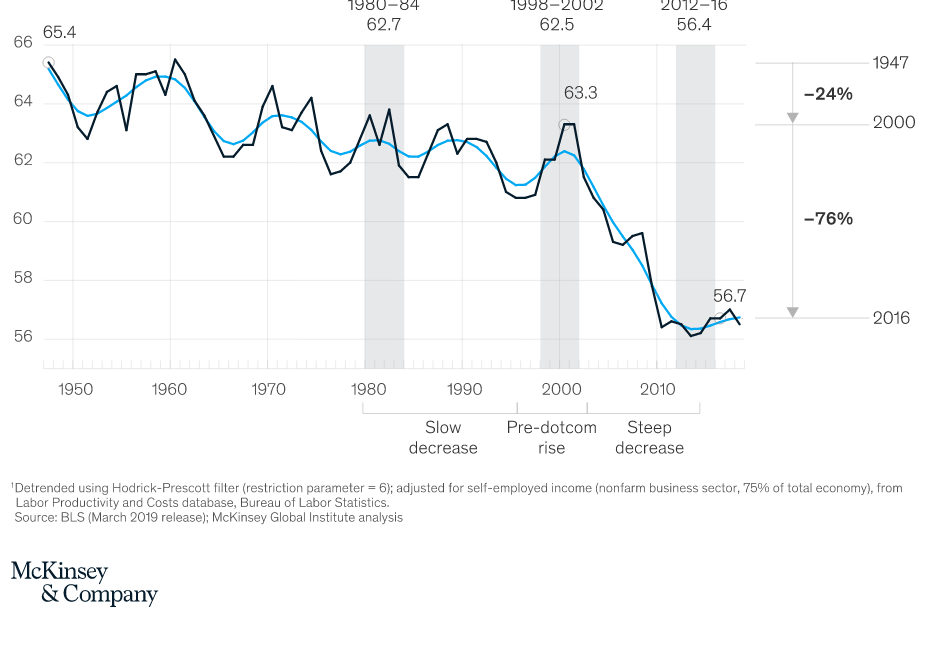
Most analyses of the growth in profits and decline in relative wages note that labor productivity has continued to rise by 2% or more annually, but labor has received almost no portion of those gains in the last 30 years.
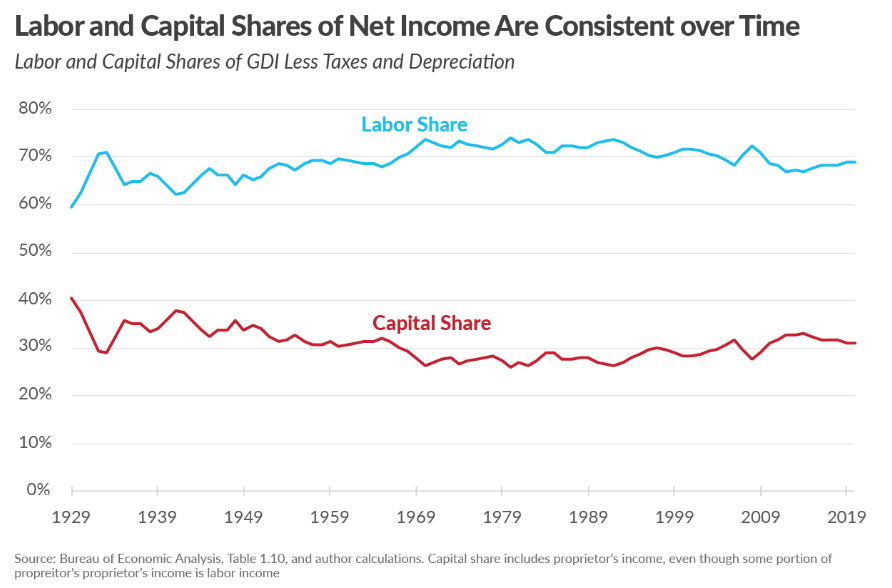
A right-leaning think tank adjusts the data and claims that labor’s share remains constant in the long-run. The Tax Foundation does delve into the various measures of income and provides arguments for their preferred measure.
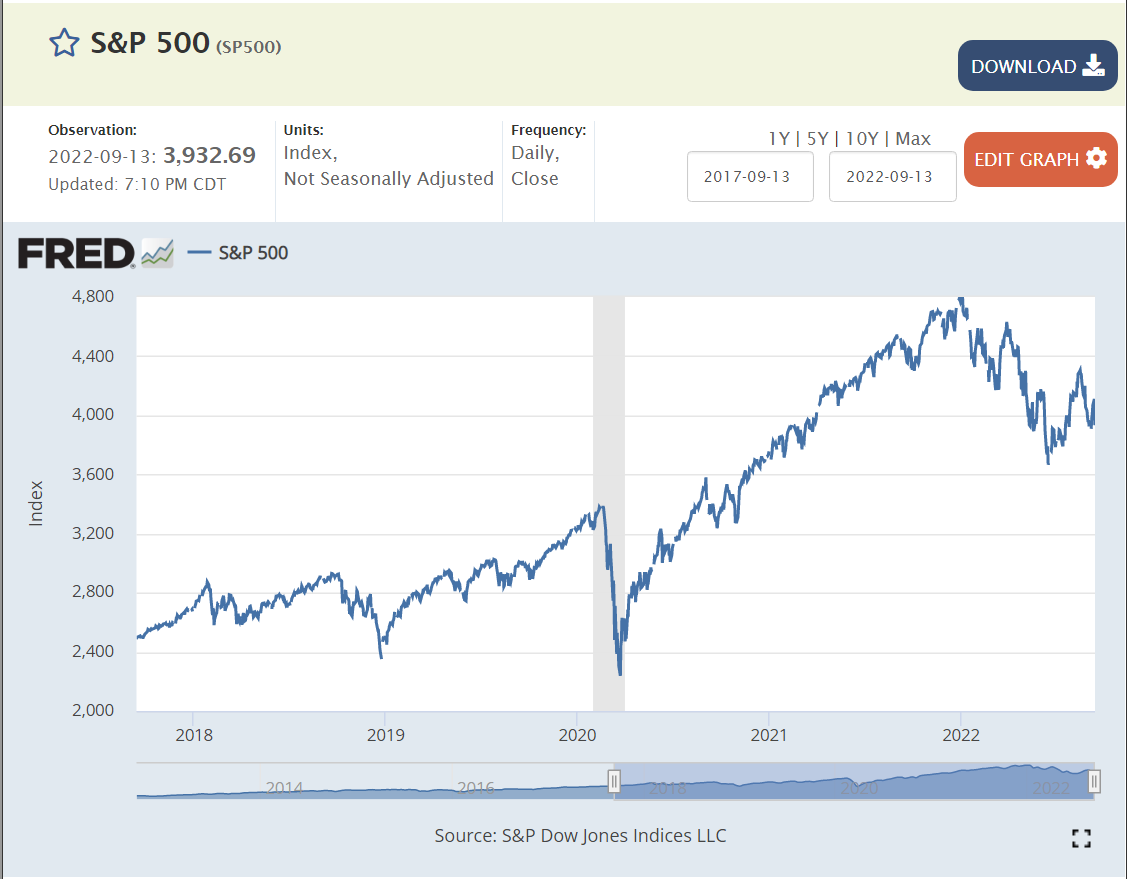
Stock prices tend to follow profits. The S&P 500 index has grown by 50% in the last 2 years (despite the recent decline), reflecting the amazing growth in corporate profits during a “once in a century” pandemic driven recession.
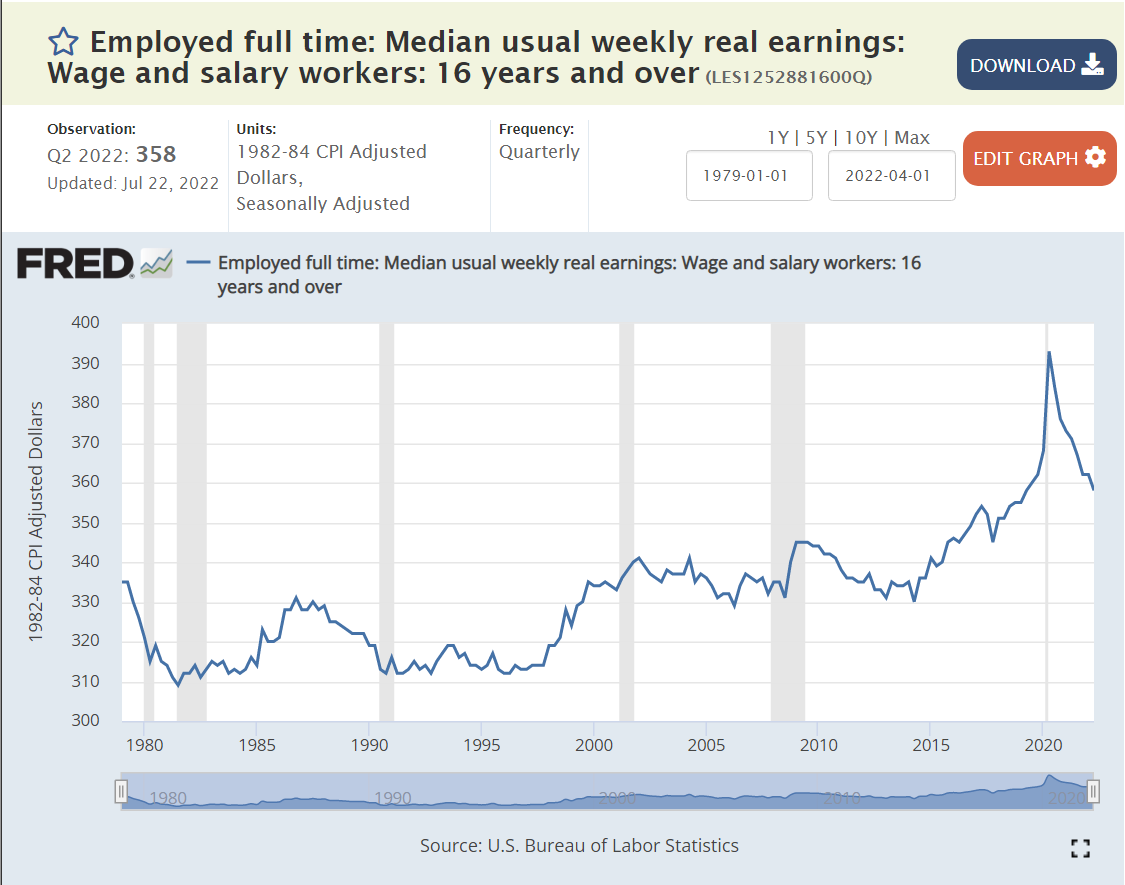
Median REAL, inflation-adjusted, earnings remained flat at $330/week from 1979 through 2014, a period of 35 years! This is during periods where profits were growing at 4% per year in REAL terms. In the last 8 years, REAL wages have increased by 9%, a bit better than 1% per year on average.
The media has published many articles, especially noting the increase of profits, overall, since before the pandemic. This is a popular topic because the result is certainly counterintuitive and because President Biden and the more left-leaning national Democrats have been criticizing corporations for “price gauging” and causing the recent inflation spike.
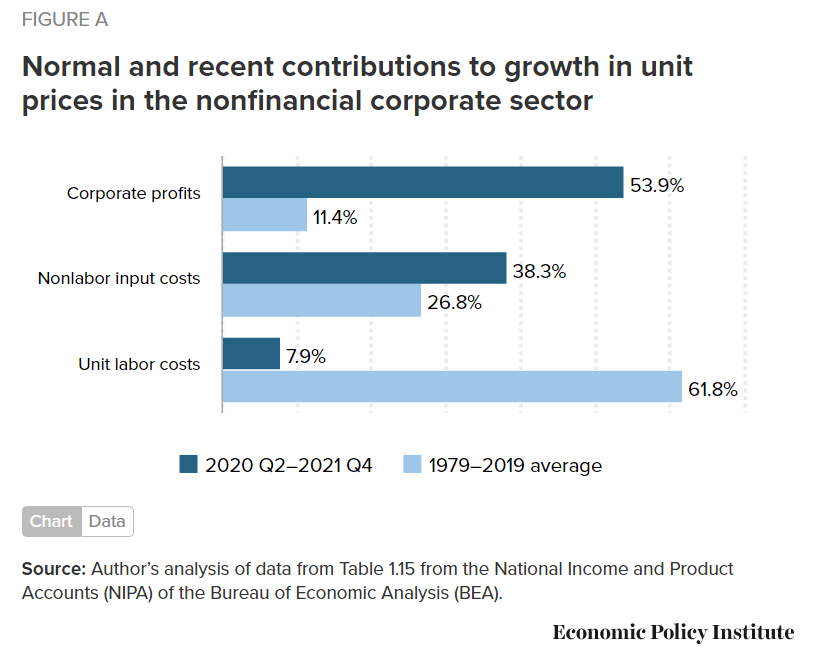
A variety of sources provide compelling data and logic to indicate that corporations are “taking advantage of” the post-pandemic inflation caused by supply chain issues and expansive fiscal and monetary policies to boost prices at rates faster than their costs of inputs (suppliers, labor, capital).
Most economists and analysts point to the increased concentration of firms (fewer) by industry increasing their pricing power and allowing them to raise prices during periods of change.
This is pretty dense and dry stuff. There is a general consensus among economists who focus on this topic that concentration and pricing power have risen very significantly. This is partly due to the simple aging of industries with fewer players left standing. The winners in a world of global competition are simply “much better” than the losers so they continue to take market share. US anti-trust enforcement in the last 40 years has been very limited, following the theory that “open competition” in the long run (Schumpeter’s creative destruction) eventually undermines leading companies with innovative products, processes and market strategies.
The US Chamber of Commerce argues that industry concentration has not increased, noting that consumer choices in broadly defined industries have increased greatly through time.
By a dozen measures, profit has consistently grown as a share of the American economy in the last 40-50 years. This necessarily means that the share of output and income received by labor is much smaller as a percentage of the total pie. The recent surprising ability of American corporations to effectively work through the pandemic supply chain disruptions, lose more than 10% of their labor force, increase nominal wages significantly, encounter severe input price inflation and still engineer price increases to come out much further ahead on profits is a major story for our time.
It is attracting attention to what I believe is an even more important story: the ability of corporations to incrementally capture nearly all of the increased value added by the productive American economy across 40-50 years and share very little with labor. This structural advantage of a very effective corporate sector “doing its job” within the relatively low-tax and low-regulation US political context is now completely proven.
In an ideal world, we would be developing and considering serious policy options that would limit this excess power without “killing the goose that lays the golden eggs”. Unfortunately, the Republican party remains focused on tax and regulation cuts as the main economic tools and the Democratic party alternates between 1960-70’s era Biden “centrist” policies and much further-left Bernie Sanders style policies.
The Department of Labor’s monthly survey provides various measures by industry. I’ve broken down the data into 15 industry segments. Eight (8) of these segments account for 5/6ths of all positions and I’ll focus on these 8.
The number of open jobs in the last year, July, 2021 – July 2022, is lead by Professional Services (2.0), Health (1.9), Leisure (1.6), Retail (1.1), Manufacturing (0.9), Government (0.7), Logistics (0.5) and Finance (0.5).
Seven industries accounted for 5/6ths of the increase from 4.6M openings in 2006-7 to 11.2M open jobs today. Health (1.2), Profl Svcs (1.2), Leisure (1.0), Retail (0.6), Manufacturing (0.5), Government (0.4) and Logistics (0.4) are the open job gainers.
The pre-pandemic increase averaged 40% of the total 15-year increase for most industries. The Manufacturing industry showed job declines between 2006 and before the Pandemic, so 80% of it’s openings increase has been since the pre-Pandemic peak. The Business and Professional Services industry has also grown faster since the Pandemic, with 68% of its job growth in recent years. The Retail industry shows an opposite pattern, with 60% of it’s job growth before the Pandemic and a relatively weaker 40% post-Pandemic (on-line sales growth impact).
Total Positions Available by Industry
Total positions increased by 12M, from 138M in 2006-7 to 150M in the last year. Just 4 industries account for all of the growth, lead by Health (5.1), Profl Svcs (4.0), Logistics (1.9) and Leisure/Hospitality (1.8). The migration from ag/extraction to manufacturing to pure services is accelerating.
Open Positions Rate by Industry
The open positions rate more than doubled, from 3.3% in 2006-7 to 4.5% in 2018-19 to 7.0% in the last year. Unfortunately, the larger and growing industry sectors have above average open position rates. Leisure and hospitality shows an incredible/unsustainable 9.8% job openings rate. Professional and business services and Health Care report nearly as high 8.6% vacancy rates. The Logistics industry has a higher than usual rate of 7.4% as it adds jobs at a faster rate in the home delivery era. The Retail and Manufacturing industries show elevated 6.4% open jobs rates. The Government and Finance industries exhibit 5.4% openings rates.
Changes in the Job Openings Rate
The overall job openings rate more than doubled from 2006-7 to the last year, from 3.3% to 7.0%. Keep in mind that 2006-7 was the peak of that business cycle with job openings at a cyclical low point. The Leisure and Hospitality industry had the largest increase, from its usually relatively high 4.3% to an “other worldly” 9.8%. The pandemic drove down travel and it has slowly recovered. The Logistics industry displayed the second highest increase, from 2.7% (it’s usual Manufacturing-like rate) to 7.4% as the Pandemic drove individual shipments to consumers. The Health Care industry continued its labor intensive growth, doubling from 4.3% to 8.6% of open positions. The Manufacturing industry evolved from its usual low 2.3% all the way up to 6.4% as labor demand in other industries grew and attracted its workers. The Professional and Business Services industry kept growing, resulting in a 3.8% increase in unfilled roles, from a typically high 4.8% to a very high 8.6%. The Retail and Government sectors had lower increases at 3%. The Finance sector had a lower than average 2% increase in open jobs.
Just a “Mix” Variance?
The US economy is very dynamic. Industries with low, medium and high job openings rates in 2006-7 each employed about 45M people. The low job openings rate industries (Govt, Manufacturing, Mining, and Educn Svcs) actually LOST 1.4M positions between 2007 and 2022. The middle rate of job openings industries (Logistics, finance, trade, other) added 2.6% net new jobs (1.7M). The high job openings rate industries (Health, Leisure, IT and Profl/Bus Svcs) added an incredible 10.8M jobs (22%)! The US has moved from agriculture to extractive to manufacturing to services employment. The personal and professional services industries are both the fastest growing and the most difficult to staff today.
What Happens During a Mild Recession?
Business and Professional Services openings drop by 3% of the total or 600K people. Health industry jobs decline by a smaller 1% as they are less sensitive to the business cycle, falling by 100K. Leisure and Hospitality are very understaffed and this is harming their growth. They might trim their employment by 2% or 300K positions. The Retail industry is in a long-run decline, so a 2% decline is likely, eliminating 300K jobs. Manufacturing is more cyclical than other industries, so its labor demand will fall more sharply, 3%, removing 400K job postings. The Government sector is somewhat buffered from recession pressures, so job openings might fall just 1% or 100K. Logistics firms are struggling to deliver, so a 2% job decline is the most I see, cutting another 100K positions. The Finance sector has been less volatile, so I estimate a 1% decline and 100K dip.. The remaining industries are likely to fall in tandem, requiring an additional 400K open jobs decline to meet budgets. This total 2.4M open position trim reduces the balance to 8.8M, far above the 7.1M pre-Pandemic level in 2018-19. I don’t think that the labor market will play its usual role in transmitting/amplifying negative finance, banking, housing, international trade, energy and other disruptions through the American economy.
Summary
The US economy was at “full employment” in 2006-7 with just 4.6M unfilled positions. The extended recovery after the Great Recession delivered an even lower unemployment rate, but it also delivered a much increased 7.1M open positions. The post-Pandemic economy has returned to an amazing 3.5% unemployment rate, but the unfilled position count has climbed to a much higher 11.2M and stayed there. The current 7% vacancy rate is largely driven by 6 of the 15 industries with the highest rates: Leisure (9.8%), Health (8.6%), Profl Svcs (8.6%), Logistics (7.4%), Manufacturing (6.4%) and Retail (6.4%). American business is slowly learning to manage with a tight labor very market. Demand for labor should fall significantly in the future as firms employ greater technology, processes, capital goods and imports.
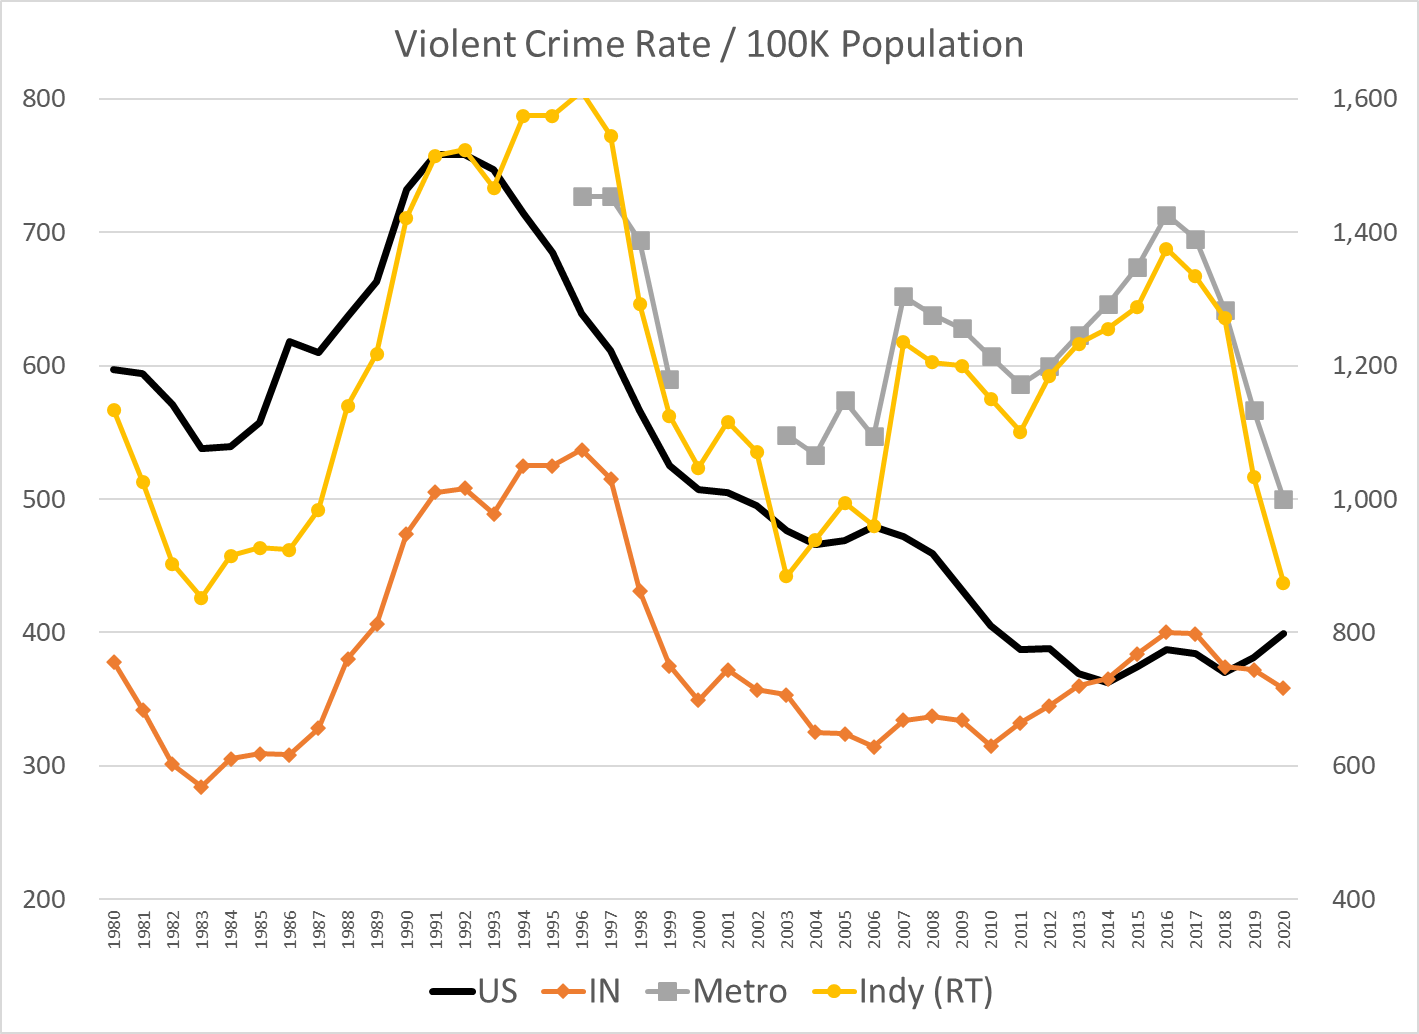
I’m using data from the FBI Unified Crime Reports. Total country violent crime increased by 25% from 600 events per 100,000 people in 1980 to 758 events in 1991 (thick black line). Violent crimes dropped dramatically to 500 events (33%) by 2001. There was a minor decline to 479 in the next 5 years and then another major decline to a minimum of 362 events, a 52% decline from the peak. Violent crime has increased to 399 in 2020, a 10% increase from the 4-decade minimum, but still 47% below the 1991 peak rate. In summary, the total country violent crime rate increased by 25% in the 1980’s, dropped by more than half in the next 25 years and has bumped back up to a level about one-half of the peak and one-third lower than the 1980 start. This is a quite positive result.
Indiana’s (orange line) general pattern mirrors the national figures. However, Indiana started at 378 violent events per 100K people in 1980, more than one-third lower than the national average. This is a quite significantly lower crime rate. Indiana’s violent crime rate increased by a larger 42% to a peak of 537 events in 1996. This was half again faster than the 27% increase for the country as a whole. Indiana was becoming more like the rest of the nation. Indiana’s violent crime rate dropped very quickly to just 349 events by 2000 (-35%), returning to 69% of the national level from 84% of the national level in 1996, a modest amount above the 63% ratio in 1980. Indiana violent crime inched down by 10% to 314 by 2010. The national crime rate was falling twice as fast, so Indiana was now at 78% of the average. In the “teens” decade, Indiana violent crime increased by 10%, returning to where it had been in 2000. National violent crime was flat during the “teens”, ending at 400 events. Indiana violent crime rate was essentially the same as the national rate during the “teens”, no longer one-third lower. It had returned to its starting point of roughly 400 events per year.
The city of Indianapolis (yellow line) is measured by the right hand scale, twice as high as the other 3 measures. Like most central cities, its violent crime rate is much higher than the national average. The Indianapolis crime chart follows the nation from 1980 through 2006. It starts at 1,134 events per 100K people, increases by 42% (like IN) to 1,611 in 1996, then drops by 45% to 884 events in 2003. The city’s violent crime rate is 1.9 times the national average at the beginning and the end of this 23-year period, but peaked at 2.5 times the average in 1996. The crime rate leapt up by 28% in 2007, reaching 2.6 times the national average. Violent crime in Indianapolis grew by 11% by the peak in 2016, 3.6 times the national average. The reported Indy crime rate has fallen by more than one-third in the last four years, ending at 2.2 times the national average. Looking at ten-year averages to smooth out the difficult to interpret variability, Indy has increased from 1.8 to 3.0 times the national average. The last 2 years look suspiciously low, just like 2007 looked suspiciously high. The 1,300 level for most of the last decade is more than 10% below the 1,500 peak level of the 1990’s. So … Indiananapolis violent crime is now down a little compared with the peak, up very significantly compared with the national average and roughly within the range of the first 30 years.
The Indy metro data follows the city of Indianapolis pattern very closely.
The national homicide rate per 100,000 people averaged 9 from 1980 to 1995. It dropped by one-third to just 6 by 2000 and stayed at that level through 2007. It declined to an average of just 5 for the next decade, before spiking up in 2020 (and 2021, FBI official data unavailable). The national homicide rate is up significantly, but one-third lower than in the eighties and early nineties.
Indiana started at an unusually high 9 homicides per 100,000 people in 1980, but averaged just 6 for most of the eighties, just two-thirds of the national level. Indiana homicides jumped quickly to a peak of 8.2 in 1992 and remained near 8 for six years. The national homicide rate fell rapidly from 10 to 6 during the nineties, leading to a six-year period (1997-2002) where Indiana homicide rates were slightly above the national average. Indiana homicide rates closely matched the national average for the next decade, falling to 5 in 2008. Indiana homicides increased by 50% between 2014 and 2020, from 5.0 to 7.5 while the national average increased about 50% from 4.4 to 6.5 events per 100K people. Indiana has averaged about 6 homicides per 100K people during this 4-decade period except for the 8 homicides rate in the mid-nineties. The most recent murder rate has returned to that peak level.
The city of Indianapolis very closely matches the Indiana pattern for the first two decades, with 12 homicides per 100K people in 2000, about double the national average of 6. The Indy rate pops back up to 14.2 in 2001 versus the 5.6 rate for the country (2.5 times higher). Indy follows the slow national decline through 2012 to 11.6 events versus the 4.7 country level (2.5X). Indy’s murder rate jumped 31% to 15.2 in 2013, and has climbed steeply since then. It reached 19.5 in 2019, a two-thirds increase in 7 years. It jumped again in 2020 to 24.2 and is estimated to be more than 28 in 2021. Indy averaged about 14 murders per 100,000 people in the first 32 years of this period. 2019 was a 40% increase. 2020 was a 73% increase. 2021 is a doubling.
The Indy metro area pattern follows the city of Indianapolis. Metro Indy’s homicide rate averaged 1.35 times the national rate from 2003-2011. It has averaged 1.76 times the national average from 2012 to 2020.
Summary
Indianapolis has a huge violence and murder problem. Period. Violence at the national level is way down. Murders at the national level are much lower than the peak period. Indianapolis’ violence rate shot up in 2007 and only declined in the past 2 years. Indianapolis’ murder rate shot up in 2013 and has continued to climb. I try to highlight the “good news”. I emphasize long-term data to provide context. I try to minimize/offset the sirens of local and national journalists. But, for this topic, there is no apparent “silver lining” or “on the other hand” conclusion.
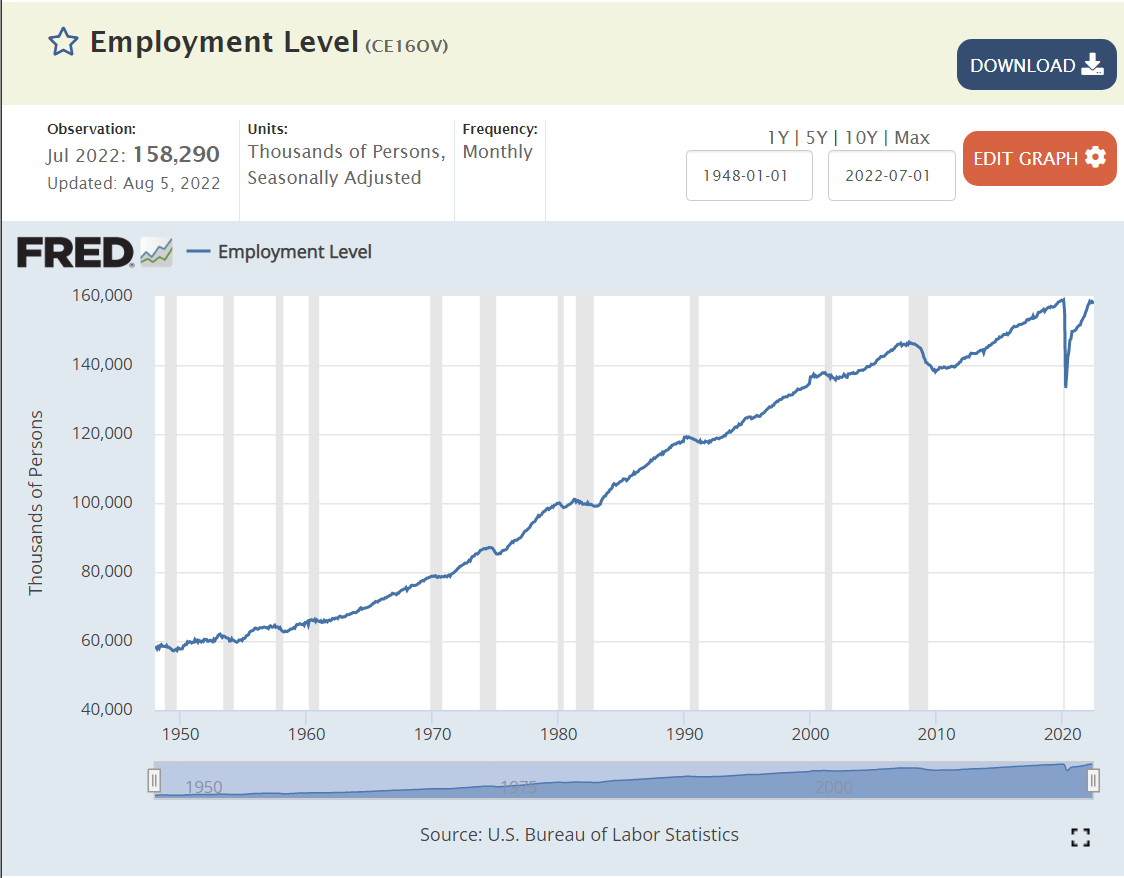
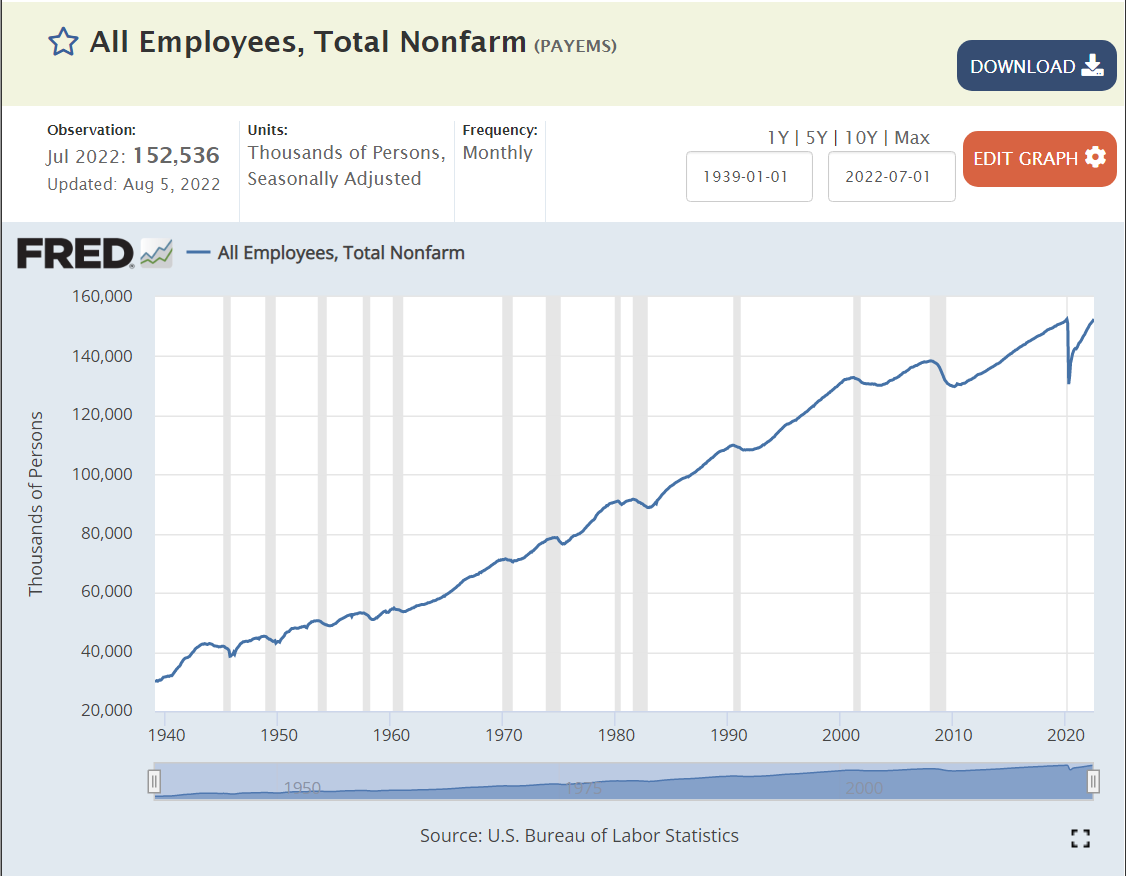
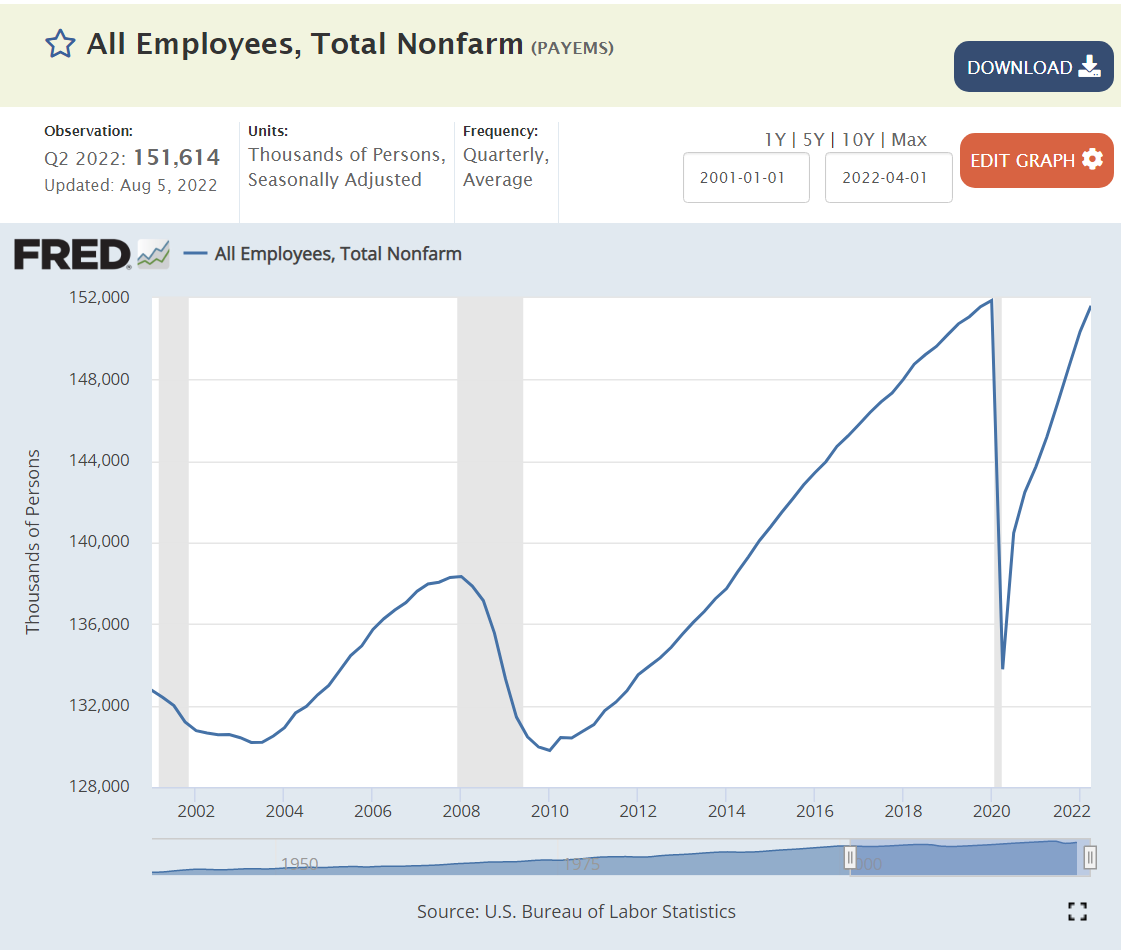
US labor force employment grows and grows. 60M employed in the very glorious 1950’s. 80M by the end of the dynamic 1960’s. 100M by the end of the transforming 1970’s. 120M by the end of the conforming 1980’s. Not quite 140M by the turn of the millennium (2M shy). Just 140M at the end of the “oughts” decade. 158M before the pandemic, resuming the 20M new jobs per decade record of the sixties, seventies, eighties and nineties in the teens decade.
That is 100 million net new jobs added in my lifetime. 160M, up from 60M.
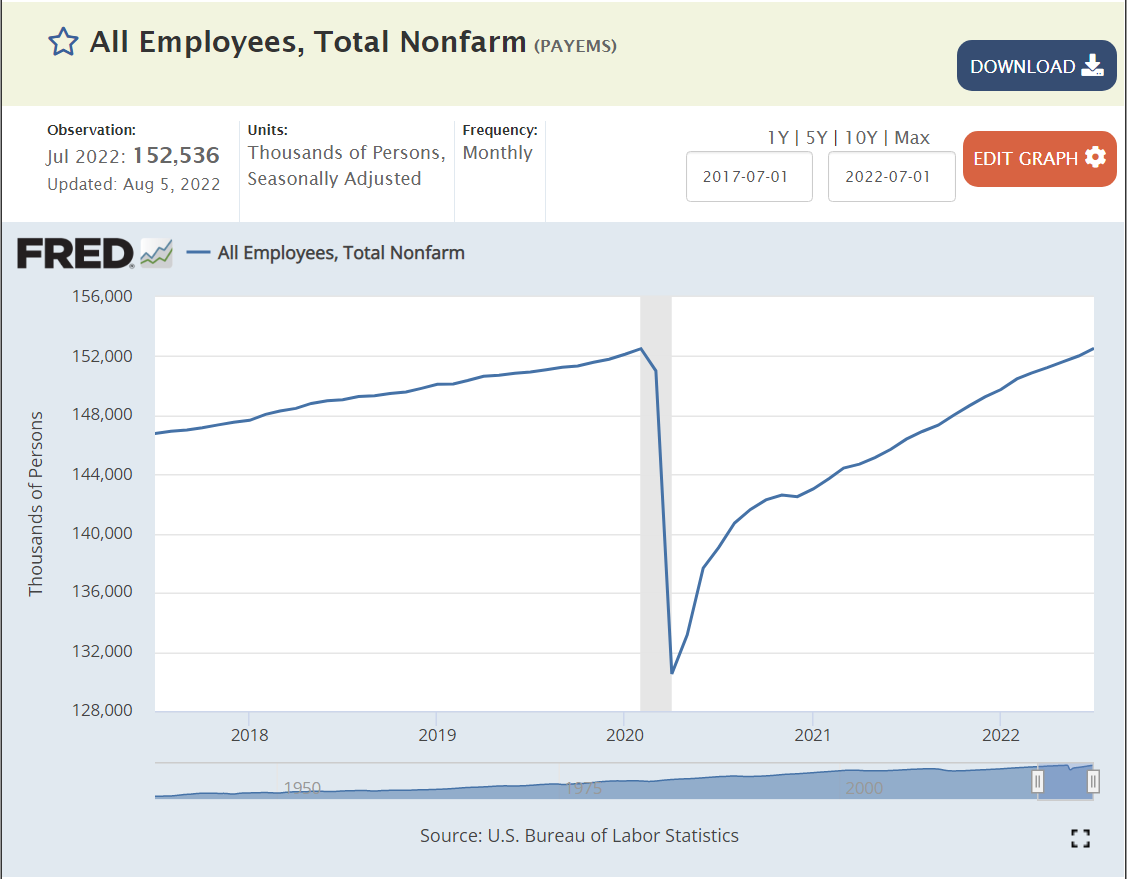
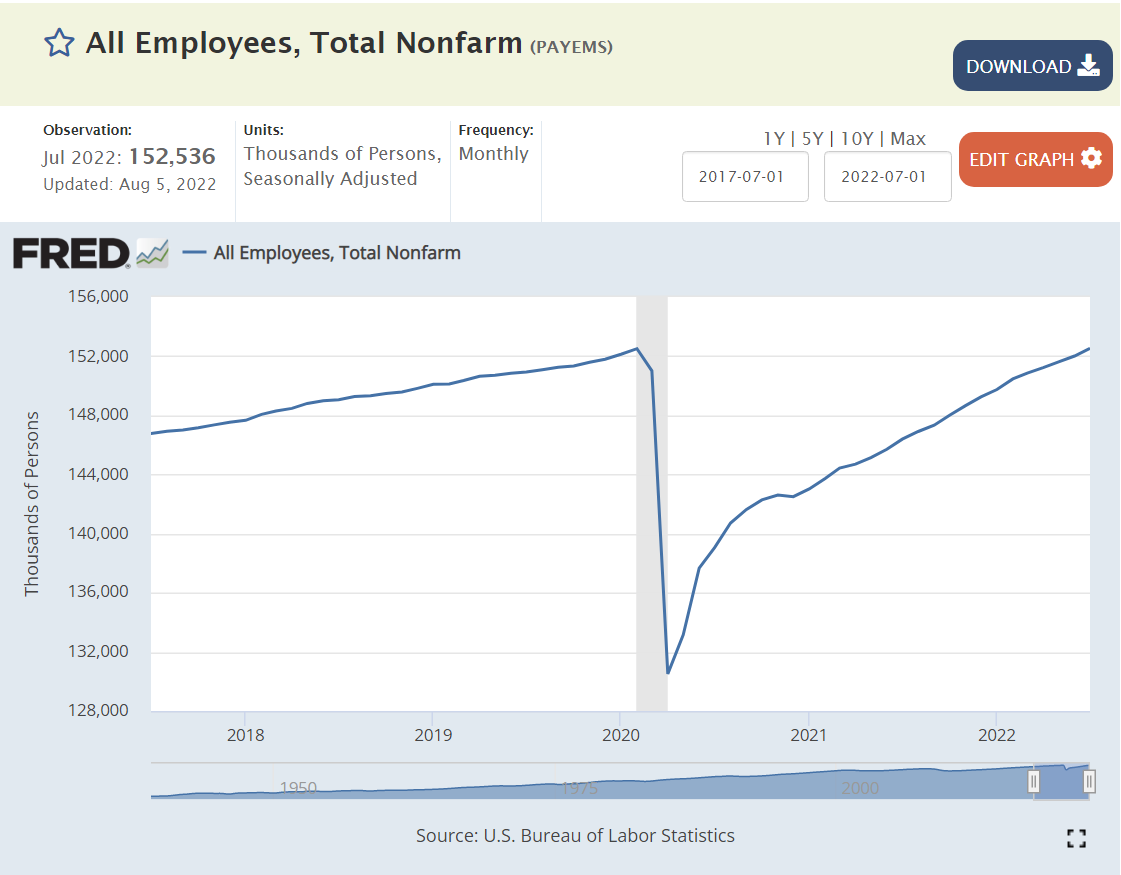
A once in a century pandemic? No problem. 27 months later, total employment has been recovered, despite a 20M worker decline! Set aside politics. This is an amazing result for the US labor market, businesses and citizens.
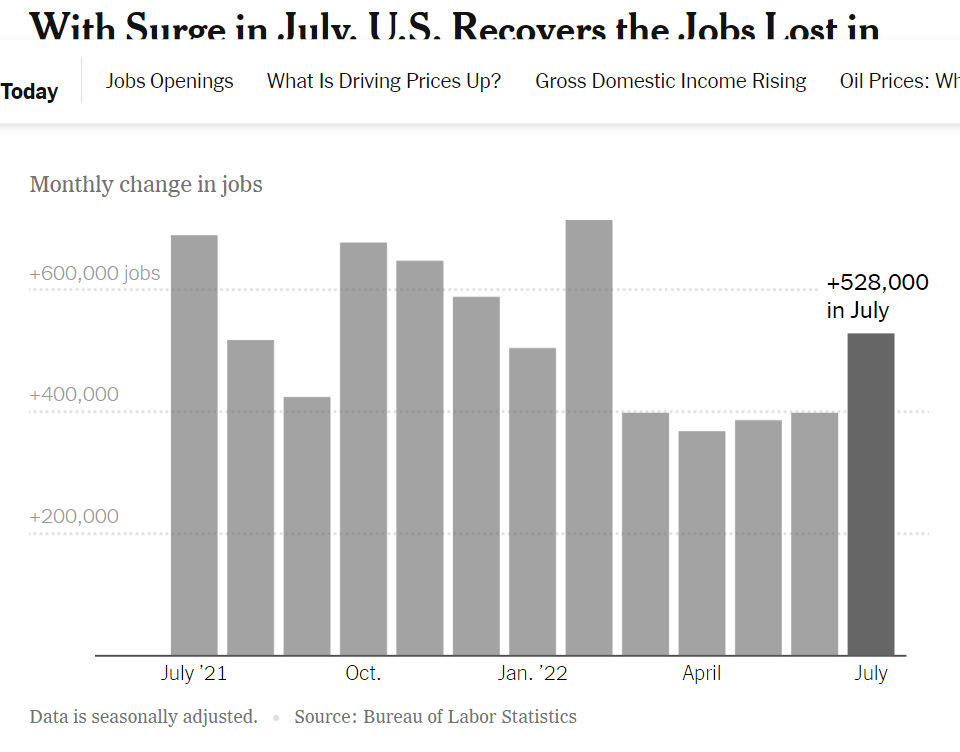
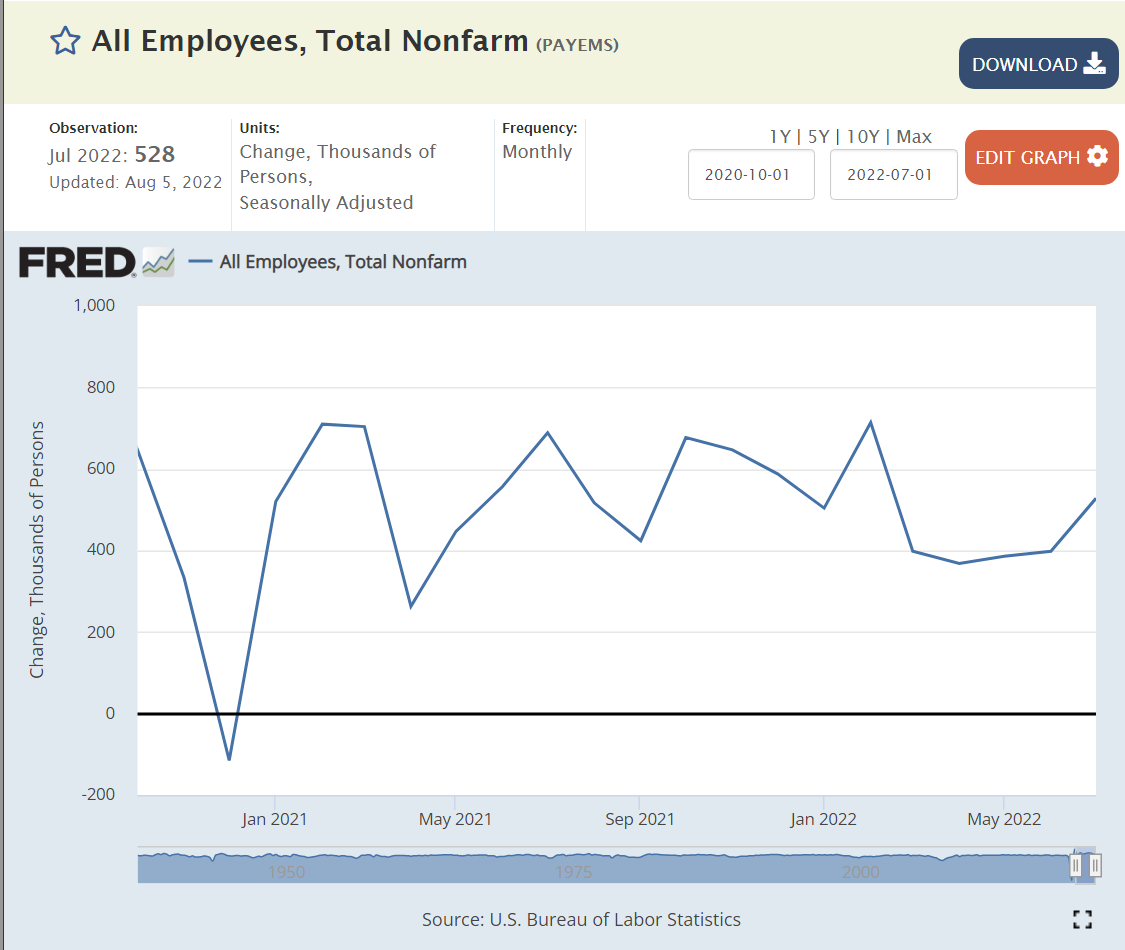
US economy continues to add about 400,000 jobs each month. This is almost 5M jobs per year, more than twice as fast as the usual 2M jobs per year in recent history.
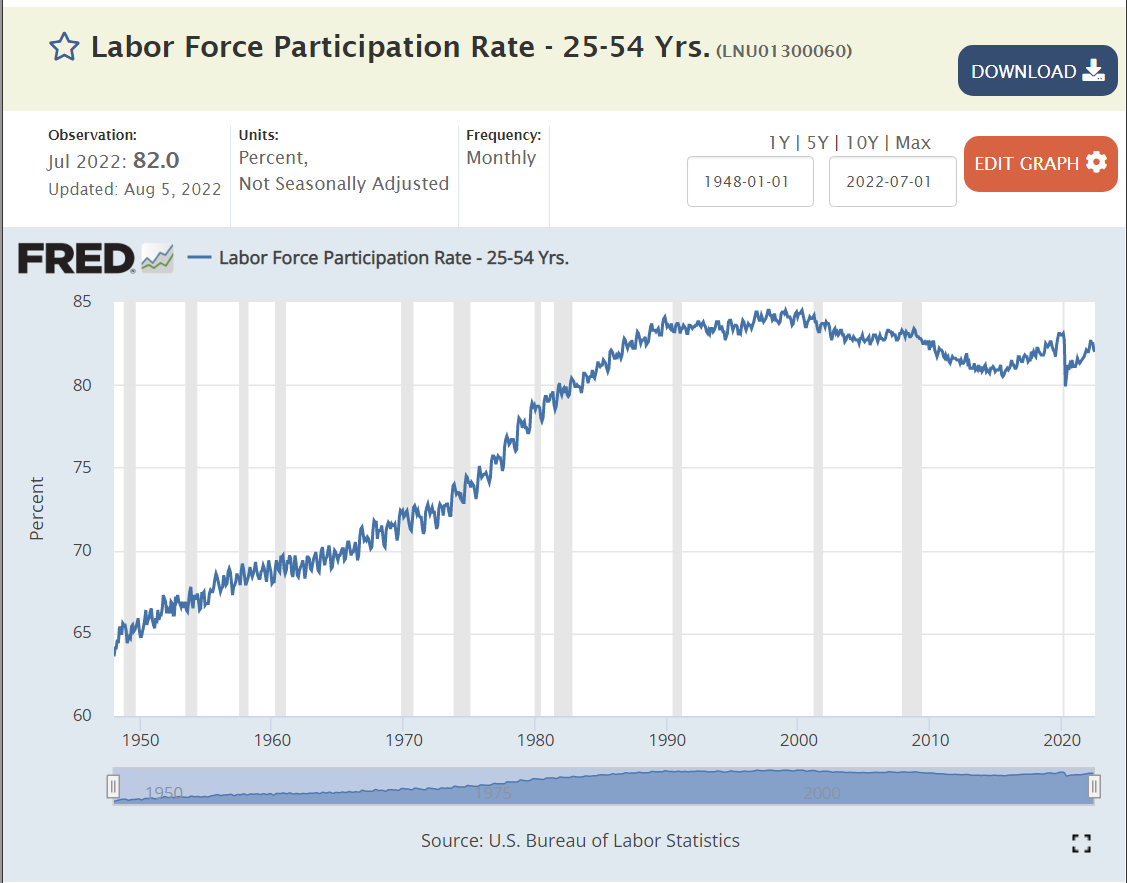
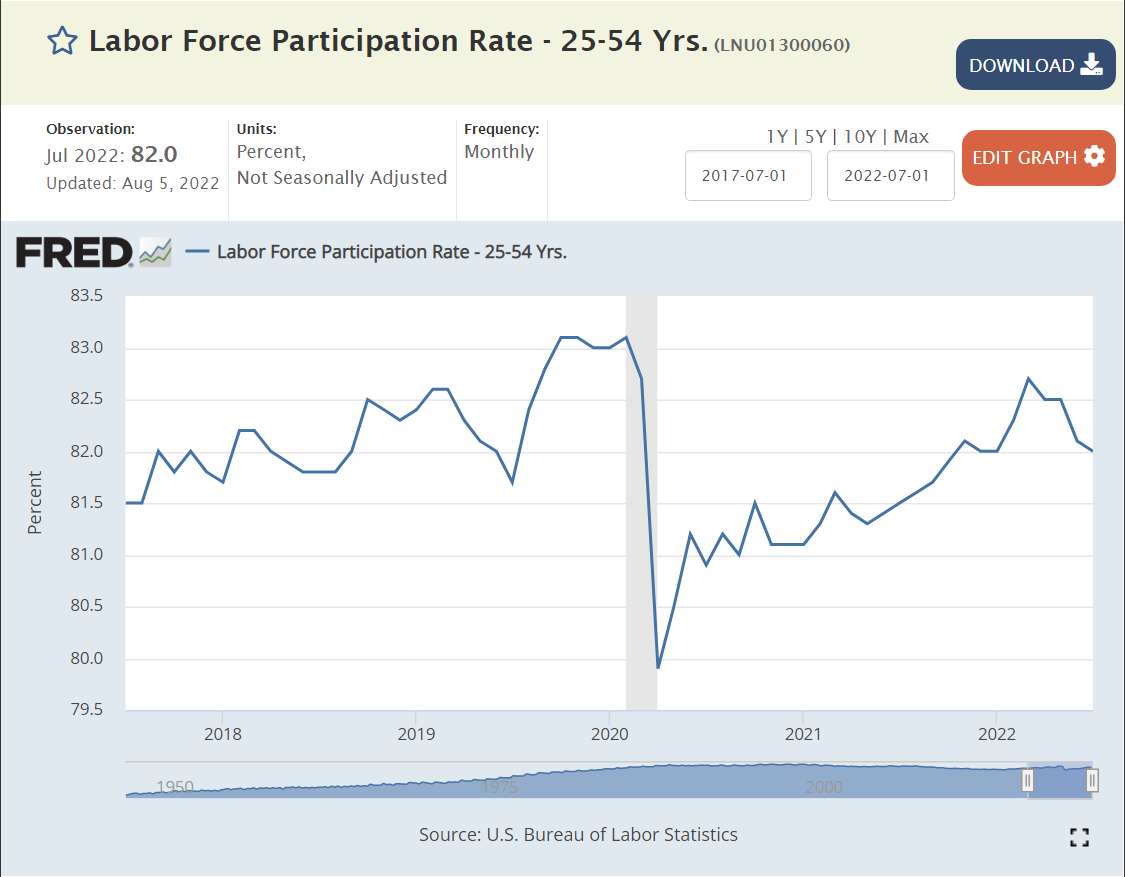
The labor force participation rate for prime aged individuals (25-54) increased from 65% to 84% between 1950 and 1990 as women were accepted into the labor force. 84% was maintained for a decade and 83% for the next decade. The teens decade saw a decline to 81%. The market has remained in the 81-82% participation rate range.
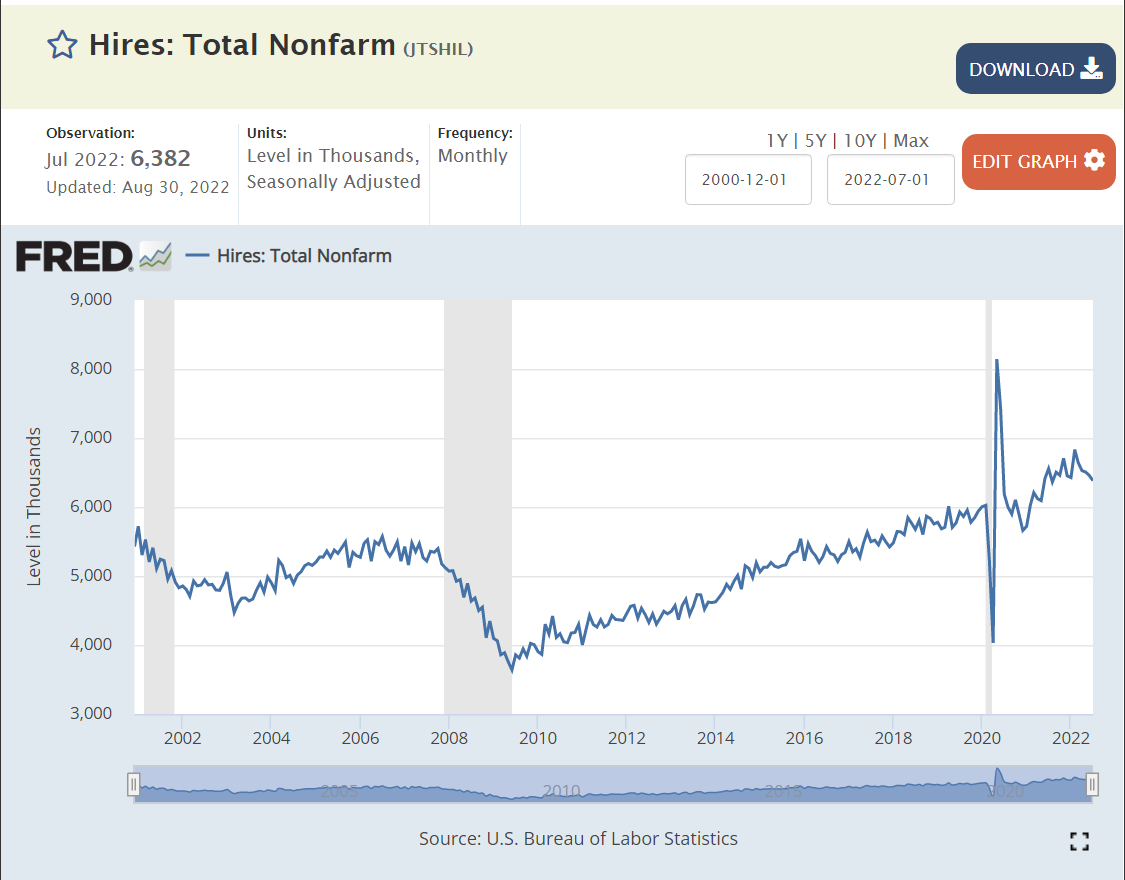
New hires averaged 5M per month in the slower growth “oughts”. New hires dropped further to just 4M per month after the Great Recession. New hires slowly built up to a new record level of 6M per month before the pandemic arrived. The pandemic had just a minor impact on new hires, with a record 6.5M new employees being hired each month in late 2021 and 2022.
Voluntary quits averaged 2%, 1 in 50 employees, during the first decade of the 21st century. Quits dropped sharply to just 1.4%, just 1 in 70 employees, in the 3 years afterwards. The quit rate slowly returned to “normal” by 2016 and climbed further to 2.3% as the economic recovery continued for a full decade.
By October, 2021 quits had returned to the solid pre-pandemic rate of 2.3%. The quit rate jumped up to 2.8% by April, 2021 and has remained at this historically high rate.
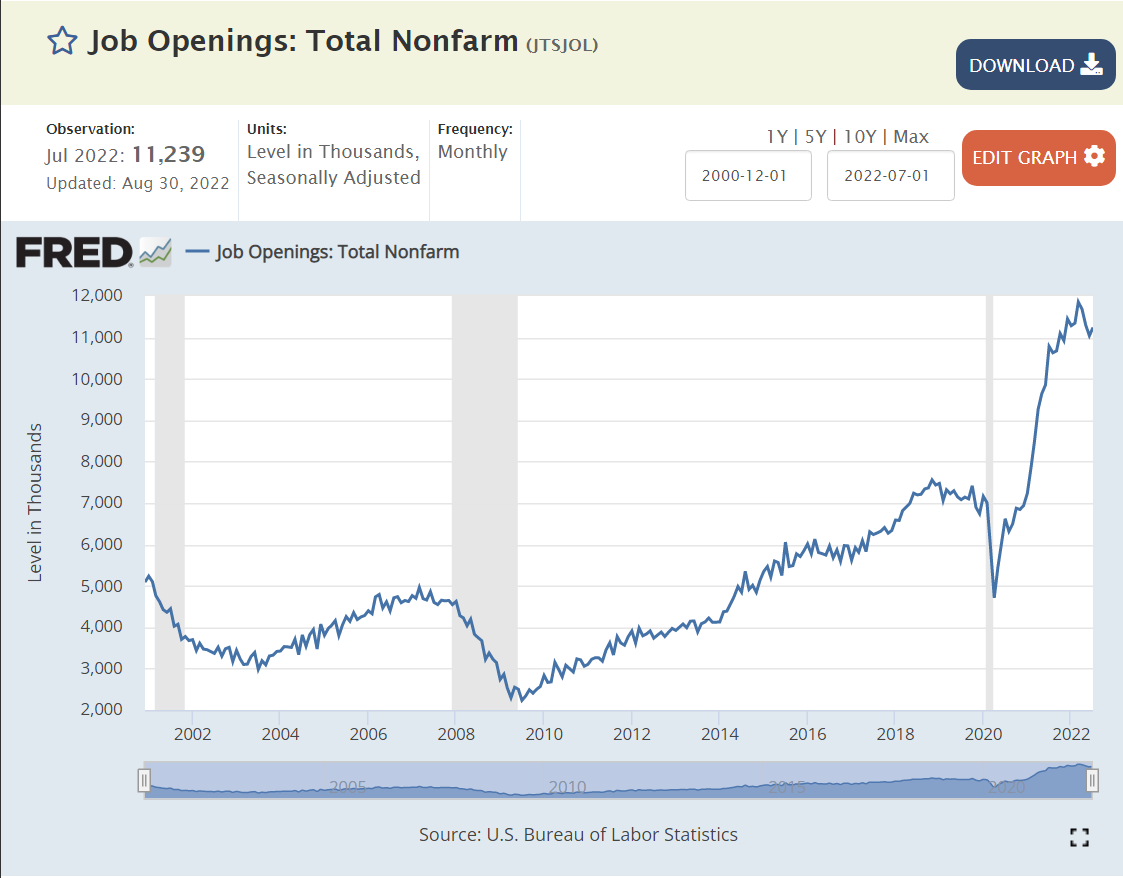
Job openings averaged 4M before the Great Recession. They dropped below 3M during 2009-13. They increased to 5M in 2014 and to 6M by 2016. They remained at the 6M level during 2017, before climbing to 7M for 2018-19. By Jan, 2021 job openings had recovered to 7.2M. By October, job openings had increased to a historic 11M and have remained at this unprecedented level.
This is a greater than 50% increase in open positions since before the pandemic, just 29 months ago. This is 120% more than the peak level before the Great Recession.
Most Important Measure
Profit maximizing businesses, managers and HR departments work through internal processes to list/post a job opening only when:
It’s within the annual financial and headcount budget.
Hiring managers conclude that current staff are unable to serve current demands from internal and external customers.
Hiring managers and financial analysts believe that the incremental hired employees will generate incremental measurable profits.
Hiring managers believe that they can hire new staff using existing processes to fill well defined positions.
Hiring managers believe that it is worth their time to go through the firm’s hiring process.
Hiring managers cannot find an “adequate” labor source through stretching existing staff or using temporary, contract, supplier or agent work forces.
11M job openings means that firms believe that they can generate material incremental profits by hiring up to 11M new employees.
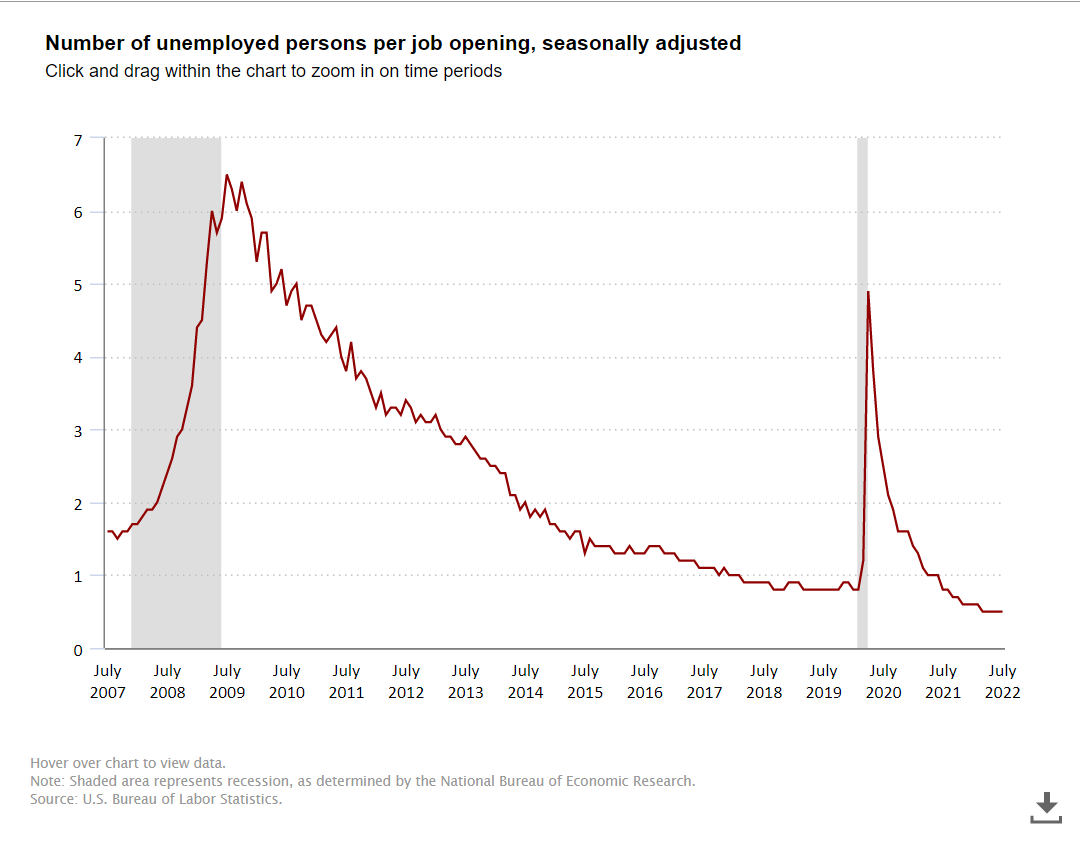
11M open jobs is a startling number, but the ratio of unemployed persons to open positions is much more important. The Great Recession created a 6 applicants per job market. This declined to 2:1 in 2014. During the historic extended expansion it declined to just below 1:1, an unprecedented low number. The ratio fell below 1:1 in 2021 to the current 0.5 level. Two open positions for every unemployed job seeker.
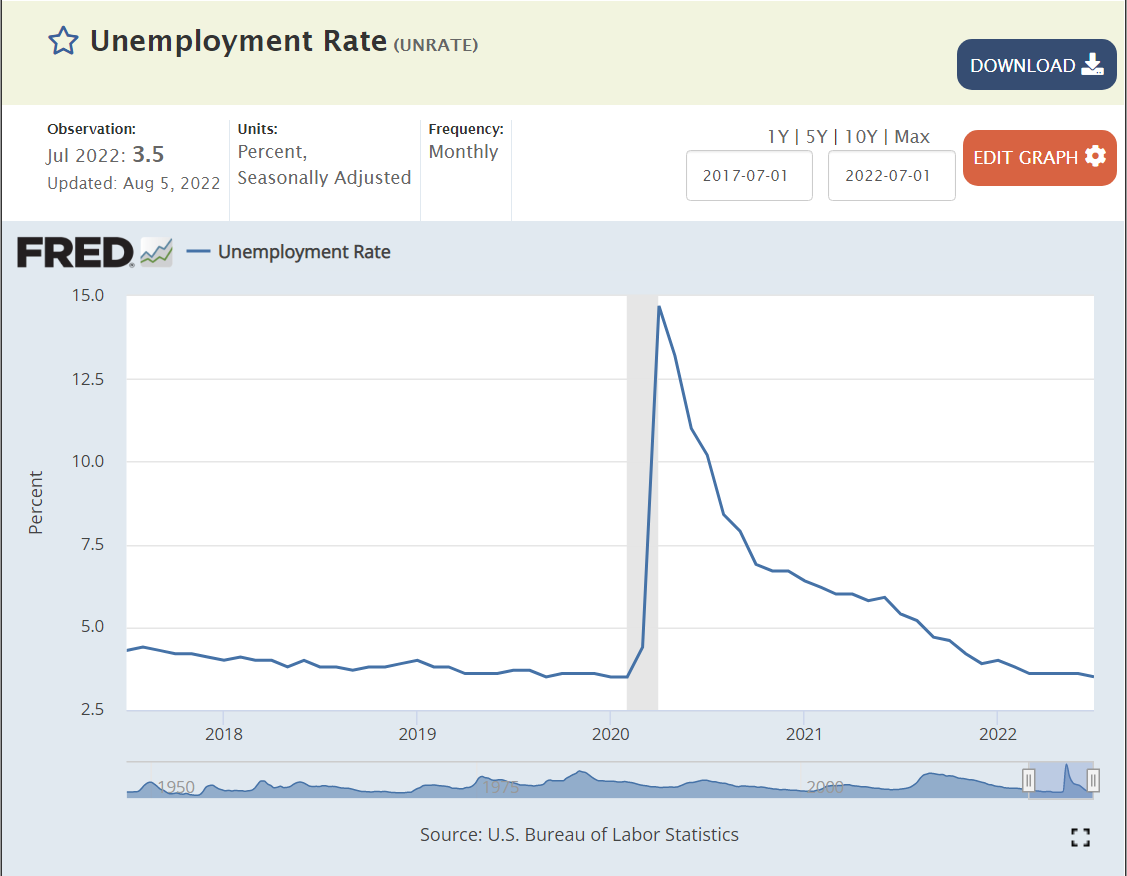
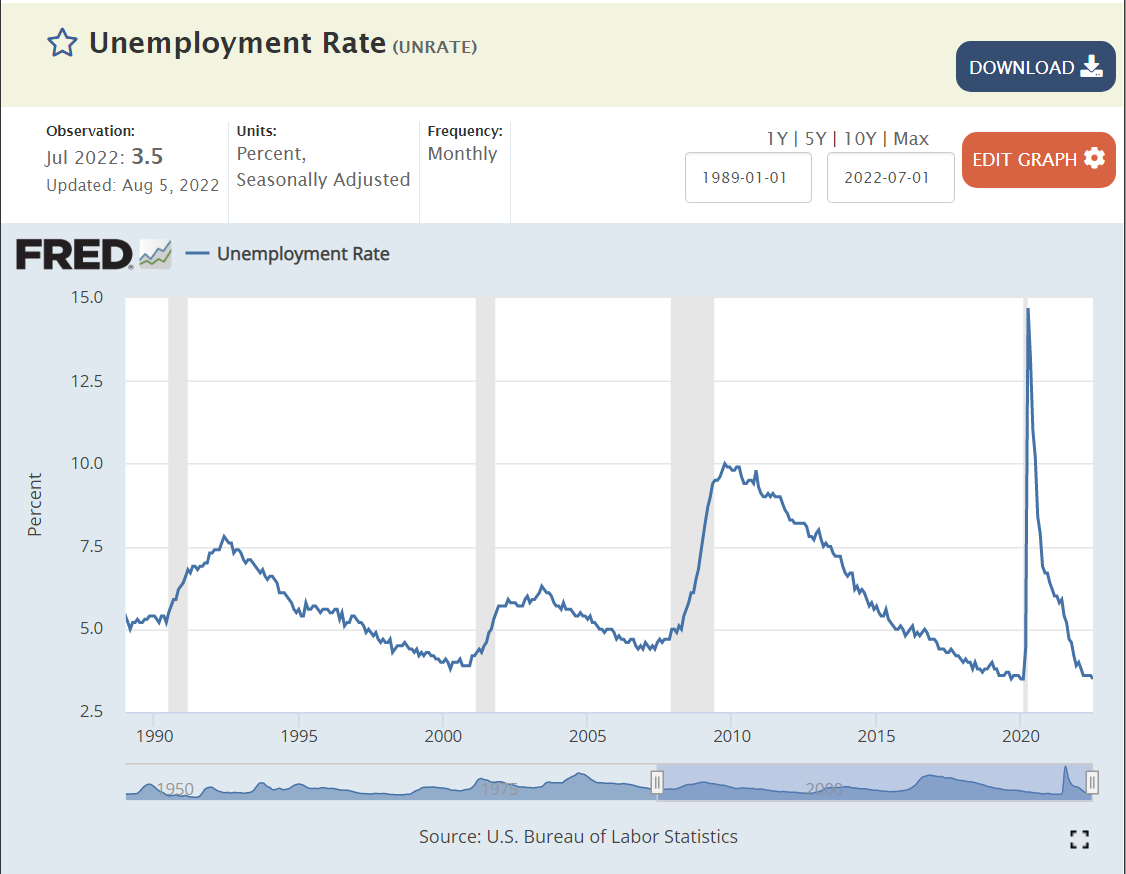
Unemployment was quickly driven to the pre-pandemic record low of 3.5% this summer. Unemployment was below its usual minimum of 5% for 5 years just before the pandemic, leading most economists to recalibrate the “non-accelerating inflation rate of unemployment” (NAIRU) down to 4% or slightly below. This is a very efficient labor market.
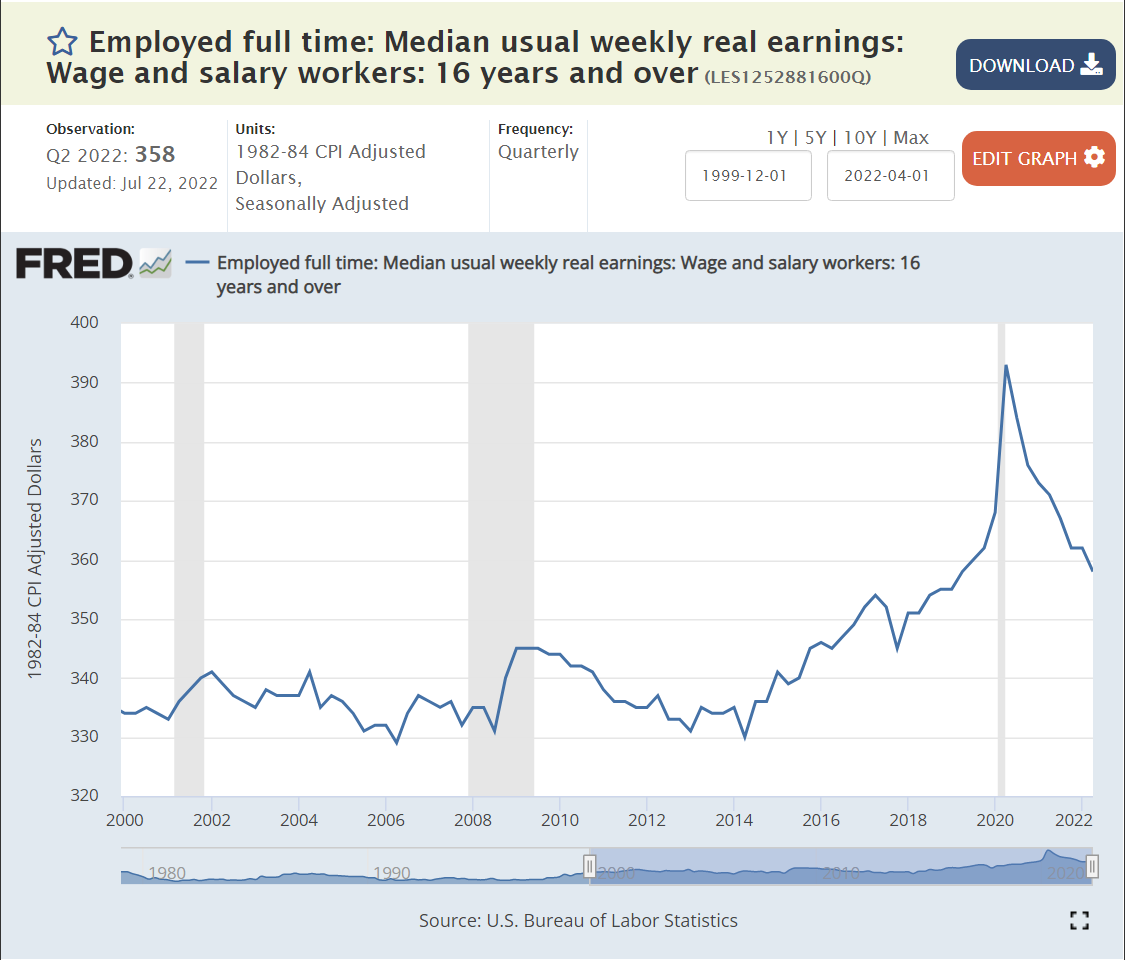
Real (inflation-adjusted) wages have reflected this labor market situation. They remained at the $335/week level from 2000 through 2014, reflecting the slow growth of employment and GDP. Wages began to raise in real terms in 2015, reaching $360 by 2019, a 7.5% real increase. Wages were growing rapidly just before the pandemic and climbed to $390/week in the second quarter of 2020, an additional 8% increase in a few months. Real wages have since declined back to the $360 per week level as high inflation has offset higher than usual nominal wage increases. Firms have chosen to live with 11 million open positions rather than increase real wages.
Summary
Firms have 11M open positions that they believe will help them to make greater profits. Real wages are the same as they were just before the pandemic started. Firms have chosen to not increase hiring and regular wages any faster because they judge that this will cost them more profits than allowing 11M positions to remain unfilled. This is the first time in at least 50 years that firms have had to manage a labor market where employees and applicants have some market power. Despite this “standoff” in the labor market, total employment is back to the pre-pandemic level, firms are hiring record numbers of employees and labor force participation is recovering towards the pre-pandemic level, which was at a 10-year high. The overall economy has clearly slowed its growth rate to near zero, but the labor market remains in a very positive state for workers.
Lower environmental standards. Withdraw from Paris climate deal. Methane limits. Wetlands. Vehicle milage and emissions standards.
New limits to welfare benefits: Medicare and SNAP.
Antitrust investigations for telecommunications, media, internet, network advantaged firms.
Increased use of Congressional Review Act (1996) to allow Congress to vote down newly implemented regulations.
Economic recovery continued for 3 more years. 2.5% annual growth. 3.5% unemployment. Stock market gains. 6.5M jobs added. Tighter labor market. Increased wages. Minority and lower income gains.
Bipartisan Covid relief spending for individuals and firms.
Home building increased during Trump term and afterwards.
More “Middle Americans” believed that they were heard and represented.
NAFTA agreement renegotiated.
China relations re-evaluated. Higher tariffs on both sides. Technology limits.
Presidential “bully pulpit” used to maintain some US jobs.
Legislation and executive orders used to support US steel, coal and manufacturing businesses and employment.
Legislation passed to improve visibility to tax shelters and tax fraud enforcement.
Agriculture industry subsidies offered to offset trade costs.
Trade deals with South Korea, Japan and EU.
Enhanced trade policy for communications, IT, technology and AI.
Increased military spending.
Revised defense strategy focused on China and Russia.
Flexed US military muscle in limited attacks.
Actions reduced Islamic State threats to low level.
Supported Israel diplomatic relations with 4 Arab states.
US troops withdrawn from Afghanistan, Syria and Iraq.
Opposition to dictators in Cuba, Venezuela, China and Nicaragua.
Reduced support for international organizations such as WHO.
Built 80 miles of new wall and 300 miles of enhanced walls on Mexico border.
Negotiated improved coordination with Mexico and Central American nations regarding immigration.
Reduced legal immigration from all countries.
Reduced opportunities for asylum seekers.
Used “zero tolerance” family separation policies to disincentivize immigrants.
Removed Affordable Care Act individual mandate.
Streamlined FDA approval process and made financial commitments to ensure rapid COVID vaccine development.
Took steps to reduce drug price inflation.
Invested in opioid drug addiction prevention and correction.
Enacted market friendly policies and regulations to expand domestic energy development, furthering American energy independence.
Supported the bipartisan First Step Act which reduces minimum sentences and supports recovery from incarceration.
Invested in historically Black colleges and universities and vocational education (Perkins).
Made small steps to support “school choice”.
Appointed 3 conservative Supreme Court justices and 225 federal justices.
Trump Presidential Results
Economic Policy
Deficit spending is permanently entrenched. 3-5-7% annual budget deficits do not appear to have major economic downsides in investment crowding out or inflation.
Tax cuts do not generate extra growth, investment, productivity or economic resiliency. They transfer dollars to the recipients.
Concentrated supply chains (China) are subject to significant trade, logistics, military and emergency risks which must be managed.
Foreign Policy
U.S. remains the leading superpower and can pursue its own goals with less allied cooperation and attention to “niceties”, at least in the short run. See NATO, Japan, Korea, climate.
China is the number one competitor.
U.S. and Russia relations are no longer based on Cold War issues. The “Hawks versus Doves” dimension competes with domestic political parties.
Negotiating with nuclear states (Iran, North Korea) is very difficult, even for a superpower.
Europe has its own international interests. It will pursue them. It cannot rely upon the U.S. for its defense.
Domestic Policy
Bipartisan immigration policy may be impossible.
Supreme Court and judicial politicization may drive structural changes/reforms.
Racial relations and inequality will be a top political issue for decades.
Wedge issues – abortion, guns, school content/choice, liberty, gay rights – will remain a focus of both parties.
Traditional social security, Medicare and Medicaid are untouchable.
Obamacare is now essentially untouchable. Lower income citizens will have health insurance.
Democracy at Risk
Legitimacy of media, press, free speech threatened.
Government employees, courts, justice system, law enforcement threatened.
Schools, universities and teachers threatened.
Legitimacy of voting processes threatened.
Illiberal democracy, authoritarianism have more support.
Gerrymandering, voting rules, campaign funding rules undercut public confidence.
Voter participation has increased in response.
Communications Policy
Media attention is priceless and can be manipulated by extreme statements and behavior.
Traditional media “fairness” approach (quotes from both sides) can be manipulated to support unsupportable claims.
Every media outlet or actor has some degree of bias. Consumers are more aware, but many choose to only reinforce existing beliefs.
The president has the opportunity to control/influence the attention of the media.
Facts and objectivity are not respected by some media voices. The pattern of communications statements and framing of subjects can be much more important than content.
Political actors are not held accountable for false claims or exaggerated promises. Claims and promises are just tools to motivate the faithful.
Rules of Politics
President has tremendous power. International agreements. Regulations. Executive orders. Bully pulpit. Political party discipline. Using power seems to have little downside.
Only winning matters. Not popularity, broad support, bipartisanship, appearances, fairness, mud, litigation, critics, impeachment, norms, tradition or relations.
Polarization strategy is more effective than building a central coalition. Motivating your team to vote is more important than persuading independent voters.
Candidate character does not matter. Politicians are salesmen and saleswomen. They are lawyers. They are tools, not statesmen.
Party/team winning is most important factor. 400,000 covid deaths were not enough to spark a revolution. Deaths were traded off against economic opportunity without negative political impact.
Harry Truman’s “buck stops here” responsibility position is not required. No one was responsible for Covid results.
Administrative competence is not required to hold office or to run the federal government (so far). Slow appointments, fast cabinet turnover, acting secretaries, department heads that oppose the role of their departments.
President represents his team and interests, not the whole country.
Party Policy
Philosophical conservatives have departed the Republican party and lost influence.
Moderate Republicans (RINO) have mostly departed, have no political candidates and no influence in the national party.
Extremist groups (race, religion, military, nationalist) are not opposed.
Traditional business interests have much less influence (immigration, social issues, antitrust, trade limits, industrial policy, presidential threats, banking, bailouts).
Pragmatic policies and legislation remain largely unimportant. No party platform for 2020. Everyone in the party “knows” basic positions on all issues. No budget policy debates. No health care alternative to Obamacare. No abortion policy. Statements of preference and intent and belief are more important than wonkish details.
Highlighting the threats and follies of the most leftist Democrats is the most effective means to motivate true believers and maintain support of more independent minded voters.
Only a few federal level policies really matter. Tax and regulation cuts. Social wedge issues. Most other topics can be “managed” with small policy victories and messaging.
Party discipline is essential. Republicans are obligated to support the political winners in their party, not to represent all Republicans or all Americans or to “solve problems”.
Managing the voting system (districts, rules, methods) is as important as policies, candidates, fundraising and communications strategies.
Summary
Trump has revolutionized modern American politics. The Reagan revolution consolidated conservative voters, clearly aligning them with the Republican party. The Gingrich revolution further separated the two parties, emphasizing winning and party allegiance. Republican candidates and voters engaged in a reinforcing cycle of “purist” policy aims such as no tax increases, “drill baby drill” environmentalism, banning abortions, and “bomb baby bomb” anti-terrorism. The Great Recession and the tea party further motivated populist leaning voters to demand populist policies and appeals. Trump modified many historical Main Street and Wall Street Republican policies to make the party better embrace the populist mood and “make American great again”.
Trump’s “only results matter” approach has further transformed the party and the nation. His presidency delivered some key political accomplishments. It also produced many “results” that will shape American politics, economics, society and debate for years to come.
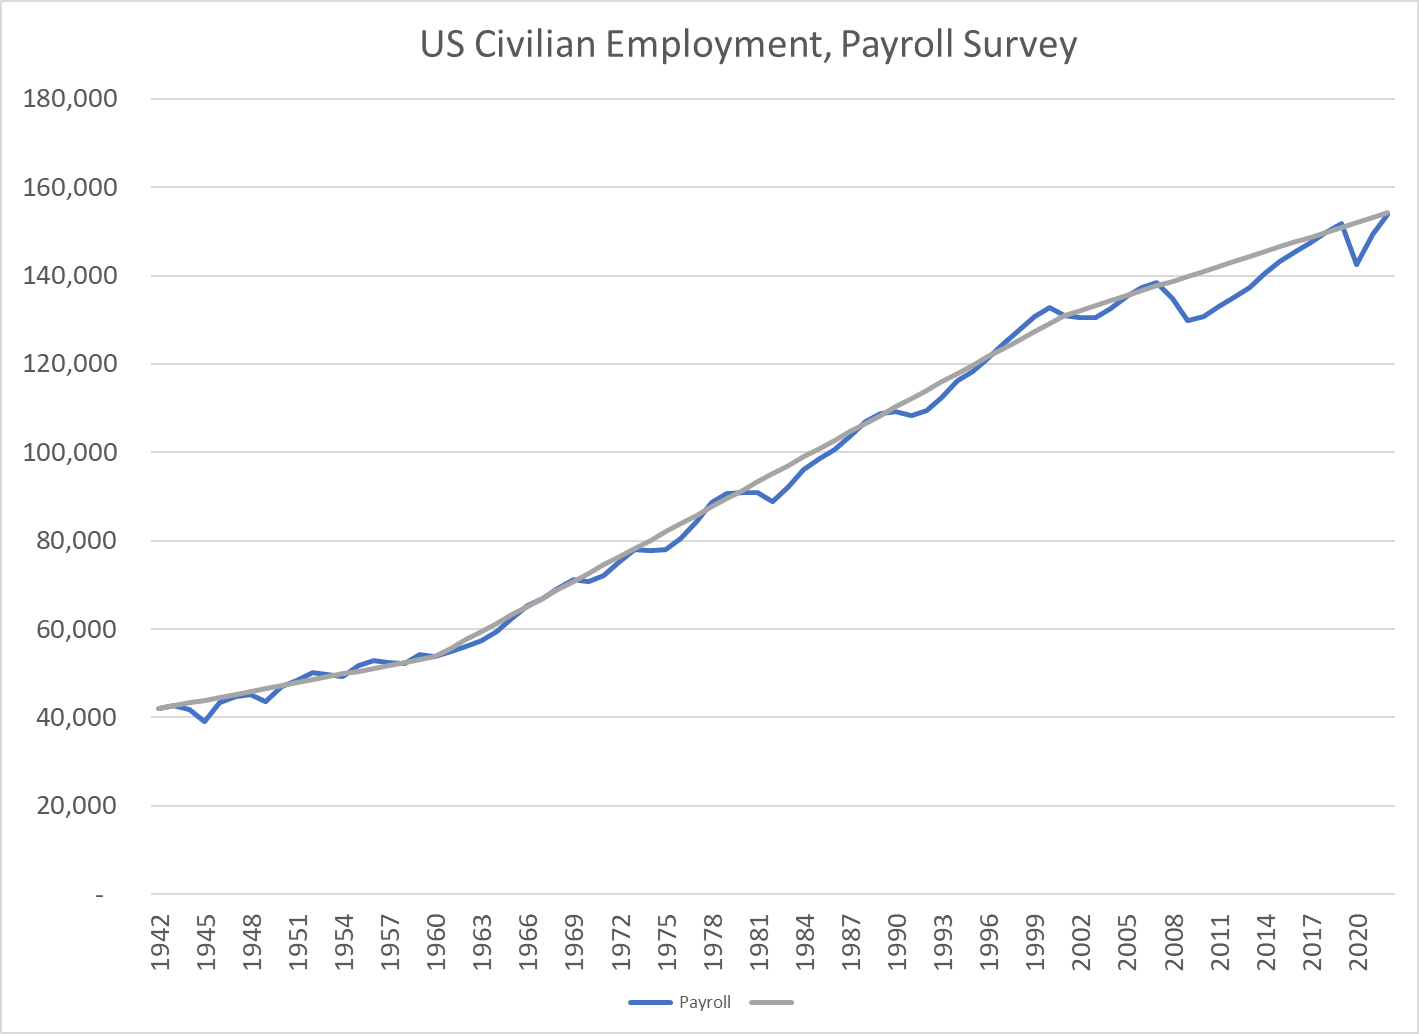
In 1942, the US economy employed 41.9 million people in firms. At the end of 2022, the number will be 153.8 million, an increase of 267%. Yes, for very 3 jobs in 1942, we have 11 today. Yes again, almost 4 times as many in 2022 versus 1942, despite the 9 million jobs lost in 2008-9 and the 9 million jobs lost in 2020.
The US economy added 12 million jobs between 1942 and 1960, growing from 42 to 54 million positions. Job growth averaged nearly 700,000 per year or 1.4% annually. This was a period of solid growth, despite the 4 recessions.
The period from 1960 through 2001 showed truly remarkable job growth. The economy added 78 million jobs, almost 1.9 million each year or 2.2% annually. STOP and think about this. The Greatest Generation, WW II saving the planet team was just 40 million employees in the US. The immediate post-war boom increased employment to 55 million when the US was the only advanced economy running at full speed. But employment growth accelerated from 1960 to 200. These 4 decades essentially tripled the size of the US economy.
Overall, the last two decades have delivered much slower job growth. Using 2019 as an ending measure, the economy grew by 21 million jobs, from 131 to 152 million since 2001. This is just 1.1 million per year, or a growth rate of 0.8%, far below the 2% plus rate of 1960-2000. Or, the 21 million added jobs is one-half of the jobs in 1942 in the heart of WW II.
But, these two decades experienced the post-millennium downturn, the great recession and the covid pandemic.
The economic recovery from the millennium (Y2K) was quite slow. The recovery from the Great Recession was slow but strong and extended, allowing unemployment rates to eventually reach 3.5%. The recovery from the pandemic situation was much faster than expected, reaching pre-pandemic levels of GDP and employment within 2 years.
The economy has been adding 400,000 jobs each month since the beginning of 2021, almost an amazing 5 million jobs annually.
Million Jobs Added Per Year in Economic Recovery Periods
1948: 2.0
1952: 2.2
1956: 1.8
1959: 2.0
1969: 1.9
1973: 2.4
1980: 2.2
1990: 2.5
2000: 2.7
2007: 1.6
2019: 2.2
The US economy adds 2 million jobs each year when the economy is expanding. The percentage growth rate is slower through time, but the 2 million jobs added each year remains a solid capacity or capability.
Summary
The US economy added 1.4% new jobs annually from 1942-1960. The jobs growth rate averaged a very strong 2.2% from 1960-2021. It then slowed to just 0.8% annually while digesting the Great Recession and the COVID pandemic. The economy added more than 2 million jobs each year after the Great Recession, pushing unemployment to a very low 3.5%. The economy rebounded from the pandemic much faster than the consensus view,
declining shares for agriculture, mining and manufacturing
greater outsourcing of corporate functions
greater share of contracting, non-traditional employment, part-time employment
lower rates of geographic mobility
lower rates of economic upward mobility
greatly increased political polarization at the state and local level
decreased labor force participation rates
increased opioid and drug damage rates
lower community service participation rates
lower church attendance and membership rates
lower male college attendance and graduation rates
Despite the very many headwinds, the US economy is still able to add 2 million jobs annually during economic recovery periods. It added 9 million positions in 2021 and looks to add almost 5 million positions in 2022 despite the weakening business cycle. Even with a slowing economy, the US is likely to add 2 million new positions in 2023 and 2024.
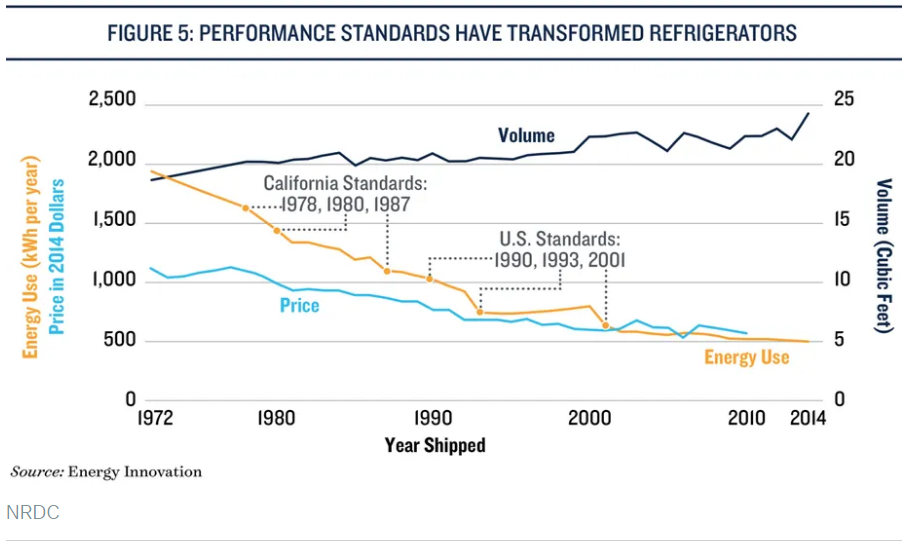
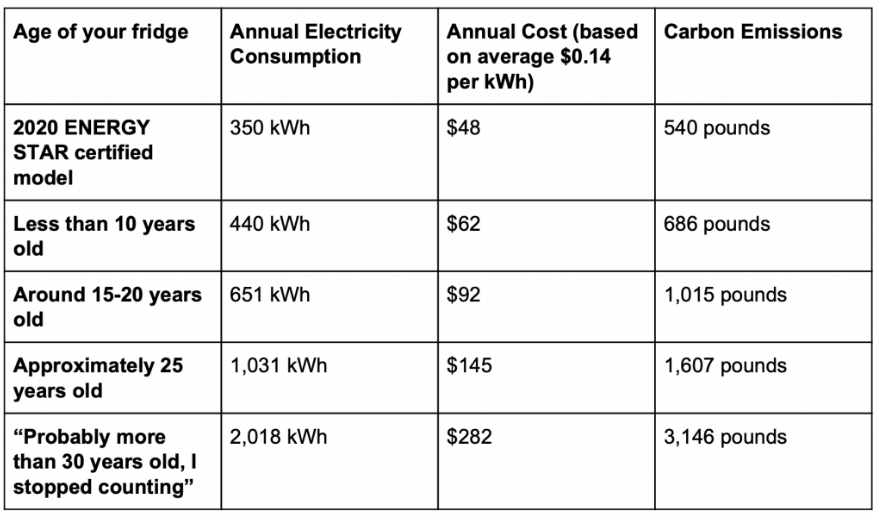
The US Dept of Labor does not publish a consumer price index specifically for refrigerators, but the category it belongs in showed essentially zero nominal inflation between 1994 and 2018. The real price decline shown in the first chart probably continued through 2018.
Refrigerators and appliance prices spiked by more than 10% in 2021 as consumer demand for durable goods grew 20% during the pandemic, supported by government transfer payments.
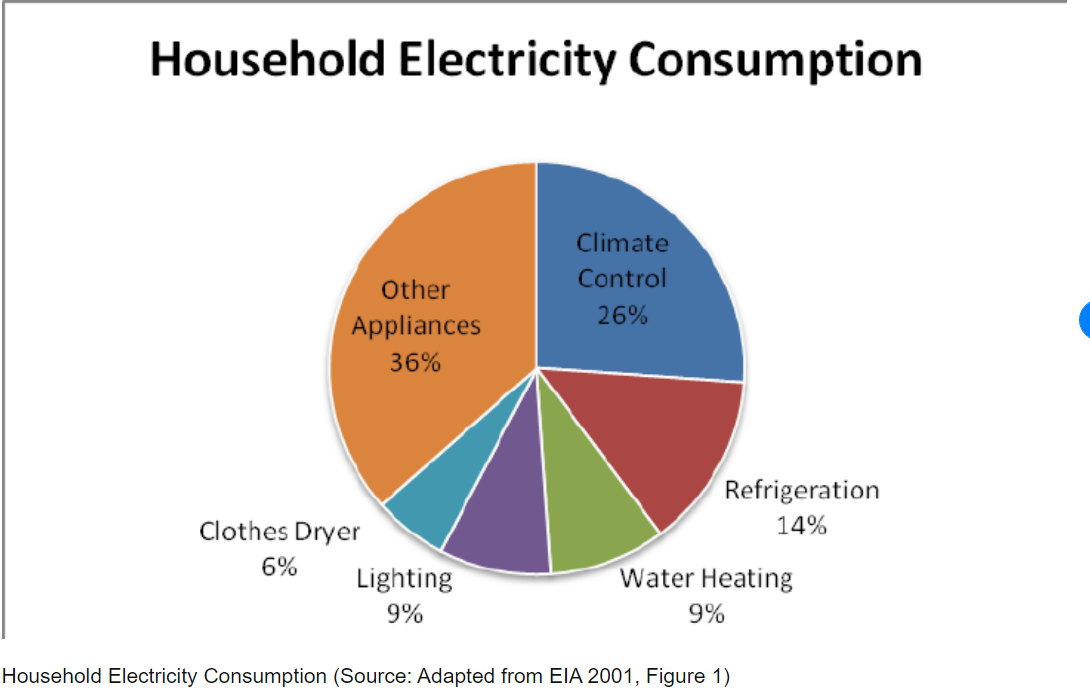
Refrigerators now account for just 7% of home electricity consumption, down from 14% in 2001.
Opinion writers differ on who gets credit for the improved price/performance results for refrigerators, but it seems clear that both energy standards and inventive firms share credit.
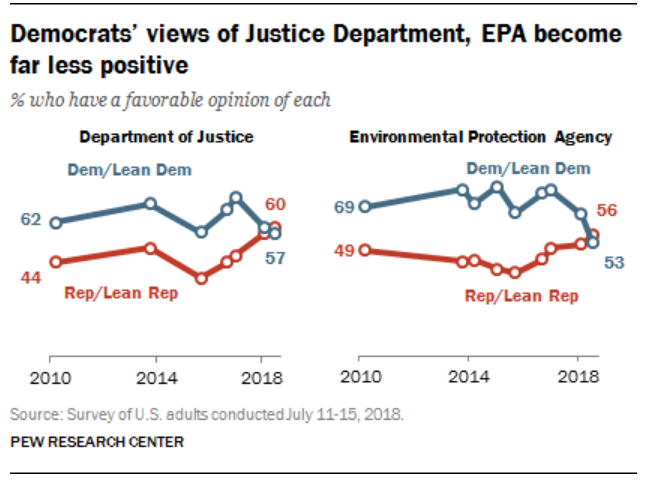
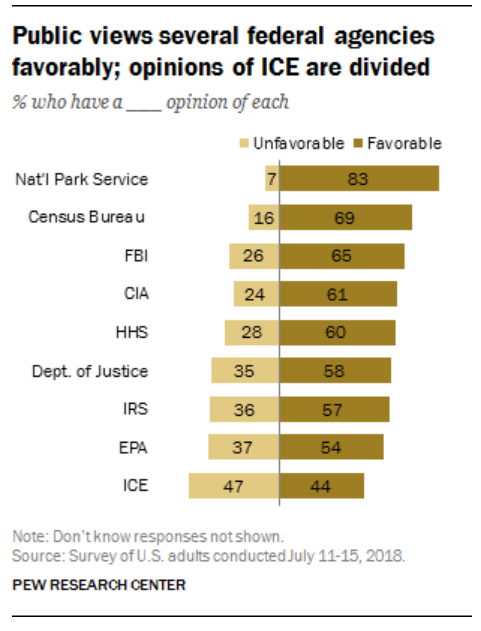
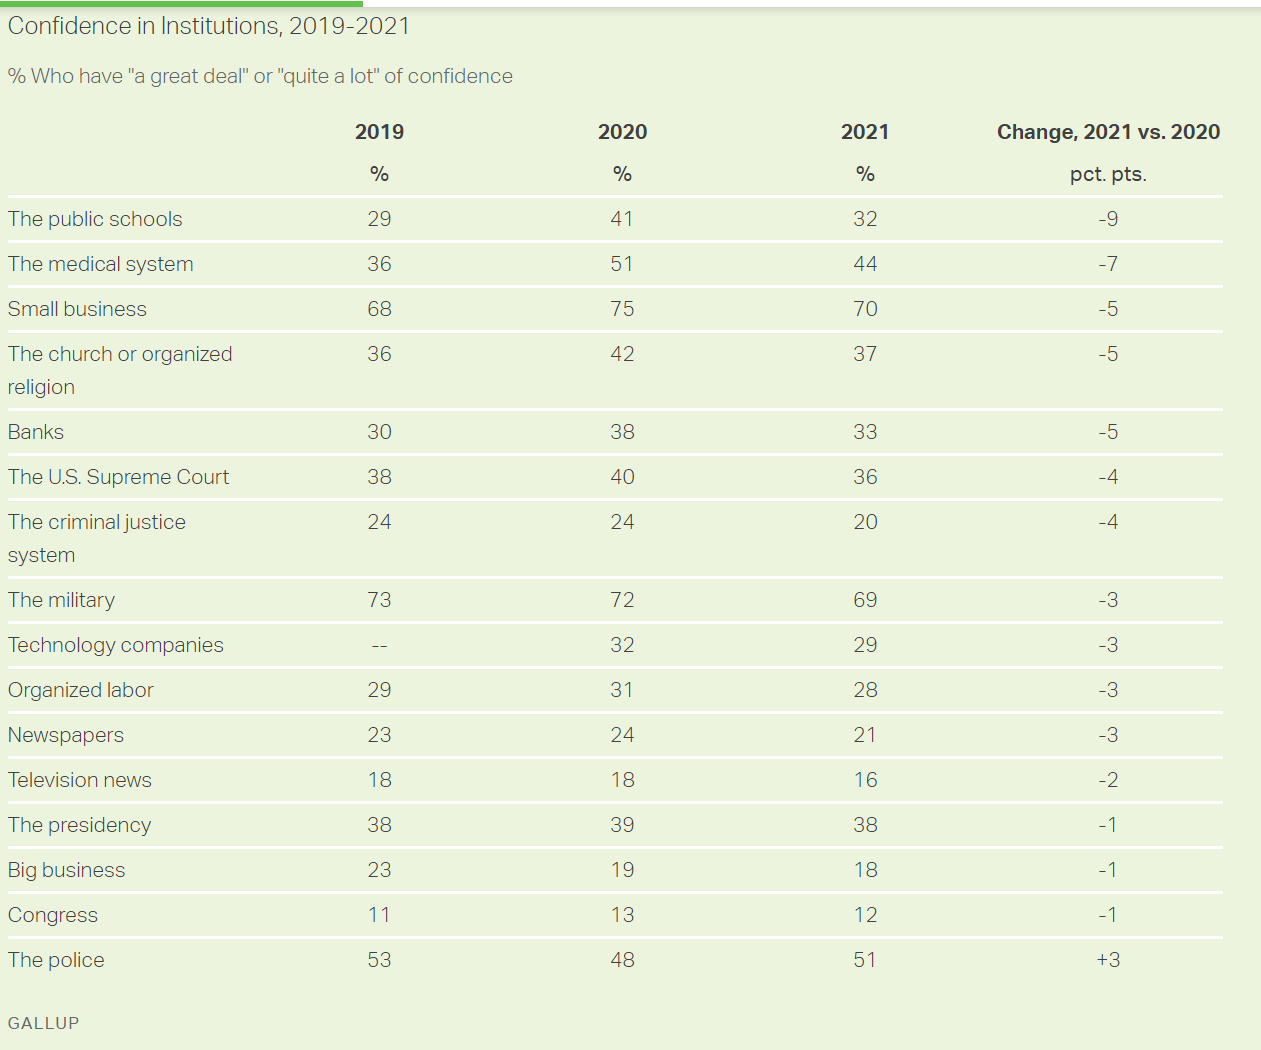
Historically, Republicans have been conservative, supporting the police, military, FBI, defense, “law and order”, criminal justice and “black and white” law enforcement. While the DOJ and some other federal agencies have been staffed by left-leaning coastal elites, the FBI has been staffed by more conservative leaning individuals.
538 has a similar article but refuses to link directly. Worth your time to query and copy.
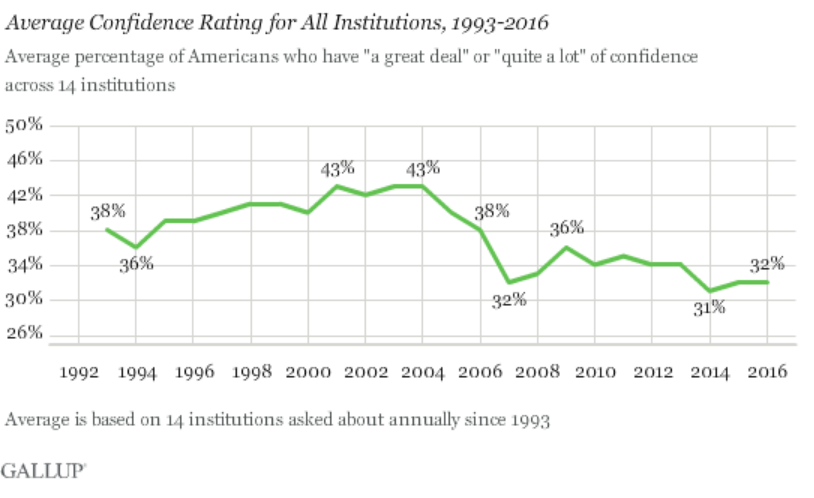
“What Happens When Americans Don’t Trust Institutions?”
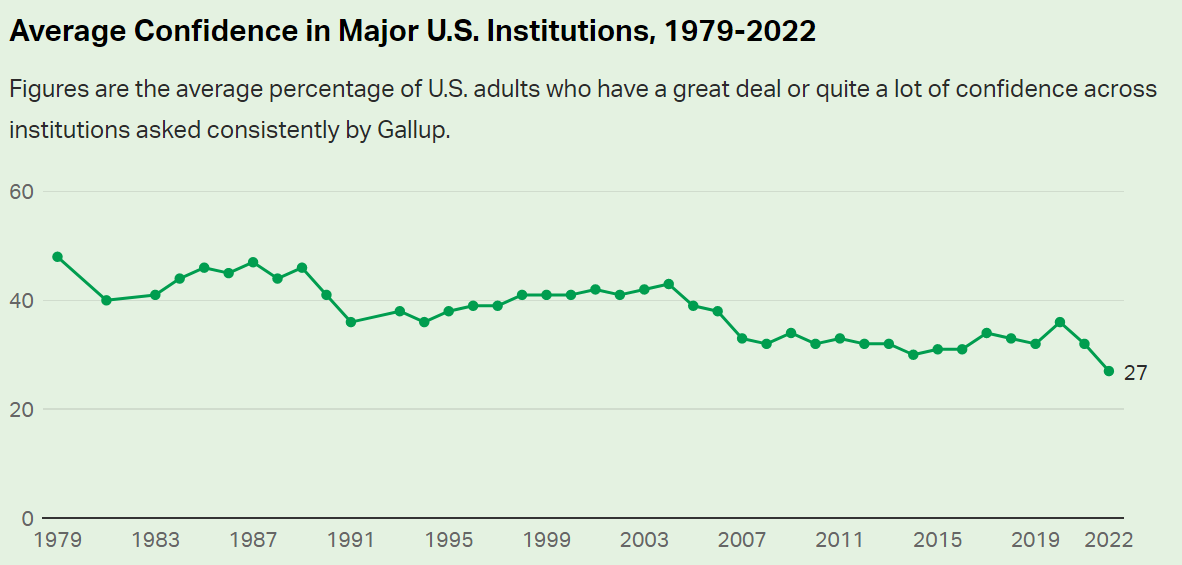
If only one-quarter of Americans trust in its basic institutions, how can we have democracy and capitalism and “western civilization”? If “everything is broken”, then we need a dictator or a revolution. Really? Really? Really?
I have to blame the 16 year-old me for some of this. In 1972, we were all opposed to “the man”, “the organization man”, “the establishment”, etc. We were children of the hard-won victory of democracy and capitalism against fascism and imperialism and communism. We believed in progress, science, growth and possibilities. We were skeptical about the Vietnam war, the military, McNamara and his whiz kids, General Curtis LeMay, big corporations, compromises, limitations, bureaucracy, bigness (small is beautiful), population growth, technology, etc. Many of us deeply believed in a romantic idealism or utopianism, making stodgy historical institutions so irrelevant.
Fast forward 50 years and I (we) possess a fundamentally conservative view, embracing the need/value of institutions and channeling our inner Edmund Burke to emphasize the value of the accumulated wisdom of society.
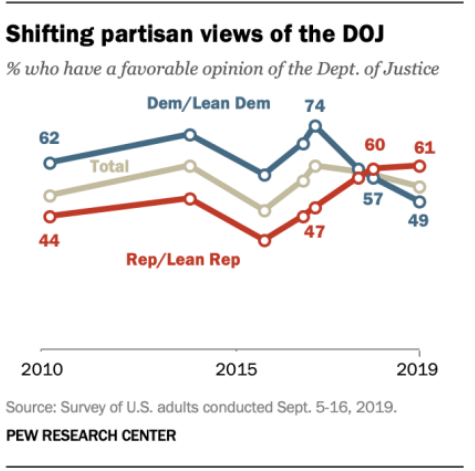
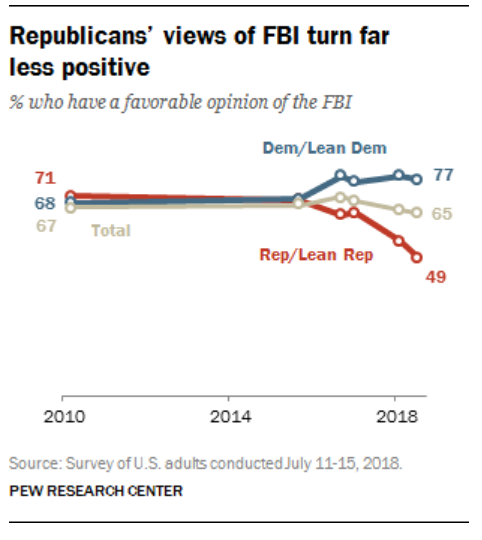
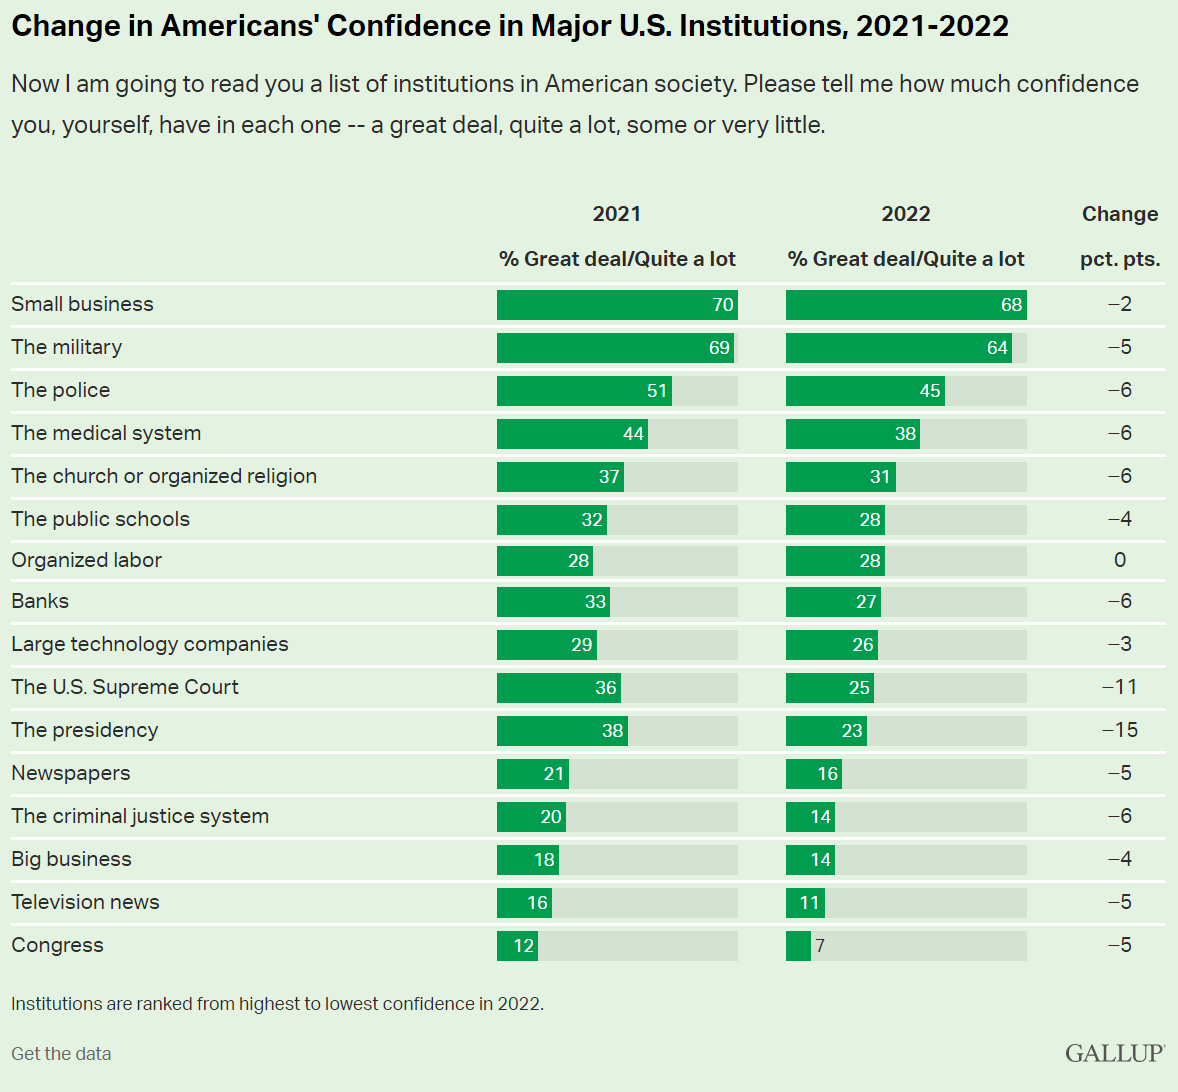
So, the overall decline in trust of American institutions is a real challenge. The decline in trust in the FBI is clearly (IMHO) a Trump driven result. This, too, is a real challenge to our democracy. Do we (I) really believe that the leadership and staff of the FBI have abandoned their democratic principles which we have lived and supported for almost 250 years? I don’t think so. But the decline in trust/belief in all institutions combined with the increasingly politically polarized view of individual institutions makes this a reasonable view for many of our fellow citizens. We have much, much work to do in order to preserve our institutions, government and society.