

https://www.staffordschools.net/Page/20853
This is a follow-up article to my recent post on “A Very Robust Long-term US Labor Market (1970-2021). Rather than focus on total growth or the “skill-level” of jobs in the labor market, I want to focus on the roles or functions (like career clusters, similar to industries) played by the 150 million US workers in 2021. I’ve grouped the 500 detailed occupations into 17 categories so that we can look at subtotals ranging from 1% to 20% of the total, with an average of 16%. Enough detail to highlight the very significant changes in the last half-century.

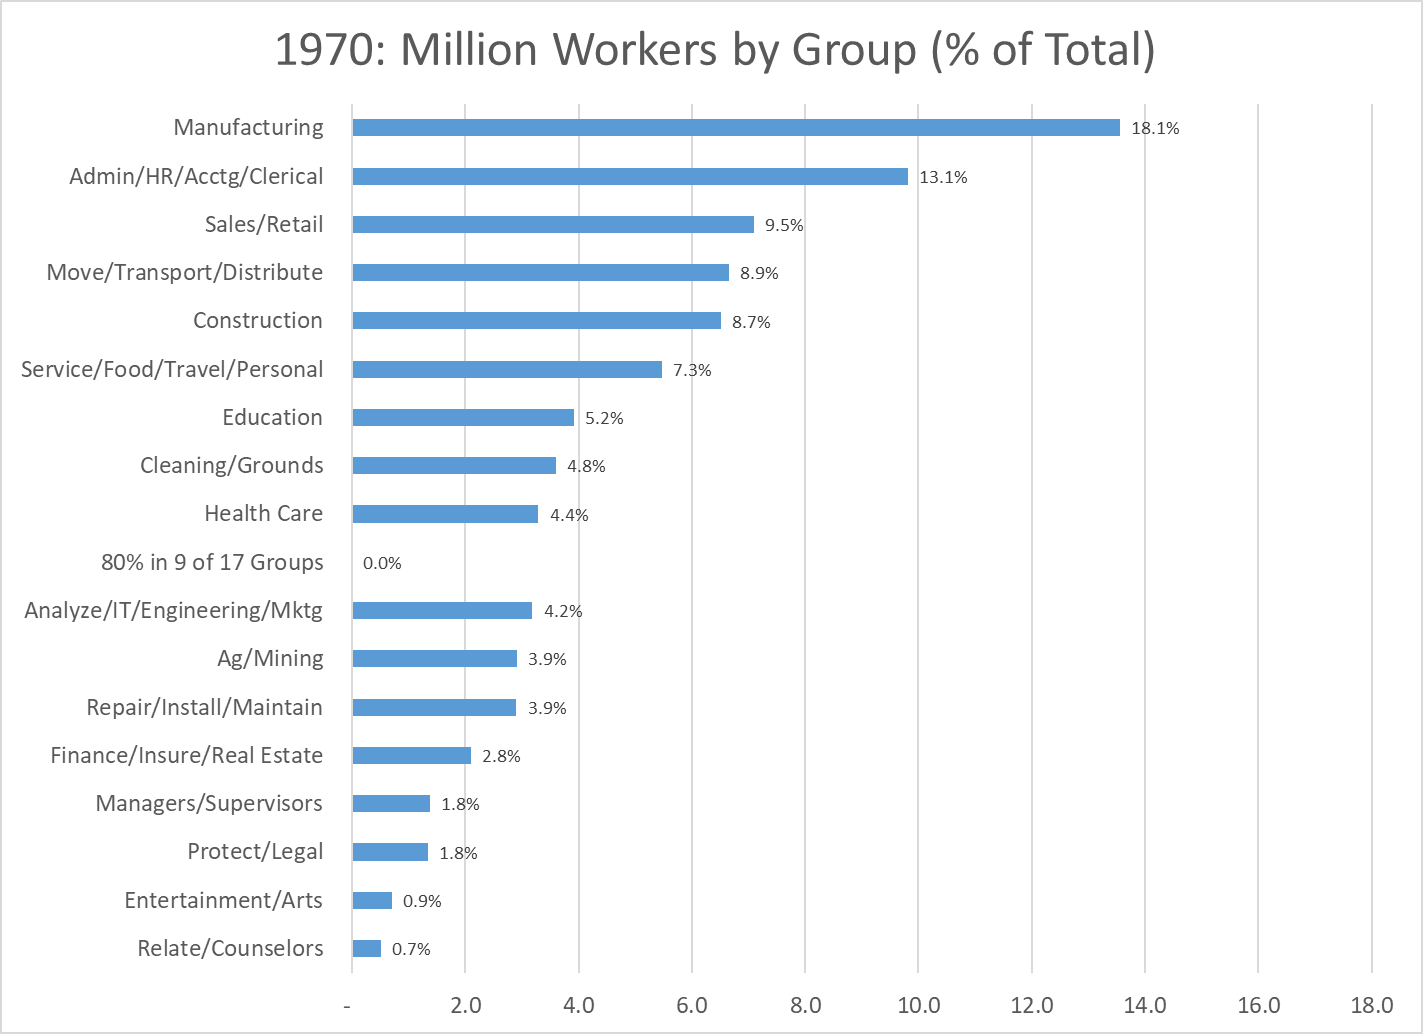
Let’s start with the 1970 data. 75 million employees. Manufacturing was the “big dog”, with almost 14 million workers, 18% of the total, a little less than one out of five.
Administrative workers, including clerical, HR and accounting staff at all job levels were the second largest group, with 10 million people and 13% of the total, one out of eight jobs. These two traditional categories accounted for 31% of the total, not quite one-third.
The next three groups each accounted for 9% of the total, one of every eleven employees. Sales workers, at managerial, professional and retail/clerical levels. Members of the logistics industry broadly defined, including both transportation and distribution staff. Employees of the construction industry. Once again, classic job functions in 1970 that would have been familiar in 1930.
The narrowly defined “service sector”, combining staff in the food service, travel and personal services industries contained 5.5 million workers, or 7% of the total. These six together included 70% of all workers.
Six other categories were each a much smaller 4-5% of the total: Education (KG-post secondary), Cleaning and Groundskeeping, Health Care, Analysis (finance, IT, operations, engineering and marketing), Ag/Mining and Repair/Installation/Maintenance.
The final five categories each averaged just 1.5% of total jobs: Finance/Insurance/Real Estate, Managers/Supervisors, Protection/Legal, Entertainment/Arts and Relating/Counselors.
By 1970 production agriculture had already declined to an immaterial share of the economy. The historically male and blue collar dominated Manufacturing, Logistics, Construction and Repair categories combined to account for 40% of all jobs; two out of five. The historically more female friendly Administration and Sales functions held 25% of all jobs, one in four. Education was the largest “information industry” at 5%, largely dominated by traditional elementary and secondary school teachers. A more broadly defined service group of food service, travel, personal service, cleaning/grounds and health care summed to 17% of the total, or one in six jobs.
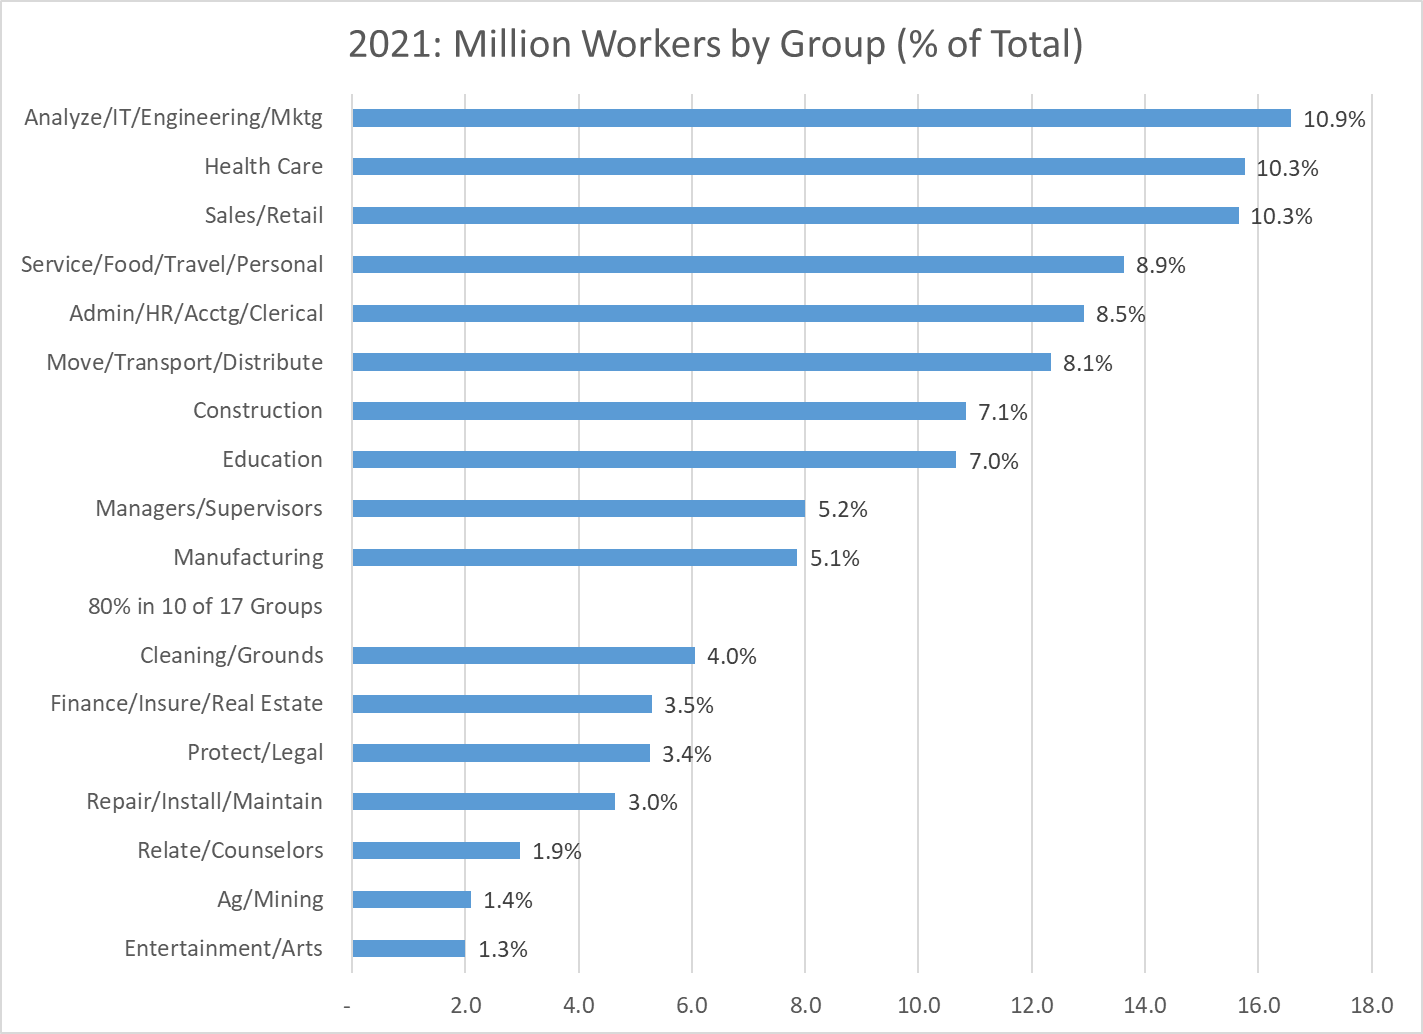
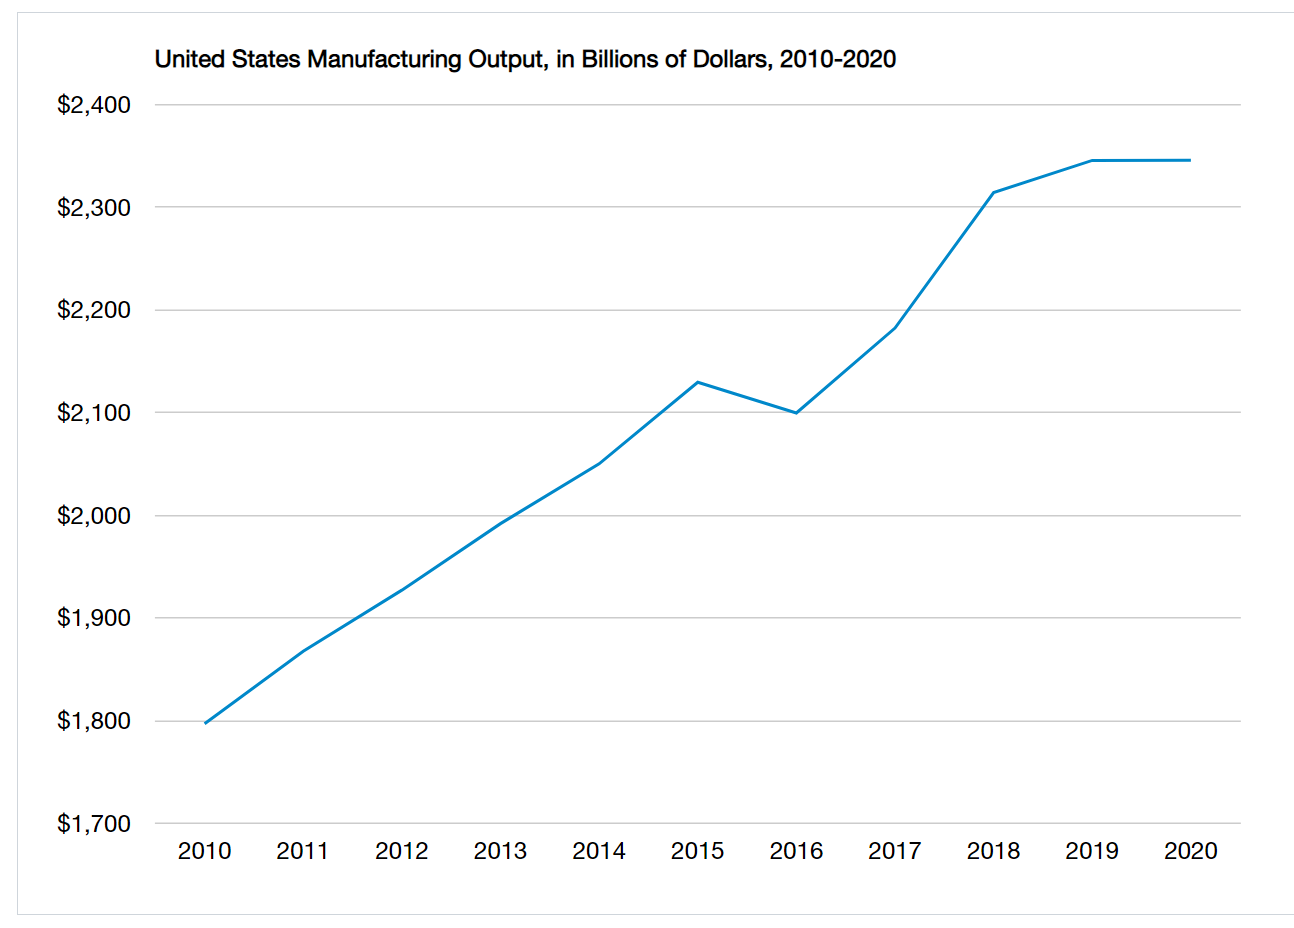
Six categories changed very significantly between 1970 and 2021. Manufacturing dropped from first place to tenth place, from 18% to just 5% of employment, from 14 to 8 million employees. US firms improved labor and overall productivity throughout this period, keeping the most productive firms and factories open, while closing and outsourcing work from the others. This was a tremendous change in the labor market, completed in just two generations of workers.
The Administrative category also declined markedly, from second place to fifth place, shrinking from 13% to less than 9% of total employment, but increasing slightly from 10 to 13 million staff. Process, computer and telecom changes drove improved productivity. Some administrative jobs were outsourced. While the Manufacturing sector lost two-thirds of its labor market share, the Administrative sector lost one-third.
The Ag/Mining group was the third losing category, dropping by nearly two-thirds from 3.9% to 1.4% of all employment. When politicians talk about “reviving” manufacturing, mining or production agriculture they are working against very strong long-term trends.
The largest growth was in the “Analysis” category, which grew by two and one-half times as a share of the total, from 4% to 10%. There was incremental growth in the existing Engineering sub-category, adding 2 million roles. The IT category grew added almost 6 million roles from a base near zero. The operations, finance, marketing analysis group added another 6 million positions to its base of 1.5 million. The “Analysts” category rose from tenth place to first place as firms became more complex and found ways to better employ the talents of individuals with high level analytical skills. At 11% of the economy, one out of every nine jobs falls into the analysis category.
Health Care increased from ninth place to second place, moving from 4.4% to 10.3% of all jobs (2.5X). The number of jobs grew by 13 million, from 3 to 16 million.
The Managers/Supervisors category climbed from fourteenth to ninth place, rising from 1.8% to 5.2% of the economy, adding almost 7 million jobs. The 1970 detailed coding was somewhat different from the modern approach, with many supervisors and managers grouped with other professions or industries. My best guess is that on a comparable basis, the 1970 category would have been closer to 2.5 million than the reported 1.4 million managers and supervisors. This would have put this group in thirteenth place in 1970. Hence, the growth as a share of the total market would be smaller, from 3.3% to 5.2%, but still quite significant. Once again, larger firms with more complexity demanded more managers and supervisors.
In total, we have 20% (1/5 workers) leaving the Manufacturing, Administration and Ag/Mining sectors and 16% (1/6 workers) joining the Analysis, Health Care and Managers sectors.
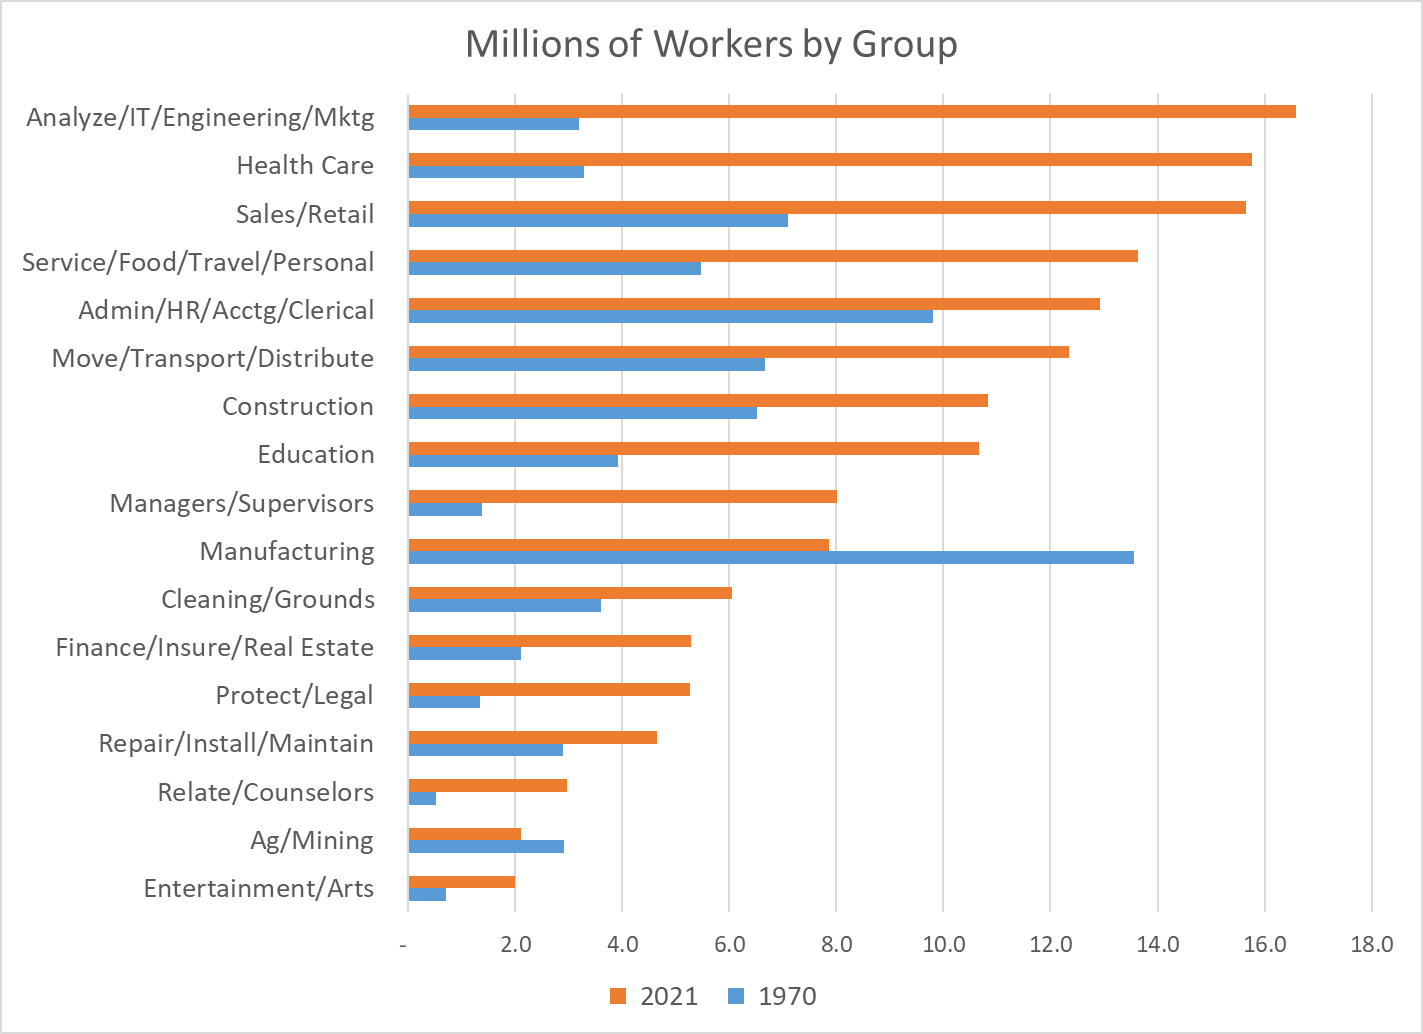
Comparing the millions of employees in 1970 to 2021 by sector clearly shows the massive changes in the labor market. The Health Care and Analysis sectors leapt from a small 3 million workers each to 16 million workers each. Manufacturing fell in absolute terms from 14 to 8 million workers. The Sales and Service sectors began as large sectors, so their relatively normal growth still added about 8 million roles each. Construction and Administration began as larger sectors and were able to add 3 million employees each, despite slower than average growth rates. Logistics grew slightly slower than the market, but added 6 million workers. Education grew faster than average, adding 6 million colleagues.
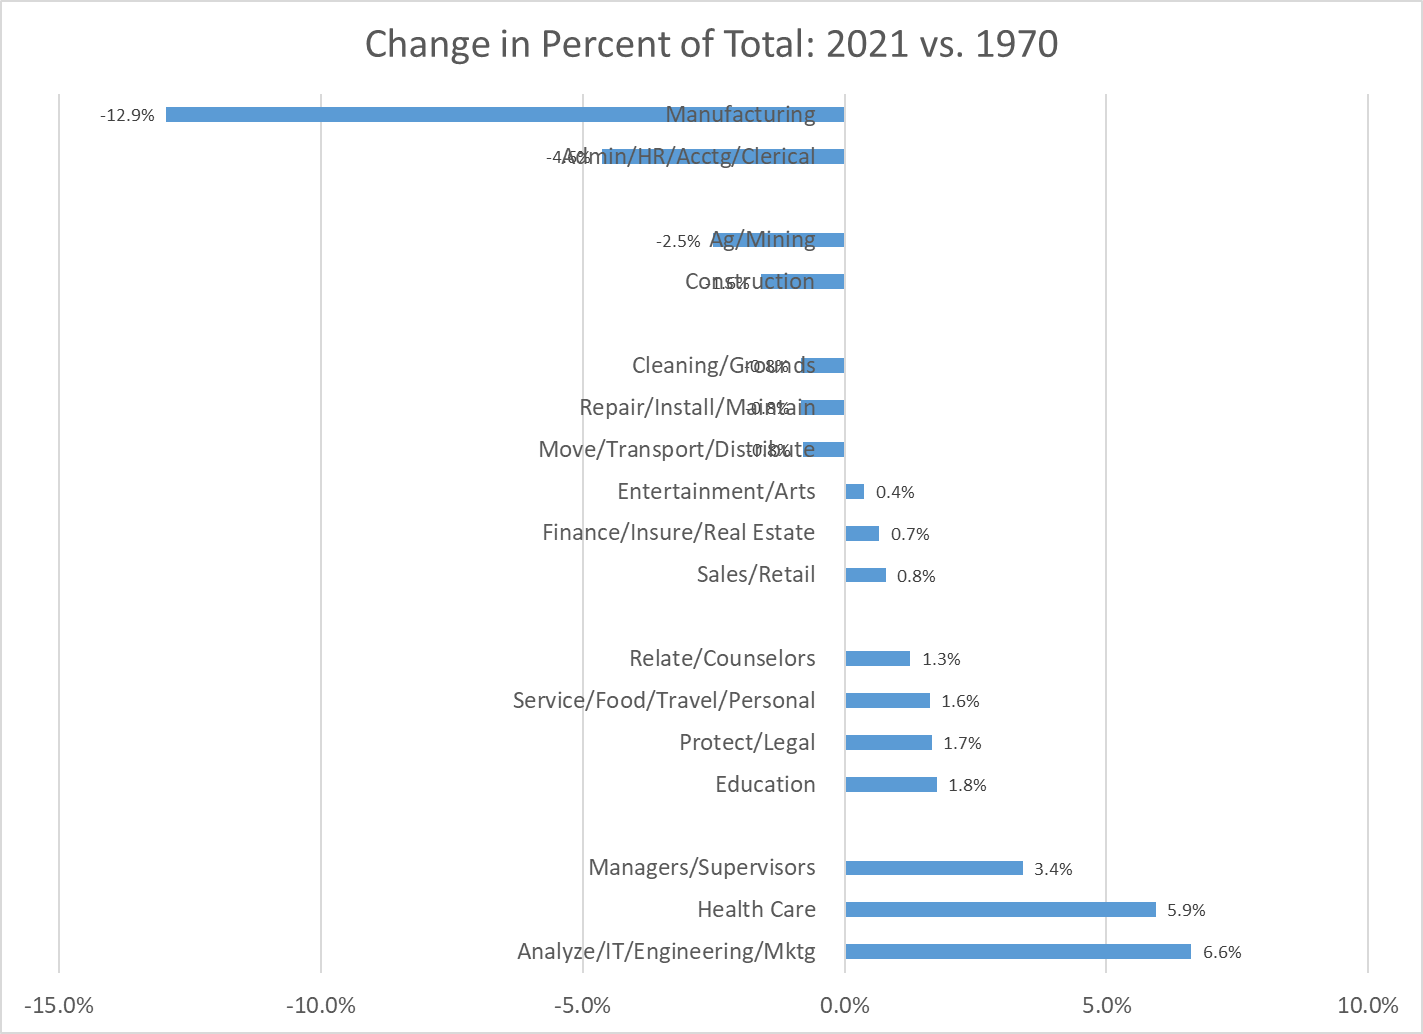
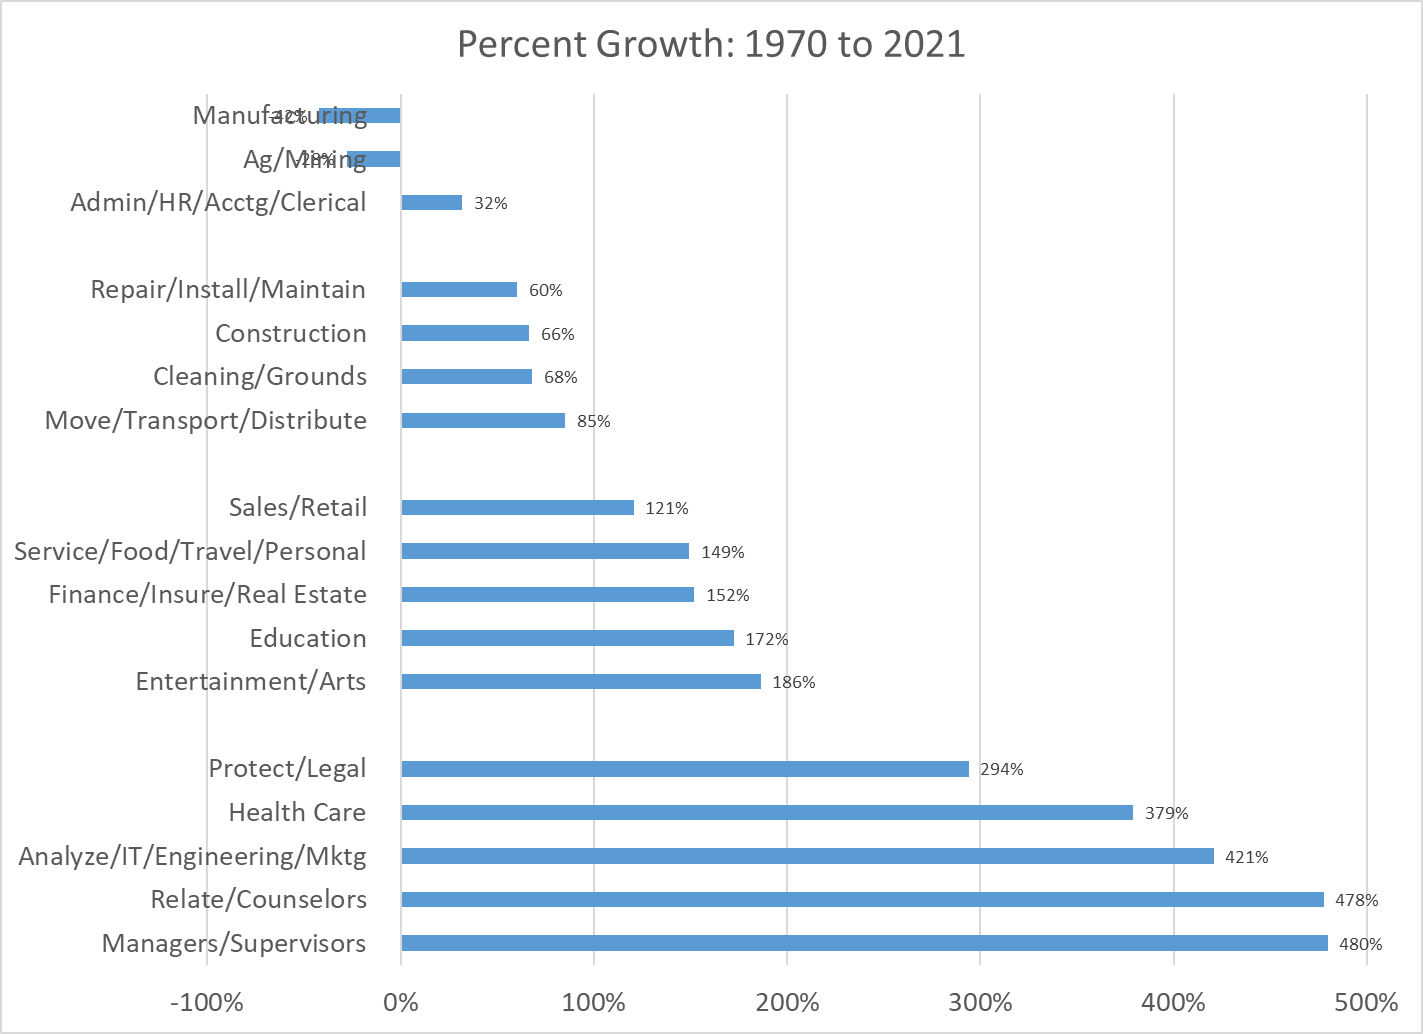
Relative growth rates as a percentage of the 1970 base or as a percentage of the total mostly tell the same story. Manufacturing, Administration and Ag/Mining have declined sharply. Analysis, Health Care and Management have grown materially.
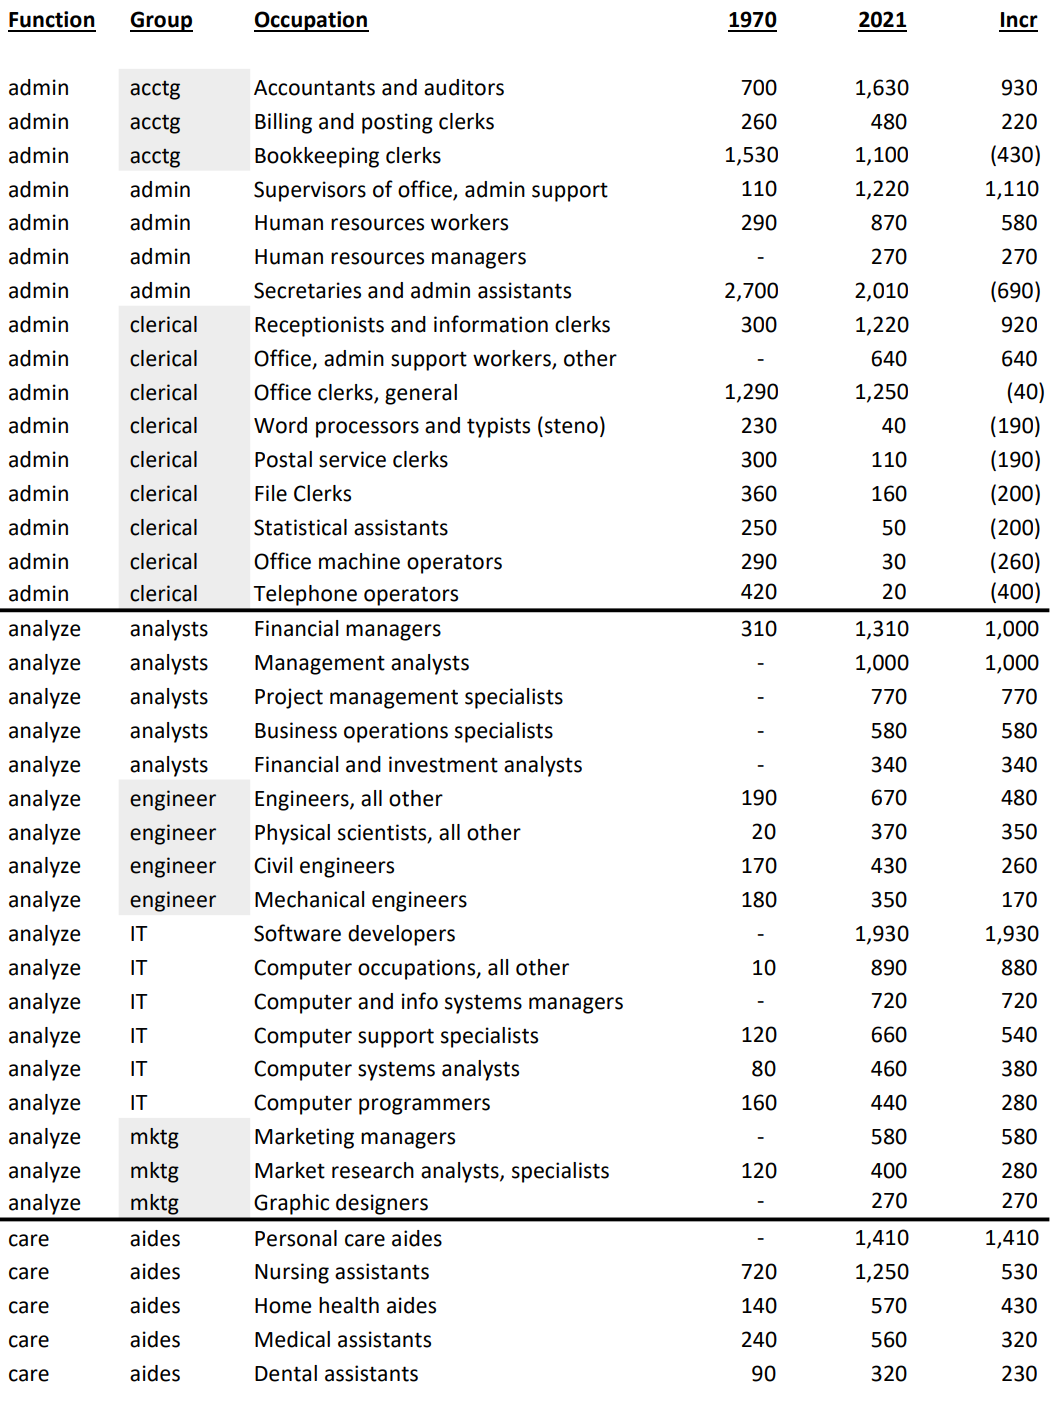
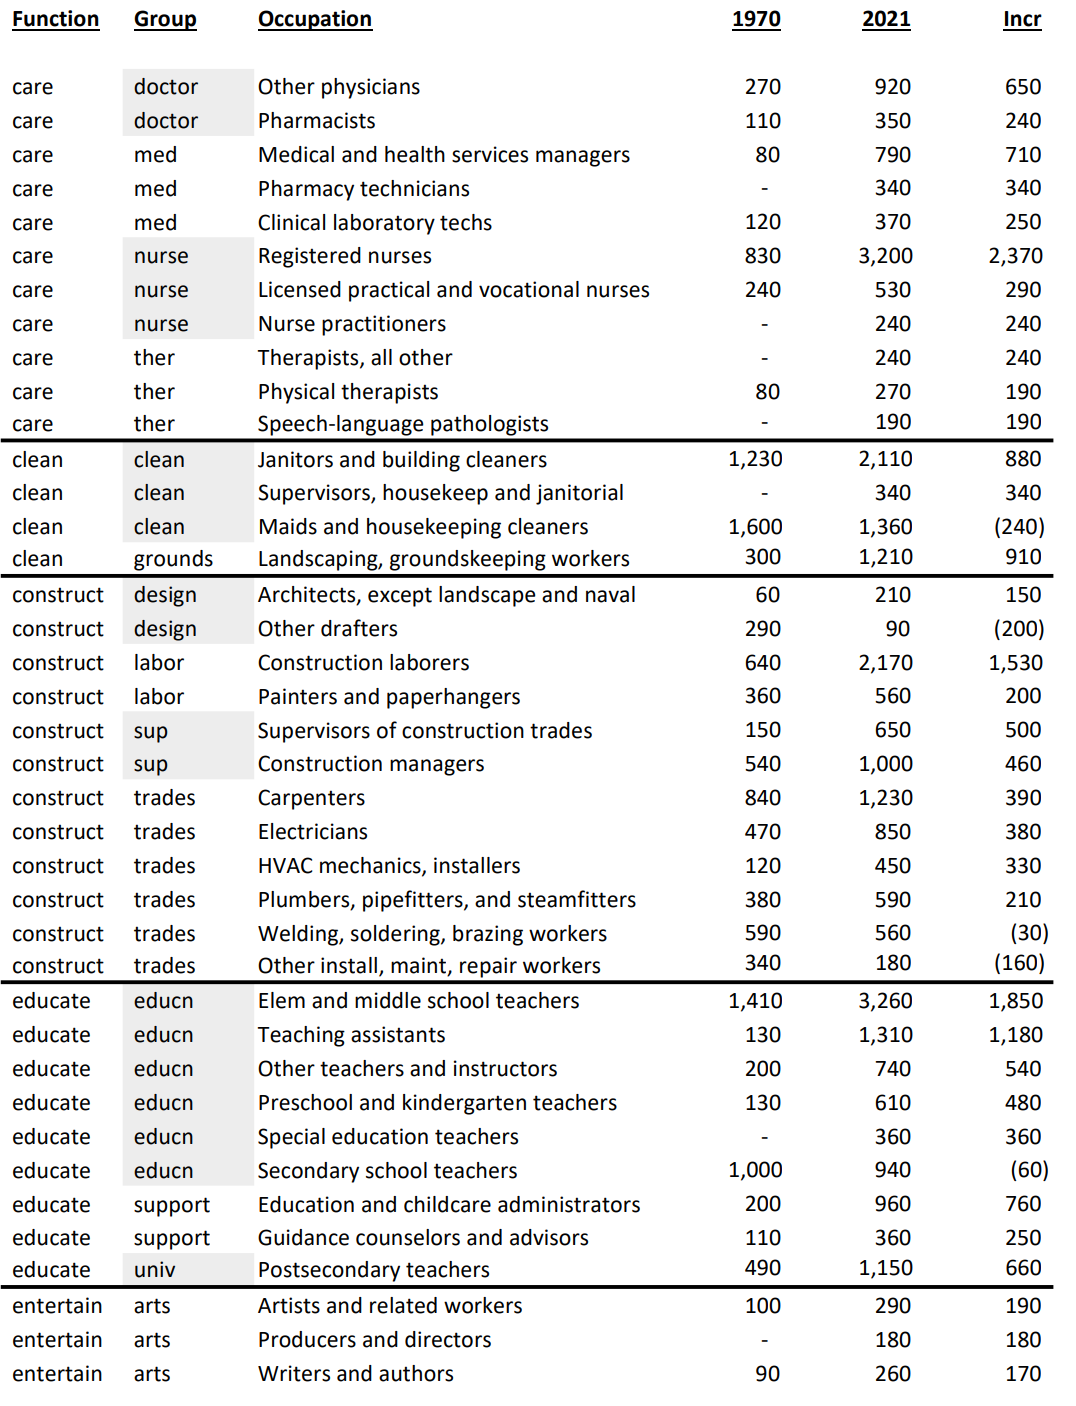
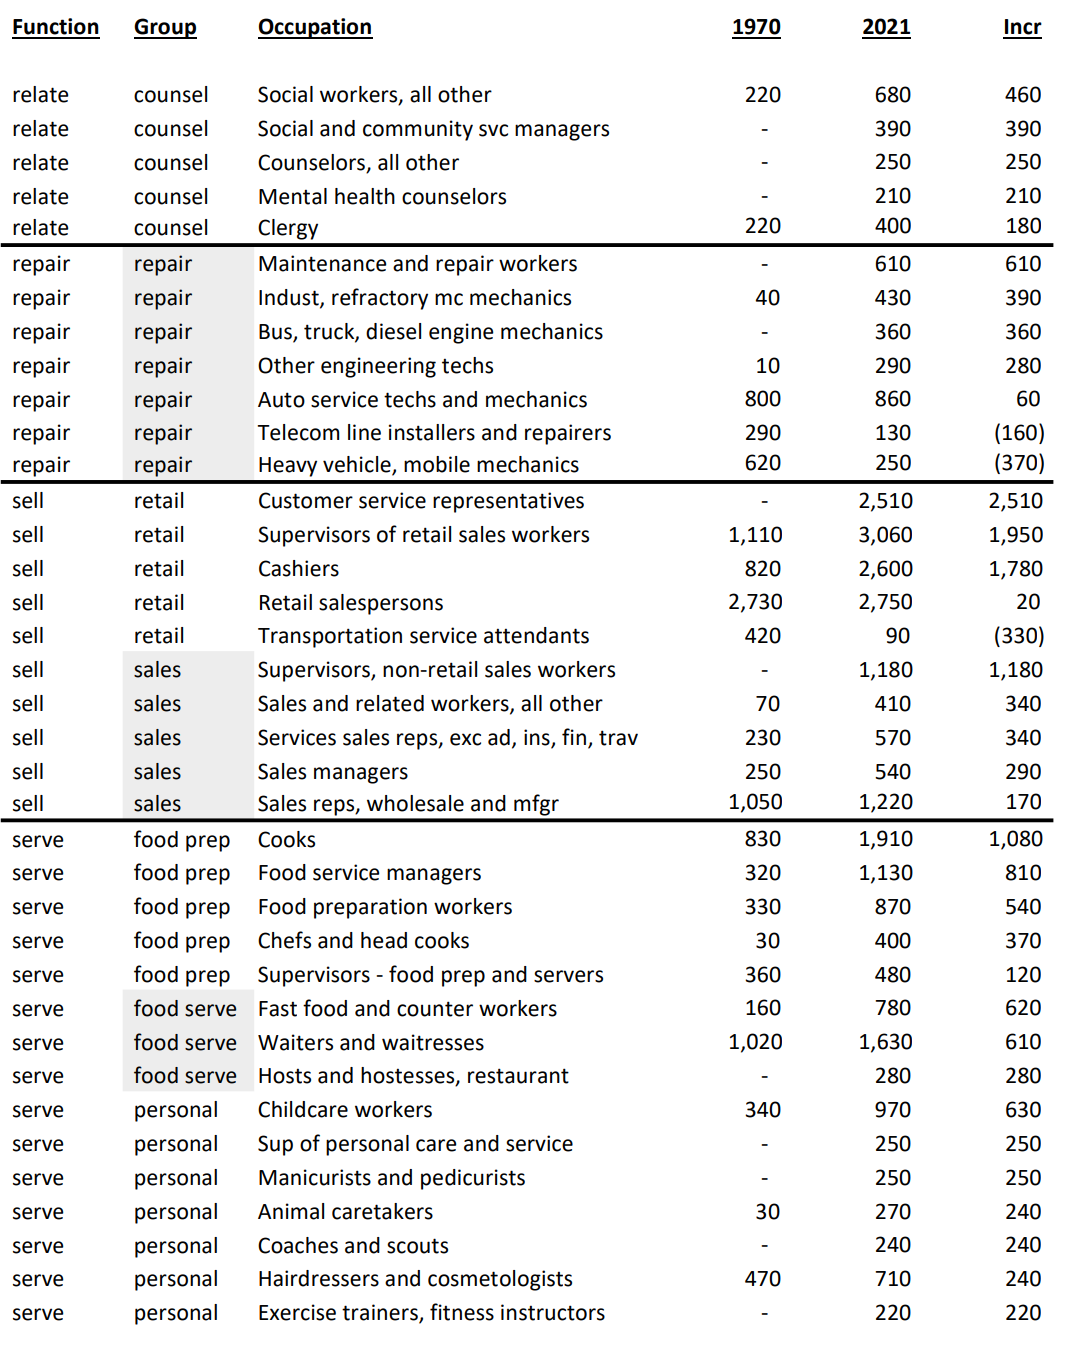
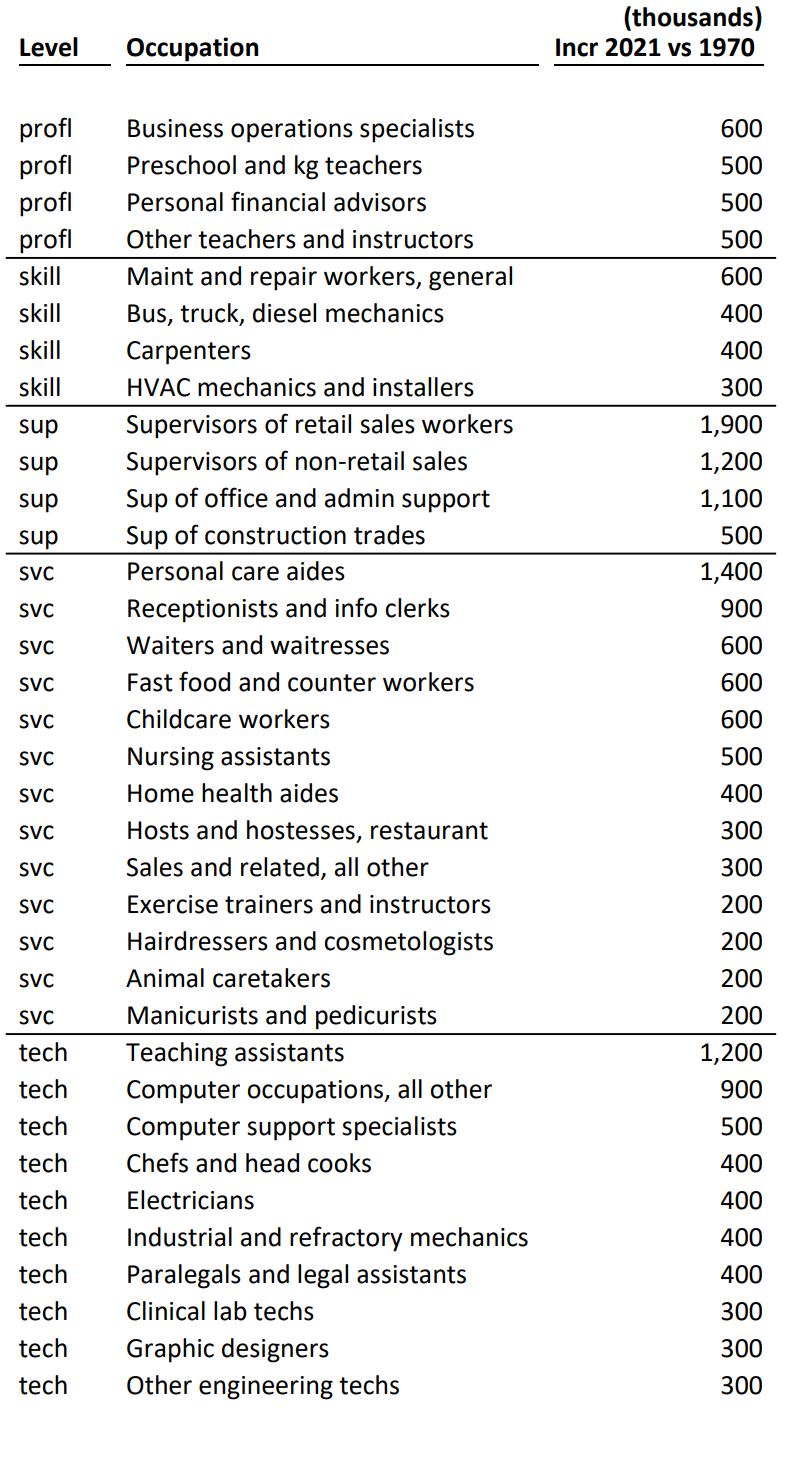
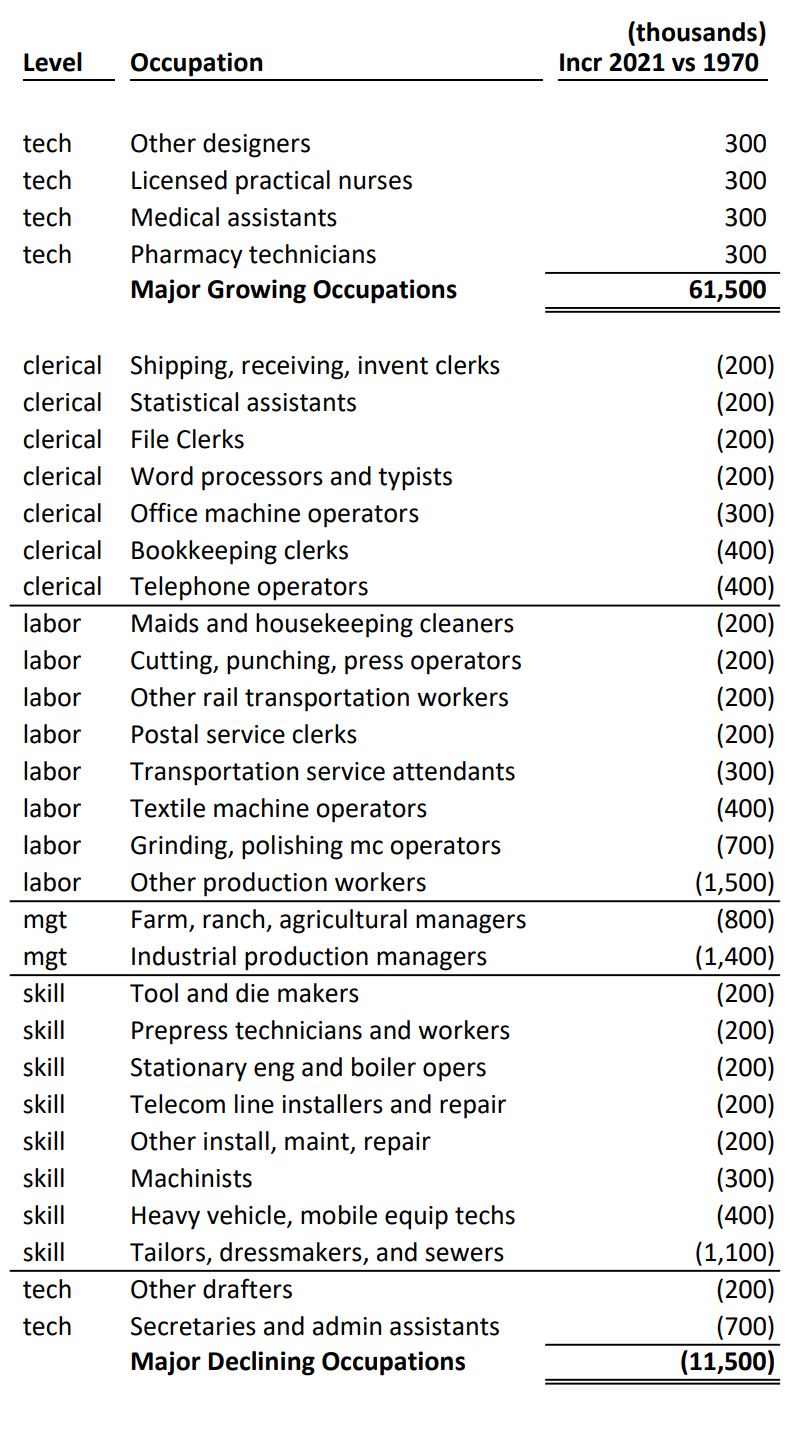
The 152 largest detailed occupations and those with the greatest change in employment are documented below. They account for 91 million jobs, 59% of the 2021 total.

Summary
Economists assert that the principles of comparative advantage drive national economic activity. In essence, nations, firms and individuals rationally do what they are “relatively” best at, which changes through time. We see this reduction in the role of agriculture, manufacturing and mining across long periods in the US.
Economists assert that consumers’ tastes change as they have higher income and the relative prices of goods change. Once basic “food, clothing and shelter” needs are met, people turn to other “needs” and “wants”. These tend to be “services” and we also see this transformation.
Economists assert that profit maximizing firms will employ labor that provides a return on the investment based on the marginal or incremental value added by the labor resource. In a more complex economy, professional and managerial skills are in greater demand. Firms (and not-for-profits and governments) have adapted very well to these major changes in the last 50 years.
These changes are not without major pain to individuals, firms and local economies. The general trends in the economy (more automation, greater trade/outsourcing, more services, more personal care, greater role for analytical skills) are clear. Nations, firms, individuals and regions that adapt to the trends will be relatively successful. This requires wise individual and political choices and investments.
Appendix: Other Reference Articles/Sources
https://www.bls.gov/oes/current/area_emp_chart/area_emp_chart.htm
https://stacker.com/stories/3487/most-common-jobs-america
https://stacker.com/stories/3494/most-common-jobs-america-100-years-ago
https://billshander.com/dataviz/occupations/
https://www.bls.gov/cps/cpsaat09.htm
https://www.bls.gov/cps/cpsaat11.htm
https://www.dol.gov/agencies/wb/data/occupations-decades-100


_and_Manufacturing_Employment.png)