The US economy continues its evolution from agriculture to manufacturing to services to information. President Trump was responsible for the US economy from February, 2017 through January, 2020. President Biden assumed responsibility in February, 2020. In order to compare the two presidents, let’s look at Trump for the 3 years of sustained growth deep in the business cycle before the pandemic. For Biden, let’s look at a comparable 3-year period from June 2021 through June 2024, after the post-Covid rebound. Trump benefitted from an 8-year long business cycle expansion. Biden had to deal with a once in a century pandemic driven economic depression.
Inflation: Advantage Trump
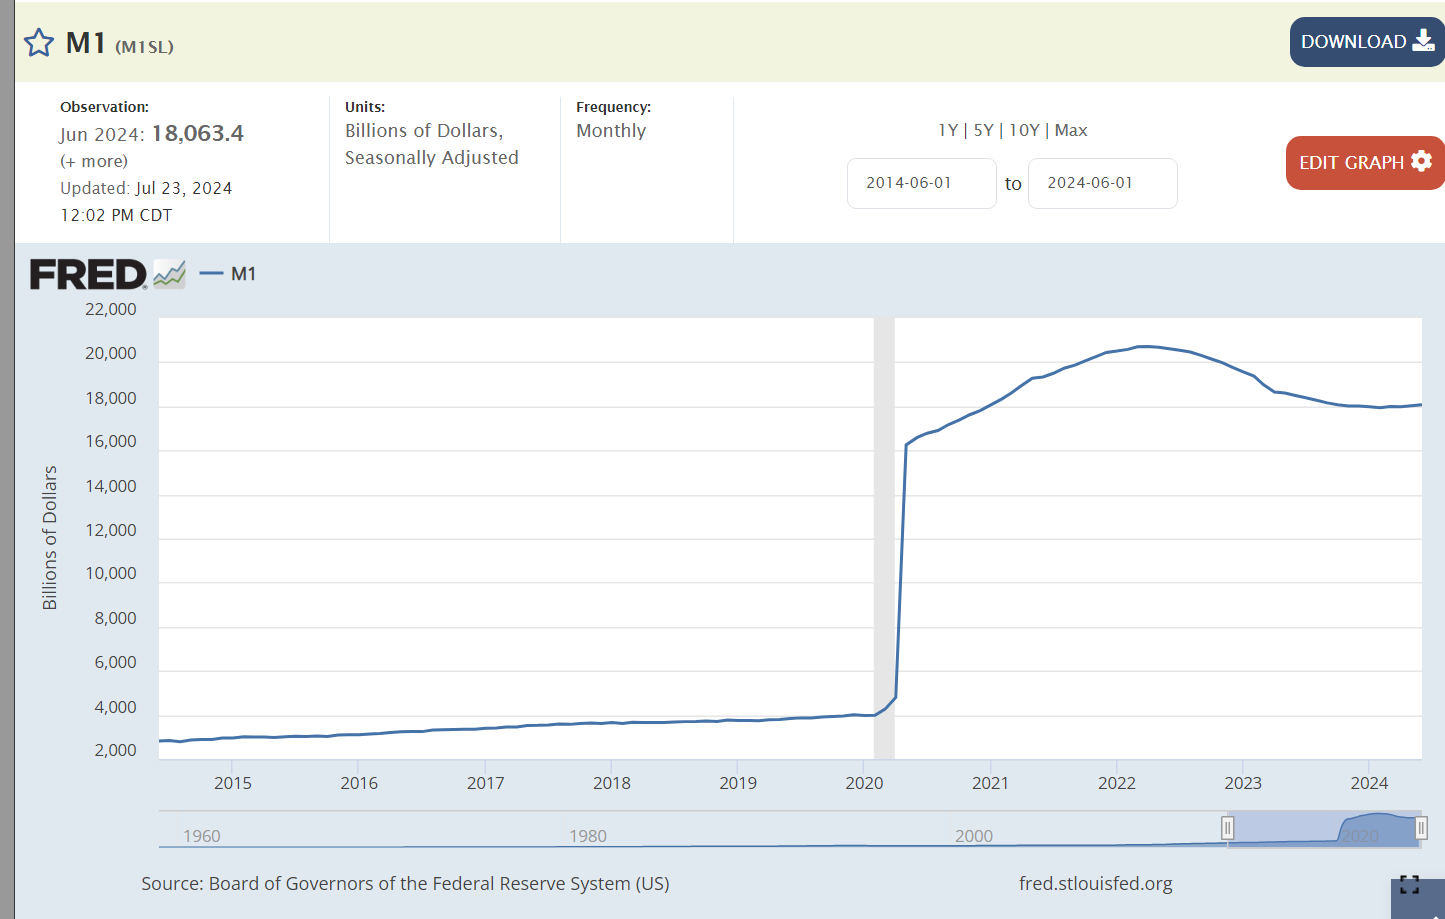
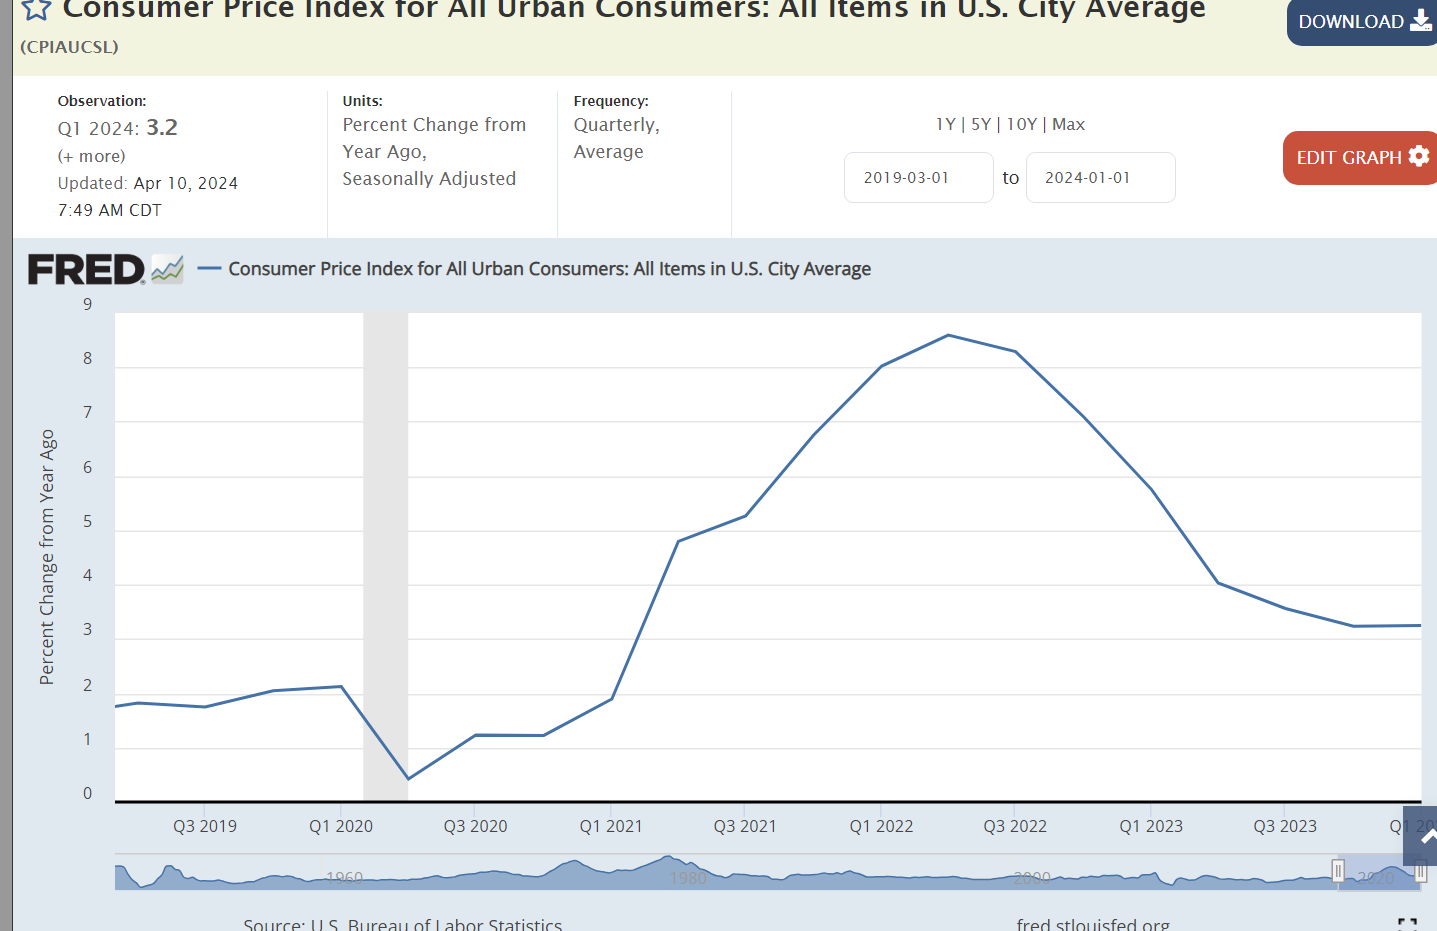
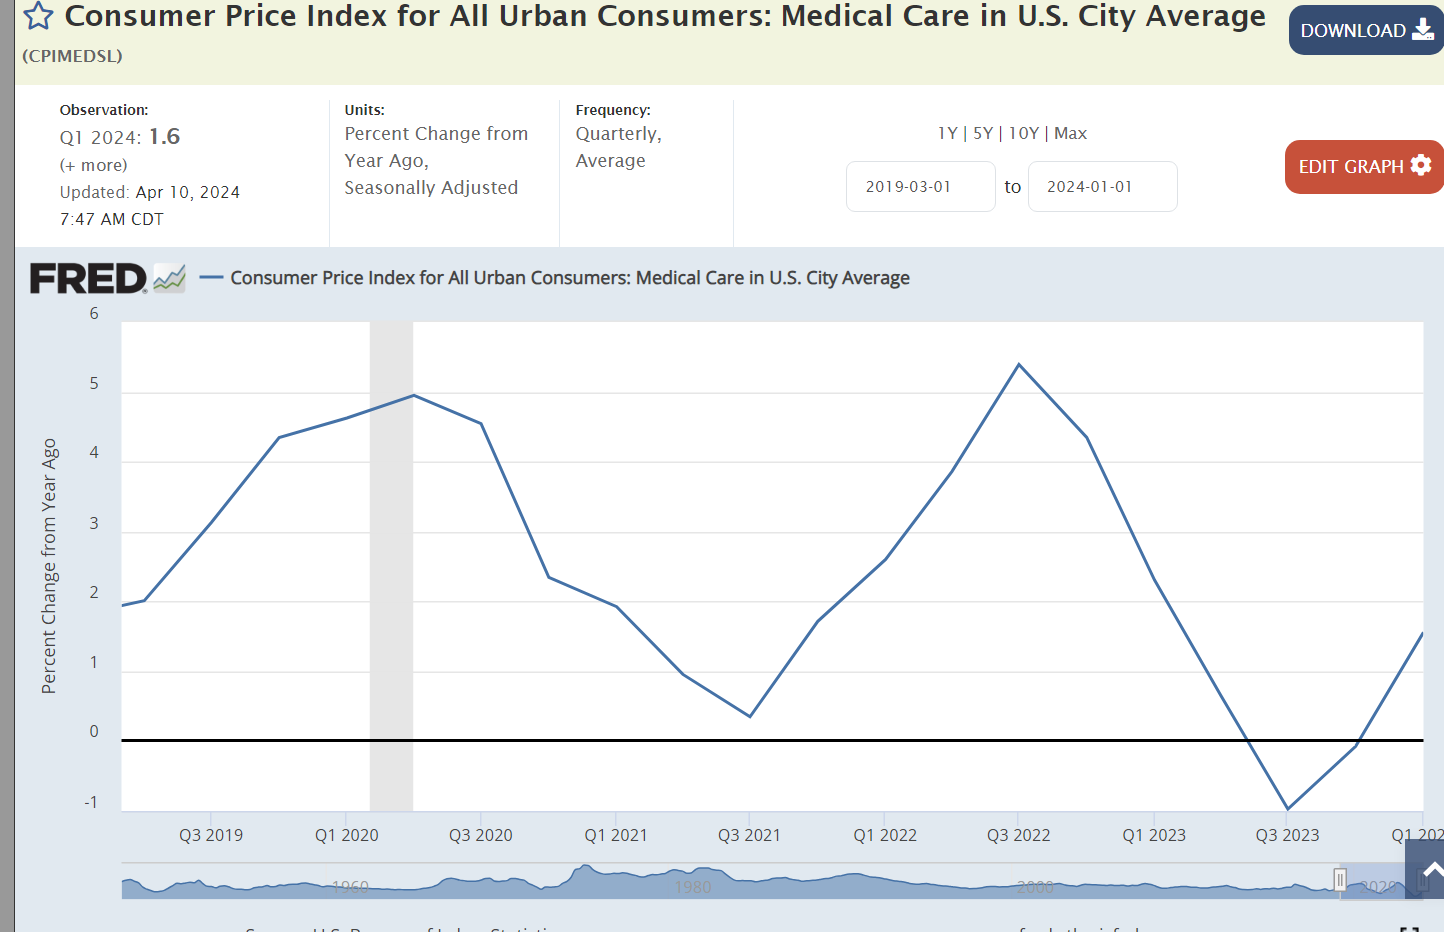
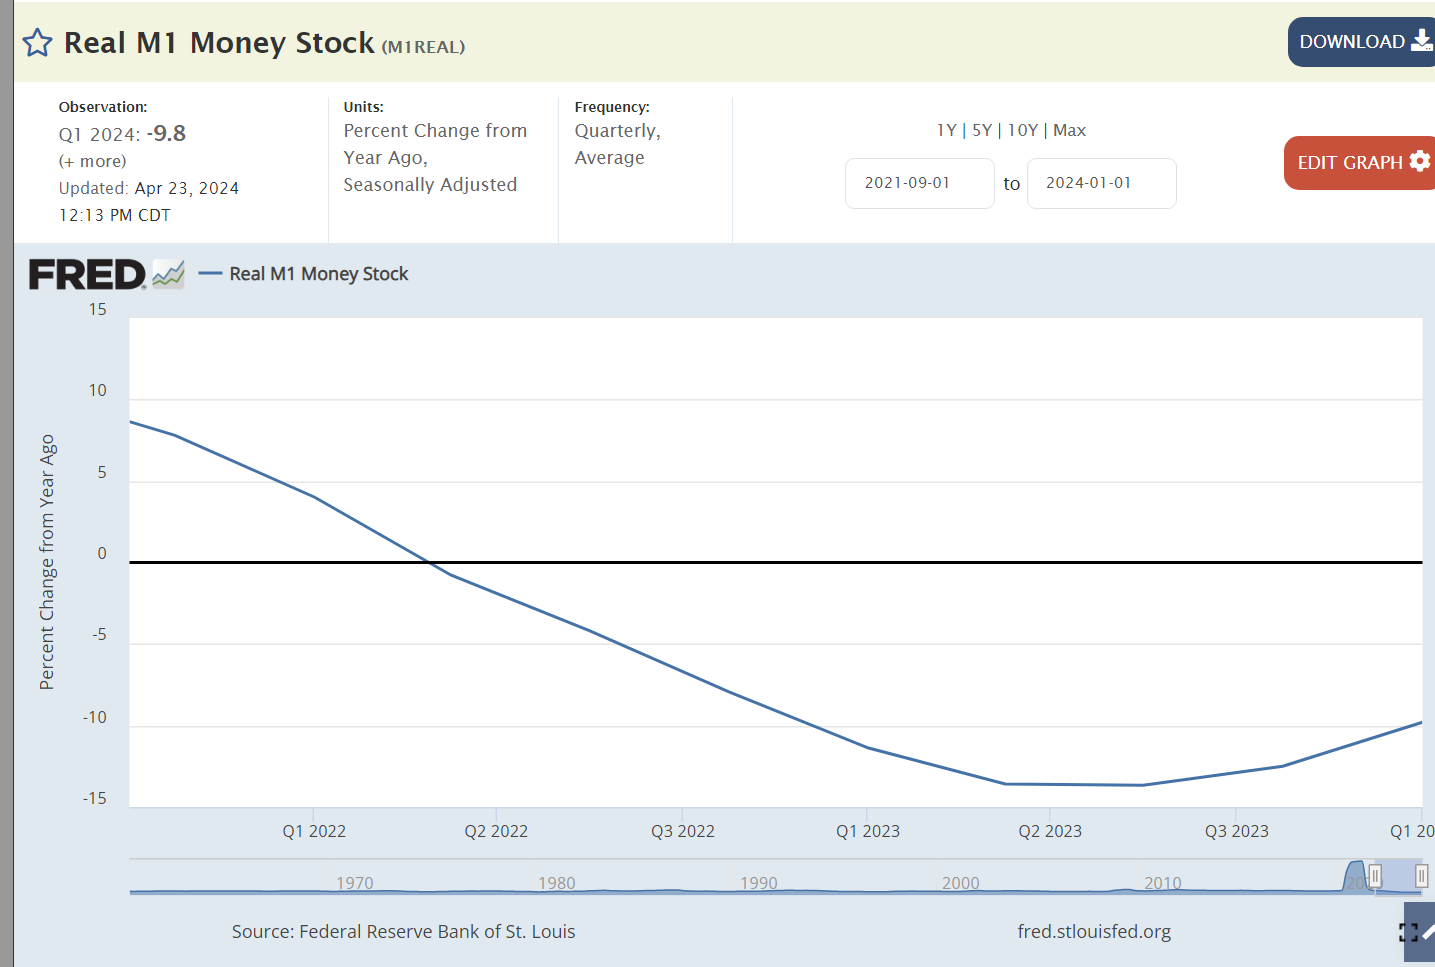
The independent Federal Reserve Board responded to the pandemic by greatly increasing the money supply to ensure that profitable, well-run financial institutions would be able to survive the temporary disruptions in the real economy. The Fed increased the money supply by 4-5 times its prior level to ensure the economy did not collapse! The extra money supply had to end up somewhere. It drove up consumer prices and increased asset values in the stock market and for home prices.
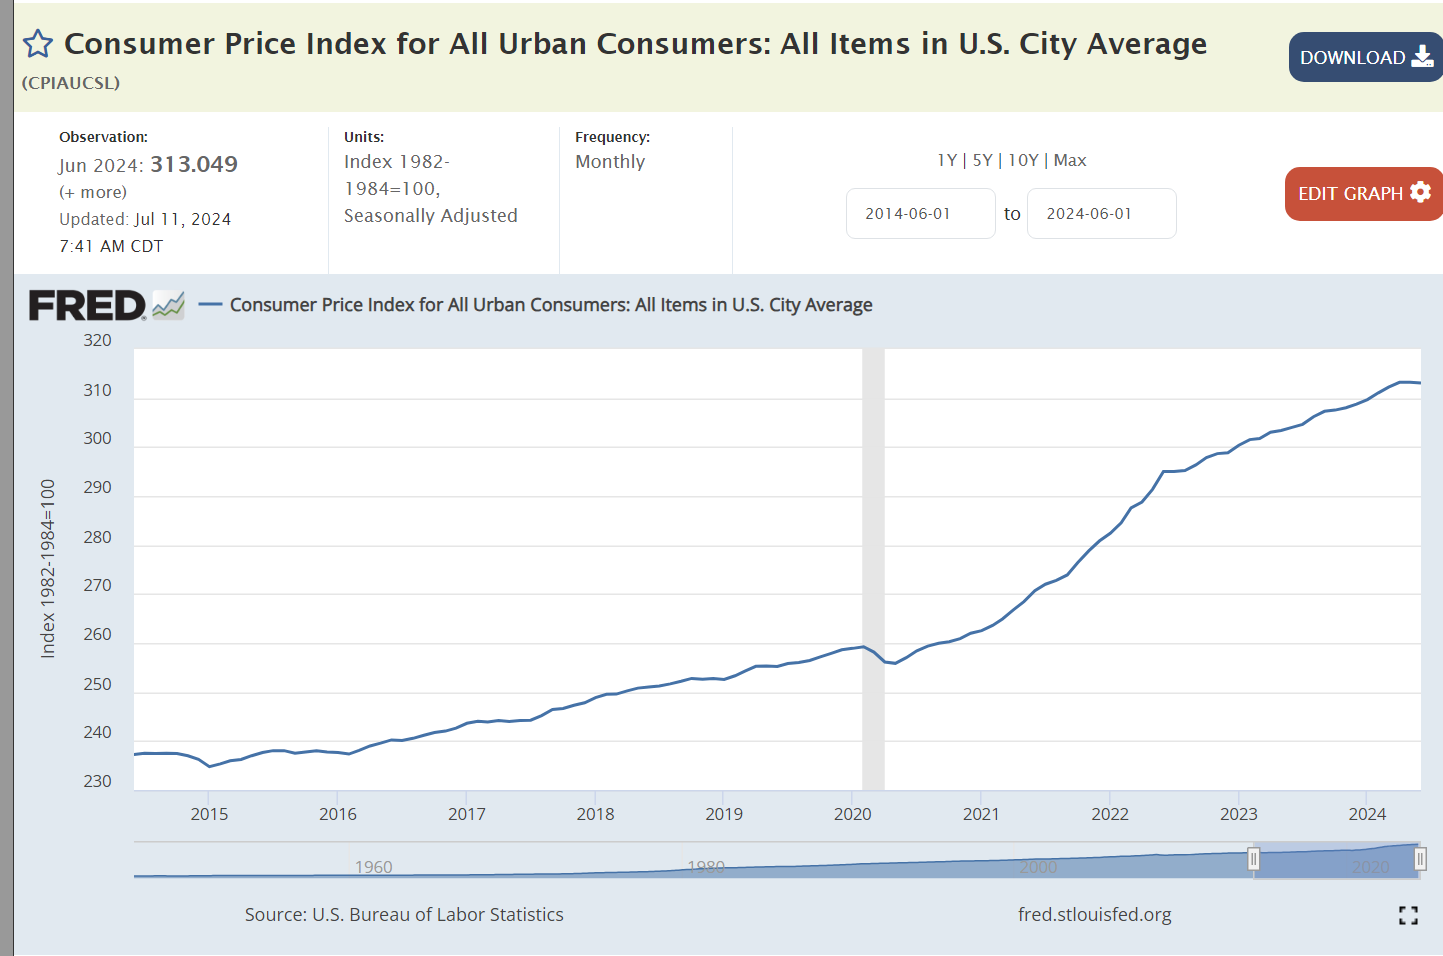
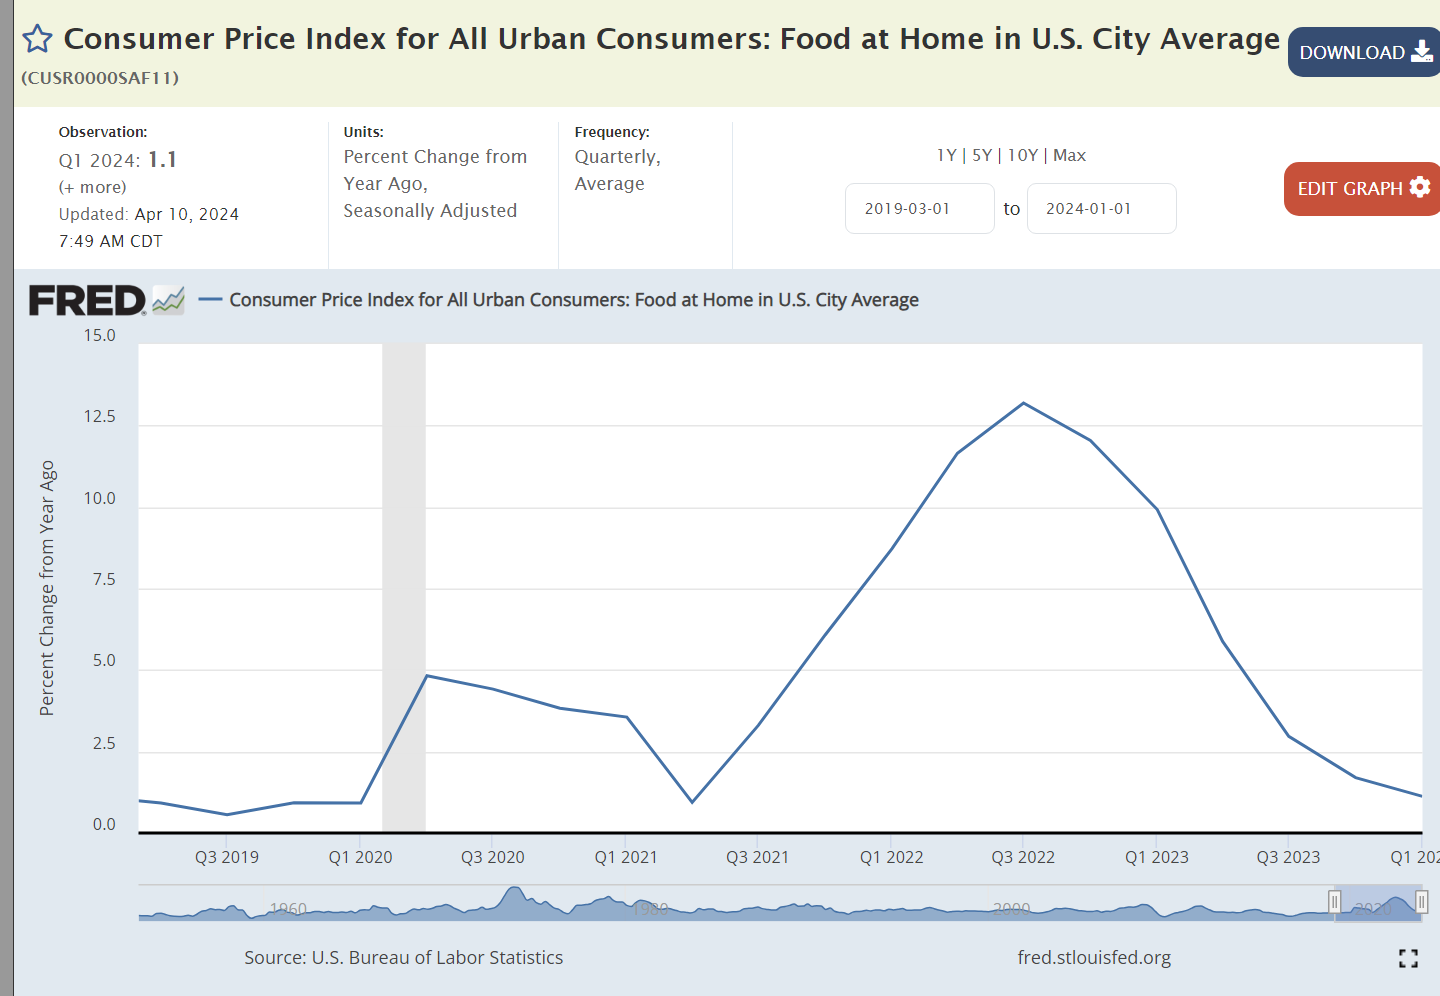
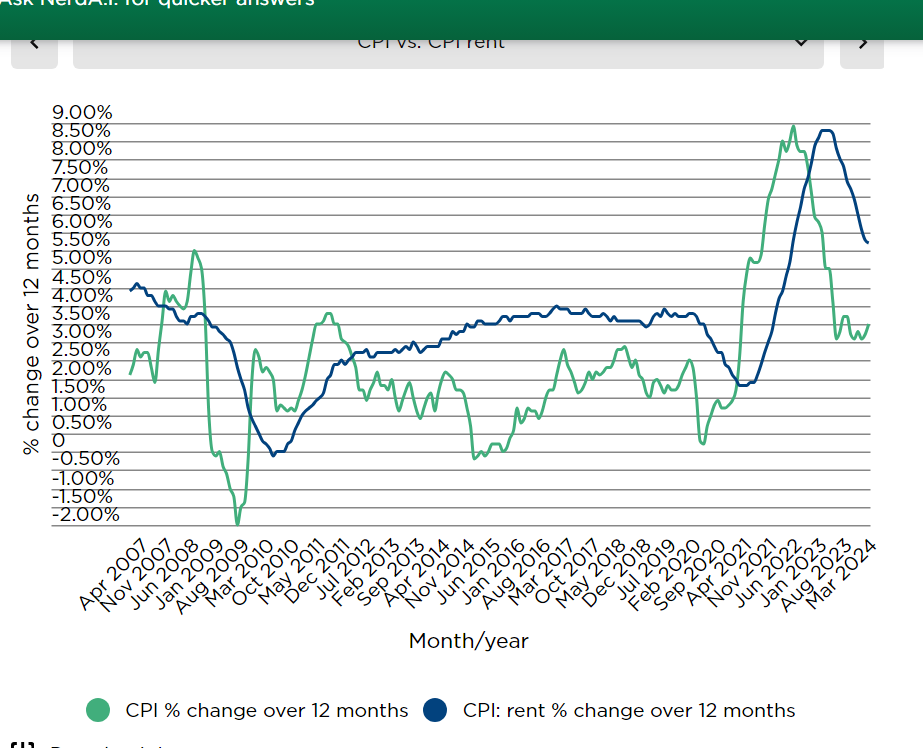
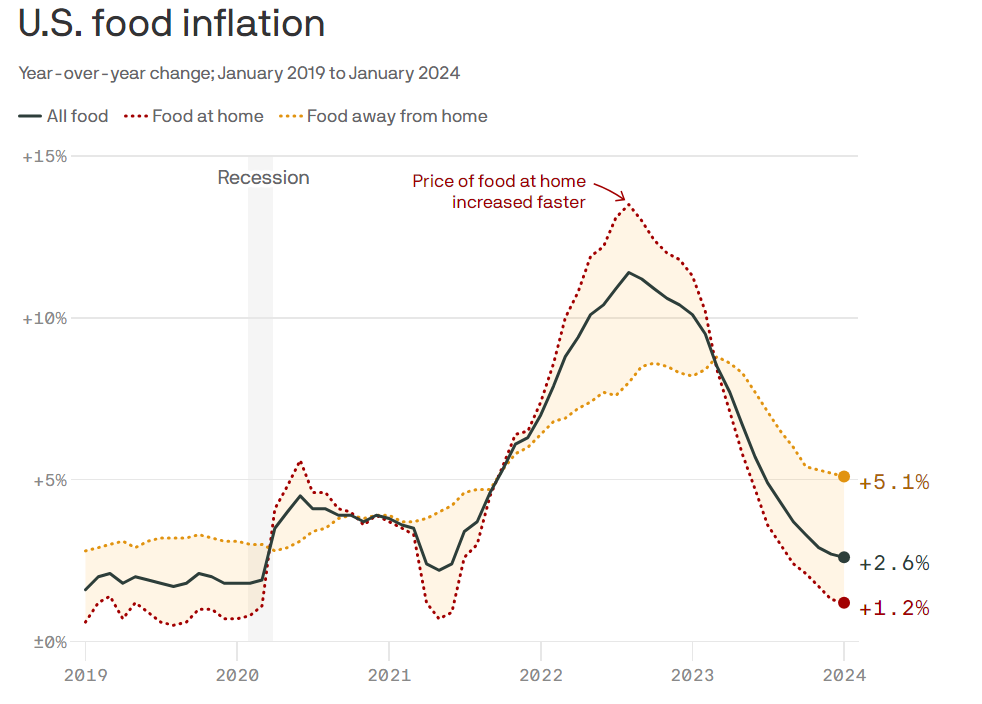
Inflation grew by 2% per year with Trump. It grew by 5% per year, on average, with Biden. Overall prices are 9% higher with Biden. Trump’s economic policies extended the Obama recovery for 3 years without triggering an increase in inflation, despite a low unemployment labor market.
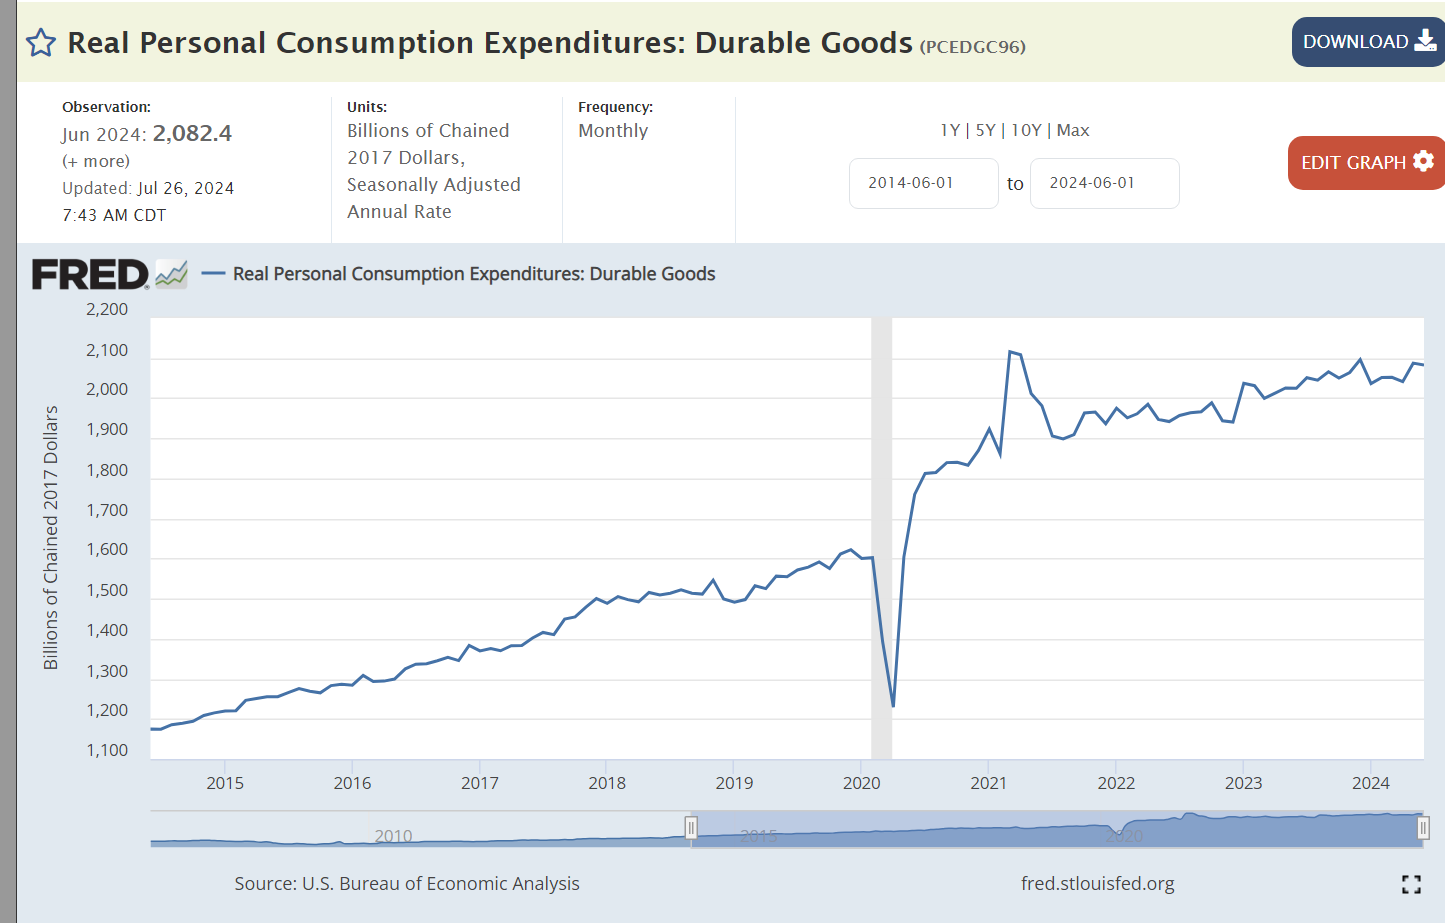
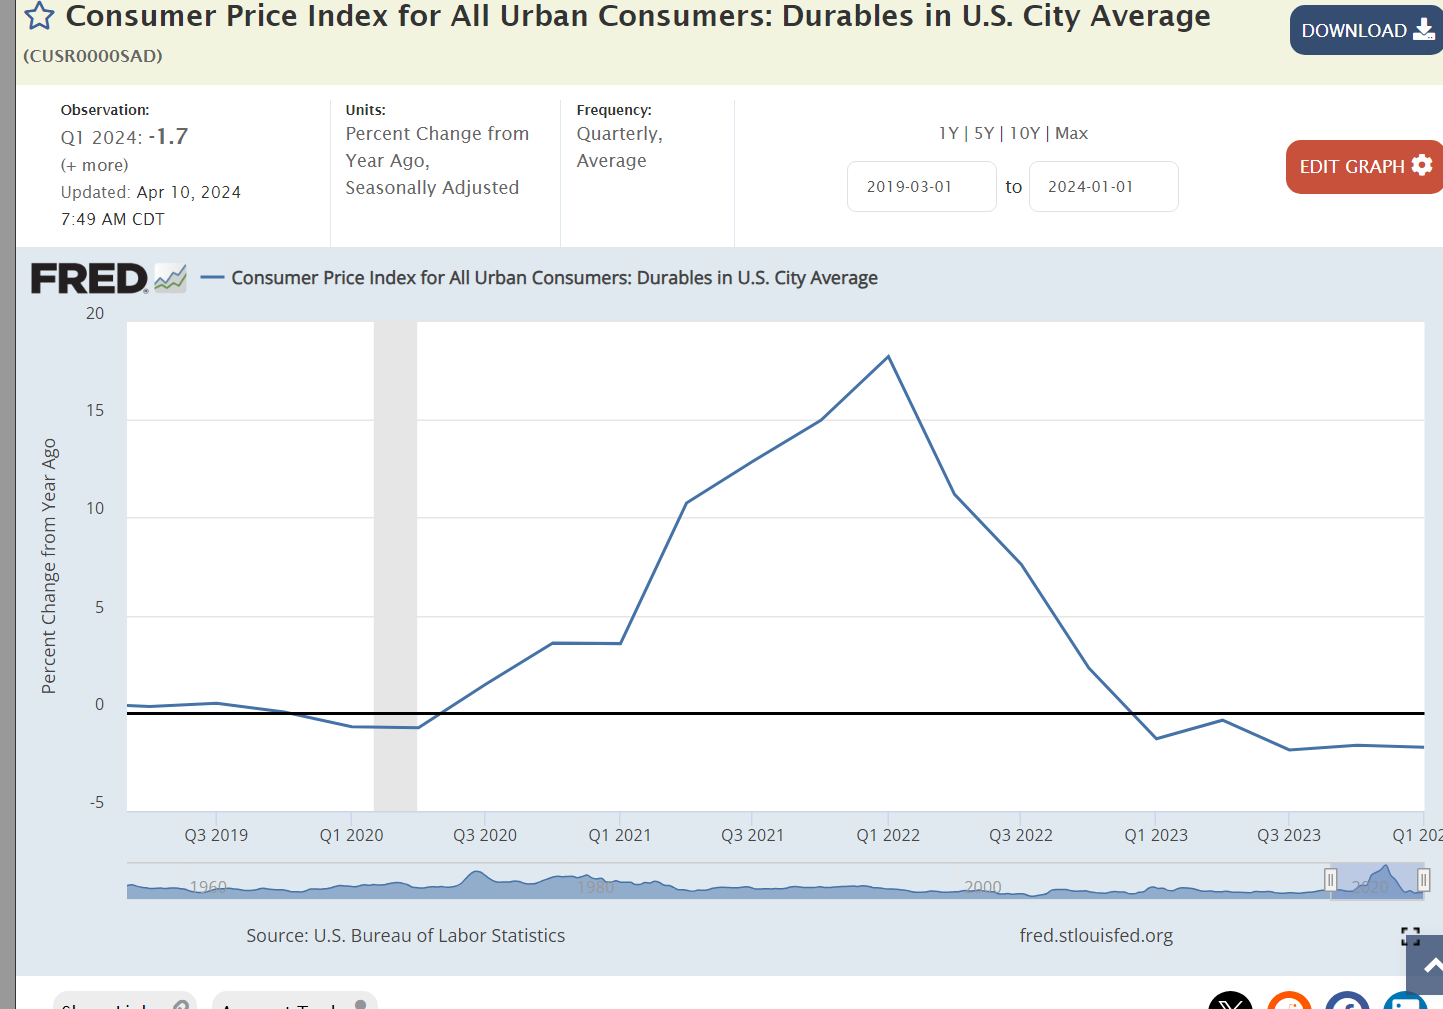
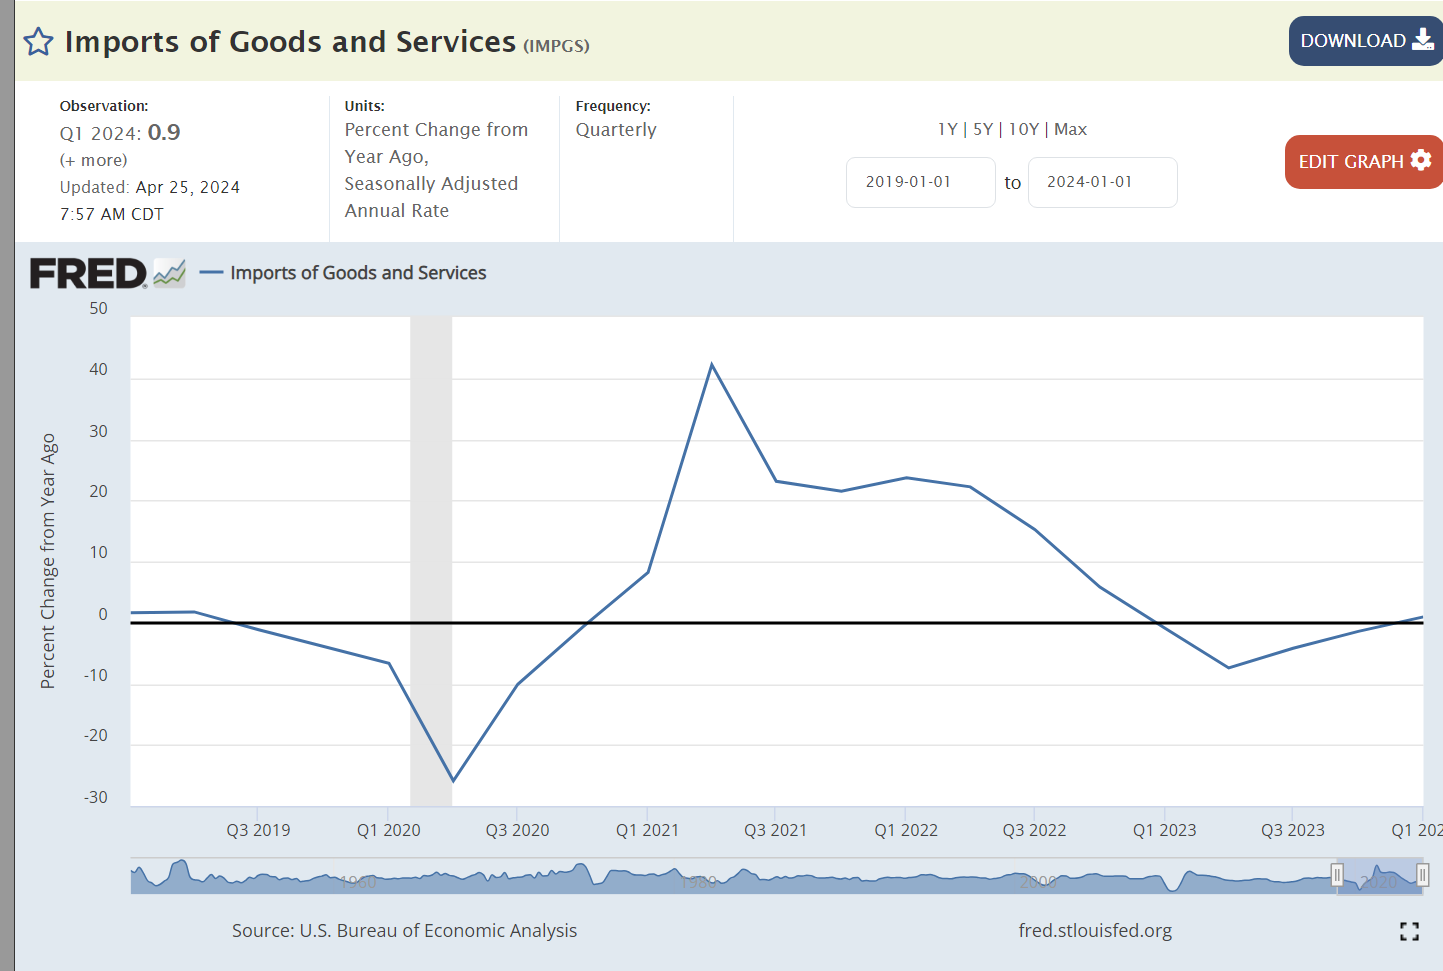
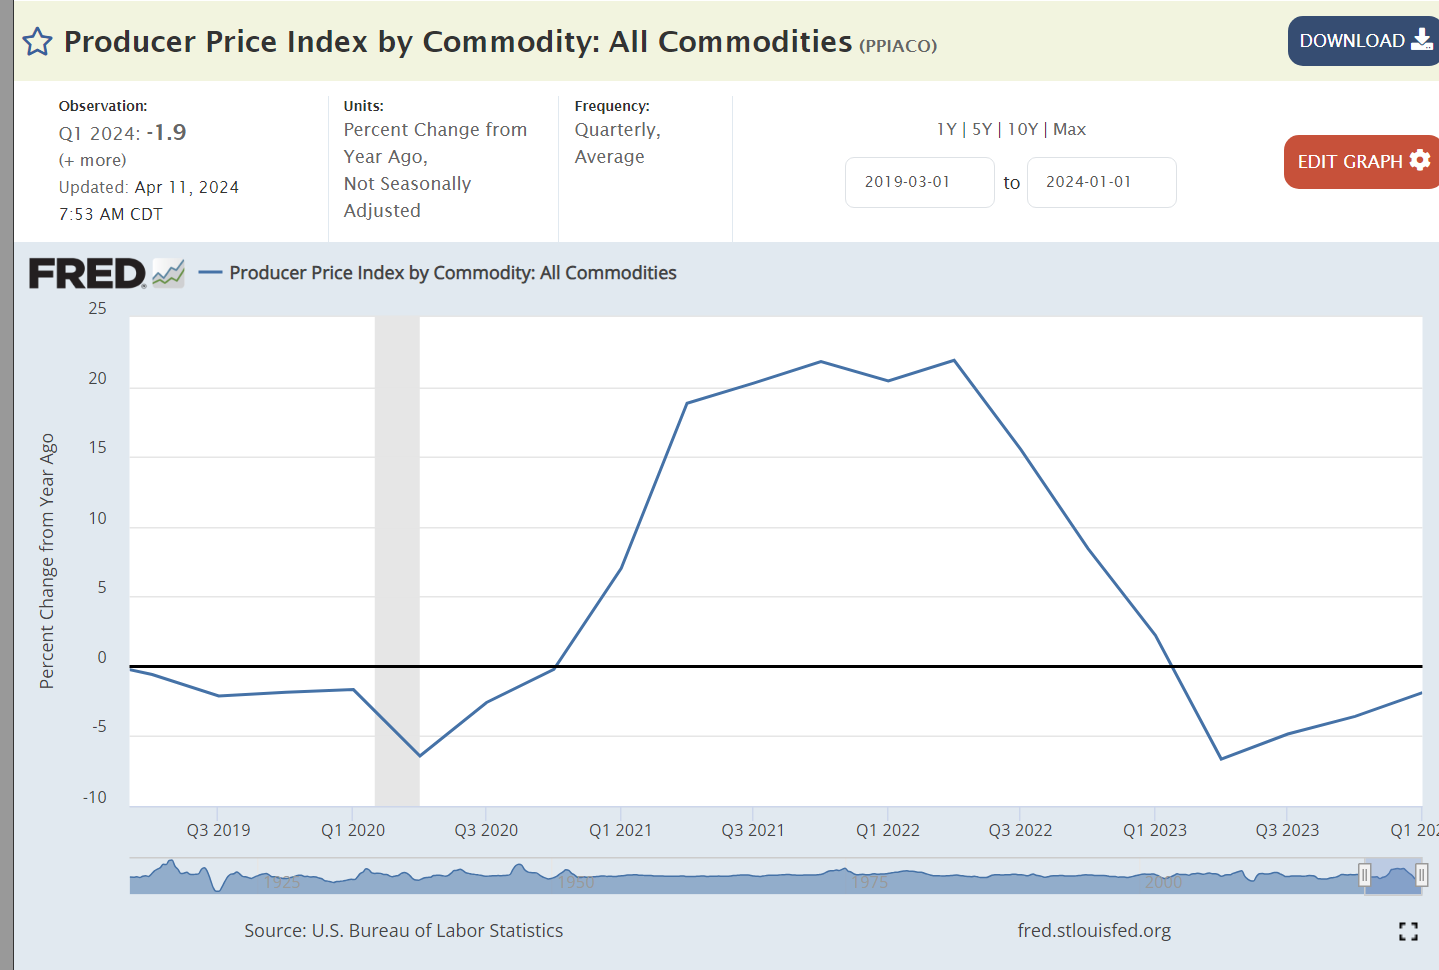
The largest cause of higher than usual inflation in Biden’s term was the 20% spike in US and global demand for durable goods. Factories shut down during the pandemic. Demand rebounded within 6 months as consumers chose to spend money on goods rather than in-person services. Consumer demand at the end of the Biden period is 50% higher than at the start of Trump’s term in office.
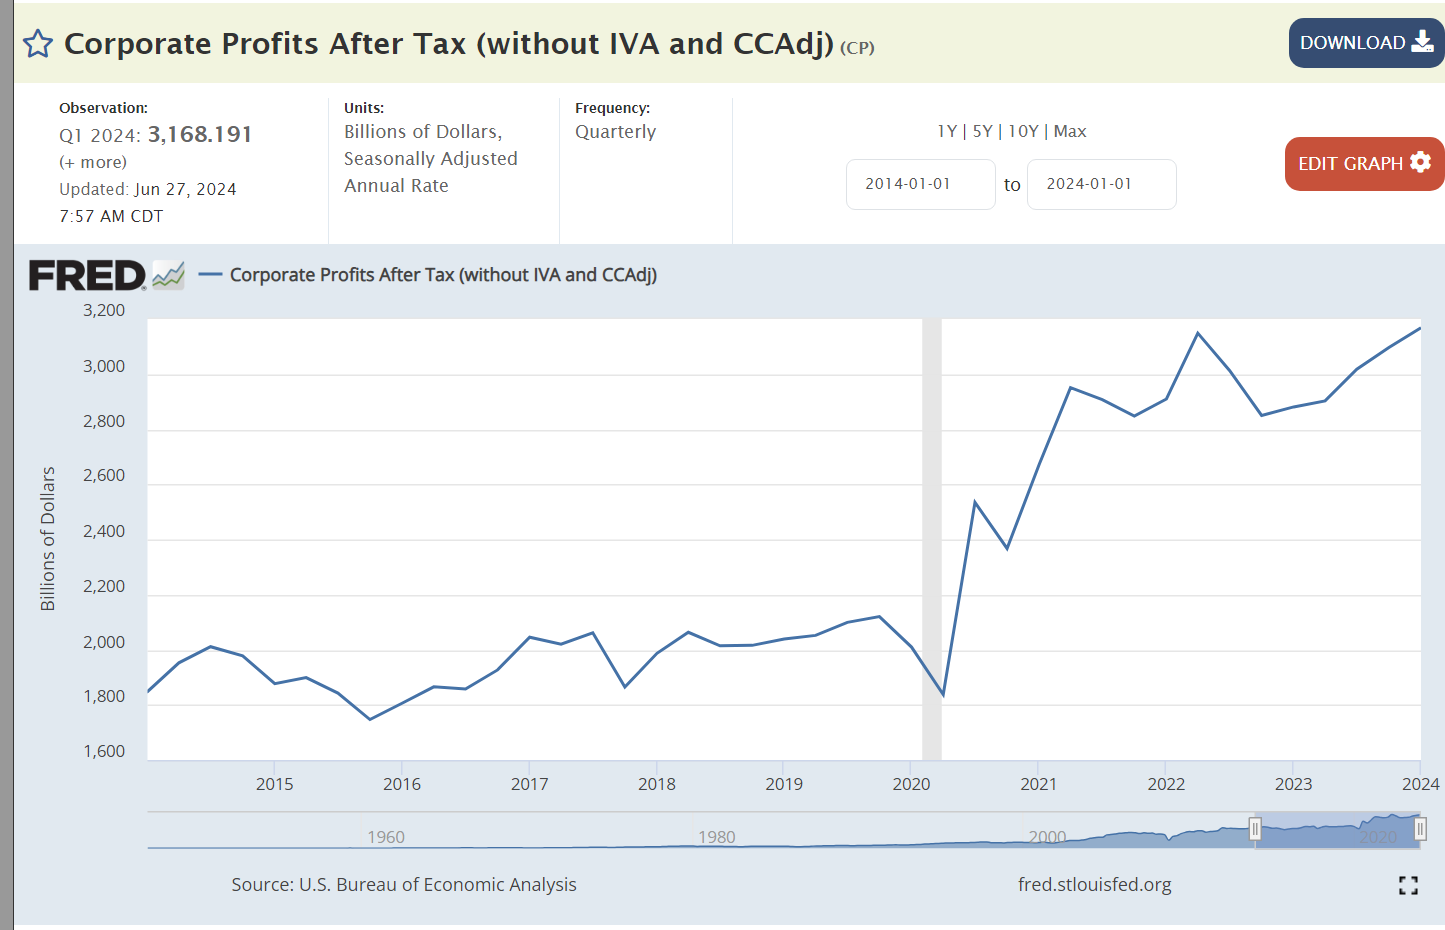
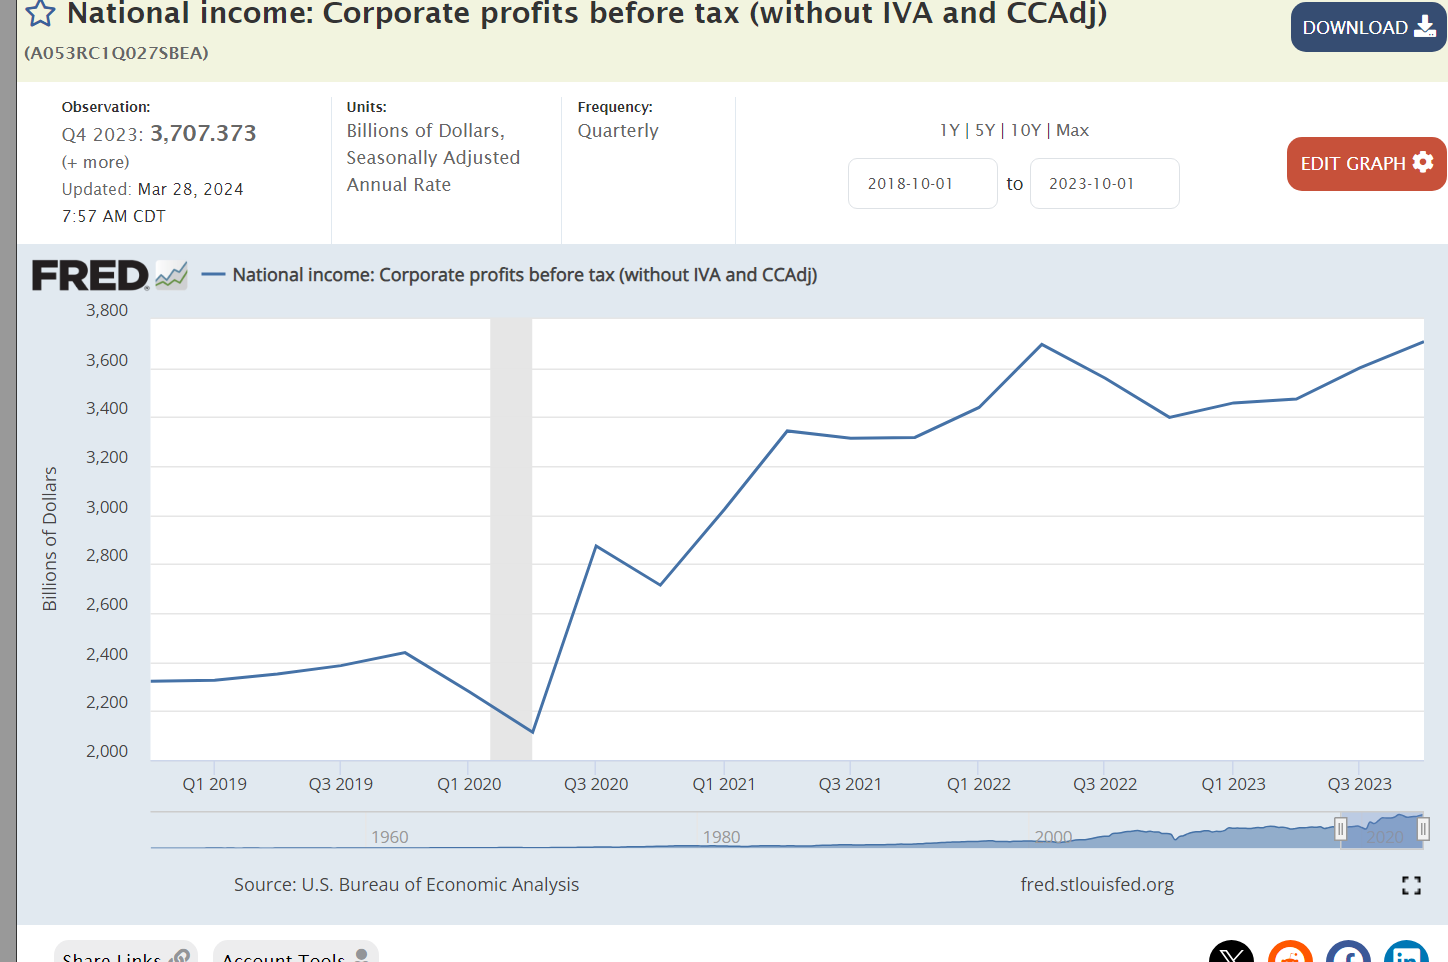
Corporations were able to capture and maintain a 50% profit increases due to market disruptions of the pandemic. Experts mostly reject Biden’s claims that corporate profits were the main driver of inflation, but they clearly aggravated the impact of the supply chain disruptions.

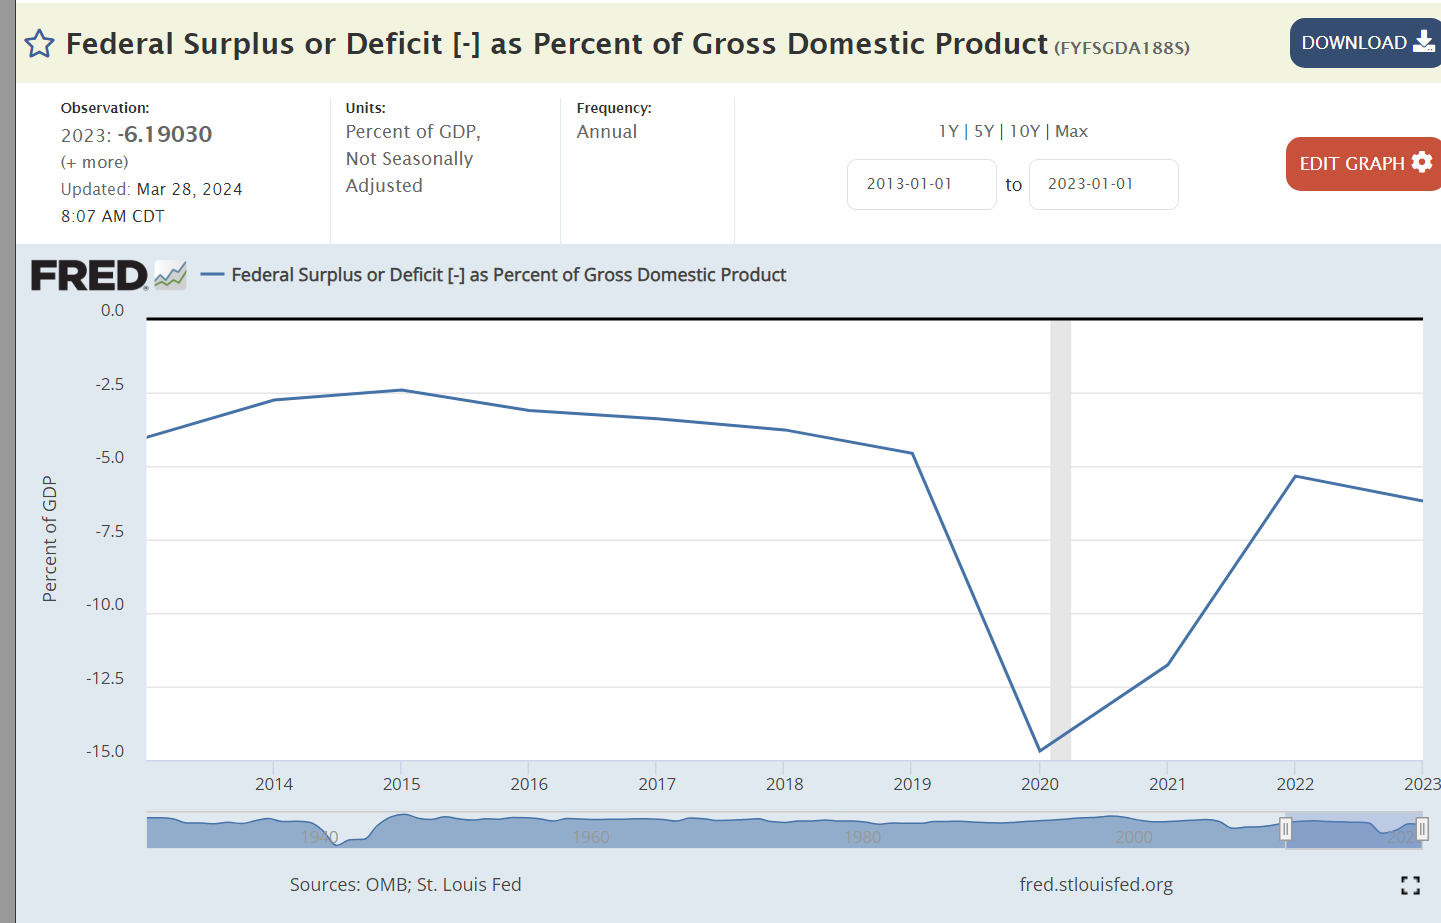
Obama was able to reduce federal budget deficits by two-thirds by the end of his presidency. Deficits doubled on Trump’s watch before the pandemic arrived. Biden cut deficits from their record highs during the pandemic, but they have been 50% higher than the pre-pandemic Trump era. Most economists consider the budget deficits to be the main cause of the continued higher than typical rates of inflation, accounting for 3%, 2% and 1% extra inflation in the 3-year Biden time we’re considering.

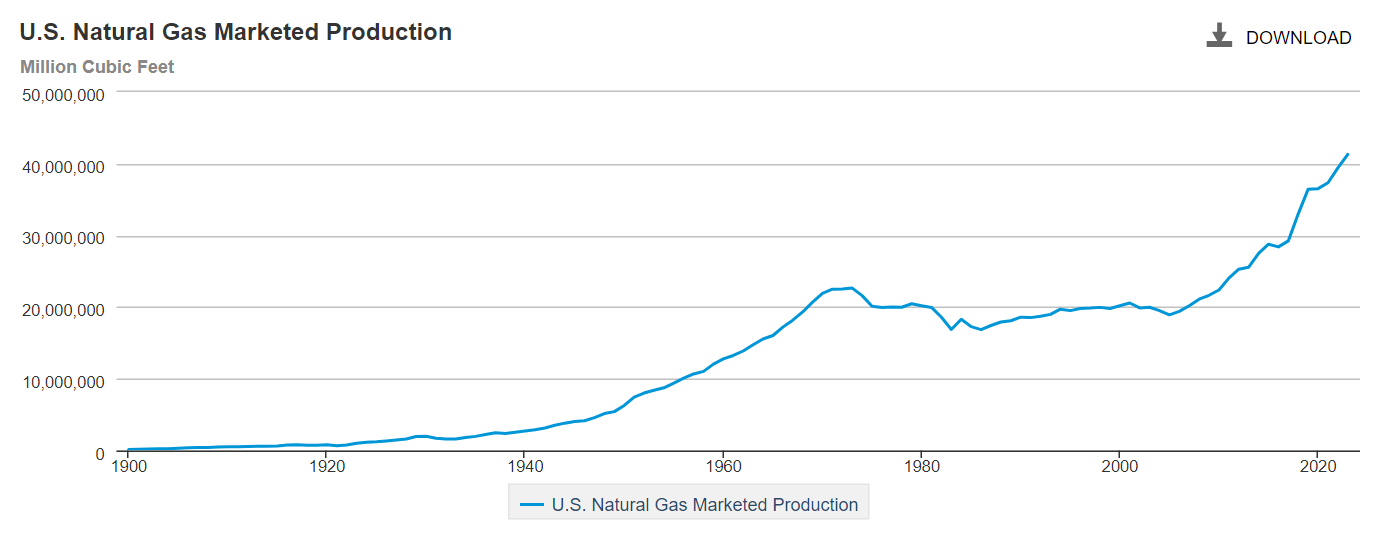
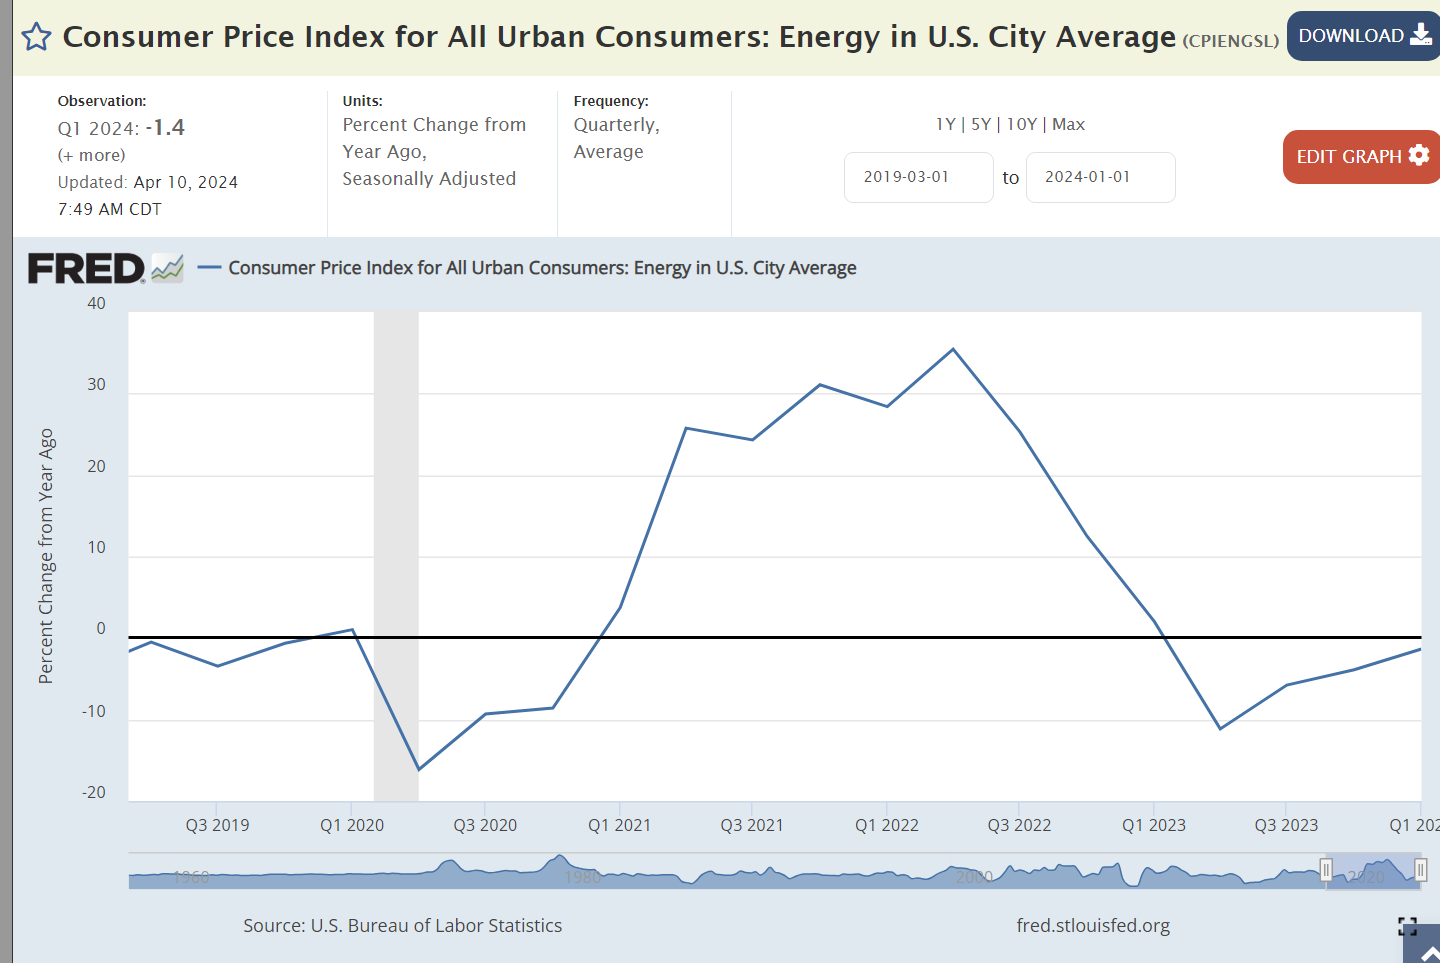
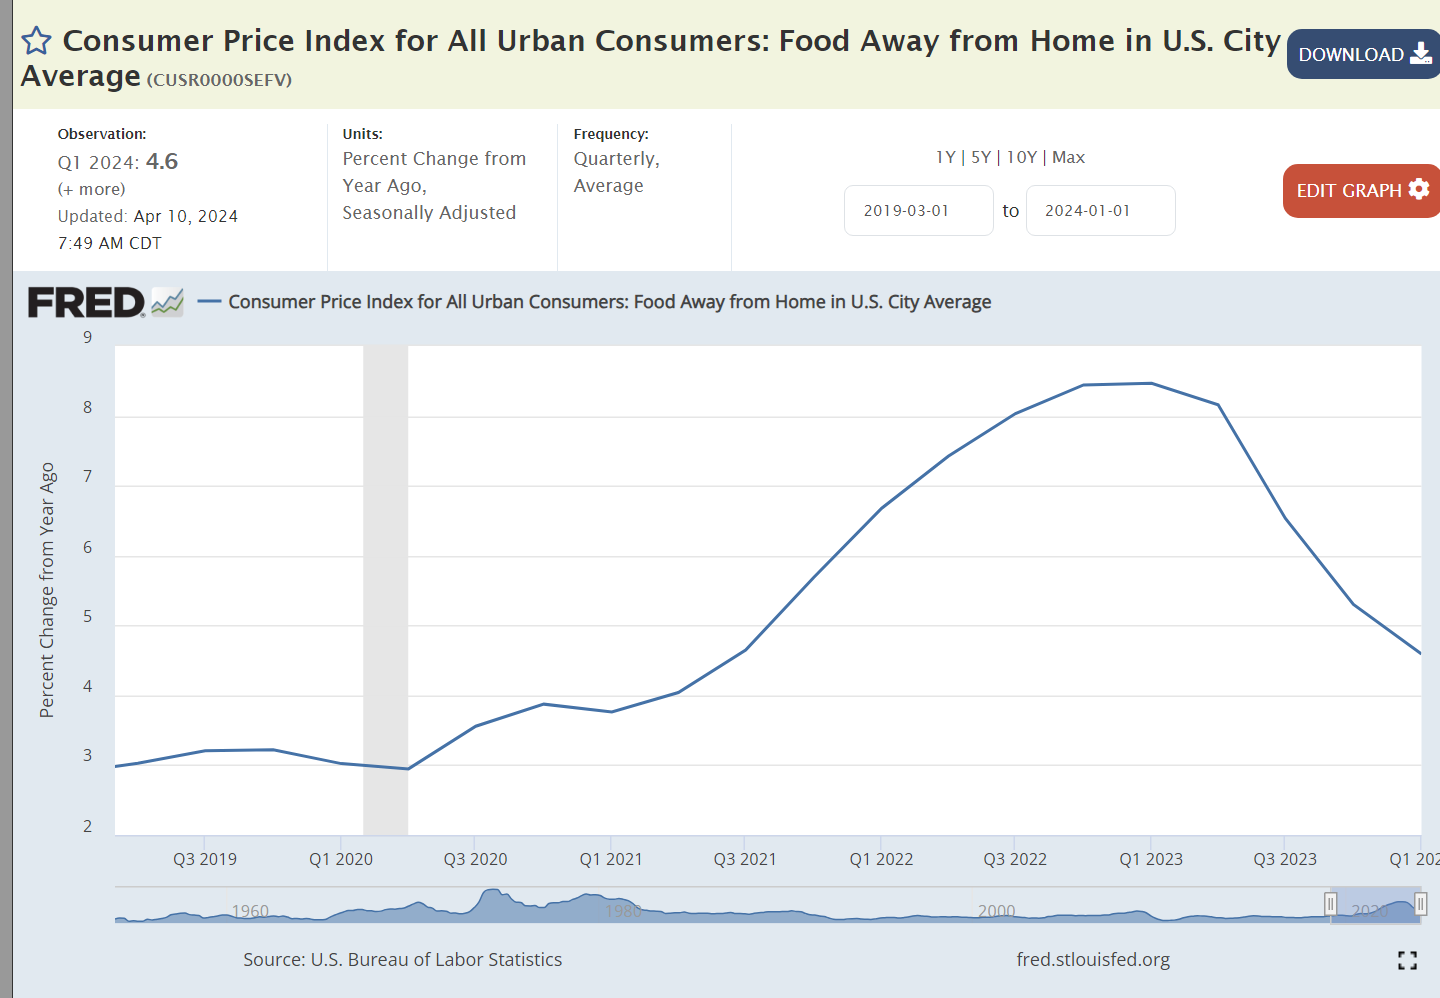
High profile gas prices remined flat during Trump’s period. Global supply and demand caused prices to increase from $2.50 per gallon to $3.50/gallon where they have remained for the last 3 years.

Trump enjoyed historically low 4% mortgage interest rates, a thin 2% above the inflation rate. The expansion of the money supply drive rates down to 3% during 2020 and 2021. They rose to 7% as inflation rose sharply and has stayed there. Inflation has fallen but markets typically require years of data to reset expectations of long-term inflation which drive mortgage rates. The Federal Reserve Bank has hesitated to cut its benchmark interest rates until inflation is clearly approaching its 2% target.
Labor Market: Advantage Biden
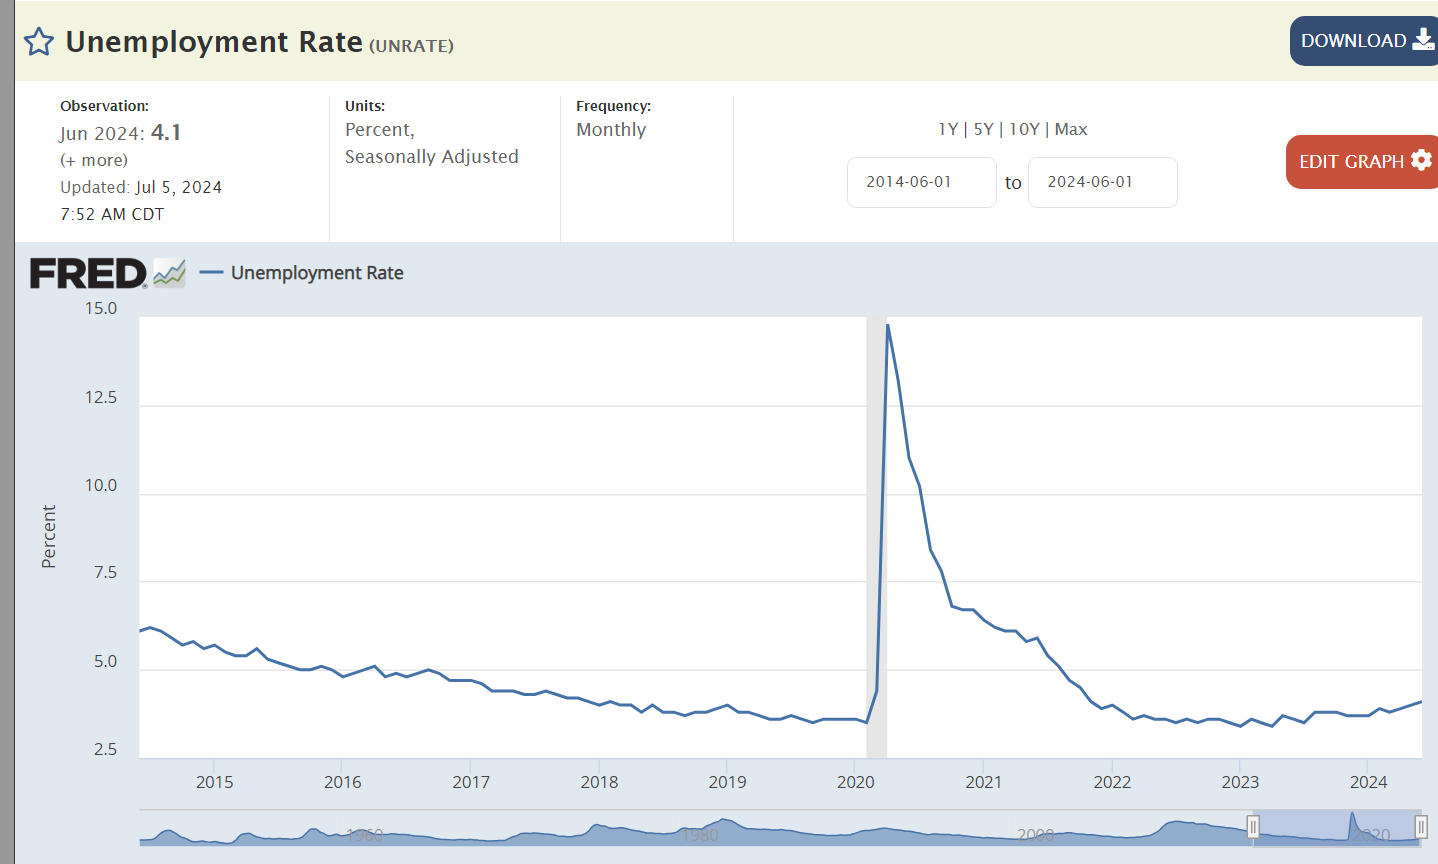
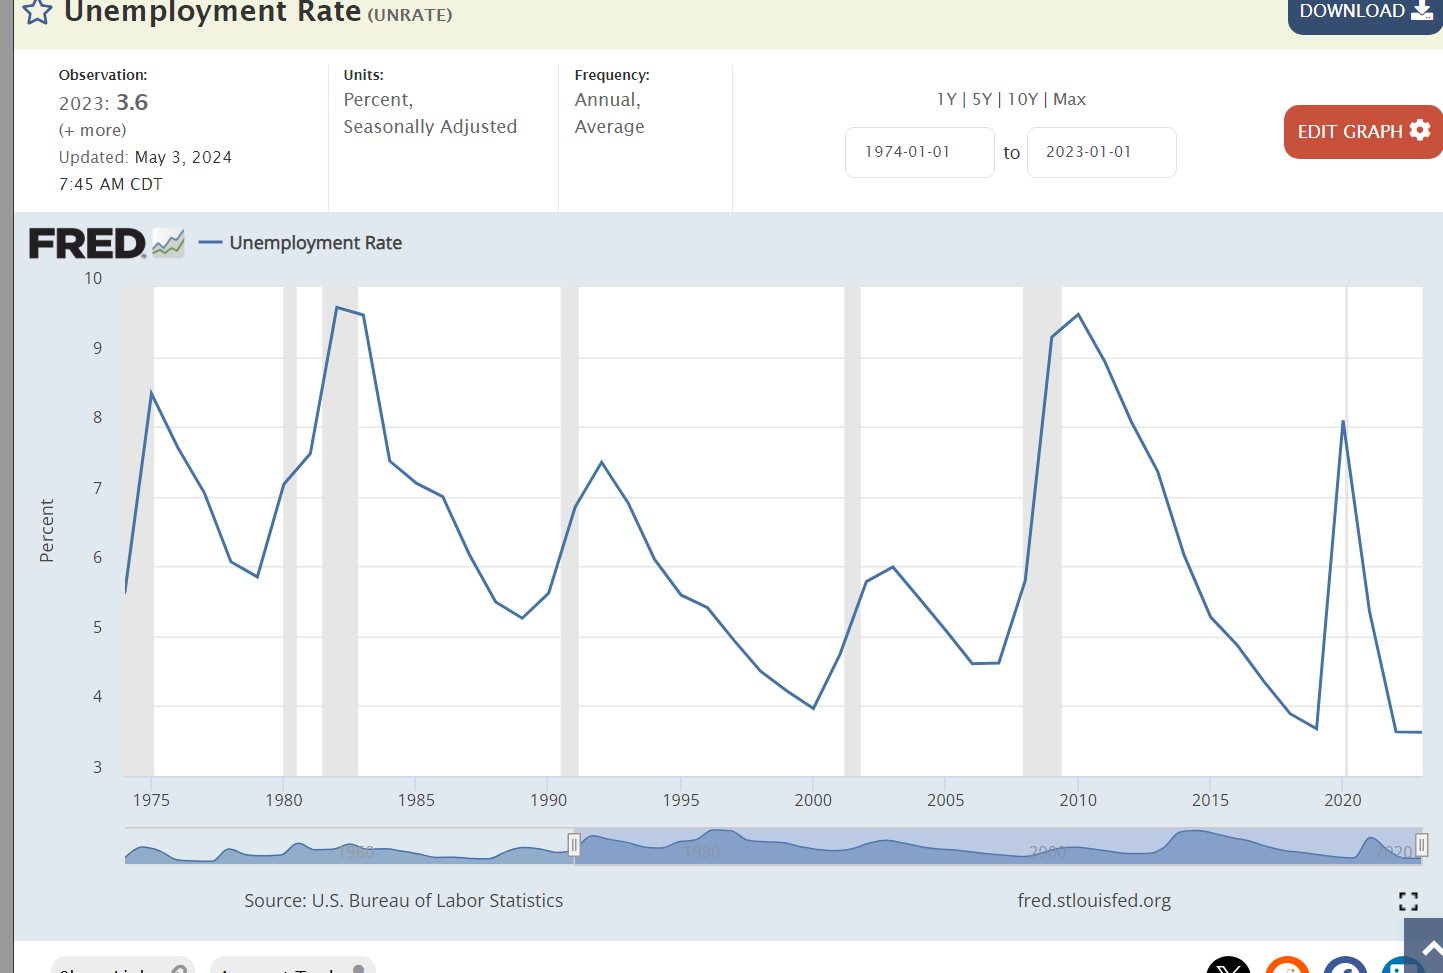
Trump reduced unemployment by 1%. Biden reduced it by 2%. Both presided over best in 50 years overall labor markets.

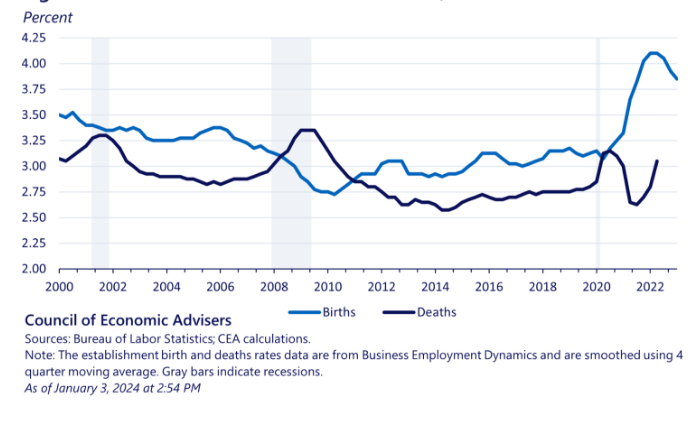
Layoffs have remained at historic lows, with Biden enjoying slightly lower rates.

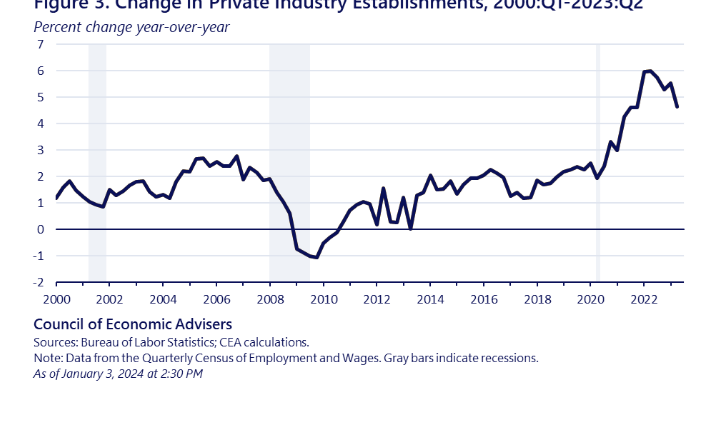
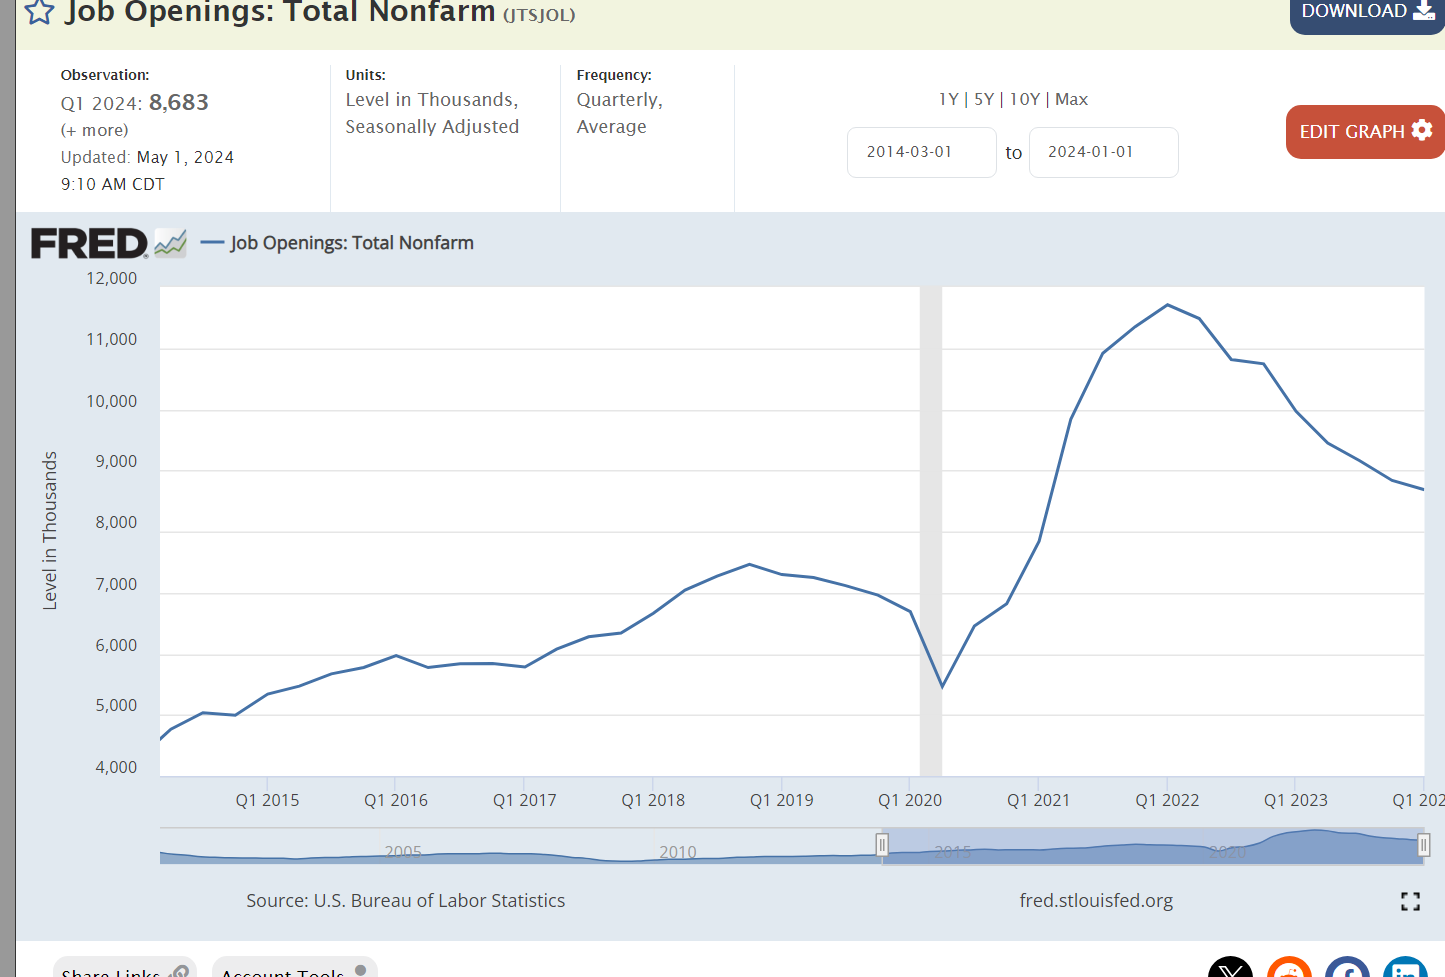
Job openings in the Biden market have been 50% higher than the Trump market, reflecting a strong economy with growing labor demand, despite the impact of the pandemic.
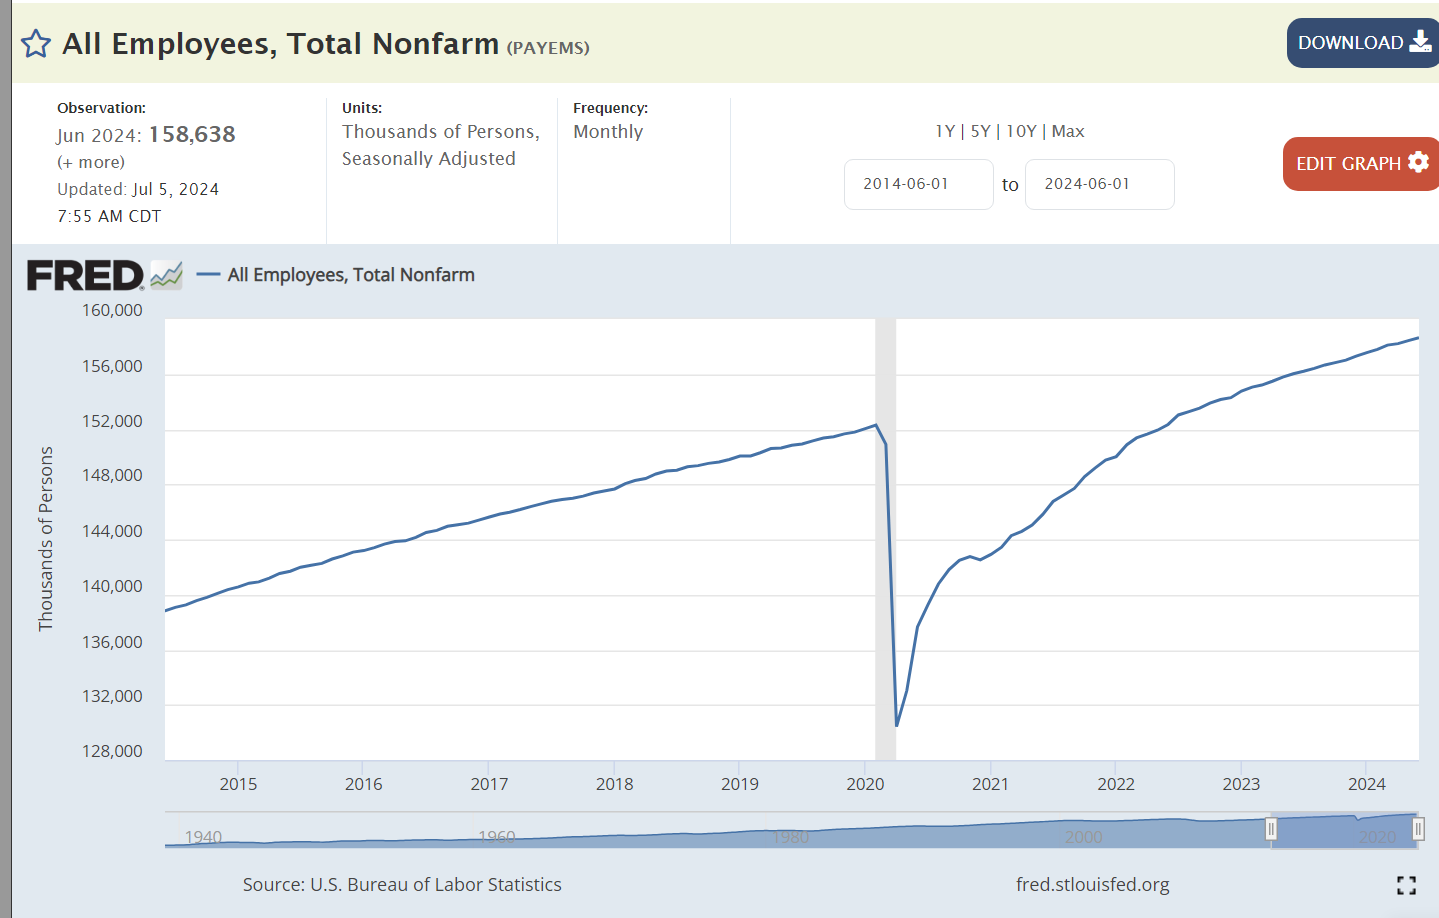
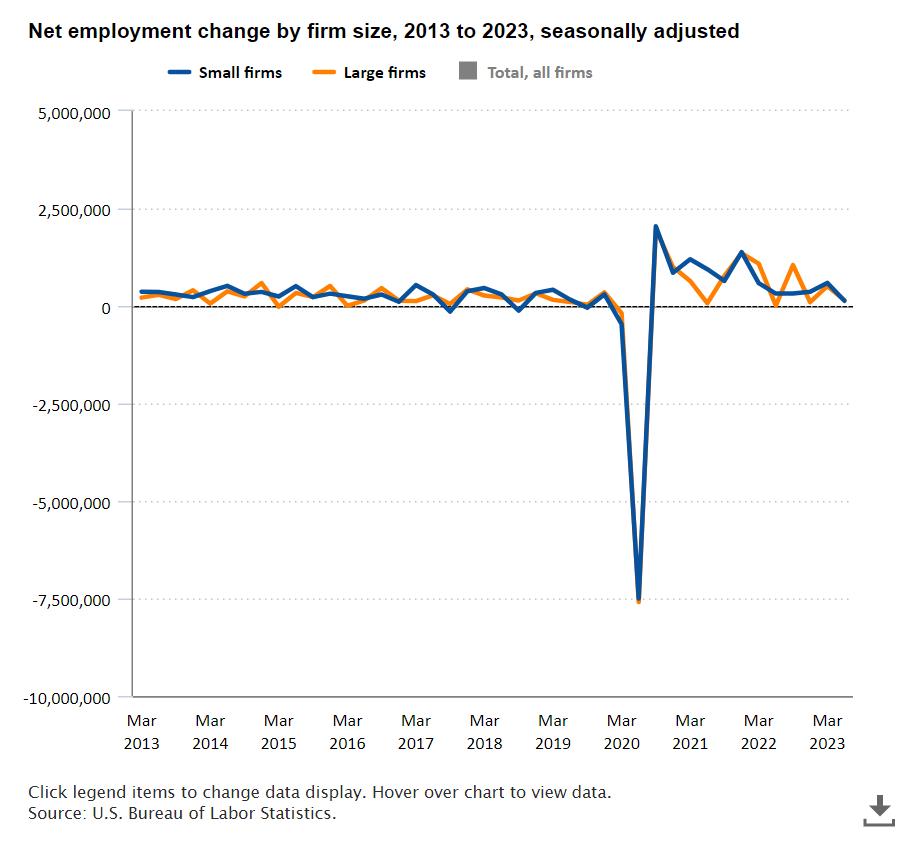
The Biden economy recovered all 20 million jobs lost in the pandemic within 2 years, much faster than expected. Total employment has continued to grow at the trend rate to a record 159 million.
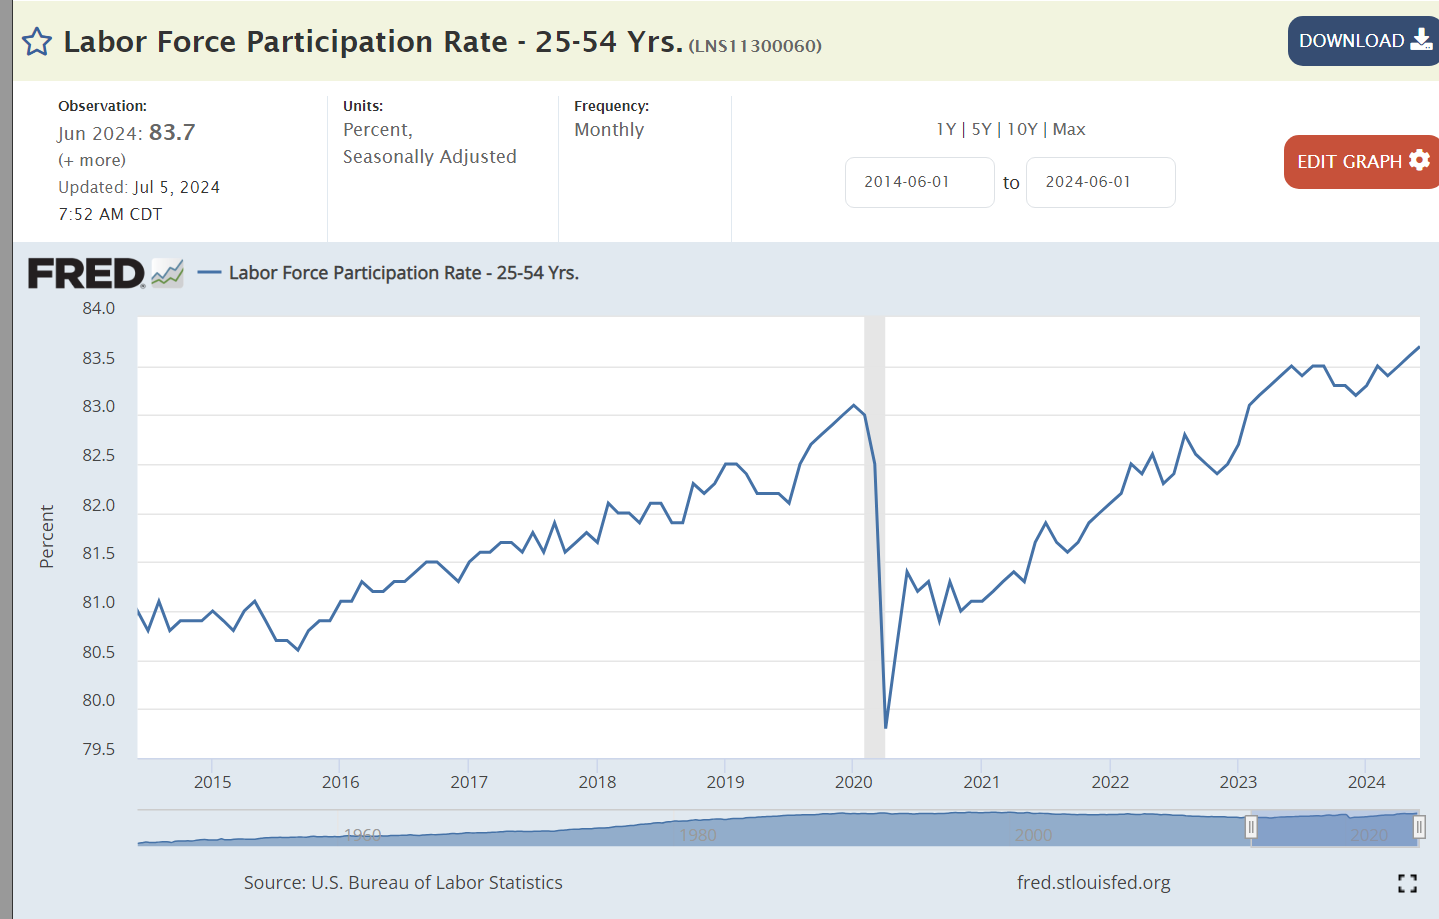
Core labor force participation is 1% higher with Biden than Trump. The current participation rate was last achieved in 2001.

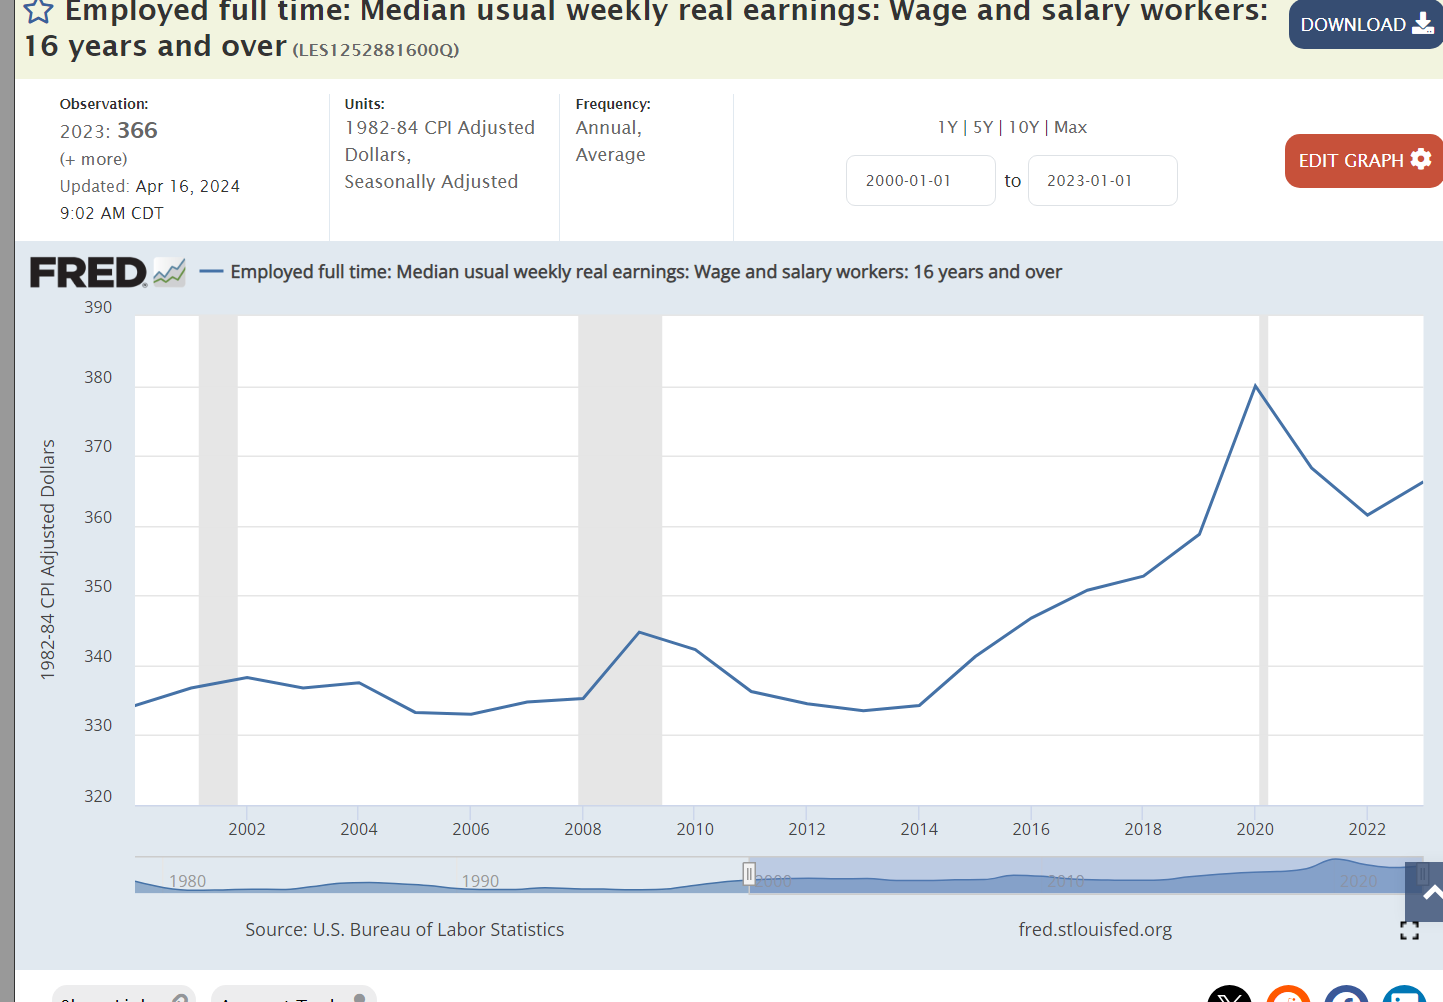
Median real wages have been slightly higher during Biden’s tenure.
Asset Values: Advantage Biden

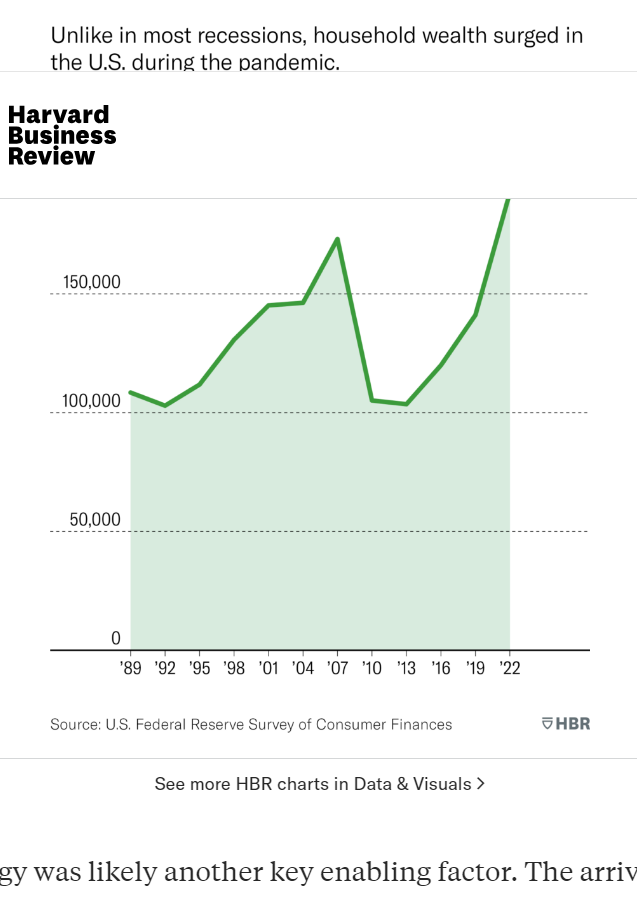
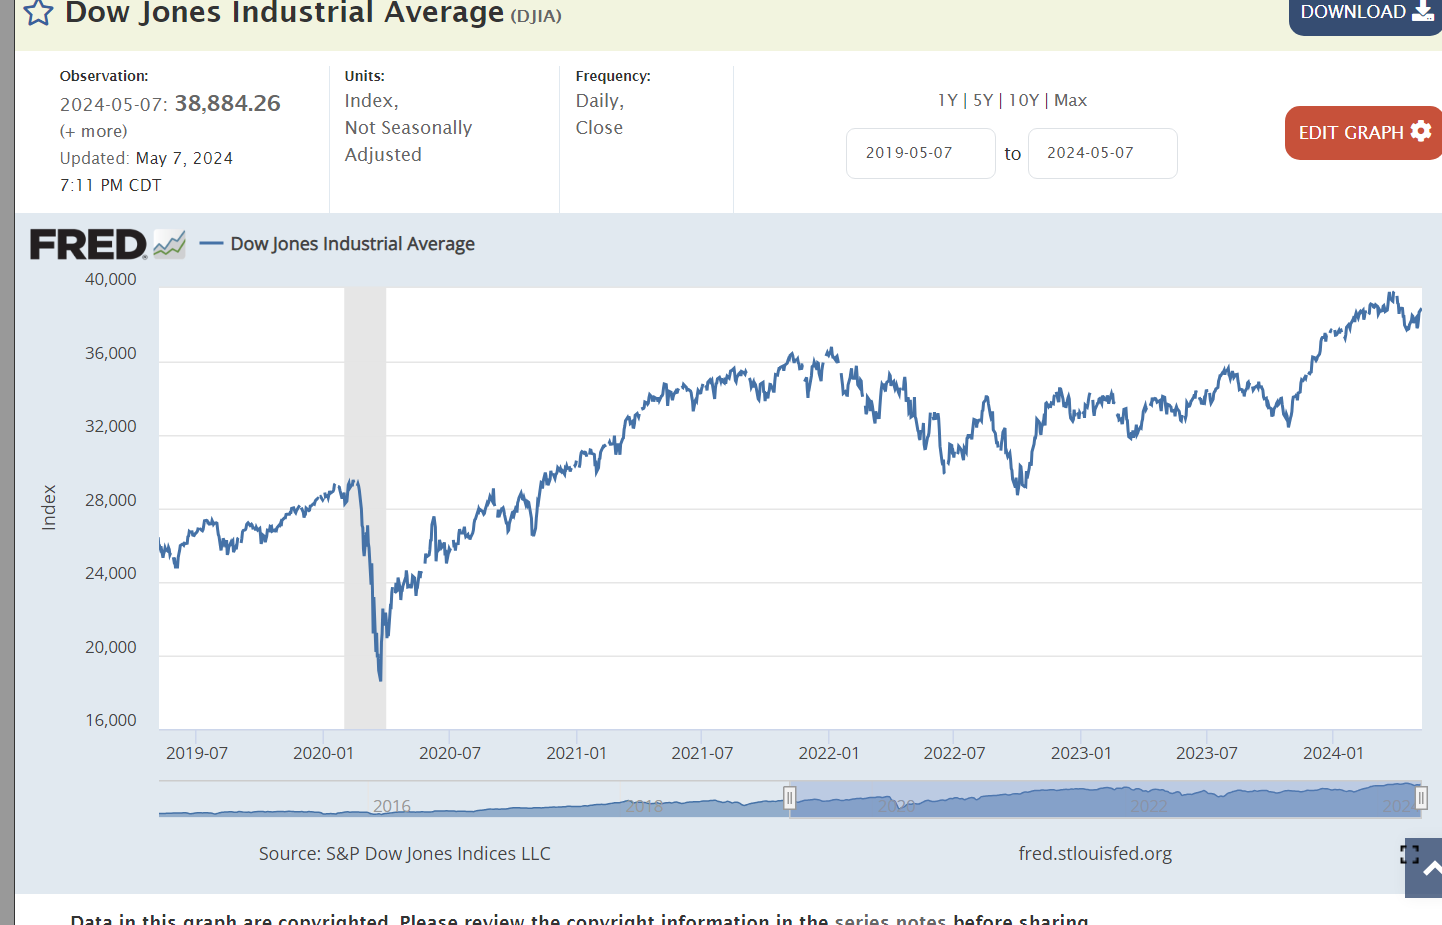
Despite the pandemic disruptions and losses, US firms are worth 70% more today than before the pandemic. This reflects the 50% profits increase and continued positive future prospects.
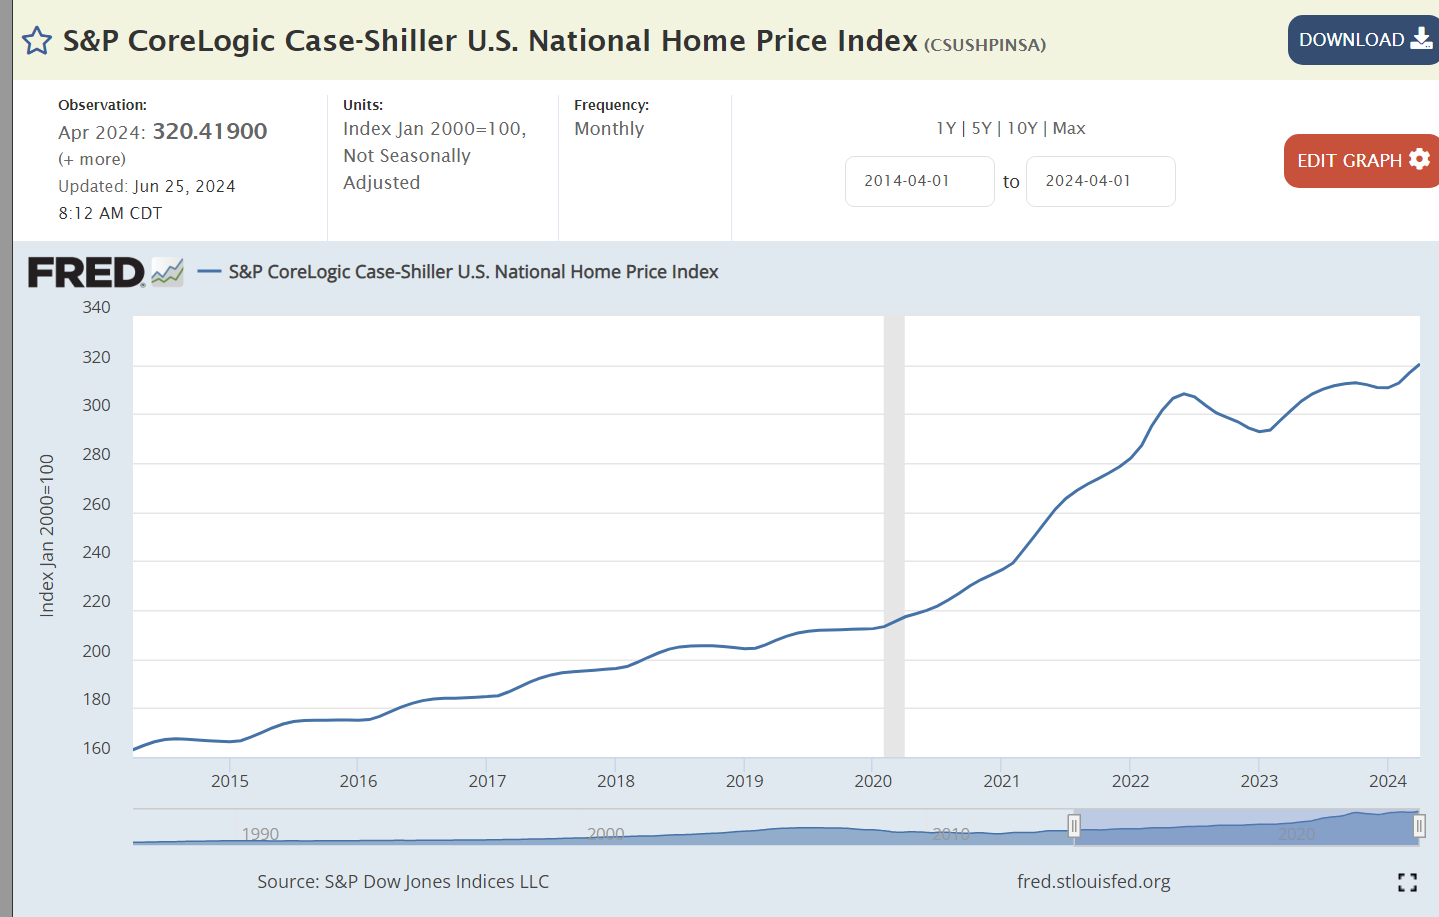
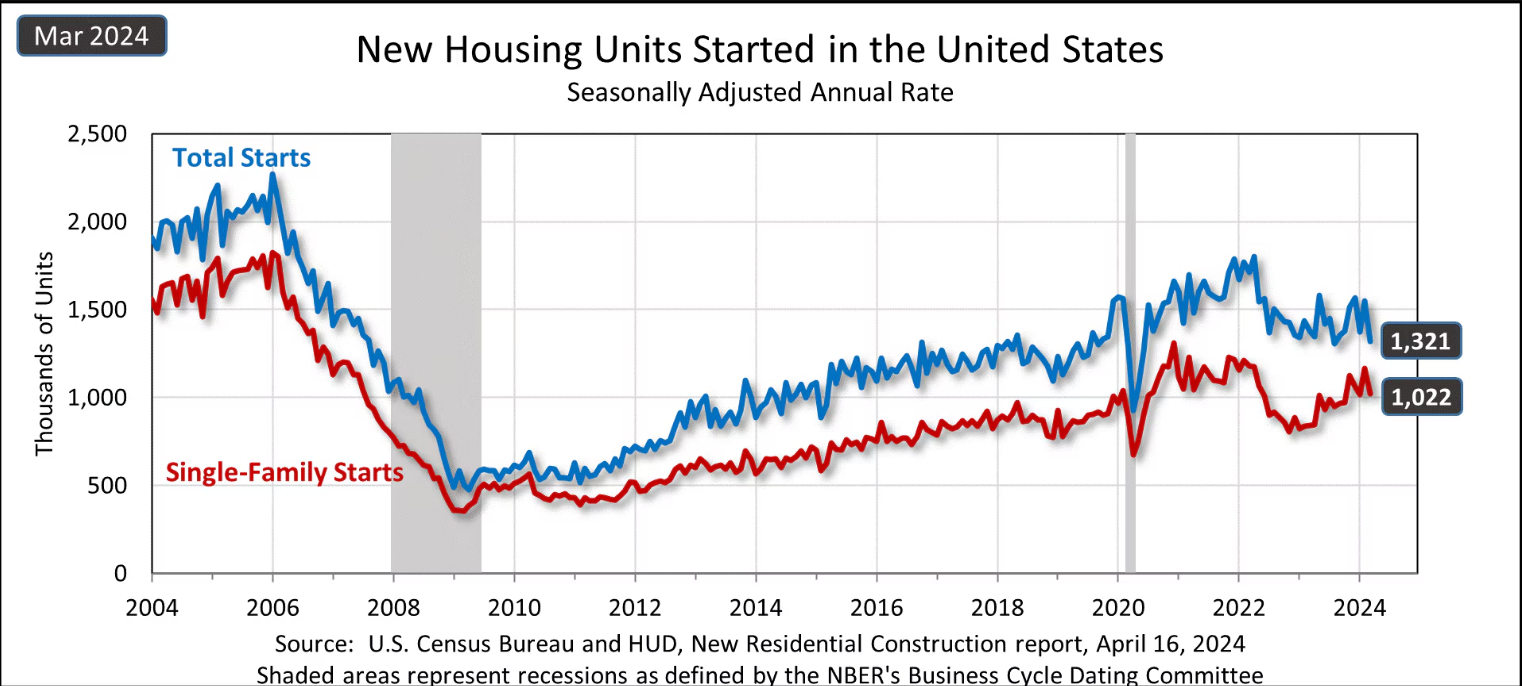
Home prices have nearly doubled since before the pandemic, reflecting the post Great Recession decline in home building, construction issues during the pandemic and general asset inflation caused by the rapid expansion of the money supply.

The US enjoyed a solid 7% savings rate before the pandemic, an extraordinary high 10% after the pandemic, falling to just 4% for the last 3 years.

https://educationdata.org/number-of-college-graduates
Human assets increased during Trump’s presidency and resumed growth after the pandemic. As college graduation rates have increased throughout the post WWII years, the cumulative number of college educated individuals continues to rise each year. The growth in masters and professional degrees is noteworthy.
The Economy – Advantage Biden
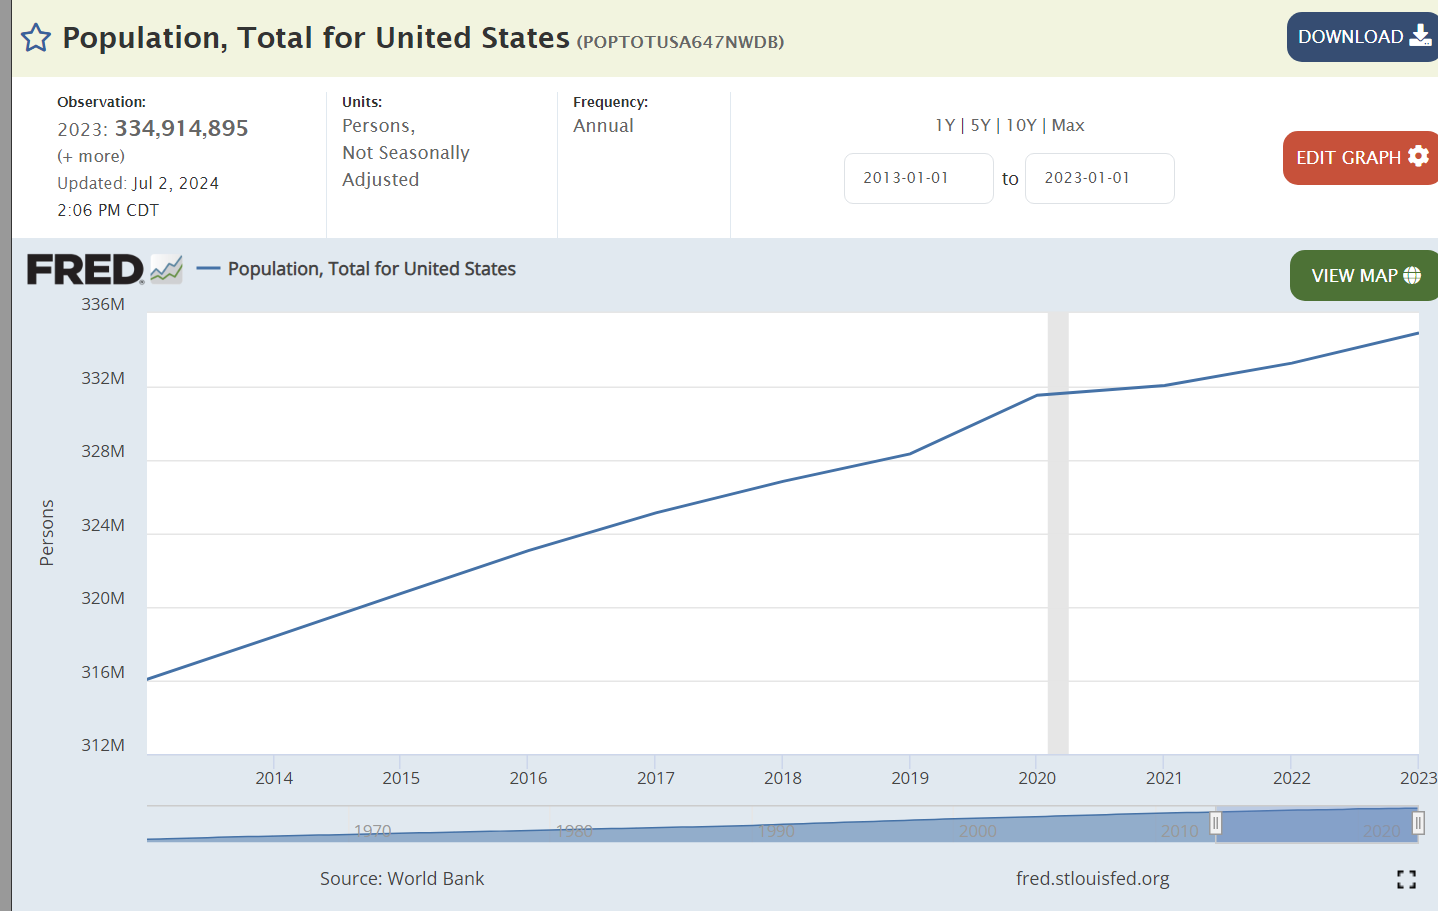
Population growth has resumed after the pandemic.

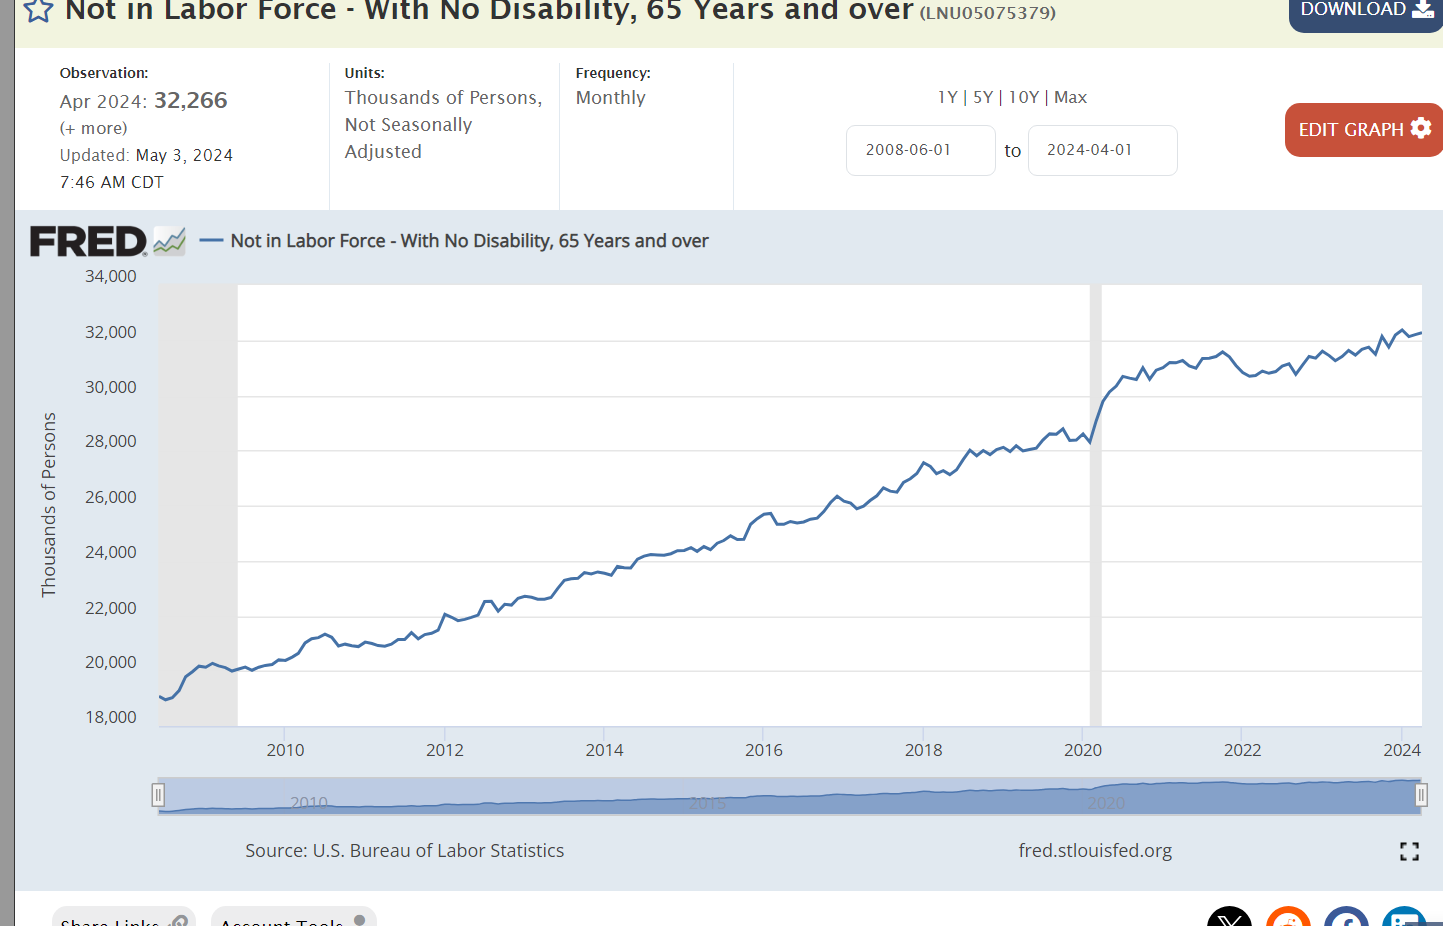
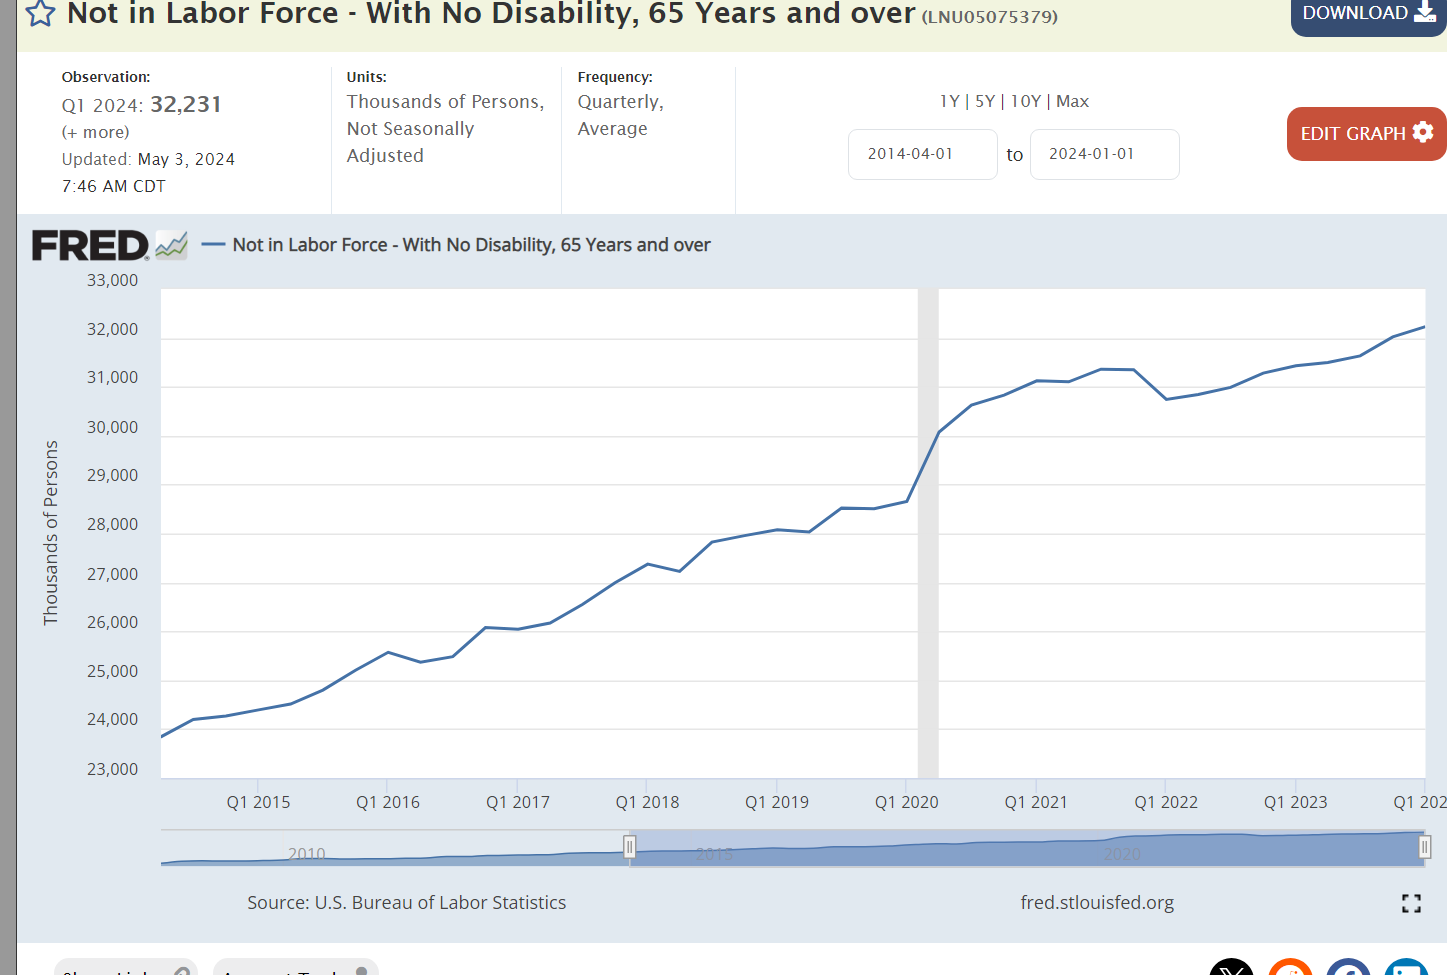
The healthy US economy is able to support 3 million more retirees after the pandemic.

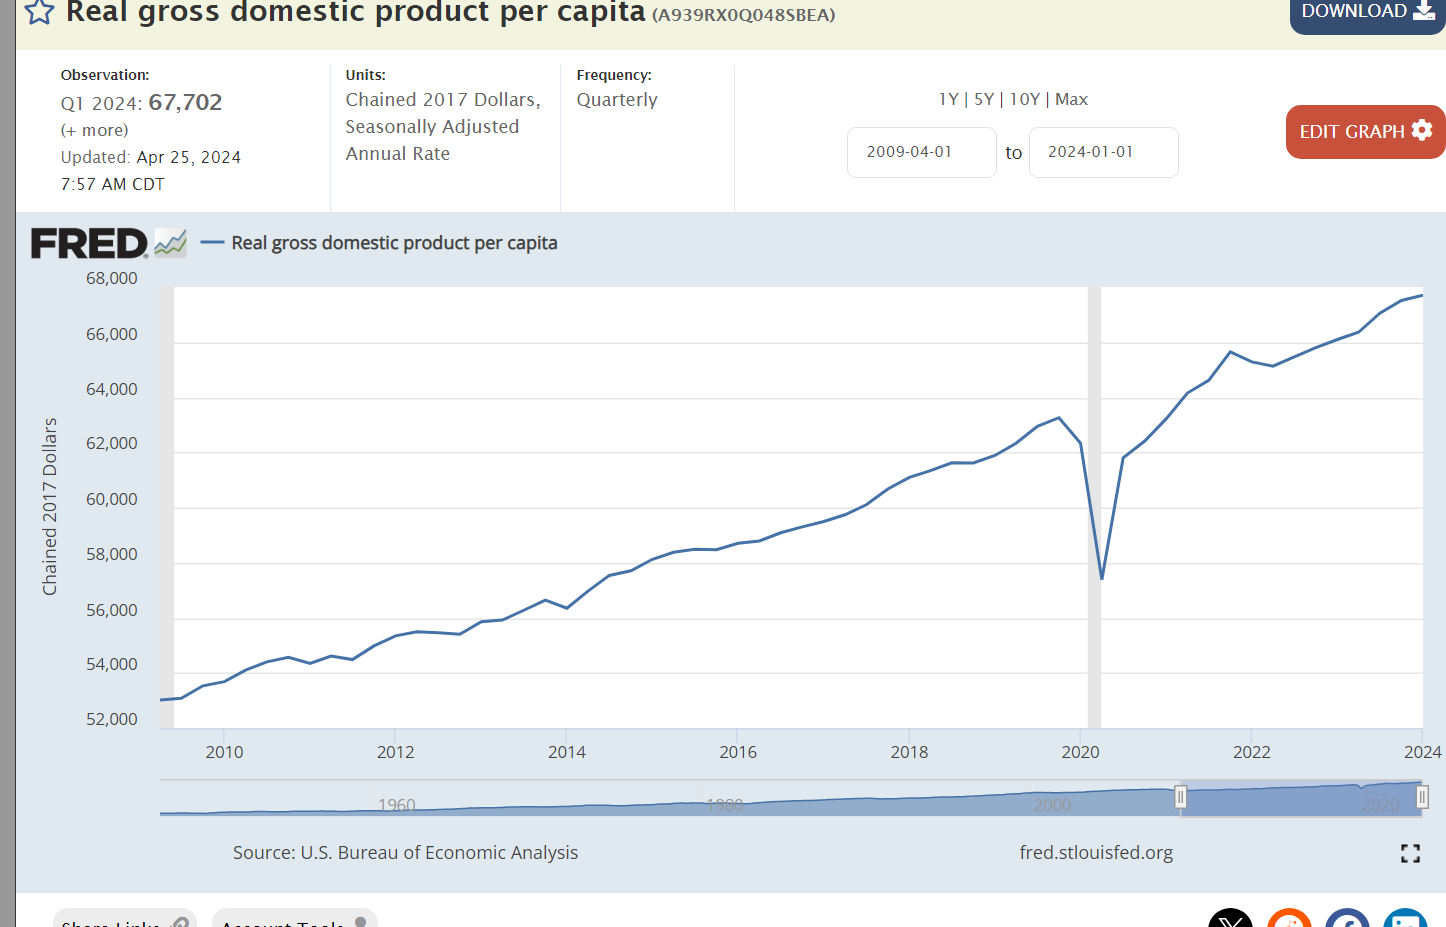
Real dollar GDP is 2 trillion dollars larger than before the pandemic disruption. That increase is the same size as the total GDP of Russia, Canada or Mexico. We added the Canada economy during Trump’s time and the Mexican economy during Biden’s time.
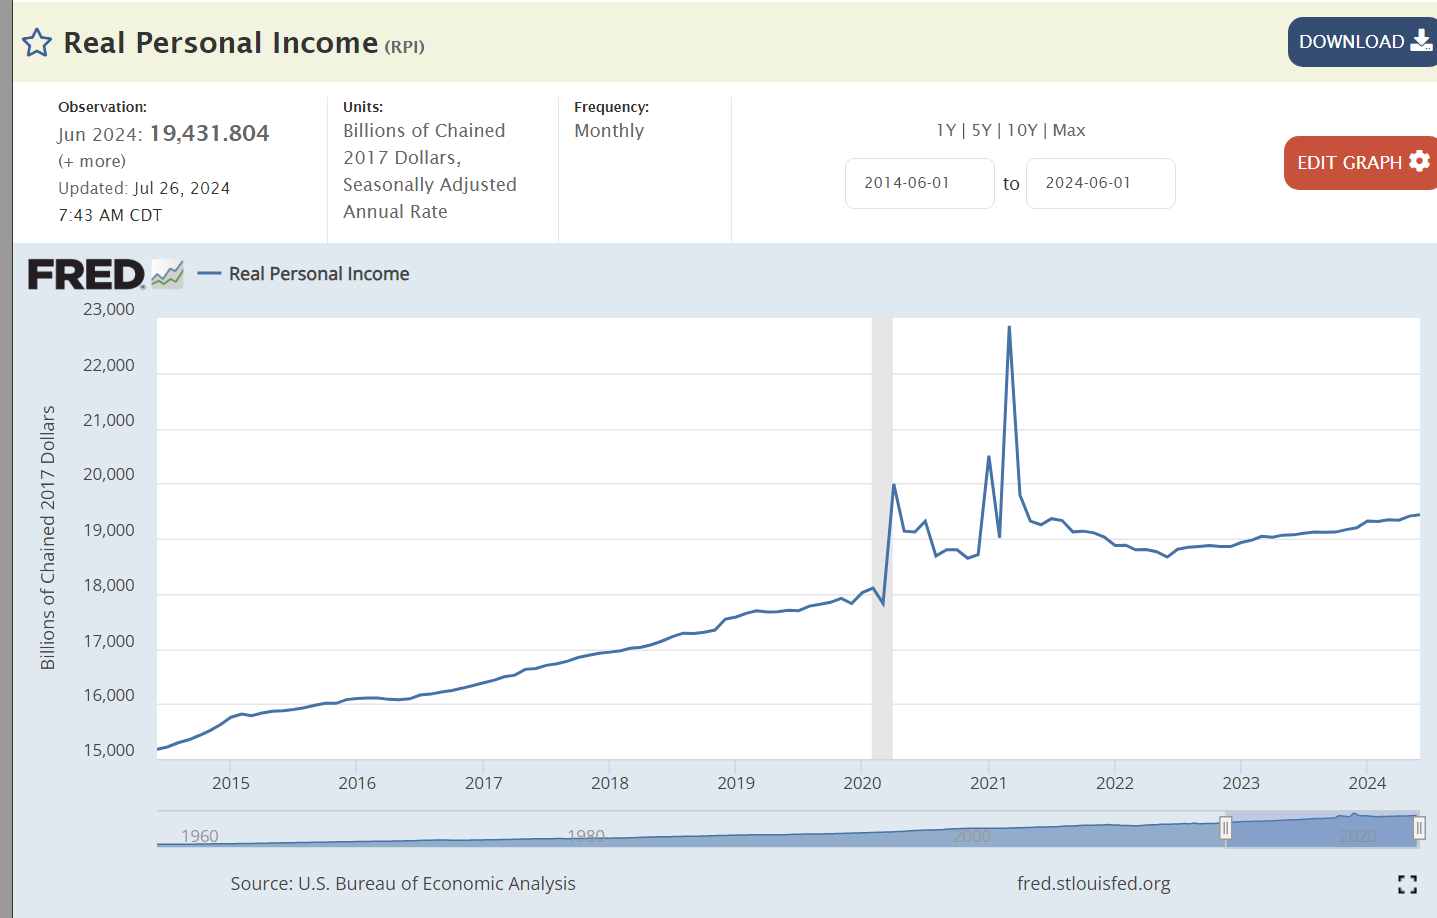
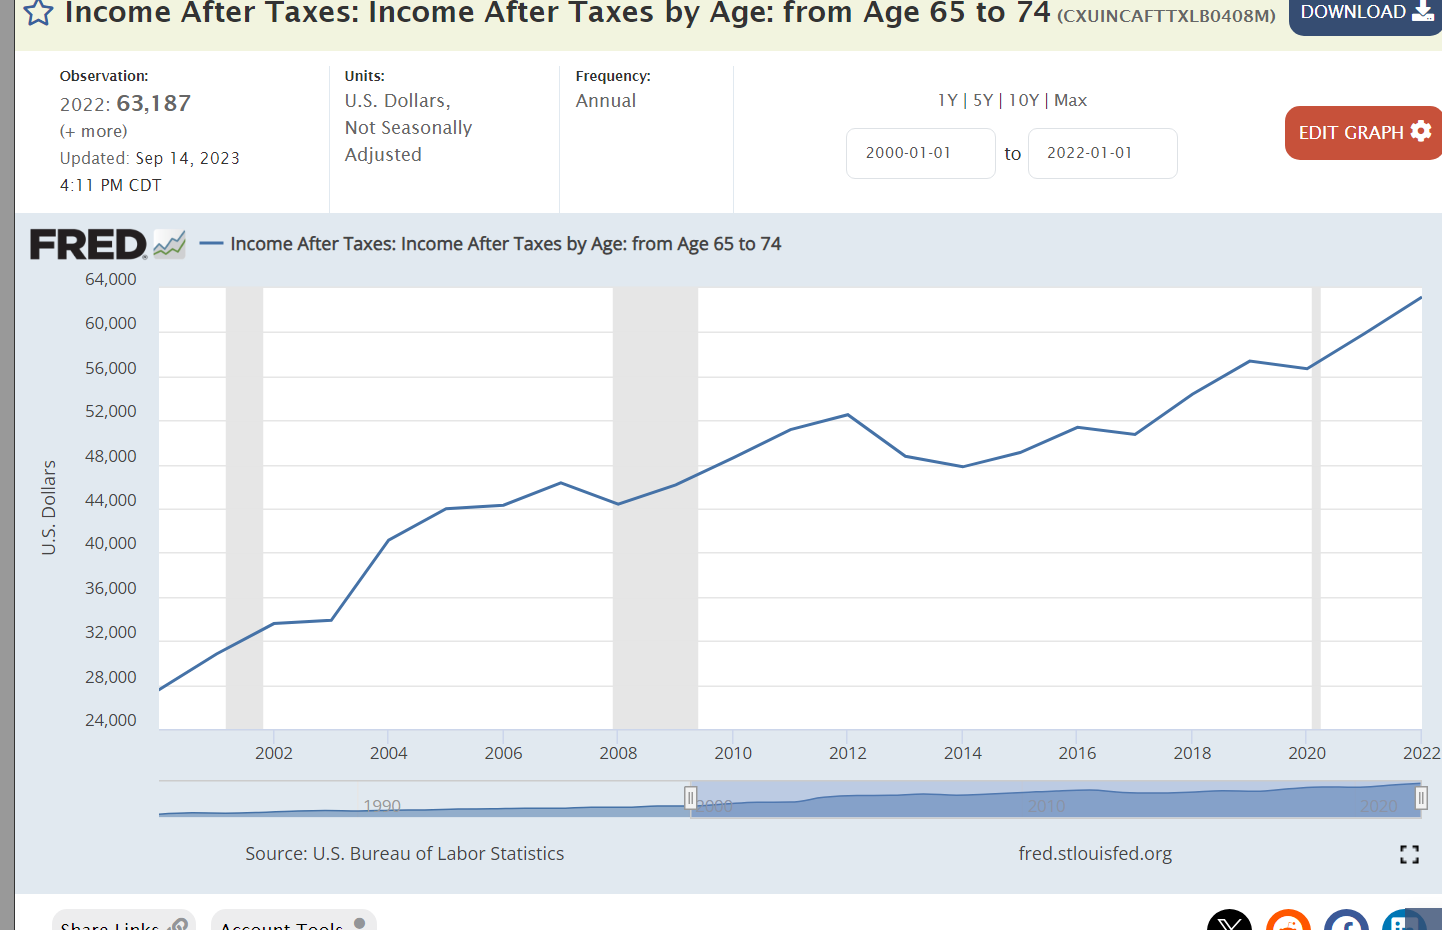
Real personal income grew a little bit faster during Trump’s time and more smoothly. Personal incomes jumped up during the pandemic but have been flat since that time with corporations capturing a greater share of the economy’s returns.

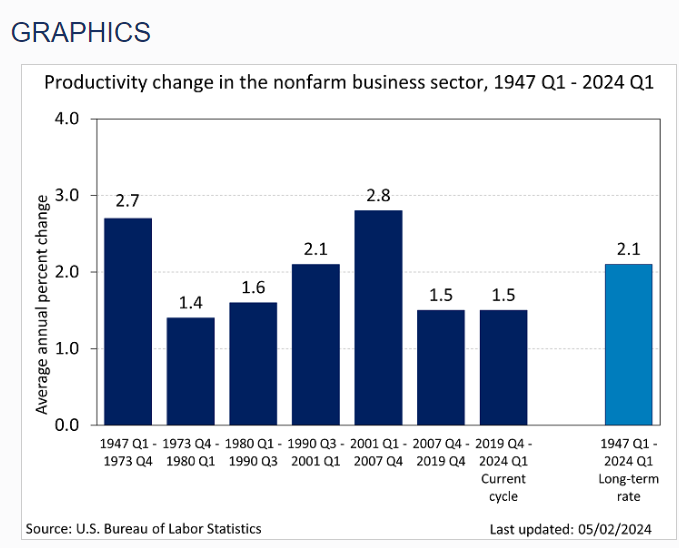
Workers have been 8-10% more productive in the Biden economy.

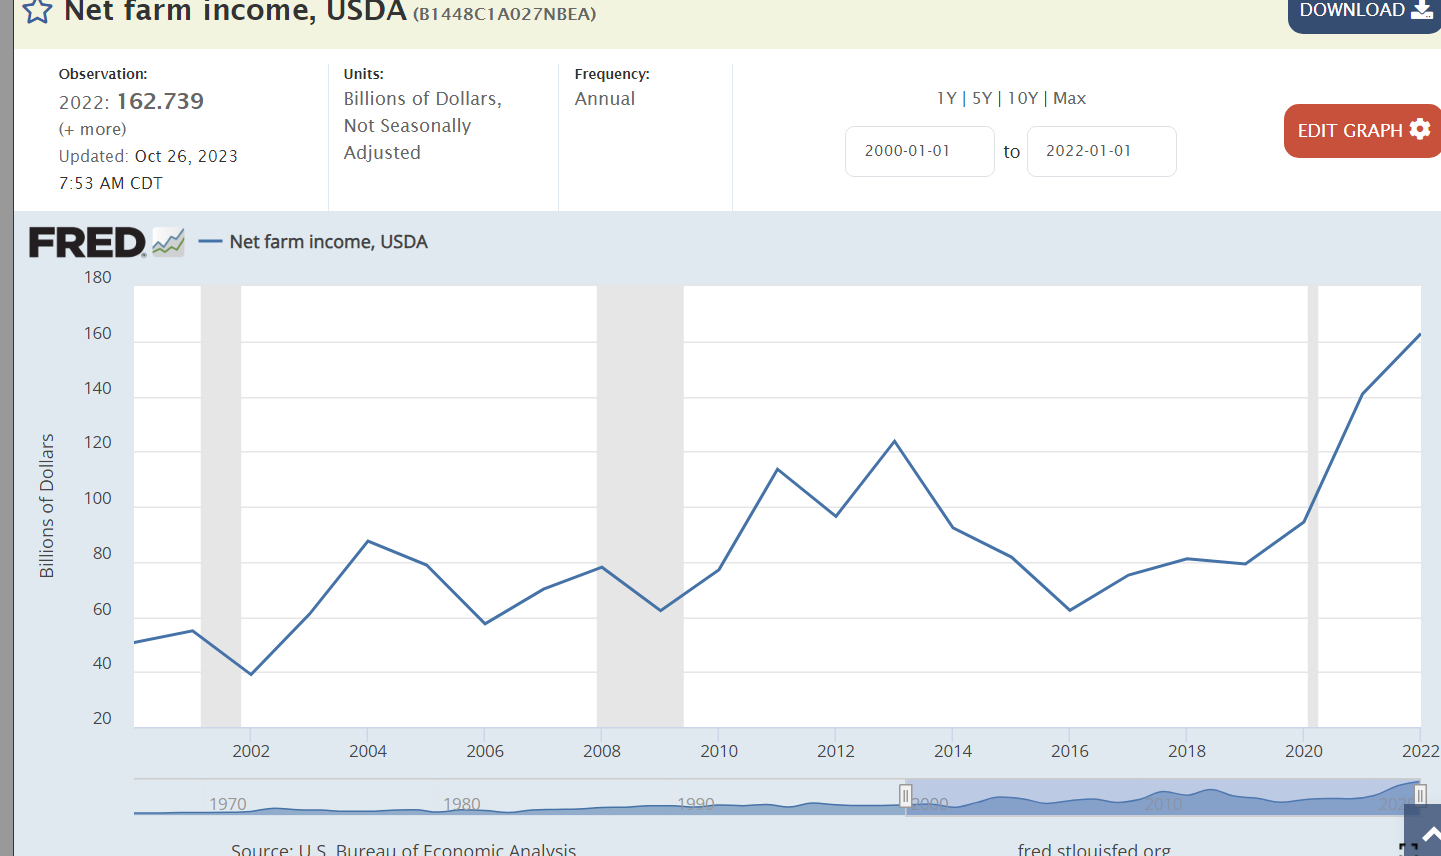
Farm income has doubled in the Biden economy.

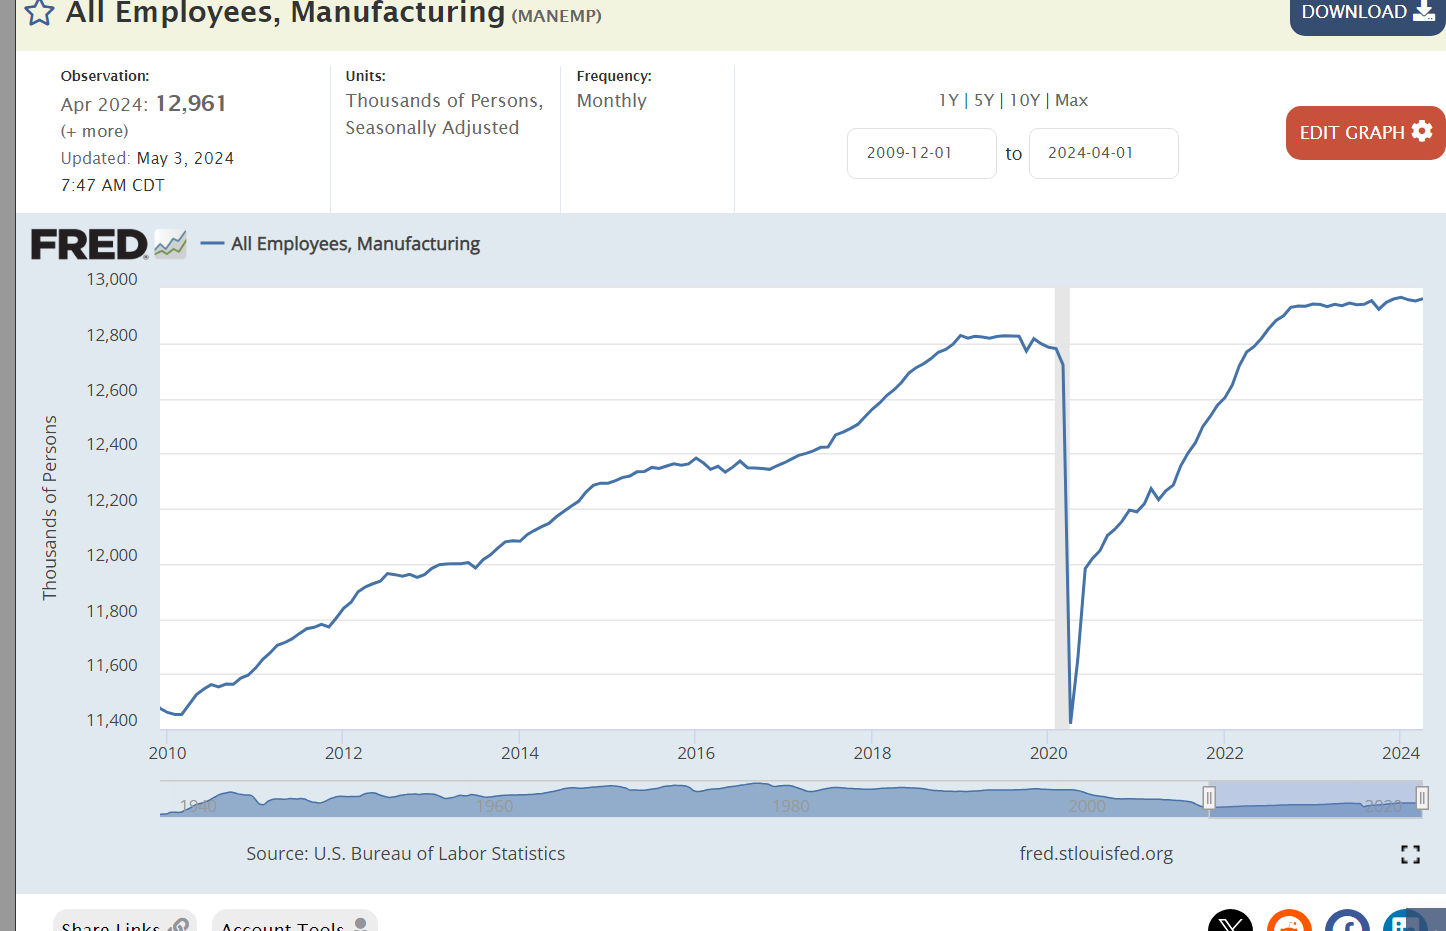
Manufacturing employment grew by a surprising 3% in Trump’s term. It is slightly higher in the Biden era.

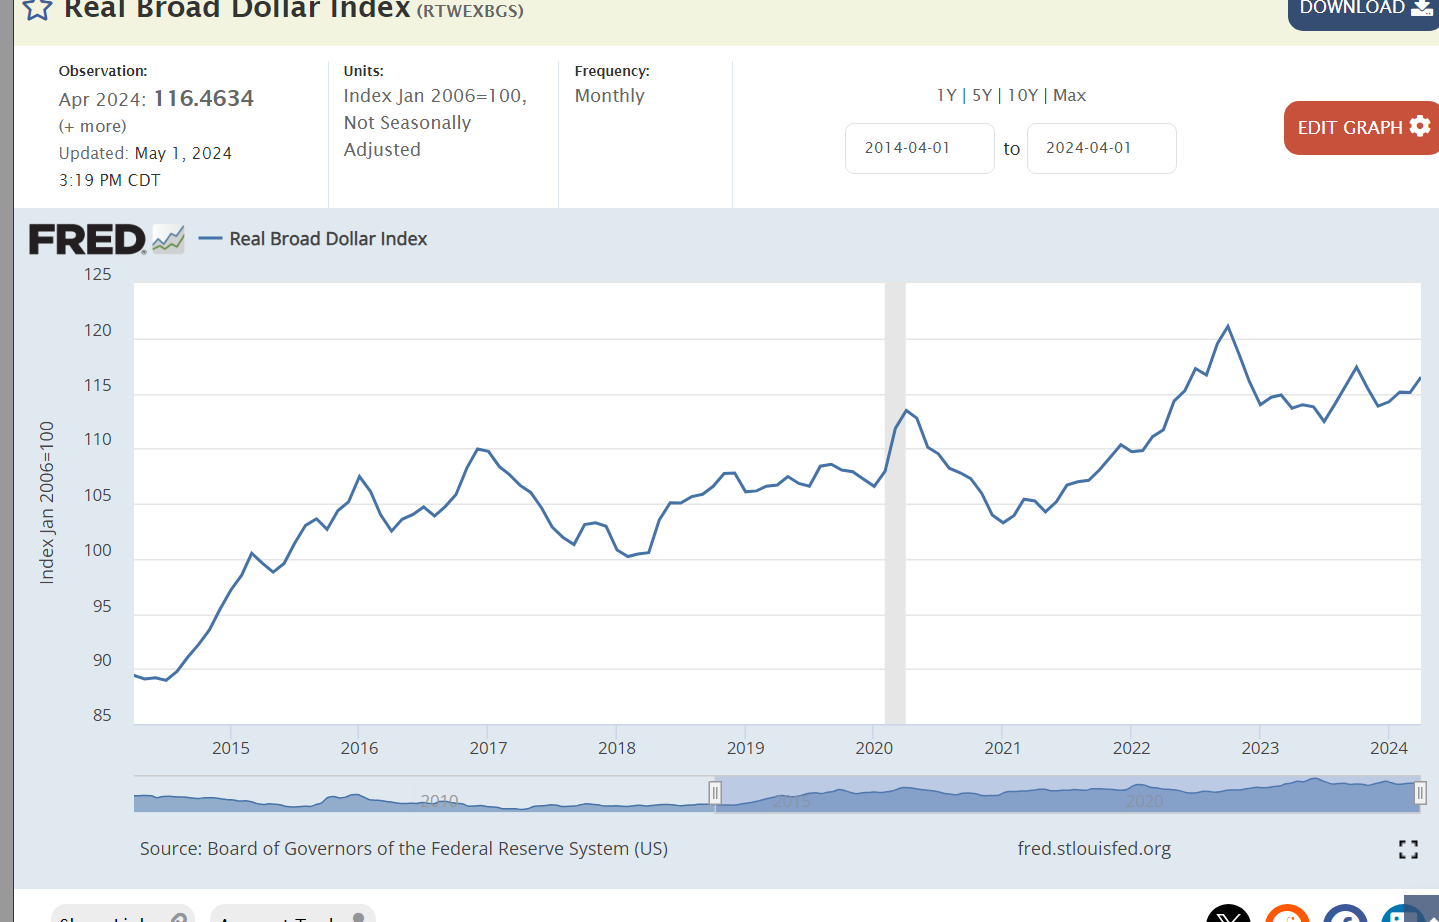
Real dollar exports increased during the Trump presidency and then again during Biden’s time despite a greatly stronger US dollar which hampers exports.
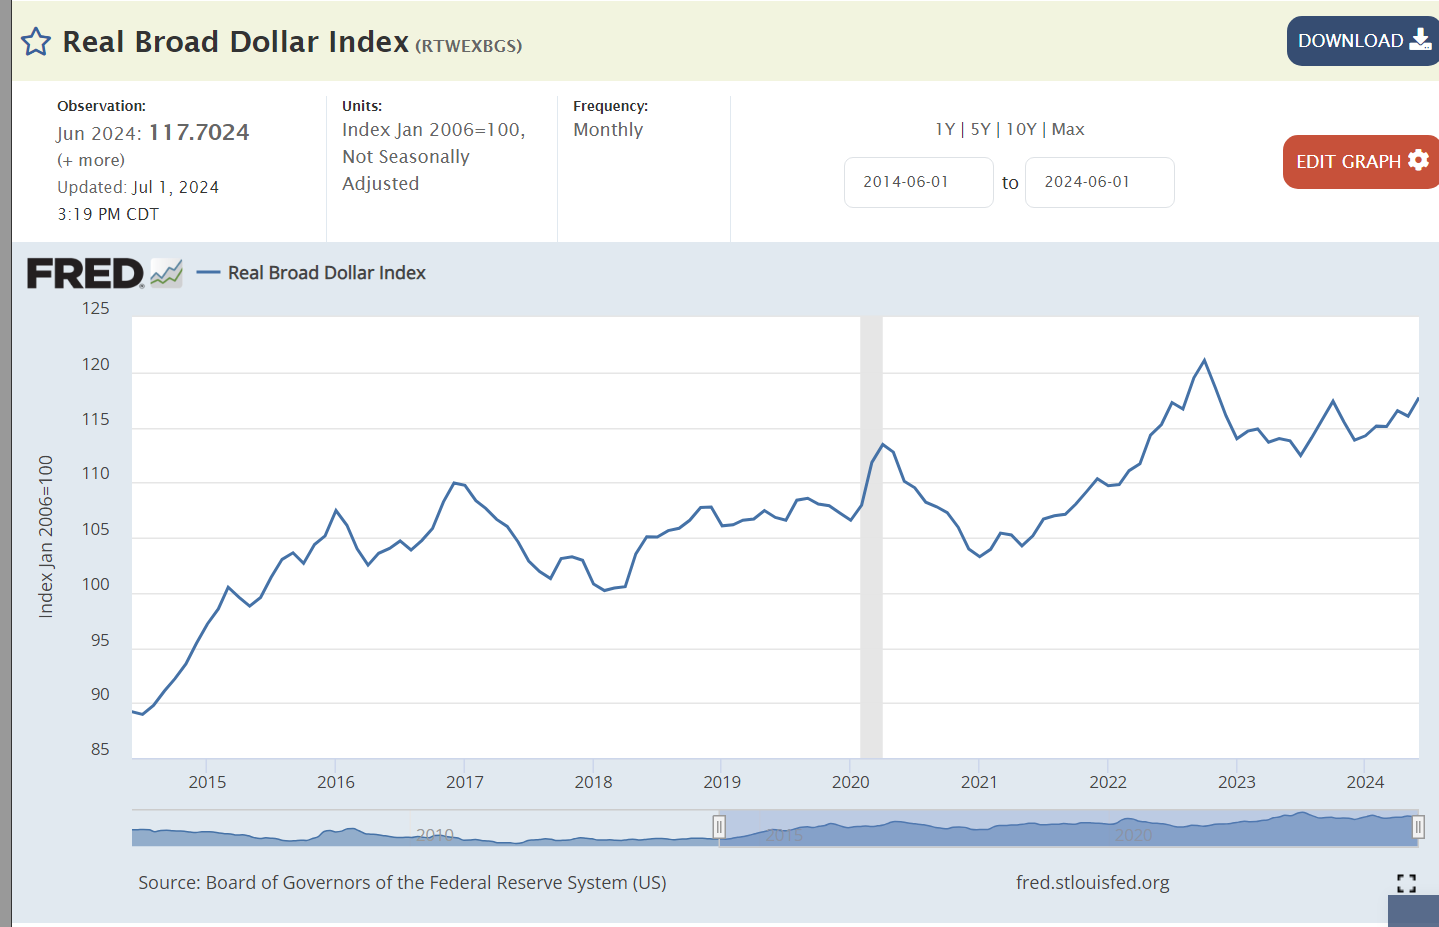
The world is willing to pay 10% more to hold US dollars in the Biden period, reflecting strong economic realities and prospects despite the risks of higher US inflation and budget deficits.
Summary
The US economy is very strong. Trump was able to extend the Obama recovery for longer than most expected, keeping inflation, interest rates and unemployment at low levels. Biden managed the recovery from the pandemic induced recession better than expected. The economy, asset prices and labor market have recovered very nicely. Inflation has remained the weak part of the Biden economy. It is lower than in comparable global economies and trending towards the 2% target in 2025. Critics point to excess government spending as an avoidable source of high inflation.
The Trump economy built upon the success of his predecessor. The Biden economy overcame the disruption of the pandemic to produce equal or greater results. Both presidents delivered solid results.