Good News: Healthy State & Local Government Finances

https://www.oecd-ilibrary.org/sites/c6217390-en/index.html?itemId=/content/component/c6217390-en

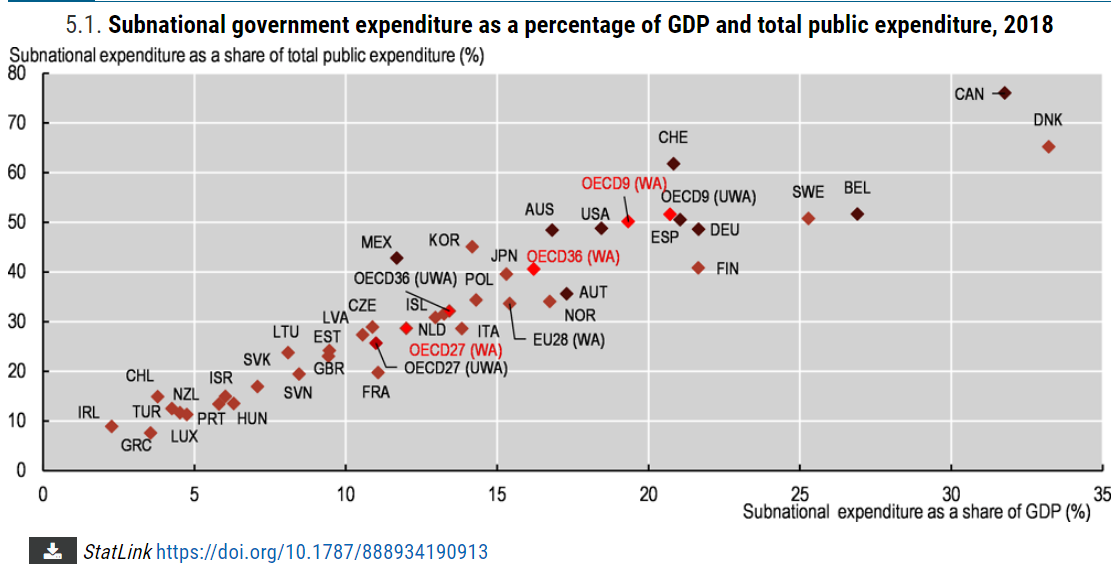
One-half of US government spending is managed at the state and local level. Only 3 OECD (developed economy) countries have a higher share at the local level. The median level is one-third of the total and some countries limit local spending to just 10-20% of the total. The US federal government model ensures that a significant share of government is managed closer to “the people”, which is even more important today with 330 million people than it was 200 years ago.

State and local expenditures as a percentage of GDP is 19% for the US, on the high side compared with other OECD nations as expected based on the 50/50 local/national split.

Government employment is even more concentrated at the more responsive state and local government level. State and local government employees comprise three-fourths of total government employment. This total increased from 21 to 23 million across 20 years while total US employment grew from 132 to 152 million. The share of government to total employment eased down from 16% to 15%. Note that this is much lower than the 38% government share of GDP.

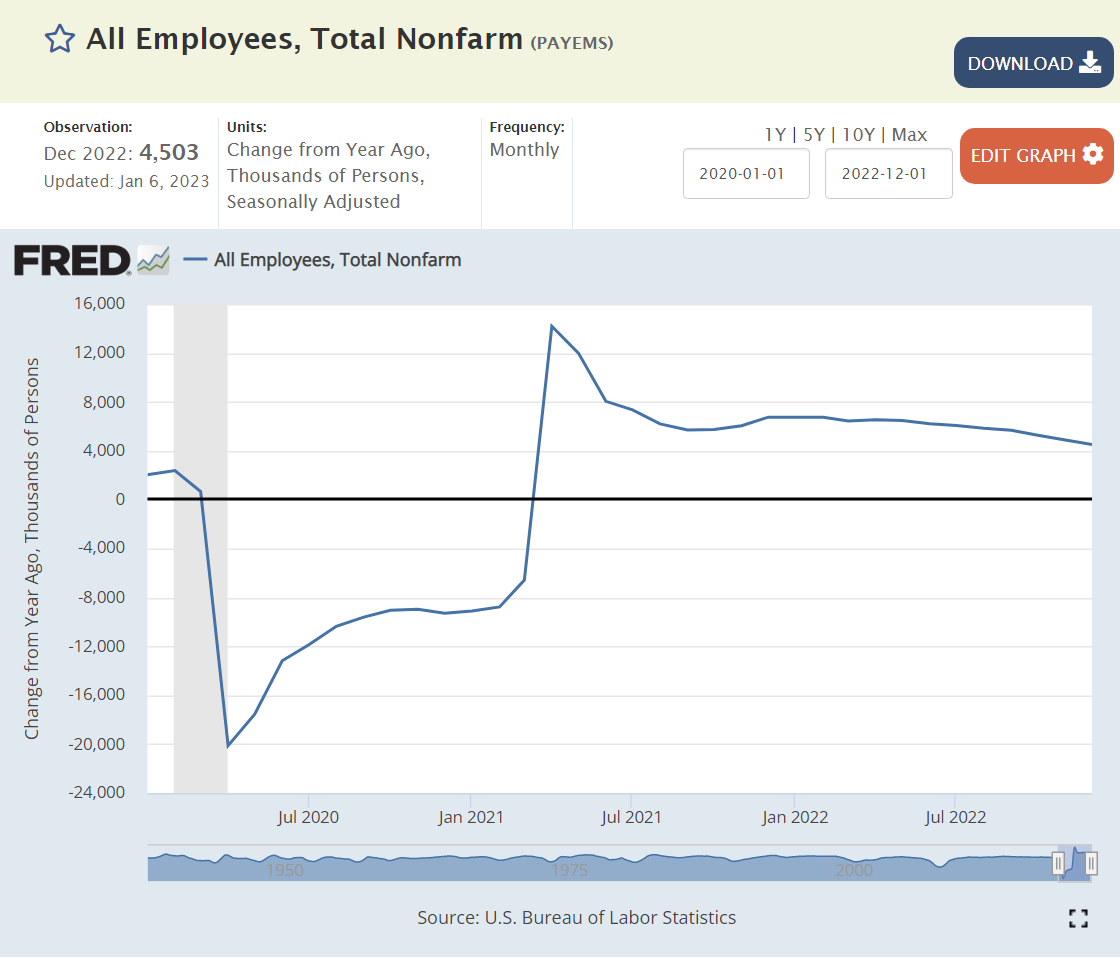
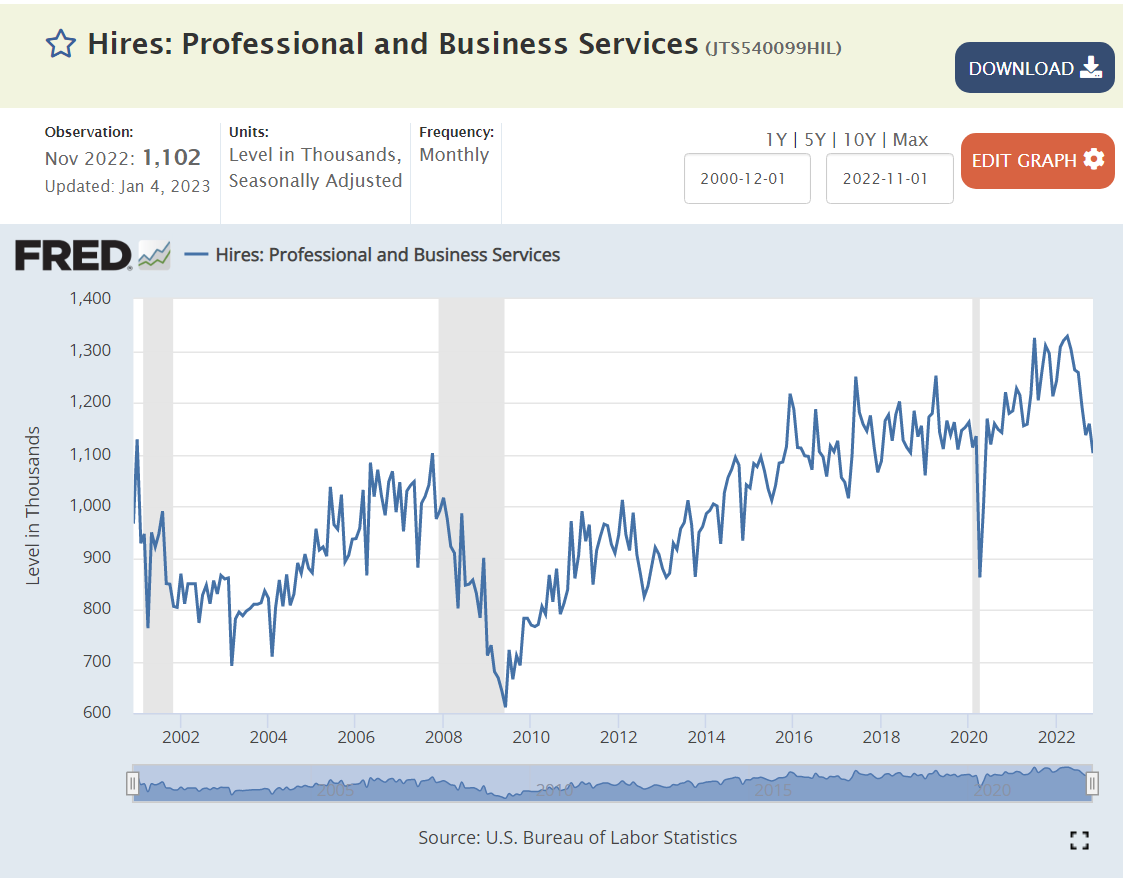
https://fred.stlouisfed.org/series/PAYEMS#0

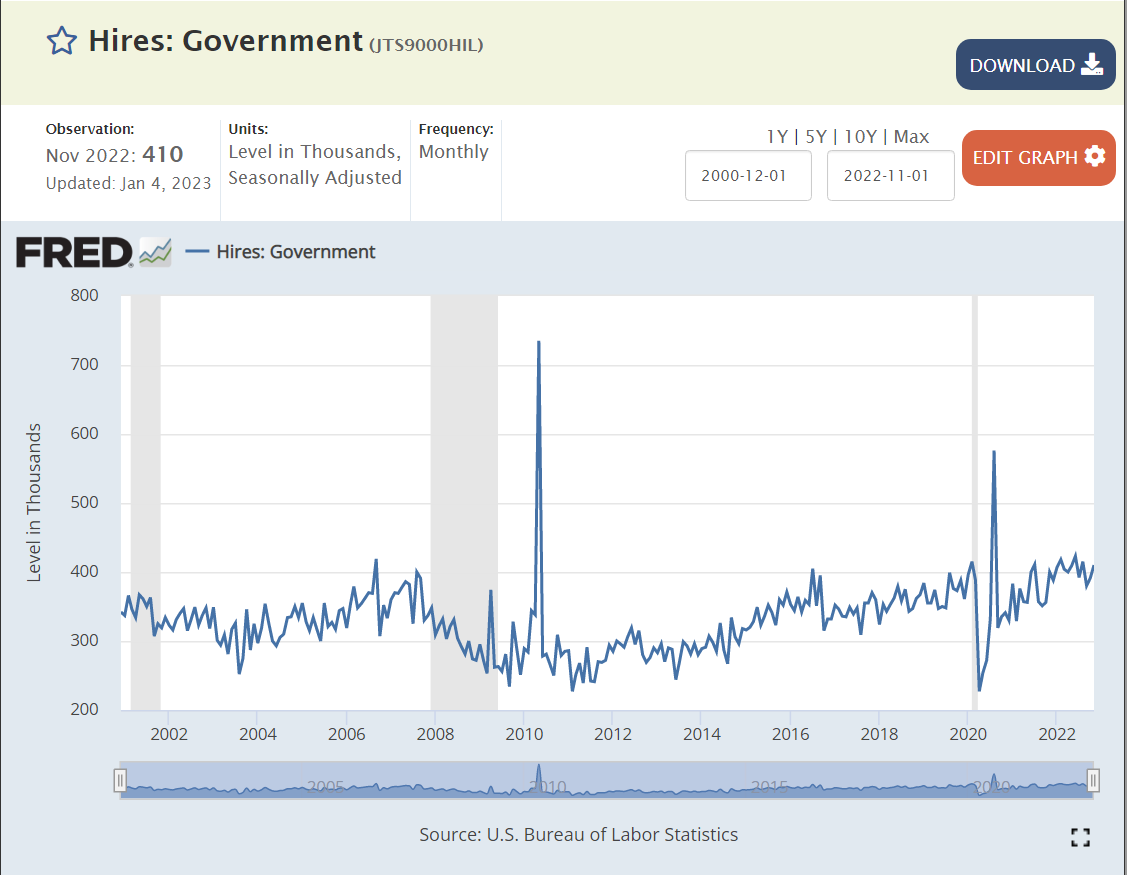
Federal government employment has been essentially flat for many decades.

https://www.cbpp.org/research/state-budget-and-tax/its-time-for-states-to-invest-in-infrastructure

Setting aside land and defense assets, states and local governments hold a supermajority of government assets.

https://en.wikipedia.org/wiki/Government_spending_in_the_United_States#/media/File:Federal_state_local_percent_of_gdp.webp

The share of total government spending to GDP is the most important ratio to track. Since the 1960’s the federal government has moved spending responsibilities to the state for many programs. Spending drifted up to 25% of a growing post-war GDP by 1966. The Vietnam War and the Great Society programs pushed this up to 29% in 1975. The oil crisis, Japanese competition, inflation and recession pushed it up to 32% in 1976. Spending was still 33% of GDP 30 years later in 2007. The Great Recession drove spending up to 40% of GDP and then it declined back to 34% in 2014. State and local government spending has been relatively constant since 1976.

https://www.usgovernmentspending.com/local_spending_chart

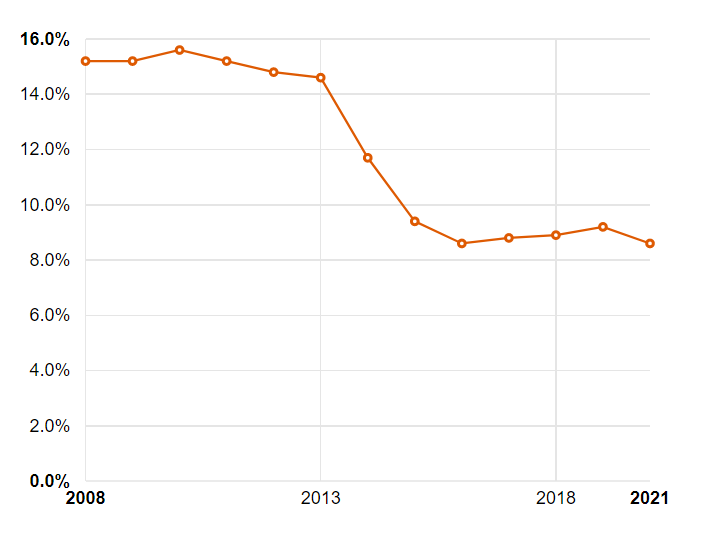
Local government spending reached its modern level at 9-10% of GDP by 1990 and has mostly remained at that level.

https://www.urban.org/policy-centers/cross-center-initiatives/state-and-local-finance-initiative/state-and-local-backgrounders/state-and-local-expenditures

federalism.us

https://www.pgpf.org/budget-basics/how-is-k-12-education-funded

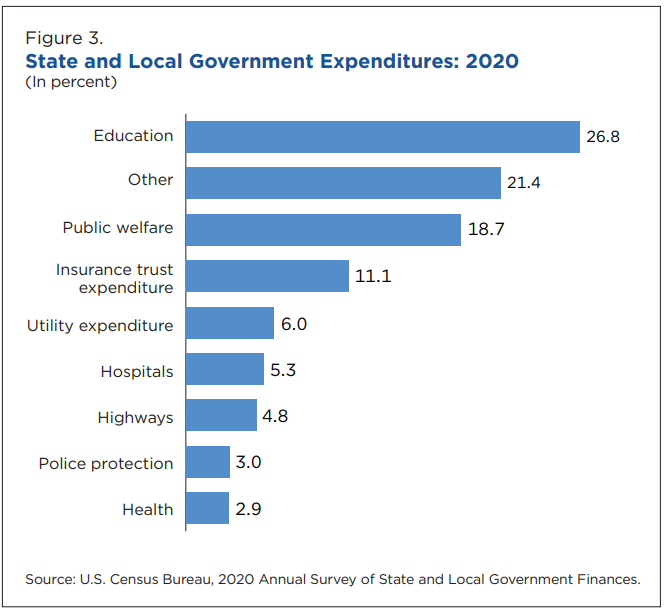
State and local governments provide a wide variety of services.

https://fred.stlouisfed.org/series/L319411A027NBEA

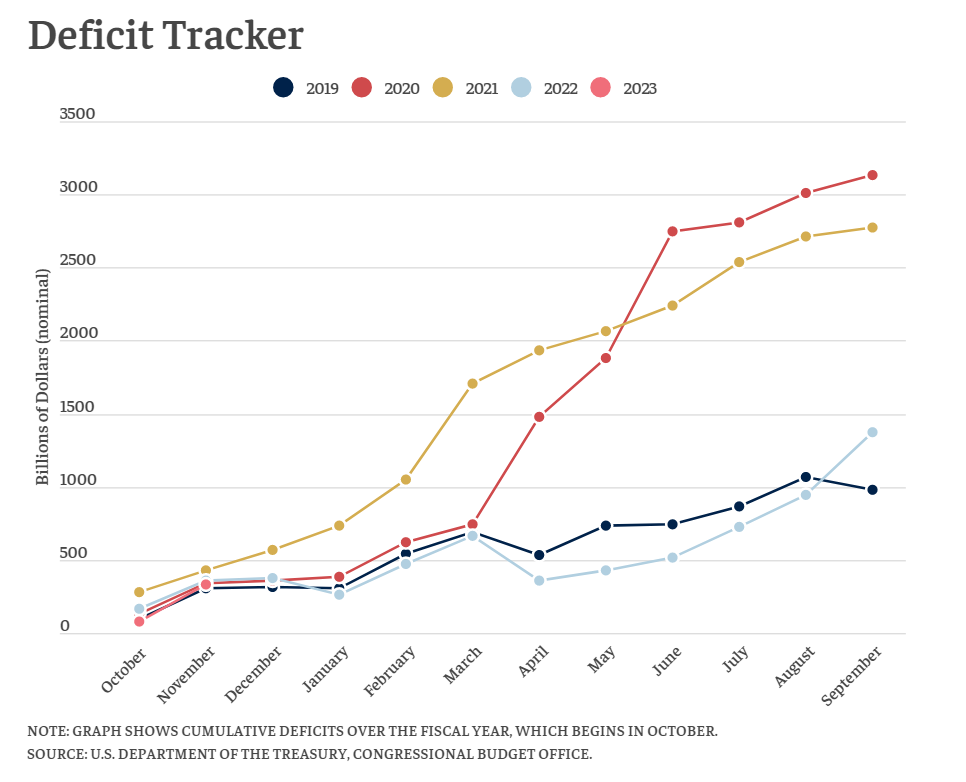
States and local governments routinely deliver solid budget surpluses in normal years and greatly exceeding the deficits encountered in recessionary years. State and local governments rely more on property and sales taxes which do not vary as much as income taxes. States have proactively reduced spending budgets whenever they have encountered recessions.

https://www.pewtrusts.org/en/research-and-analysis/articles/2022/05/10/budget-surpluses-push-states-financial-reserves-to-all-time-highs

States have built up a nearly 3 month cushion of reserves to buffer recessionary periods. States and local governments did much better during the pandemic recession than anyone expected. They reacted quickly to ensure fiscal stability and found ways to put the federal government transfers to good use. Some states have provided rebates to their taxpayers.

https://www.pewtrusts.org/en/research-and-analysis/articles/2021/10/15/states-financial-reserves-estimated-to-surpass-pre-pandemic-levels

https://fred.stlouisfed.org/series/SLGTFFQ027S

https://fred.stlouisfed.org/series/SLGTANA027N

State and local governments have continued to accumulate valuable assets, especially in the last 10 years.

States have generally improved their credit ratings since 2006, before the Great Recession. At that time, 9 states had the very highest AAA rating. 39 held very strong AA ratings. Just 2, Louisiana and California held “upper medium” A ratings. Recent data shows 7 more states, for a total of 16, at AAA ratings. 29 have strong AA ratings. 3 are at single A: Pennsylvania, Connecticut and Kentucky. 2 have fallen a step lower to BBB: Illinois and New Jersey. The median rating has improved from AA to AA+.

https://en.wikipedia.org/wiki/List_of_U.S._states_by_credit_rating

States have improved their pension fund percentage funding ratios, although some states remain at some risk of defaulting on their obligations.

https://www.urban.org/policy-centers/cross-center-initiatives/state-and-local-finance-initiative/state-and-local-backgrounders/state-and-local-expenditures

federalism.us

https://www.taxpolicycenter.org/statistics/state-and-local-general-expenditures-capita

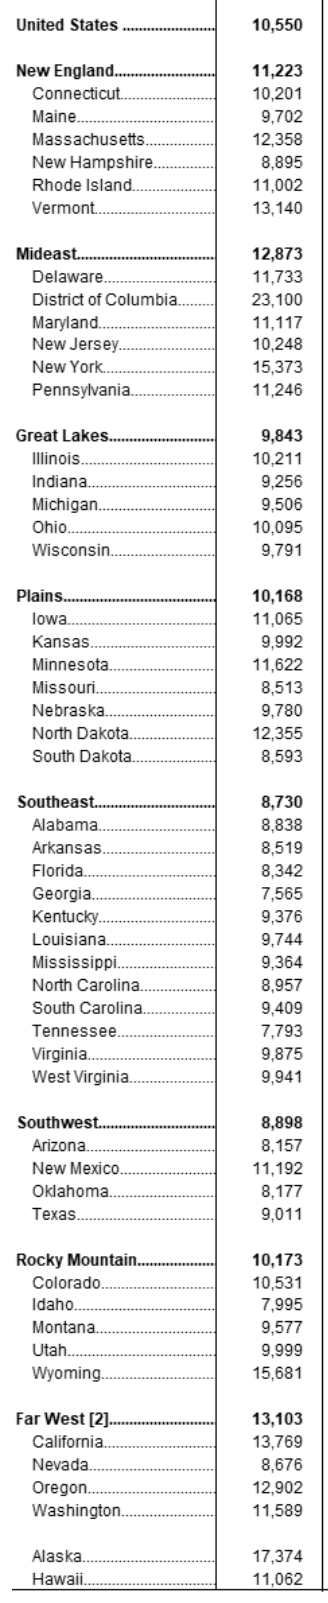
State and local government spending per capita varies widely, reflecting local preferences. The mideast and far west are 15% above the national average while the southeast and southwest are 10% below the national average.

State spending varies even more widely. The national average is $6,900 per capita. California is 12th highest at $9,000 but neighbor Washington is much lower at $7,000 (26th). Massachusetts is also at $9,000 but its neighbor New Hampshire is at a very low $5,000 (46th). New York is lower than might be expected at $8,600 (15th). Nearby New Jersey, Pennsylvania and Virginia spend $7,200-7,500, a bit above the national average. Michigan, Ohio and Illinois spend less than the national average at $6,100-6,300, but nearby Indiana ($5,500), Kentucky ($8,500) and West Virginia ($10,300) have much different priorities. Georgia ($5,700), Alabama ($6,300) and Mississippi ($6,700) spend less than the national average. Texas spends only $4,700 per capita (48th) while its neighbor Arkansas spends $9,200 (10th). Florida is the lowest spending state at just $4,000 per person, an amazing 42% less than the national average.

Another way to look at these differences is to compare the spending of 5 states. Rhode Island $10,400 (6th), Kentucky $8,500 (16th), Washington $7,000 (26th), Colorado $6,200 (36th) and New Hampshire $5,000 (46th). Rhode Island spends twice as much on state government than New Hampshire, a few miles away. This is the range in the US, reflecting vastly different local priorities.

Summary

In our federal system, state and local governments are called upon to manage one-half of total government spending. They routinely deliver budget surpluses and adapt during recessions, even the pandemic driven recession. They have accumulated significant real and financial assets to buffer difficult times. They have managed pension liabilities appropriately and improved their bond ratings and ability to borrow. They have taxed and spent to match local preferences. In aggregate, their spending has remained at the same percentage of GDP for many years.

Good News: Firms and Jobs

Many people complain that the US economy does not create enough new jobs or soon won’t create enough jobs or won’t create enough good jobs or … People worry about employment. Writers and politicians cater to that worry. Fortunately for us, the US economy creates jobs year after year after year, only briefly interrupted by increasingly less frequent and brief periods of economic recession. I’ll share the core numbers on healthy firms and new jobs and provide some context and history which indicates that this is inherent in the modern US economy. The economy is not relying upon any major political change or special insight to continue adding jobs. It just happens.

For 9 straight years, from 2011-2020, across 3 presidential terms and 5 congresses, the US economy added 2 million new jobs each year. In the 1980’s, it added 2-4M per year. In the 1990’s it added 3M per year. In the “oughts”, it added 2M per year. 30 years of expansion, 7 lesser years that averaged more than zero. 4 strong years for every 1 weak year..

The recovery since the pandemic has been even stronger, starting at 8M new jobs per year in 2021 before sliding to 6M per year and most recently 4.5M per year.

My post earlier this week focused on the role of start-ups in driving job growth. I’d like to build upon that post.

The total number of firms in the US grew slowly in the last 40 years, from 3.5 million to 5 million. The growth rate was much faster prior to the Great Recession (2007-9). Much of this growth was accounted for by single employee firms. Despite this tame 1% growth per year, the economy was able to add more than 2 million jobs per year.

The number of establishments (locations) grew almost twice as fast, just under 2% per year.

The US economy requires some growth in the number of firms or establishments each year to drive job growth. Fortunately, it does not require heroic growth rates.

The number of new establishments added per year is remarkably consistent, averaging about 700,000 per year on a base of 5-7M. Of course, this means that the RATE of new establishments is shrinking, from 14% to less than 10%.

Establishment exits have increased from 500K to 600K to 700K before returning back to 600K per year. Big picture, 700K new establishments and 600K lost establishments each year across 4 decades.

Firm deaths have also been consistent at 450,000 per year.

Data calculated from BDS data. Direct graph not available.

Firm births have also averaged about 450,000 per year but present a different pattern. Firm births were much lower in the troubled time around 1980. Births ranged from 450-500,000 per year in the next 25 years. The Great Depression destroyed businesses, access to capital, personal net worth and aggregate demand. Hence, new firm creation dropped back to the 400,000 level. It recovered back to the 450,000 per year rate by 2015. As with firm deaths, the rate has fallen from 14%+ to less than 10%. Most importantly, the birth and death rates have been relatively consistent and have both been relatively flat, leading to a slow increase in the number of US firms.

https://www.bls.gov/spotlight/2022/business-employment-dynamics-by-age-and-size/home.htm

The BDS database shows that job gains and job losses generally move together, but that in a recession job gains fall and job losses increase. This is a very important result. Without active government or policy intervention, the economy creates 12-14M jobs each year and destroys 11-13M jobs each year. There is no guarantee that net jobs will be created in any given year, but overall that is the normal result.

https://bipartisanpolicy.org/blog/trends-in-new-business-creation/

Writers who wish to emphasize the decline of entrepreneurship focus on firms instead of establishments because of the slower growth rate. They emphasize the growth rate rather than the growth numbers because this is less positive. They don’t compare the growth and death rates or numbers, which move together. They focus on the aftermath of the Great Recession which did greatly slow firm creation, resulting in slower than historical numbers and rates of job creation from new firms. Nevertheless, the economy created 2M new jobs per year for 9 years. During that period, existing firms captured a larger than usual share of the job growth required to provide demanded goods and services.

New establishments have driven 5-6M new jobs each year. The late nineties to early “oughts” reported the higher 6M per year figure.

Existing (continuing) establishments have added 10-12M gross new jobs each year.

Establishment deaths (including firm deaths) resulted in 4-5M jobs lost each year.

Continuing establishments trimmed 8-9M jobs each year, and many more during recessionary times. Although there are many moving parts, continuing firms eliminate more jobs than they create, especially during recessionary periods when they are adapting to lower demand. Firms die and they close locations, removing 4M jobs each year. New firms and new establishments add the new jobs required to fill the 2M net new jobs each year. This does not happen automatically or precisely, but overall, through time, the pattern is clear.

The US job market has grown from 90-150M positions during the last 40 years.

Firms hire 75M people each year. The typical job tenure is just 2 years.

Separations and hires generally move together. The net 2M jobs added annually is a small fraction of employment, hires, separations, gross job adds and gross job losses.

Establishment births exceed establishment deaths except during deep recessions.

New firms have high failure rates. Fortunately, firms that survive their first year have high percentage rates of new hires. They start with a small number of employees (4) and grow rapidly. The survival rate improves with the age of the firm and the employment growth rate of surviving firms tends to decline as they grow. The combined effect is that 80% of the new employees added by startup firms remain after 10 years. This employment survival rate has been improving in the last 15 years, partially offsetting the reduced number of start-up businesses.

https://www.bls.gov/spotlight/2022/business-employment-dynamics-by-age-and-size/home.htm

The first-year survival rate has remained roughly the same at 80% for 25 years.

The percent of non-business owning adults who start a business each month has shown a small upward trend before jumping up in 2020 and 2021.

The ratio of new employer businesses to population dropped significantly after the Great Recession, but has recovered in the last 4 years.

The share of “new employer businesses” dropped after the Great Recession and has not fully recovered.

The number of application for new business tax ids increased significantly after the Great Recession and jumped by 50% after the pandemic.

The Census Bureau also tracks a subset of the total new business applications based upon industry classification that is a better predictor of actual businesses eventually started. This measure shows modest growth after the Great Recession and a 30% spike after the pandemic.

About 10% of new business applications become new businesses. Hence, the rate of new business formation to be reported for 2022 is expected to be very high.

https://www.silive.com/business/2022/08/new-business-applications-are-on-the-rise-heres-what-led-to-a-record-setting-year.html

https://www.nber.org/digest/202109/business-formation-surged-during-pandemic-and-remains-strong

https://www.oberlo.com/statistics/how-many-new-businesses-start-each-year

https://bipartisanpolicy.org/blog/trends-in-new-business-creation/

https://bipartisanpolicy.org/blog/trends-in-new-business-creation/

About 80% of new businesses are formed based on opportunity and 20% based on necessity. Kauffman estimates that 2020 business formation was 30% based on necessity.

Summary

The US economy continues to generate 2 million new jobs in each non-recession year, even more in boom periods like the last 2 years. Firms and establishments are born, grow and die. The net employment growth rate for established firms is less than zero in their first 5-10 years and then slightly positive. The annual death rate of existing firms and establishments is relatively low, but on a 150M employee base it is 4M per year. The new jobs added by startup firms and new establishments allow the total number of employees to grow in normal years.

There is no “iron law of employment” that requires new firms or establishments to be created in numbers greater than the job losses. There is no law that requires surviving young firms to nearly offset job losses by young firms that die at a high rate. There is no law that requires mature firms (10 years old+) to add new employees or to die at slow rates. But these results have been consistent or improving for the last 40 years. I look forward to continued success.

Good News: US Startups Still Create Many Jobs (!!!)

I’ve always been a sceptic about the many claims that entrepreneurs, startup firms and venture capital are the “most” important drivers of improved quality of life in the US in my lifetime. I remain a sceptic. I believe that large firms deliver even more added value (driven by self-interest). I believe that the government and not-for-profit sectors play an equally important role. I believe that the government’s definition of the “rules of the game” and our culture’s influence on how people live their everyday lives are also very important. I’ll come back to the role of small firms in a separate blog post. I’ll try to tie together all of the strands of our amazing US labor market in another blog post.

But today, I want to tip my hat to the truly amazing role that startup firms play in driving the US economy and labor market.

https://www.bls.gov/bdm/us_age_naics_00_table1.txt

The US Bureau of Labor Statistics (BLS) tracks new jobs added (gains) and jobs lost (losses) each year in detail by firm and establishment (branch), including links to the year the firm was first created. At the total country level, we see that job creation and destruction follows the business cycle. The Great Recession, subsequent expansion and pandemic periods are obvious above. In the Clinton years, job gains averaged a great 15 million per year. The Bush, Jr. years showed still solid 13-14 million annual new jobs added. The Obama recovery increased new jobs from 10 to 13 million per year and Trump maintained this positive level at the end of a very long period of economic growth.

Job losses generally followed the pattern of job growth. Job losses are even more volatile. They peaked in the recessions of 2002, 2009 and 2021.

In the last 3 decades, the US economy added 2 million new jobs each year during periods of expansion.

Many economists, journalists and politicians claim that startups account for ALL new job growth. This is an “amazing” claim that deserves deeper analysis, investigation and description. I’ll chase this separately. The claim is “largely true”.

Startup firms delivered 4-5 million new jobs each year in the 1990’s. This declined to 2.5 million jobs during the “oughts”. It increased back to 3 million new jobs per year in the teens. In non-recessionary periods during the nineties and “oughts”, existing firms destroyed 2 million jobs each year. In the teens, the job destruction rates were much lower, roughly 1 million jobs per year. The startup jobs minus existing firm jobs number was typically 2 million net new jobs per year in positive economic years.

The BLS separates job gains from job losses and categorizes them by the firm’s first year of existence. Job gains at existing firms were roughly flat at 10 million per year. Startup firm new jobs declined from 4.5M in the nineties to 2.5 M in the “oughts”, recovering to 3M per year afterwards. Startup job creation declined from 45% to 31% of existing firm job creation, a one-third reduction.

The BLS provides data on the subtotal of all firms founded before 1993. These “mature” firms display a similar pattern. Annual job gains fell a bit from 4.5M in the “oughts” to 3M in the teens. Annual job losses fell even faster, from 6M in the “oughts” to 3.5M in the teens. Net job losses averaged 1.5M annually in the “oughts”, but just 0.5M in the teens.

The number of new jobs created by startups declined by one-third during this period, from 4.5 to 3 million per year.

The BLS data allows us to track the gains, losses and net jobs added by first year of existence for firms. First year startup jobs declined from 4.5M to 2.5M. The cumulative jobs created measured 10 years after startup is more positive. Cumulative new jobs, measured 10 years after startup, increased from 3M to 3.5M then dropped back to 3M in 2001. The startup classes of 2009-12, despite the Great Recession, report 2.5M net jobs added each year, as measured after 10 years.

Job losses have fallen much faster than job gains in the last 20 years, measured by a full decade of performance. The ratio of job gains to job losses has improved markedly. This ratio averaged 83% in the nineties, indicating that 1/6 new jobs was destroyed within a decade. This ratio has greatly recovered to the mid-90’s. indicating that new startups, in total, essentially maintain their initial jobs count a decade later. Other data shows that one-third of startups don’t exist after 10 years. Hence, this means that the successful remaining one-third have roughly tripled their employment in their first decade.

Firms die much faster than employment. There are many studies that claim that one-half, three-quarters, fourth-fifths or nine-tenths of employees at startup firms are eliminated in 10-20-30 years. These are mostly exaggerations.

Ten years after their founding, startups still employ 80-90-95% of their initial year hires. Job losses fell during the teens. Job gains grew rapidly after the Great Recession.

For the 18-year period where we have ten years of data on startup firms, we have a clear pattern of net employment decline at the end of the decade, on average. The ten-year retained employment level at almost 80% of the initial level is far higher than the 50% claimed by some commentators.

The years since 2009 show a clear pattern of startups maintaining 90-95% of their initial employment levels after 10 years.

Summary

The US economy typically added 2M net new jobs each year during periods of economic expansion. Historically, startups added 4M jobs annually to offset the 2M jobs eliminated by existing firms. The job destruction rate of existing firms has slowed. The jobs retention rate of startups has improved. Net, net, the US economy still generates 3M+ new jobs each year which essentially still remain a decade later. One-third of the firms are gone, but the winners employ 3 times as many as when they started.

Good News: The US Economy is Still Firing on All 12 Cylinders

Allison V-1710-7 (V-1710-C4) V-12 engine (A19600125000) engine. One-half left front view.

New hires remain above 6 million at the end of 2022! The high in 2002-7 was 5.5 million. The economy barely reached 6 million during the historic 10-year expansion from 2009-2020. New hires in 2021 were above trend, but 2022 remains on the positive track. We’ve been in a “negative” economic climate for 18 months, but the economy has just slowed a bit.

The “distribution” business is doing very well. People are embracing the Amazon model of home delivery. This requires more staff here and less in retail and wholesale trade. 1.1M new hires prior to the Great Recession. Drop to 0.8M afterwards, recovering back to 1.1M for 2015-19. Growing to 1.3M after the pandemic!

The “leisure” industry continues to grow as a share of the US economy, from 900K new hires to 1.2M new hires. There is some slowdown in the second half of 2022.

The broadly defined business and professional services industry continues to grow as a share of the US economy, from 800K new hires in 2004 to 900K by 2011 and 1.1M in 2016. This industry continues to grow, although it has clearly backtracked a bit at the end of 2022.

The retail trade sector has generally been weak for the last 2 decades, with new hires plummeting from 800K to 550K after the Great Recession before recovering to 750K from 2015-19. Retail hiring actually increased after the pandemic before falling back to its historical level of 750K hires.

Health Care continues its forward march to consume all of the US economy. 😦

Manufacturing new hires dropped by one-third after the Great Recession, but very surprisingly recovered from 250K to 350K new hires by 2018-19. Manufacturing new hires grew even faster, above 400K after the pandemic.

The government sector has less variability. New hires have increased to 400K after the pandemic.

New hires in the Construction industry peaked before the pandemic and have drifted downwards ever since.

Hiring in the Financial Services industry dropped by one-third due to the Great Recession, but has slowly recovered to almost the 240K level.

The Arts sector has recovered to its pre-pandemic level of hiring.

Hiring in the Wholesale Trade industry fell from 180K to 120K with the Great Recession but has since recovered to 160K.

The Education industry has continued with its increased hiring.

Summary

The annual rate of new hires has dropped by 10% from 6.6M to 6M. 9 of the 12 sectors have drifted sideways. 3 have fallen significantly in the last 9 months: professional and business services, retail trade and transportation, warehousing and utilities. The economy is clearly in a slow-down period, but the ongoing trend of growth is clear.

Good News: Emergency Medical Services (EMS) Today (1972-2022)

Positive Media Coverage

https://www.imdb.com/search/keyword/?keywords=medical-drama

Since the pioneering 1972 drama Emergency! there have been dozens of TV shows highlighting the critical role of emergency medical services (EMS) personnel.

https://www.imdb.com/search/keyword/?keywords=medical-drama

Vehicles

Modern Emergency Medical Services (EMS) vehicles today are designed to help EMS medical professionals provide world class care. They now meet national standards (1974, 1990) for space, equipment, supplies and client care. These vehicles are stocked with supplies and equipment to meet all typical emergency care needs.

https://www.nremt.org/about/history

Air Medical Services

Helicopter based emergency services started in 1974 in Baltimore, Jacksonville, Pittsburgh, Seattle and Denver leveraging the equipment and pilot experiences of the Vietnam War. Emergency helicopters are staffed with qualified personnel and equipment to handle the most extreme situations. Emergency personnel are staged across the country to respond to emergency situations.

In 2020, there were more than 1,600 helicopters and 700 fixed wing aircraft participating in emergency medical services in the US, making more than 200,000 responses to service requests.

https://www.hmpgloballearningnetwork.com/site/emsworld/article/1223054/air-medical-services-then-and-now

Emergency Medical Profession

The National Registry of Emergency Medical Technicians (NREMT) was established in 1970. This organization has driven the development of a true profession.

https://www.nremt.org/about/history

In 1975 the AMA recognized emergency medicine as a physician specialization and recognized paramedics as allied health professionals. Prior to this time, the training, skills, employers, supervision, equipment and medical protocols of the emerging profession were so varied that initial efforts to define and enhance the professional identity and roles of paramedics and EMTs were often opposed by physicians, nurses, lawyers and hospital administrators. In the 1970’s states began to pass legislation that defined the legal roles which paramedics and EMTs could play without concern for lawsuits from their customers. Specialized emergency physician training was also developed during the 1970’s highlighting the role of paramedics, immediate care, transport care, triage issues, communications and the emergency room admitting and medical services. Emergency medical dispatching programs started in the 1980’s. Military paramedics/EMTs adopted national standards in 1986, aligning the two groups. Paramedic manager standards for training have been defined for most states.

Paramedics and EMTs are regulated at the state level. Definitions of roles, titles, allowable drugs/procedures, supervision requirements, certifications, examinations, renewals and education programs varied widely in the 1970’s. The role of national certification as an option or requirement grew throughout the 1980’s and 1990’s. Today, differences between states remain, but most states (45+) largely conform to recommended national standards for all dimensions.

While most people think of paramedics and EMT’s as specialized staff or extra skills held by first responders, the profession now includes military personnel, dispatchers, air staff, emergency room, jail, blood bank, medical labs, education and interhospital transportation roles. This increased breadth of experiences has helped the profession to improve the content of its services, education, certification and allowable procedures.

https://en.wikipedia.org/wiki/Paramedics_in_the_United_States

Professional Certification

As states defined various paramedic and EMT legal roles, they created state professional certification agencies. The first national EMT exam was administered in 1971 to 1,500 applicants. By 1984 one-half of states required the national exam for certification. By 2005, 46 states recognized or used the standardized national exams.

The national exams incorporated American Heart Association standards in 1986. Major national standards changes were implemented in 1994-95 to include 2 decades of lessons learned, a systems approach to paramedic/EMT roles and a dual focus on theory and practice.

A single national organization (NREMT) sets national standards and reviews those states and programs which adopt them. Certification standards are defined for 5 typical levels in each state and at the national level. A majority of states simply adopt the national standards and almost all accept candidates who met the national standards rather than specific state standards. The “level” of skills, training and experience in states that do not adopt the national standards are generally comparable, with a few exceptions. A national standard curriculum is available which is aligned with the testing requirements. Candidates are evaluated on theory and practice, individual diagnosis/treatment and situation/scenario evaluation. Certification requires a period of field internships. A majority of firefighters earn some level of EMT certification. Almost all states recognize certifications from other states. The national agency accredits training programs and agencies.

https://www.emsmemorial.org/ems-history

https://indianahealth.care/history-of-ems

https://wvde.state.wv.us/abe/Public%20Service%20Personnel/HistoryofEMS.html

Professional Education

Ambulance staff training was first defined in the late 1960’s. The first EMT curriculum was nationally recognized in 1969. Prior to this time, ambulance staff had basic first aid training. National training standards were set in 1973 together with the emerging certification exams. A full national paramedic curriculum was released in 1977. A comprehensive “emergency care” manual was published in 1979. Early training was largely done by individual hospitals in urban areas. Training soon moved to universities and community colleges where it is focused today. While associates and bachelor’s degrees are not required for most paramedic/EMT licenses, they are now commonplace. The number and variety of procedures provided by paramedics and EMTs has grown throughout the period. As emergency room physicians became commonplace and their confidence in EMS staff increased, they supported this growth in “standing procedures” to be taken without physician coordination. With increased experience, documentation, best practices and scientifically based standards improved. The medical profession adopted a “systems approach” to health care beginning in the 1990’s and EMS staff have adopted this approach.

Cardiac Care

Prior to 1972, CPR training was defined and more broadly offered in the US. Portable defibrillators were invented but not broadly available. Emergency cardiac treatment programs were rare.

In the 1970’s heart resuscitation guidelines were published, more portable defibrillators were available and related EMT training began.

Cardiac care has been a key curriculum and certification exam component for paramedics/EMTs since the 1980’s.

The American Red Cross introduced defibrillator training into its first aid course in 1999.

The easier to use AED defibrillator was approved for sale in 2004 and is now widely placed in many communities and millions have been trained to use them.

Pediatric Care

Pediatric care was upgraded in the 1984 curriculum and exam standards for EMS staff. Specialized pediatric care hospitals were clearly established.

Emergency Rooms

Hospitals invested in emergency room space, equipment and staff after 1975 when emergency room physicians became a specialty. In 1983 Level 1 trauma centers and pediatric critical care centers were defined and began to be implemented. Disaster resource centers were defined in 2004. Stroke centers were defined in 2009. While these specialty care centers were defined, a wide variety of immediate care centers were established in many areas, providing additional options for EMS services.

Medical Protocols

EMS professionals have benefitted from the global “process revolution” of the 1980’s. Health care professionals view each patient and situation within a “process framework”. This has allowed paramedics and EMTs to increase the variety and depth of first response diagnosis and treatment which they can legally and effectively provide. Evidence based medical standards replaced the previous “trial and error” standards in the 1990’s. Standard operating procedures were defined for most situations. This allowed EMS staff to act immediately without emergency physician approval in more situations. “Standing field treatment protocols” were widely defined and adopted in 1997 clarifying the roles of paramedics/EMTs. EMS standards were further revised in 2000 using the “medical systems” approach. Standardized EMS data recording and sharing began in 2000 and has expanded since then, allowing improved systems, evidence and medical based changes to accumulate. States generally approve both procedure and medical treatment options for individuals holding each level of EMT/paramedic certification.

Communications

In 1972, police and fire vehicles had basic special purpose radio communications and dispatchers as did taxi fleets. Improved medical dispatching skills accompanied the growth of EMS resources. Revised EMS radio communication standards were adopted in 1973. EMS staff benefitted from the expansion of cellular phone services. 911 emergency call services began in 1968 and expanded nationally throughout the 1970’s. Dedicated EMS to hospital communications as increasingly adopted in the 1990’s. Video services were added after 2000.

Funding

In 1966 a National Academy of Sciences study titled “Accidental Death and Disability” highlighted the comparatively high casualty rates of domestic vehicle accident victims versus those with war injuries! Thousands of Americans were disabled, mistreated and died each year versus the standard treatment offered by the military in combat zones. Congress responded by moving lead responsibility for EMS from the US DOT to US HEW in 1972. 5 demonstration EMS programs were funded in 1972. Further federal investments were made in the 1970’s. However, by 1980, Congress and the president decided that states should manage and fund this component of the health care system.

EMS Professional Skills

Today, when you dial 911 in an emergency, you can expect a nationally certified, trained and supervised team to quickly arrive and provide a high-quality level of services.

Assessment of incident, accident, patient situation.

Compliance with standard care protocols and escalation to physicians.

Triage in mass casualty situations.

Safe movement and extraction of patients from accident situations.

First aid treatment.

Intravenous fluid administration.

ECG, EKG administration and defibrillation (manual and electric).

Intubation.

Drug administration.

Acute asthma treatment.

Heart rhythm assessment and rate correction.

Spinal immobilization.

Transportation to the best next level care facility.

One Million EMS Professionals!

There are 1 million certified emergency medical system (EMS) personnel in the US today, up from basically ZERO in 1972. One-fourth are highly skilled paramedics. A little more than one-half are certified EMTs.

https://www.nremt.org/maps

About one-half of the total were certified at the national level.

Pre-1972

Inflation is Slowing

Brief Analysis Below Each Chart:

Since July, overall inflation is immaterial (1%), about 2% on an annual basis.

The Services sector is the most concerning, with annual inflation still running near 6%. The recovery from the pandemic started with the goods sector and then slowly rotated into the services sector as “in person” services re-emerged.

Since March, 2022 durable goods have reassumed their long-term price Deflation.

Nondurable goods are back to 0% inflation.

Energy prices are clearly falling now.

Gas prices have retreated back to $3 per gallon as quickly as they increased.

Food prices have fallen but remain abnormally high, growing at 6% annually. Global pressures may keep this category above normal during 2023.

Wage-push inflation remains a thing of the past. Real wages remain flat.

Strong economies with solid currencies are able to import cheaper goods and reduce domestic inflation.

Producer prices have fallen by 6% from their peak.

US fiscal policy for 2022 was at the same expansionary level as pre-pandemic 2019. I think it was a little too expansionary, but this level of deficit did not significantly drive the increased inflation in 2022. The budget deficit for fiscal year ending September, 2023 is expected to increase by a small amount, even though the latest official CBO forecast showed a smaller deficit.

https://www.cbo.gov/publication/58470

Monetary policy was very loose in 2020, attempting to offset the many threats to the economy. It has since been closer to “neutral”. There is no solid historical or theoretical basis to carefully predict the effect of this huge increase in the money supply two and a half years later.

The Federal Reserve Bank has increased interest rates and the housing, stocks, bonds, construction and commercial investment markets have been impacted, slowing aggregate demand for assets, goods and services.

https://www.federalreserve.gov/econres/notes/feds-notes/excess-savings-during-the-covid-19-pandemic-20221021.html#:~:text=By%20the%20third%20quarter%20of,%241.7%20trillion%20by%20mid%2D2022.

The stock of “excess savings” which supported the rapid recovery from the pandemic peaked in early 2021 at $2.25T. It had fallen by 20% to $1.75B by the 3rd quarter of 2022 and continues to fall, reducing aggregate demand.

Summary

The scariest inflation scenarios are no longer plausible. Durable goods, nondurable goods, producer and energy prices are falling. Food and services prices remain elevated at 6% but are not in double digits and are not increasing. Real wages spiked briefly during the heart of the pandemic but quickly returned to pre-pandemic levels where they have remained.

The federal budget deficit in 2022 was the same as in 2019 when inflation remained low. Even with a slowing economy, the forecast 2023 budget deficit remains about the same as in 2022, not adding materially to excess demand. Monetary policy in 2022 has consistently been tighter and tighter, with the Federal Reserve chairman promising to “do whatever it takes” and highlighting the much greater negative consequences of inflation that does not return to the target level. Weakened fiscal and monetary policy should help to further reduce any remaining supply chain constraints in the global economy. The housing and capital investment sectors are declining. The impacts of changed monetary and fiscal policies are seen 6-24 months later.

Double-digit and accelerating inflation are no longer credible. Deflation is the rule in a large part of the US economy. Monetary and fiscal policies are tightening. Overall inflation is falling. The economy has already slowed, so we may even be entering a period of self-reinforcing lower rates of inflation.

Good News: More Leisure Time for Gaming

https://www.ibisworld.com/industry-statistics/market-size/video-games-united-states/

In current dollars, we have a $90 billion gaming industry in the US today.

Economists generally adopt a utilitarian view of value and conclude that if individuals choose to consume more of a good or service it is because they more highly value that good or service versus other options that they could consume. Economists try not to “second guess” consumption choices as being better or worse for people, even though they may have personal preferences that are quite different. “Games”, like “alcoholic beverages” have been second guessed by society and restricted at various times and places, but economists conclude that free individuals’ consumption choices are very relevant.

In my 1960’s and 1970’s childhood and young adulthood, video games were just emerging. We were an analog generation, lured into spending our dimes and quarters on pinball games. The pinball world peaked in 1979, with 200,000 new game devices sold that year to be played in bars, community centers, restaurants, student unions, pool halls, VFW’s and Lions’ Clubs. At less than $1,000 per machine, the total wholesale market was about $200M. The new electronic video arcade games grew very rapidly from 1975 to 1980. Estimated total coin operated pinball/video games sales were estimated to have grown from $300M in 1978 to almost $1B in 1979, an amazing 3-fold increase in one year.

https://en.wikipedia.org/wiki/History_of_video_games#:~:text=According%20to%20trade%20publication%20Vending,to%20%242.8%20billion%20in%201980.

https://pastimepinball.com/a-brief-history-of-the-silver-ball#:~:text=Pinball%20in%20its%20modern%20form,and%20didn’t%20involve%20skill.

That $300M in 1978 was a tiny fraction of the current dollars $2.5T GDP that year. One out of every $8,250 of GDP (.012%) was devoted to pinball machines and elementary video games.

Pinball machines were clearly the predecessors of video games.

https://pastimepinball.com/a-brief-history-of-the-silver-ball#:~:text=Pinball%20in%20its%20modern%20form,and%20didn’t%20involve%20skill.

https://www.betson.com/history-of-pinball/

https://www.polygon.com/2014/4/4/5570814/how-pinball-and-boardwalk-amusements-gave-rise-to-video-games

Video games grew rapidly from 1978 to 1983 before encountering a crash in 1983 and then resuming their heroic climb in claiming the attention of youths, mostly males at first, but eventually everyone.

https://www.gamedesigning.org/gaming/history/

https://www.history.com/topics/inventions/history-of-video-games

https://www.si.edu/spotlight/the-father-of-the-video-game-the-ralph-baer-prototypes-and-electronic-games/video-game-history

https://electronics.howstuffworks.com/video-game2.htm

The most detailed history of the emergence of video gaming as the computer industry evolved.

The $90B consumed by the gaming industry in 2022 was a much larger fraction of the current dollar $20T US economy than in 1978. The population grew by 50% from 1978 to 2022. Real, inflation adjusted, GDP grew three times from 1978 to 2022. The $300M market in 1978 is worth almost $1.2B in 2022 dollars. Hence, the gaming market today consumes 75 times as much time and GDP today as it did in 1978 ($90B).

For economists, with neutral utilitarian values, this is an incredible increase in community well-being. Consumers now choose to consume 75 times as much gaming entertainment services as they did in 1978.

The global gaming entertainment market is more than twice as large as the US market, an estimated $214B.

https://www.weforum.org/agenda/2022/07/gaming-pandemic-lockdowns-pwc-growth/

https://www.insiderintelligence.com/insights/us-gaming-industry-ecosystem/

About one-half of Americans are considered active gamers.

https://www.ey.com/en_us/tmt/what-s-possible-for-the-gaming-industry-in-the-next-dimension

Consumers game on various platforms.

https://www.bain.com/insights/level-up-the-future-of-video-games-is-bright/

The global market for gaming entertainment is expected to double in the next 5-7 years.

https://www.weforum.org/agenda/2022/07/gaming-pandemic-lockdowns-pwc-growth/

https://www.ibisworld.com/industry-statistics/market-size/video-games-united-states/

https://www.mordorintelligence.com/industry-reports/global-gaming-market

https://www.bain.com/insights/level-up-the-future-of-video-games-is-bright/

https://www.yahoo.com/now/gaming-market-size-worth-usd-113000927.html

Summary

Humans with extra time have always sought “amusements” through entertainment, sports, travel and personal services. The “games” category has grown rapidly in the last 50 years and appears ready to keep growing for the next quarter-century at least. This is fundamentally “good news” because people are consuming more of what they desire. It is especially “good news” because “games” are available at relatively low costs, so they are available to most of the population as an improvement to their lives.

Recession!?, Recession!?, I Can’t Find Any Recession!

October State Level Unemployment

https://www.bls.gov/web/laus/laumstrk.htm

15 of the 50 states have unemployment rates in the TWO’s!

The Great Plains region has 7 states with 2% unemployment rates: MN, SD, ND, Mo, KS, NE and IA.

Utah (2.1%) and Idaho (2.9%) standout in the Rocky Mountain states.

In the Southeast, Alabama (2.6%), Florida (2.7%) and Georgia (2.9%) enjoy minimal unemployment.

New Hampshire (2.4%) and Vermont (2.3%) represent New England and Virginia leads the Middle Atlantic (2.7%).

Another 20 states report 3% unemployment rates, for a total of 35 (70%) at 2-3%.

The remaining 15 states and the District of Columbia (4.8%) enjoy 4% unemployment, historically considered better than “full employment”. Illinois (4.6%) and Nevada (4.6%) have the highest unemployment.

September Metro Area Unemployment Rates

https://www.bls.gov/web/metro/laummtrk.htm

A plurality (40%, 149) of the 370 US metropolitan areas report employment rates of 3%, consistent with the 3.5% overall national rate.

More than one-third (34%, 124), enjoy rates in the 2% range!

About one in seven (14%, 51) reflect better than classic “full employment” rates in the 4% range.

24 metro areas (6%) enjoy astonishingly low 1% unemployment rates.

22 metro areas (6%) are outside of “full employment” at 4.9%. 17 are in the 5% range. 5 exhibit 6%+ unemployment rates.

The statistics for just the top 100 metro areas show the same pattern. The distribution of unemployment rates weighted by population shows less dispersion, with just 3% each in the 1% and 5%+ ranges and a heavier 47% in the central 3% range.

22/370 Metro Areas Not at Full Employment (5-7% Unemployment Rates)

California: Yuba City, Madera, Fresno, Hanford, Merced, Bakersfield, Visalia

Texas: Corpus Christi, Brownsville, Beaumont, McAllen

Illinois: Danville, Kankakee, Decatur, Rockford

Michigan: Muskegon, Saginaw, Flint

Pueblo, CO, Rocky Mount, NC, Farmington, NM and Las Vegas, NV

42 of the 50 states enjoy having all of their metro areas with full employment.

24 Metro Areas with Far Better than Full Employment (1% Unemployment Rates)

Missouri: Columbia, Jefferson City, Springfield, St Joseph, Joplin, Cape Girardeau

Lincoln, NE and Ames, IA

Minnesota: Mankato, Rochester, St Cloud, Minneapolis-St Paul

Dakotas: Fargo, Grand Forks, Bismark, Sioux Falls, Rapid City

Utah: Provo, Logan, Ogden, Salt Lake City

Burlington, VT, Columbus, IN and Bloomington, IN

Summary

The labor market stands out as a very positive measure of the health of the US economy in October, 2022. A general, prolonged, material decline in economic health is difficult to see on top of this broadly very positive economic base. A slow-down? Highly likely.

Good News: US Solar Power Accelerates

https://www.jpost.com/jpost-tech/largest-solar-energy-field-in-us-to-be-built-by-israeli-company-682123

US Solar Potential is Strong

Solar Power Generating Installations are Growing Exponentially, Mainly at Utility Scale

The Total Solar Power Generating Base Grows

Solar Power is the Leader for New Electricity Generating Capacity

Solar Power is Now 4% of Electricity Generation

https://en.wikipedia.org/wiki/Solar_power_in_the_United_States

Commercial/Corporate Solar Power is Growing

Residential Growth Continues

Community Solar Projects Growth Slows

Utility Scale Installations are Growing Most Rapidly

Costs Continue to Decline, Making Solar Competitive with All Other Sources

Short-term Supply Chain, Trade and Regulatory Challenges. New Government Incentives.

https://en.wikipedia.org/wiki/Solar_power_in_the_United_States

https://www.seia.org/research-resources/solar-market-insight-report-2022-q3

https://www.seia.org/news/us-solar-market-ready-rebound-after-tumultuous-first-half-2022

https://www.seia.org/solar-industry-research-data

https://cen.acs.org/energy/solar-power/US-solar-polysilicon-supply-problem/100/i33

https://www.energy.gov/eere/solar/solar-futures-study

https://www.cnbc.com/2022/09/08/solar-installations-will-nearly-triple-over-the-next-five-years-seia.html

https://arstechnica.com/science/2022/09/us-installs-record-solar-capacity-as-prices-keep-falling/

https://www.reuters.com/business/energy/developers-add-less-than-half-planned-us-solar-capacity-h1-eia-2022-08-11/

Summary

Utility scale photovoltaic solar panel energy generation is the future for the US energy market. The cost structure is already low enough to justify 30-40 year investment projects. Solar projects are 40% of new electricity generation projects, heading towards 50-60%, competing fairly with wind power. Solar power at 4% of the total electricity generating capacity is still relatively small, but the new investments will drive it to 8%, 12%, 16% and 20% in the next 20 years.

Good News: Many More Americans Have Medical Insurance Coverage

https://www.pepperconstruction.com/project/indiana-university-health-north-hospital

Long-term Trends, Uninsured, Under Age 65

1970’s: 13%

1980’s: 14%

1990’s: 17%

2000’s: 17%

2011-13: 17%

2015-18: 11%

One-third of the uninsured became insured due to Obamacare.

\https://www.kff.org/other/state-indicator/total-population/?dataView=0&activeTab=graph&currentTimeframe=0&startTimeframe=12&selectedDistributions=uninsured&selectedRows=%7B%22wrapups%22:%7B%22united-states%22:%7B%7D%7D%7D&sortModel=%7B%22colId%22:%222021__Uninsured%22,%22sort%22:%22desc%22%7D

KFF reports the uninsured rate fell from 15% to 9%.

Census bureau reports decline from 13% to 8%.

Latest data shows 8%.

https://aspe.hhs.gov/reports/2022-uninsurance-at-all-time-low

https://www.usnews.com/news/health-news/articles/2022-08-03/just-8-of-americans-lack-health-insurance-a-record-low

Detailed Breakdowns

Healthy adults, 19-34, are most commonly uninsured.
Poor families are 3-4 times as likely to be uninsured.
Hispanic-Americans are twice as likely as African-Americans and 3 times as likely as White Americans to be uninsured.

The 40 states that adopted the expansion of Medicaid to cover medical costs for low-income families have uninsured rates about one-half the level of the other 10 who rejected this federal program.

Private insurance accounts for two-thirds of all coverage.

The decline in the medically uninsured has been relatively consistent across racial/ethnic groups from 1984 to 2009 to 2019. Whites 14% to 17% down to 11%. Blacks 20% to 19% to 11%! Hispanics 30% to 33% to 23%.

https://www.pewtrusts.org/en/research-and-analysis/blogs/stateline/2022/10/07/many-patients-cant-afford-health-costs-even-with-insurance

Another 3.7M Americans would have basic medical insurance coverage if the remaining 10 states would fully participate in the federal Medicaid program.

https://en.wikipedia.org/wiki/Health_insurance_coverage_in_the_United_States

The “South”, Texas and Florida have much higher uninsured rates.

14 states have much higher uninsured rates than the nation at large. TX and OK at 15%. GA, FL, MS and WY at 12%. NC, AL and AZ at 11%. NC, TN, SC, AL and NM at 10%. Rural, southern and mountain states, by and large.

There were 28M uninsured people in the US in 2021. Just six of the high uninsured percentage states account for 42% of all uninsured people. TX (5.2), GA (1.3), FL (2.6), AZ (.8), NC (1.1), and TN (.7). The other 8 high uninsured percentage states include 2.6M uninsured citizens, for a cumulative total of 14.3M; more than one-half of the uninsured in 14 states, about one-third of the country. Five high population states with 5-7% uninsured rates account for another one-fourth of the total: 6.9M. CA, NY, IL, OH and PA.

Summary

Between 2013 and 2015, the US reduced its uninsured population by one-third and has slowly reduced its uninsured population in the last 7 years.