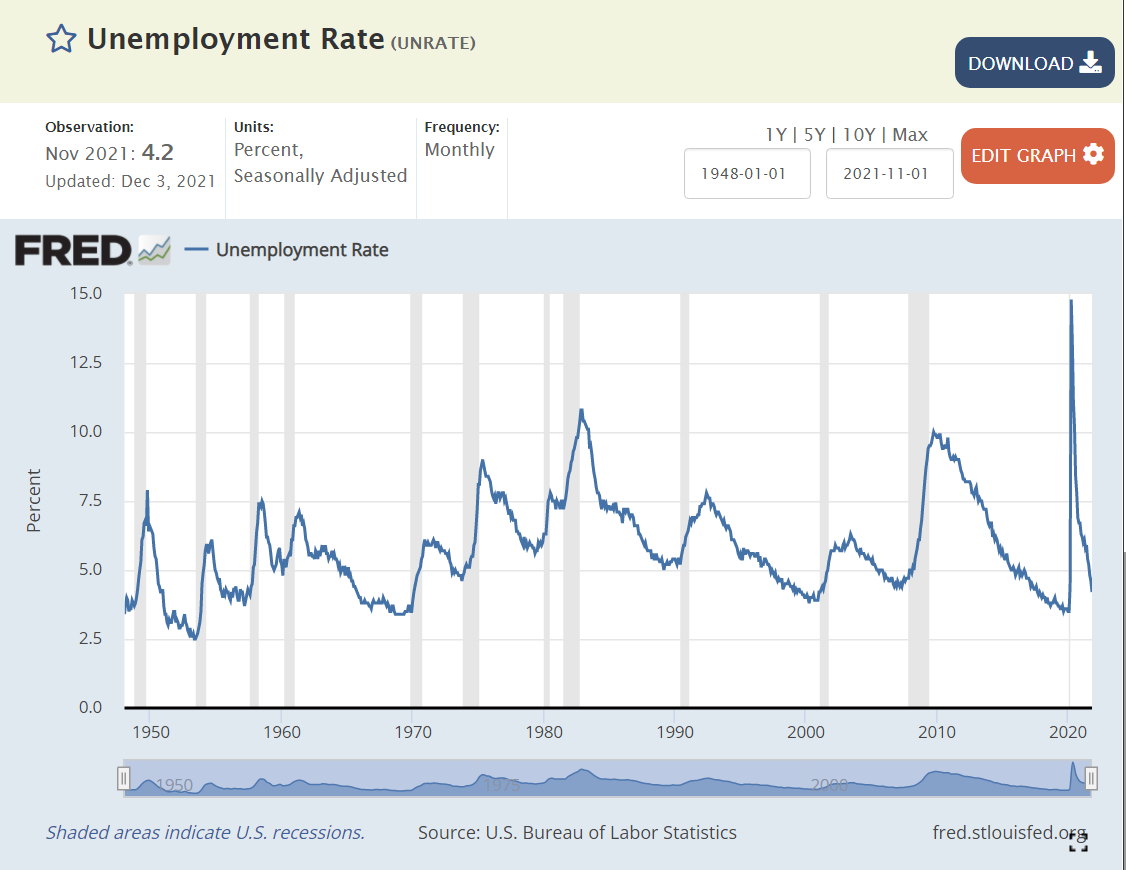
The official US unemployment rate has rarely gone below 5%, and has typically risen back above 5% in a matter of months. The post WWII boom from 1951-53 was one positive period. The Vietnam War + Great Society spending period of 1965-69 was another. The second Clinton presidency from 1997 to 2001 was another 4 year period of prosperity.

The Obama presidency started with 7.5% unemployment. It peaked at 10% in 2009, before falling consistently to 4.7% at the end of his term in 2016 (cut in half). The Trump presidency saw a continued reduction of the unemployment rate to a minimum of 3.5% 2 years later, exceeding the expectations of mainstream economists and forecasters.
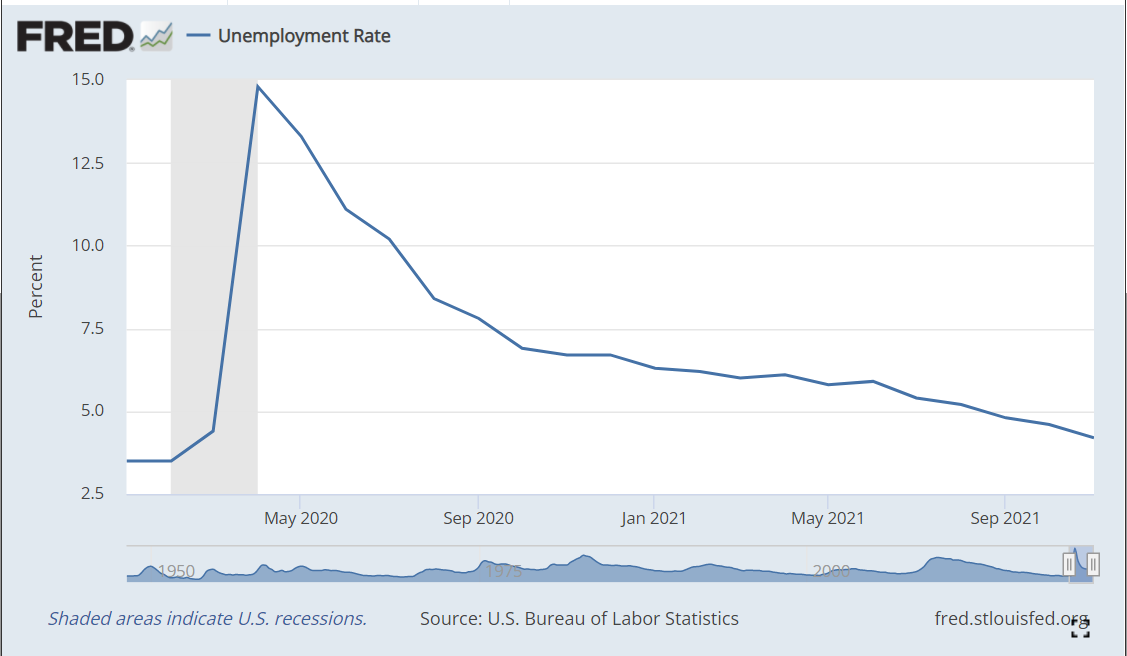
Unemployment quickly climbed to 15% during the pandemic, before falling back to 6.7% by the end of the year (2020). In the 2 years of the Biden administration, it has declined by 2.5% to 4.2%, a rate last seen in November, 2017.
Historically, “full employment” has been pegged close to 5%.
https://en.wikipedia.org/wiki/Full_employment
The extended period of lower unemployment from 2016-2020 lead many economists to revise their estimate of “full employment” to be an unemployment rate of just under 4.5%.
https://www.bloomberg.com/quicktake/full-employment
Candidate Trump repeatedly claimed that candidate Biden would “ruin” the economy. It has proven to be more resilient to a change in administrations.
https://www.cbsnews.com/news/trump-economic-club-new-york-recovery-jobs/
The economic expansion has lead to unprecedented low 1.5% unemployment rates in some Midwest communities.
The recent economic recovery has had a disproportionately positive effect on Republican leaning (Red) states., which have a median 3.5% unemployment rate. Nebraska, Utah, Oklahoma, Idaho, South Dakota and Montana enjoy sub 3% unemployment rates. Democratic leaning (blue) states have a median 5.4% unemployment rate, with only the blue states of Vermont and Minnesota experiencing below average unemployment. The purple battleground states are in the middle with a median 4.5% unemployment rate.
https://www.bls.gov/web/laus/laumstrk.htm
https://www.270towin.com/content/blue-and-red-states
Large metropolitan areas have seen a slightly better than national reduction in their unemployment rates. 25 of the top 50 metro areas have unemployment rates below 4.0%. 8 have rates below 3%. Nashville (2.8%), Milwaukee (2.8%), Minneapolis (2.6%), Birmingham (2.5%), Atlanta (2.4%), Indianapolis (2.4%), Oklahoma City (1.9%) and Salt Lake City (1.4%) are clearly experiencing full employment. Another 14 metro areas have unemployment rates of 4.0 – 4.9%; in the “full employment” range. Just 11 have unemployment rates of 5% or higher.
Chicago, Houston, Philadelphia, San Diego, Sacramento, New Orleans and Hartford display marginally high unemployment rates of 5.1% – 5.4%. Just 4 of the nation’s 50 largest metro areas encounter higher rates: NYC (6.3%), LA (7.1%), Riverside (6.3%) and Las Vegas (6.6%).
https://www.bls.gov/web/metro/laummtrk.htm
Despite the prevailing “negative” media attention, if the economic recovery continues at its current rate, the unemployment rate will reach 3.5% or lower in March, 2022. This rate has been recorded only in Feb, 2020, Jul, 1969 and Nov, 1953. In the shadow of a global pandemic last experienced in 1918, this is amazing news.
We are clearly living in “interesting times”.
Personally, I agree with Fukuyama that western liberal democracies and mixed capitalist economies have won the ideological wars, leaving fascist, communist and dictator regimes behind. This is despite the rise of populist movements on the right in western democracies, the resilience of dictatorships on many continents and especially the retrograde actions of China to preserve its central place on earth as a “special” nation. The war is not complete. It calls for liberal capitalist nations to refine their ideologies and wisely play their global roles.
https://en.wikipedia.org/wiki/The_End_of_History_and_the_Last_Man
https://www.theguardian.com/books/2014/mar/21/bring-back-ideology-fukuyama-end-history-25-years-on
https://www.newyorker.com/magazine/2018/09/03/francis-fukuyama-postpones-the-end-of-history