
| Country | 2018 $GDP/ Capita | 2018 vs. 1900 Ratio | 1940 vs. 1900 Ratio | 2018 vs. 1960 Ratio | 2018 vs. 1900 $ Growth | 2018 vs. 1960 $ Growth |
|---|---|---|---|---|---|---|
| USA | 55 | 6.9 | 1.5 | 3.1 | $47 | $37 |
| Australia | 50 | 7.8 | 1.5 | 3.6 | 43 | 36 |
| Germany | 46 | 9.7 | 1.8 | 3.8 | 41 | 34 |
| Sweden | 45 | 13.6 | 2.3 | 3.3 | 42 | 31 |
| Canada | 45 | 9.7 | 1.8 | 3.2 | 40 | 31 |
| Japan | 39 | 18.2 | 2.3 | 6.1 | 37 | 32 |
| France | 39 | 8.4 | 1.4 | 3.3 | 34 | 27 |
| UK | 38 | 5.0 | 1.4 | 2.8 | 30 | 24 |
| Italy | 34 | 10.5 | 1.6 | 3.6 | 31 | 25 |
| Hungary | 26 | 9.6 | 1.6 | 4.4 | 23 | 20 |
| Argentina | 19 | 4.0 | 1.4 | 2.1 | 14 | 10 |
| Mexico | 16 | 9.1 | 1.4 | 3.5 | 15 | 12 |
| Brazil | 14 | 16.1 | 1.8 | 4.1 | 13 | 11 |
US GDP/Capita remains the world leader among large countries in 2018. I’ve extracted comparison data for a dozen representative countries covering the period of 1900 through 2018.
Kuwait/Qatar/Brunei, Singapore/Hong Kong and Iceland/Norway/Luxembourg have higher GDP/Person. For reference, Saudi Arabia is just below the US, while other potential key comparison countries are much lower: South Korea ($39), Russia ($26) and China ($17).
https://www.worldometers.info/gdp/gdp-per-capita/
https://www.rug.nl/ggdc/historicaldevelopment/maddison/releases/maddison-project-database-2020
Taking the long view (120 years), this above (table) set of countries grew their real (inflation adjusted) GDP per person 9-fold, from just $4,000 to $36,000. The US increased 7-fold, from an $8,000 initial position (twice as high) to $55,000 (still 60% higher).
Sweden (14x), Brazil (16x) and Japan (18x) lead the way in century long growth. Argentina (4x) and the UK (5x) were the only countries with slower percentage growth than the US. The US was the world-leader in 1900, providing an advantage for generating growth dollars and a governor on generating percentage growth. The history of the twentieth century was one of less developed countries using technology transfer and increased trade to “catch up” with the historic leaders.
Prior to WW II, most countries grew by the average 60%. Germany and Brazil grew a little faster (80%). Japan and Sweden grew much faster (130%).
Growth from 1960 until 2018 averaged a remarkable 240%! Japan grew 5-fold, leading the way for the “Asian Tigers”. Brazil, Hungary and Germany grew 4-fold. The UK continued its subpar performance (180%), despite the alleged Thatcher revolution and Argentina fell even further behind (110%). US growth was a little slower than average (210%) in the last 60 years, from a starting base of $18,000 versus the average of $10,000 (80% higher).
On a percentage basis, the US growth in output per person was slower than average. On a dollars basis, it remained the market leader overall and added more value than all other countries.
For the whole 120 year period, the US added $47,000 to its GDP/person, growing from $8,000 to $55,000. Australia (43), Germany (41), Sweden (41) and Canada (40) were solid competitors. Japan, France, UK and Italy added more than $30,000 per person. Hungary, Argentina, Mexico and Brazil lagged, adding just $10-20,000.
In the last 60 years, the US added $37,000 to $GDP/capita, tripling its $18,000 base. Australia (36), Germany (34), Sweden (31), Canada (31) and Japan (32) were close competitors. France, UK, Italy and Hungary added $20-27,000. Argentina, Mexico and Brazil grew more slowly ($10-12,000).
Per Capita GDP as % of USA
Another way to place the US performance in perspective is to use it as the baseline and plot other countries’ per capita GDP as a percentage of the US level.
There are different ways to compare GDP across countries. There is not a full consensus among economists. I’m using data from the Maddison Project Database. The data shown on the Worldometer website uses a different method, but the basic results are comparable.
First, we see that the US has had the highest $GDP/capita throughout the 120 year period. In 1900, the US was at $8,000 and second place UK was at $7,600, beginning its long relative decline from being THE imperial power to a mid-level (nuclear armed) European country. In 2018, the US produces $55,000 per person versus second place Australia at $50,000 and third place Germany at $46,000. Adjacent Canada generates 20% less value at $45,000. Formerly high-flying Japan now rests at $39,000 per person.
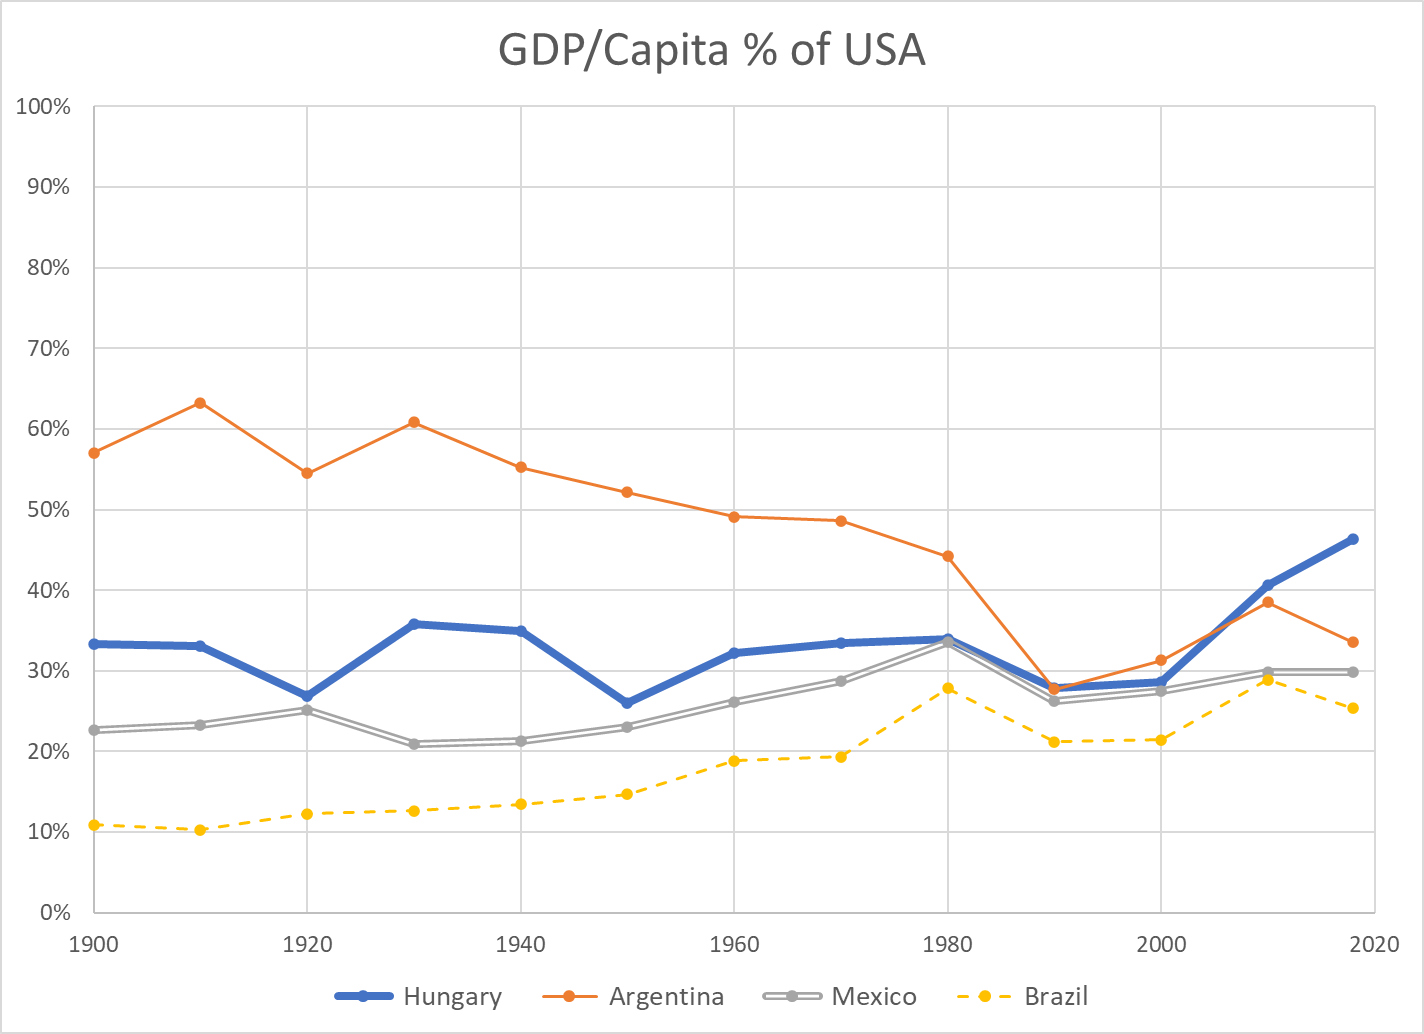
Argentina is an outlier, dropping from 60% to just 35% of US income per person for various political, financial, economic and trade reasons. Hungary is representative of smaller eastern European nations that remained at just 35% of US levels until the fall of the Berlin wall and subsequent integration into the European economy, allowing them to grow towards 50% of the US level. Mexico has slowly grown from 20% to 30% of the US level, but not been able to accelerate further. Brazil has grown from just 10% to nearly 30% of the US level, with significant volatility.
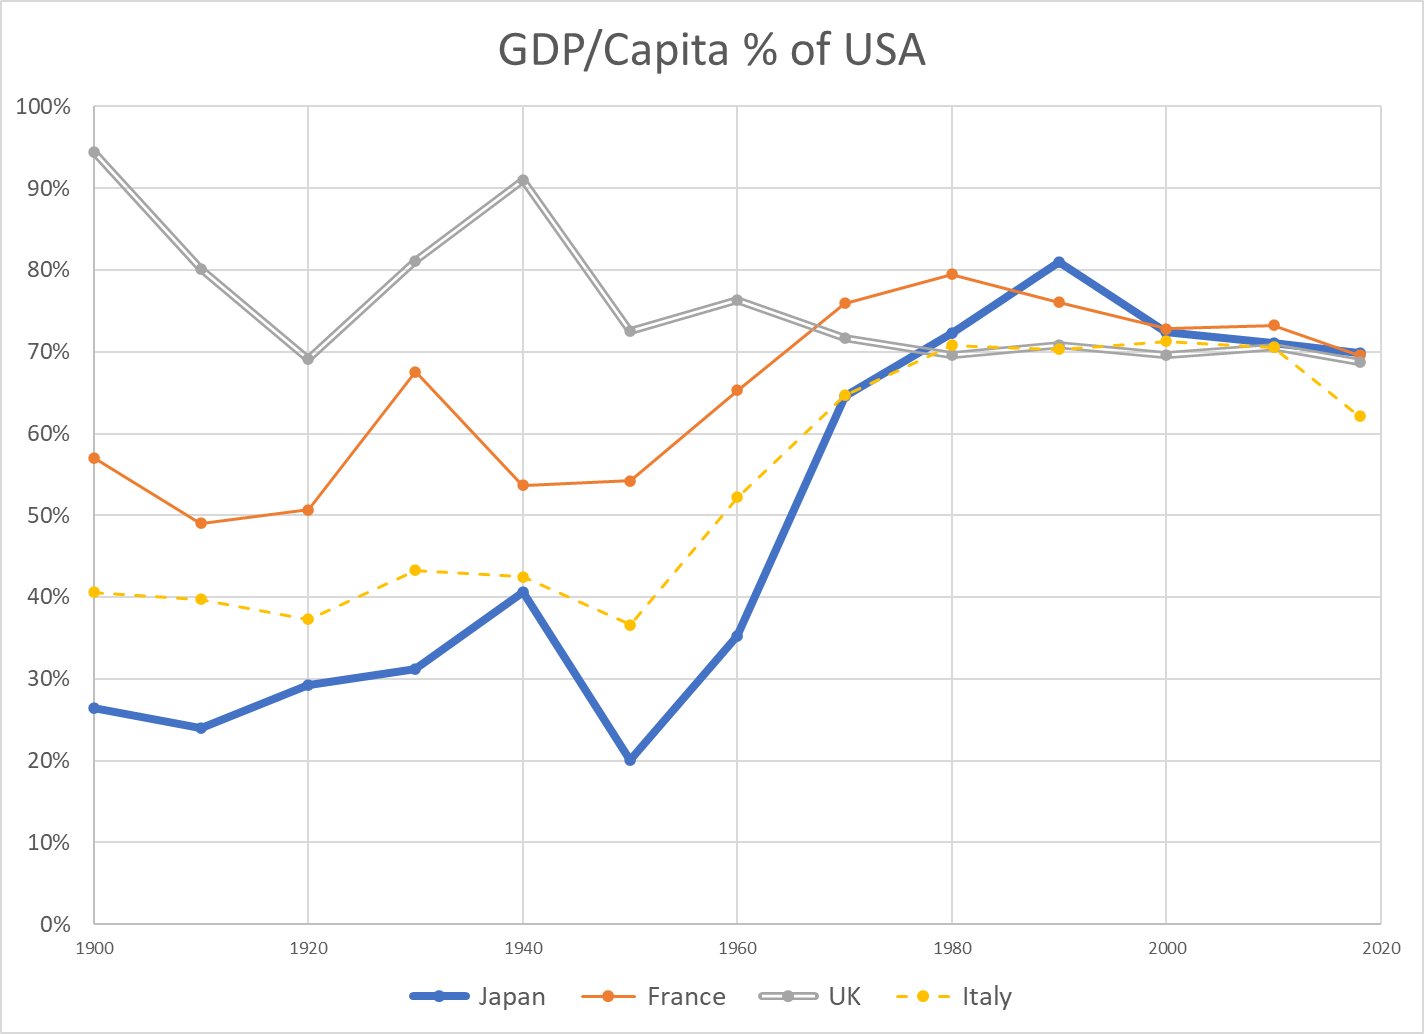
The UK fell from 90% to 70% of the US value added per citizen level by 1970, where it has remained. France weathered the 2 world wars at 55% of the US income level. It recovered nicely to 75% by 1970, peaked near 80% and then drifted back to 70% with its 4-day work weeks. Italy remained at just 40% of the US level through the war years. It grew remarkably to 70% of the US level by 1970, where it remained, before falling back somewhat in the last decade. Japan also struggled through the war years, averaging 30% of the US level. It rocketed to 80% of the US level by 1990, riding total quality management, manufacturing, peacetime and expanded trade. It has dropped back to 70% of the US level.

Australia level pegged the US at 80% for much of the period, until the China lead commodities demand boom pulled it up to 90% recently. Canada grew from a rural, thinly populated, commodities-oriented country at 60% of the US up to 80% by 1970 and has remained in the low 80 percents since then. Germany began the century at 60% of the US level. Following two failed wars, it attained 70% of the US level by 1960. Digesting East Germany was a challenge, but Germany was at 75% of US levels in the early 2000’s and exceeded 80% soon thereafter, riding its manufacturing export capabilities.
Summary
US $GDP/Capita continues to lead the world, as it has done for more than a century. The US percentage growth rate has slowed, but the incremental value added has remained first among large countries. Some other countries have shown periods of relatively strong growth, but none has demonstrated an ability to challenge the US. A number of European countries have found a “mixed” market approach that is competitive with the US, leveraging lower trade barriers within the EU and across the world.
China Postscript
China $GDP/capita (000’s) numbers for 1950 through 2018 are 0.8, 1.1, 1.4, 1.9, 3.0, 4.7, 9.7 and 13.1. Low scoring Argentina (19), Mexico (16) and Brazil (14) each have higher productivity per person. China per capita GROWTH per decade figures are 0.3, 0.3, 0.5, 1.1, 1.6, 5.0, and 3.4 (thousands). The percentage figures are very impressive. Considering China’s 1.4 billion population, they are very impressive. Comparable US decade growth (thousands/person) figures are 3, 6, 5, 7, 9, 3 and 6.
The US has a century-long track record of generating an extra $5,000 per person of value-added output each decade. China has leveraged its low-wage labor, a young work force, manufacturing technology transfer, willing investors, willing importers and an international free trade system to drive its growth. The country has maintained political stability and invested in its economic infrastructure, using economic progress and some level of economic freedom to offset the risks of its political and social restrictions. It faces a flat population and shrinking working-age population before it transitions its remaining rural work force into the manufacturing or urban environment.
It is facing what economists call the “middle income trap”, where countries with rapid economic growth based upon manufacturing or resource extraction need to transition a large part of their economy to higher value-added services and advanced manufacturing. Many countries have failed to make this transition. Some have done so.
https://en.wikipedia.org/wiki/Middle_income_trap
https://asiasociety.org/new-york/china-may-be-running-out-time-escape-middle-income-trap
I’ve worked closely with Chinese electronics firms for more than 25 years. Their capabilities are much greater than what is recorded in the US media. They have solid manufacturing capabilities, including Japanese-style process improvement. They have very strong sales, marketing and account management capabilities, focused on their global business-to-business customers. They have strong product development engineering capabilities and growing project management skills. They have modern MBA management skills and business styles. Their “clusters” of manufacturing, parts, R&D, resources and logistics skills point to long-term competitive advantages in many industries.
I believe that China will continue to be a manufacturing powerhouse, despite trade restrictions. China is well positioned to deliver products to growing markets in Asia, Africa, the Middle East and Latin America.
That being said, I am not concerned that China will eclipse the US in total productivity per citizen in the next 50 years. The gap is simply too large. In 50 years, the US will very conservatively grow from $55,000 to $80,000 of output per person (8%/decade). Mathematically, this requires 3.7% growth in China each year for 50 years, or 44% growth per decade compounded to reach 6.2 times the current level. The historical data contains 1 or 2 decades of 40% growth for some exceptional countries, but not 8 (3 in the bank, plus 5 in the future). If China can grow by 6% annually for one decade (79%) and 5% annually for the next decade (63%), it COULD then grow by just 2.5% annually (28%/decade) to catch the US in 2070.
China has 1.4 billion people versus 330 million in the US. Even including Canada and Mexico, the North American population is just 0.5 million. Europe has roughly 750 million people. Japan, South Korea, Australia and New Zealand have just over 200 million people. Indian has 1.4 billion people, Africa 1.2 billion and Latin America 0.7 billion. China will be a growing world economic and military power, even with its population peaking in 2025-30. The US should consider China to be its primary global rival, perhaps with less “us versus them” posturing. China aims to protect its economic, political and military interests, never again to be dominated and humiliated by outsiders. But, China truly considers itself to be the “center of the universe” and has no “need” to dominate the rest of the world or export its ideology. There are low confrontation options available.

[…] https://tomkapostasy.com/2022/01/19/good-news-us-remains-the-gold-standard-for-gdp-capita/ […]
[…] Good News: Real Airfares are 43% Less than in 1995 Good News: US Agriculture Good News: US Remains the Gold Standard for $GDP/Capita Good News: US Economy is 29 Times as Large as in 1900! Good News: Pets in the USA […]