Good News: International Travel to US Trends Upward in 21st Century

https://ntlrepository.blob.core.windows.net/lib/79000/79200/79277/TSAR_2020_Compressed_20210104.pdf
https://qz.com/2020189/the-us-is-losing-its-appeal-as-a-global-tourism-destination/
https://www.trade.gov/sites/default/files/2021-03/Fact%20Sheet%20International%20Visitation%20FINAL.pdf
https://ntlrepository.blob.core.windows.net/lib/79000/79200/79277/TSAR_2020_Compressed_20210104.pdf
https://qz.com/2020189/the-us-is-losing-its-appeal-as-a-global-tourism-destination/

US Top Recipient of Foreign Travel Dollars

https://data.worldbank.org/indicator/ST.INT.RCPT.CD?most_recent_value_desc=true
https://www.trade.gov/sites/default/files/2021-03/Fact%20Sheet%20Exports.pdf
https://www.ustravel.org/sites/default/files/2021-12/research_fact-sheet_travel_and_trade.pdf

Many US Cities/Destinations Remain Attractive

https://www.worldatlas.com/cities/america-s-10-most-visited-cities.html

https://www.bts.gov/archive/publications/state_transportation_statistics/summary/table_04_19

Future: Forecast, Challenges, Opportunities

72% Recovery in 2022, 100% in 2024

https://www.ustravel.org/research/travel-forecasts

Less “America First” Headwinds

https://qz.com/2020189/the-us-is-losing-its-appeal-as-a-global-tourism-destination/

Marketing Investment Opportunities

https://www.ustravel.org/press/us-travel-market-share-continue-decline-through-least-2023-report

Good News: US Coal Usage is Falling

https://en.wikipedia.org/wiki/Coal_mining_in_the_United_States
https://www.eia.gov/todayinenergy/detail.php?id=48696
https://en.wikipedia.org/wiki/Coal_mining_in_the_United_States

Exports First Exceeded 10% of Production in 2012

https://www.eia.gov/coal/annual/pdf/acr.pdf
https://www.eia.gov/coal/annual/
https://www.eia.gov/todayinenergy/detail.php?id=38172
https://www.eia.gov/todayinenergy/detail.php?id=37692
https://www.eia.gov/todayinenergy/detail.php?id=43895

Coal Accounts for 20% of Electricity Generation

https://www.csis.org/analysis/phasing-out-coal-us-electricity-increasingly-regional-challenge

https://en.wikipedia.org/wiki/List_of_coal-fired_power_stations_in_the_United_States

30% of Coal-Fired Power Plants Closed 2010-19

https://en.wikipedia.org/wiki/List_of_coal-fired_power_stations_in_the_United_States

https://www.eia.gov/todayinenergy/detail.php?id=50658

Up to Two-thirds of 240 Remaining Coal-Fired Power Plants to Close by 2028

https://www.reuters.com/business/energy/us-coal-fired-power-plants-scheduled-shut-2021-10-28/

https://www.eia.gov/todayinenergy/detail.php?id=50658

https://abcnews.go.com/US/wireStory/coal-fired-power-plants-close-wastewater-rule-81328300

https://www.newsweek.com/26-coal-fired-power-plants-14-states-plan-stop-burning-coal-due-new-rule-1652009

Remaining Coal-Fired Power Plants are Concentrated in a Dozen States

https://pubs.usgs.gov/of/1996/of96-092/Comp/main.gif
https://www.csis.org/analysis/phasing-out-coal-us-electricity-increasingly-regional-challenge

Coal Production and Consumption Temporarily Rebounded in 2021 as the Economy Recovered from the Pandemic and the Cost of Natural Gas Increased

https://www.iea.org/news/coal-power-s-sharp-rebound-is-taking-it-to-a-new-record-in-2021-threatening-net-zero-goals

https://www.cnn.com/2021/10/18/business/coal-power-climate-crisis/index.html

Good News: Polio is Almost Gone

The US averaged 35,000 annual cases of polio in the 1940’s. The disease was eradicated in the US by 1979.

Global cases were 350,000 in 1988. Concerted efforts by governments, health care professionals, philanthropists and civic organizations (Rotary) eliminated polio from 5 continents by 2020. The last African case was reported in Nigeria in 2016.

Active cases were reported in only Afghanistan and Pakistan last year.

Soon, this will be the second ever human infecting disease to be eliminated (after smallpox).

https://www.cdc.gov/polio/progress/index.htm#:~:text=The%20annual%20number%20of%20wild,certified%20as%20eradicated%20in%202019.

https://ourworldindata.org/polio

https://www.cdc.gov/polio/what-is-polio/polio-us.html

https://www.rotary.org/en/our-causes/ending-polio

Indy Metro Area vs Rest of Indiana (1970-2020)

The Indy Metro Area is comprised of Marion County plus the 7 surrounding “donut” counties. Marion has grown throughout the half-century, adding 175,000 people (22%). Rural Morgan and Shelby counties have not grown much. Hancock, Boone and Johnson counties have doubled their populations. Hendricks has grown from 50,000 to 175,000. Hamilton has grown exponentially from 50,000 to 350,000. This relatively rapid growth has made the metro area grow from 21% to 28% of the state total, adding state senators and representatives and causing increasing tensions between the one large, growing area and the slower growing, largely rural, rest of the state. There are suburban Chicago, Louisville and Cincinnati counties that have shown decent percentage growth, but they are a small share of the state. Lake County (Gary) is a special case, declining in population decade after decade.

The Indy Metro counties started 1970 with slightly higher per capita personal incomes, so the share of the state total was 24%, a bit above the 21% population share. By 2020, the Indy Metro area had captured one-third of the state’s personal income (34%), much higher than its 28% share of the population. Per capita incomes and population had both grown in the capital region.

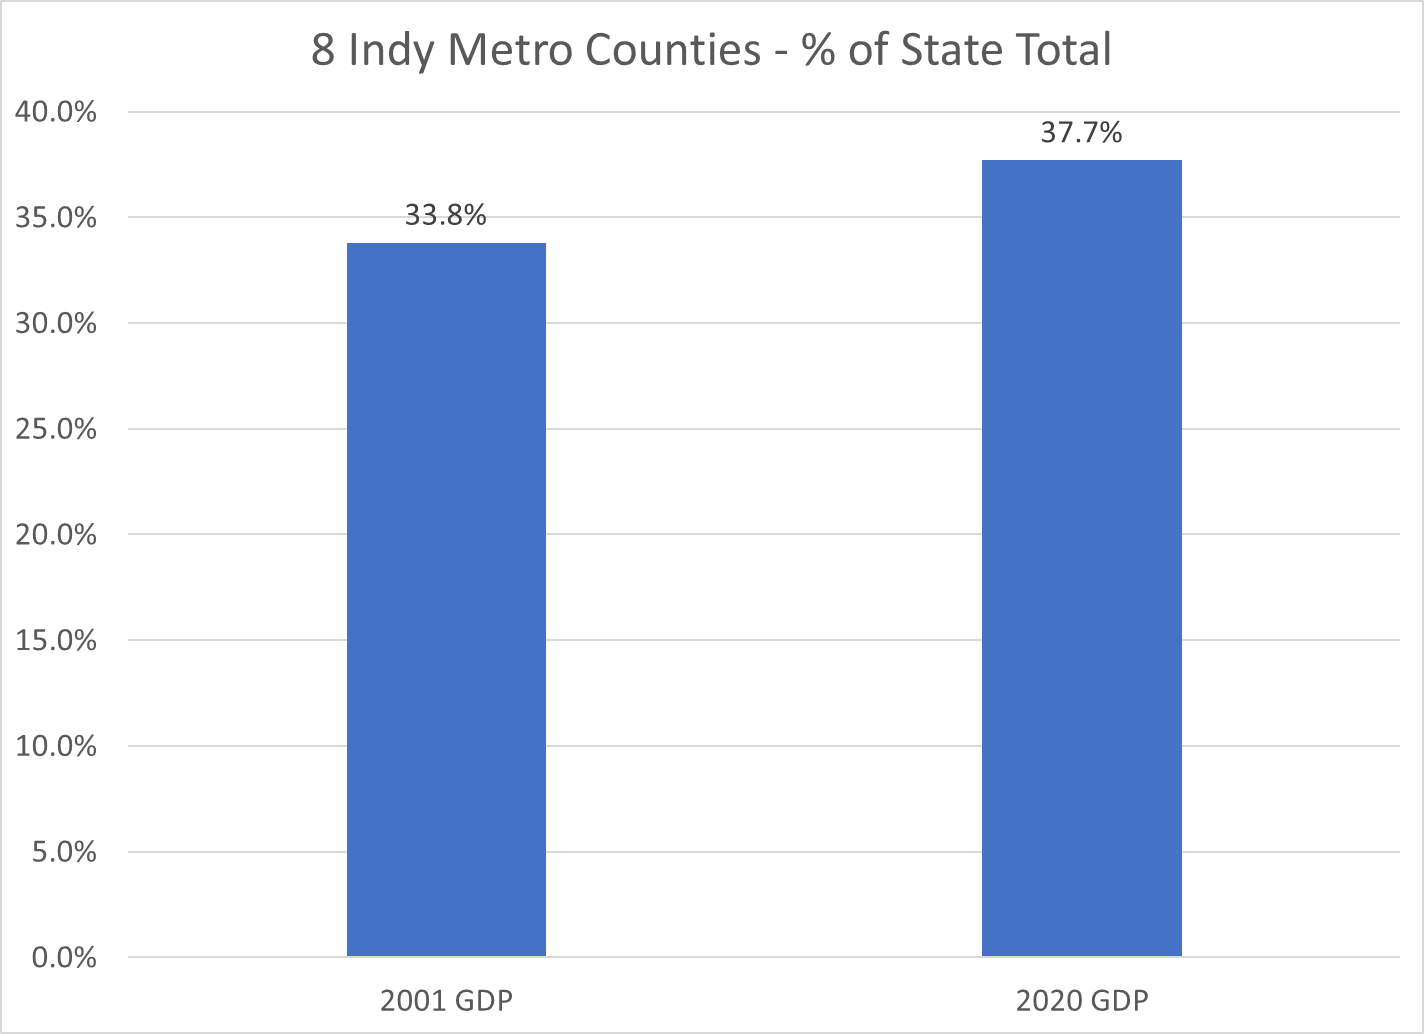
Gross Domestic Product, the value of goods and services produced in Metro Indy, was one-third of the state total in 2001, the first year of available statistics. This measure increased to 38% by 2020. Nearly 2 out of every 5 dollars of statewide value-added output was generated by the Indy Metro area in 2020.

Indiana is a mostly rural state with Indy, a dozen small cities, a cluster of northern Indiana manufacturing counties, Gary (Lake County), Ft. Wayne (Allen) and Evansville (Vanderburgh). The Indy Metro Region has 9 times the density of people, income and production as the most rural counties. For example, it takes the 67 lowest population counties to equal the 1.9 million people living in the Indy Metro area.

The Indianapolis Metro area grew by a respectable 72% during this period, above the national average of 63%. The other Indiana counties grew by only 19%, about one-fourth as fast.

The Indy Metro area added 900,000 people, the same growth as the rest of the state.

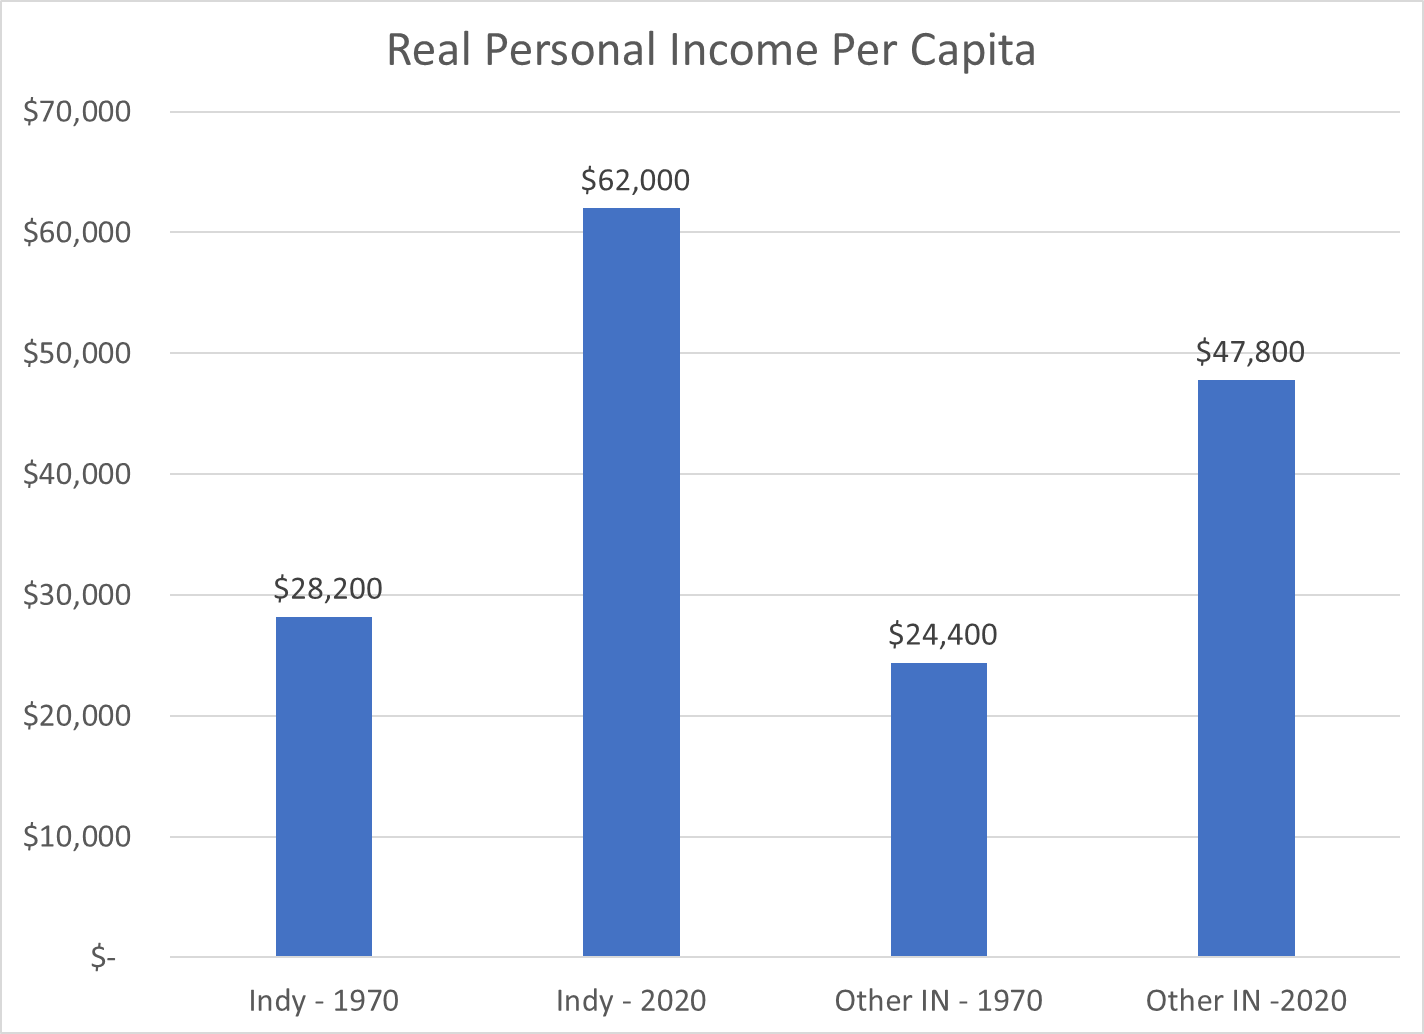
With population and per capita income gains, the Indy Metro area’s real personal income grew almost four-fold, while the rest of the state grew by roughly 150%.

Indy Metro per capita income was 15% above the rest of the state in 1970 and twice as high (30%) by 2020.

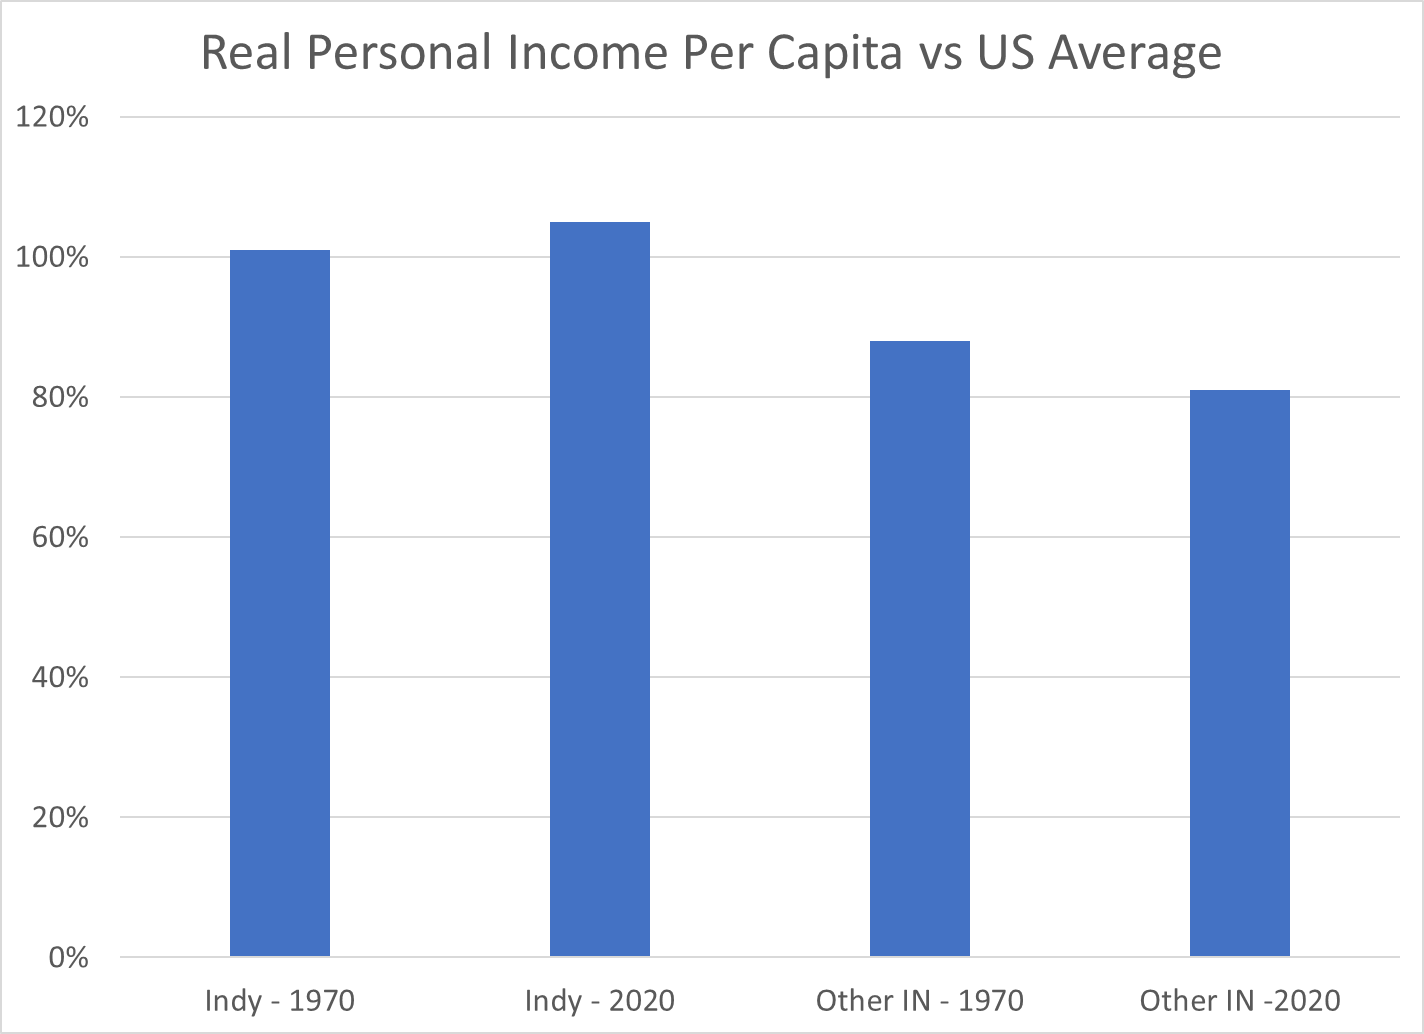
The Indy Metro area has improved its per capita income versus the US average by 4 points, from 101 to 105. The other-Indiana counties have declined from 88% to 81% of the national average.

While the per capita income in the Indy Metro area is 30% higher than the rest of the state, the value of goods and services produced (GDP) per person is more than 50% higher than the rest of the state.

These wide, and growing, disparities in economic results may lead to increasing tensions between the relatively prosperous center and the largely “left behind” periphery. Fortunately, the real personal income per capita in the “other” counties did increase by 95%, from 24 to 48K during these 5 decades, even though the Indy folk’s income grew by 120%, from 28 to 62K.

https://www.stats.indiana.edu/population/PopTotals/historic_counts_counties.asp

Good News: US Forests Are Growing

Forest Coverage is Up for a Century

Added 51M Sq Miles, 1987-2017: Size of North Carolina

Added 28M Sq Miles, 1990-2020: Size of South Carolina

Timberland Has Grown as Part of Total Forest

Healthy Stock by Volume, Diameter, Age, Carbon

https://usafacts.org/articles/how-us-forests-affect-the-environment-and-help-stabilize-the-climate/

https://crsreports.congress.gov/product/pdf/R/R46313

Annual Growth and Harvest are Sustainable

Ownership, Preservation, Management Plans

US in Global Context

Threats are Real, But Often Exaggerated

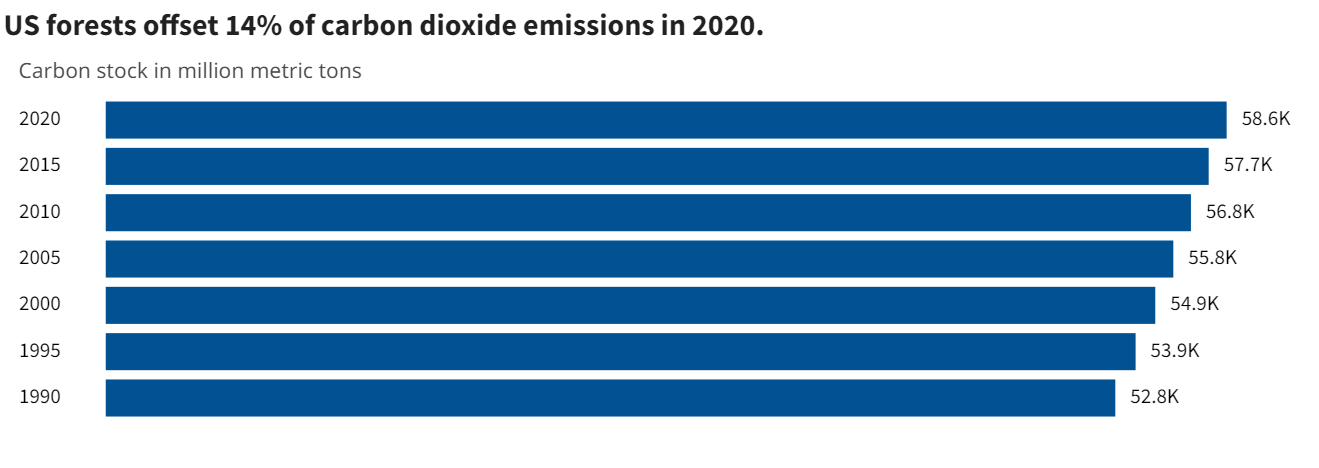
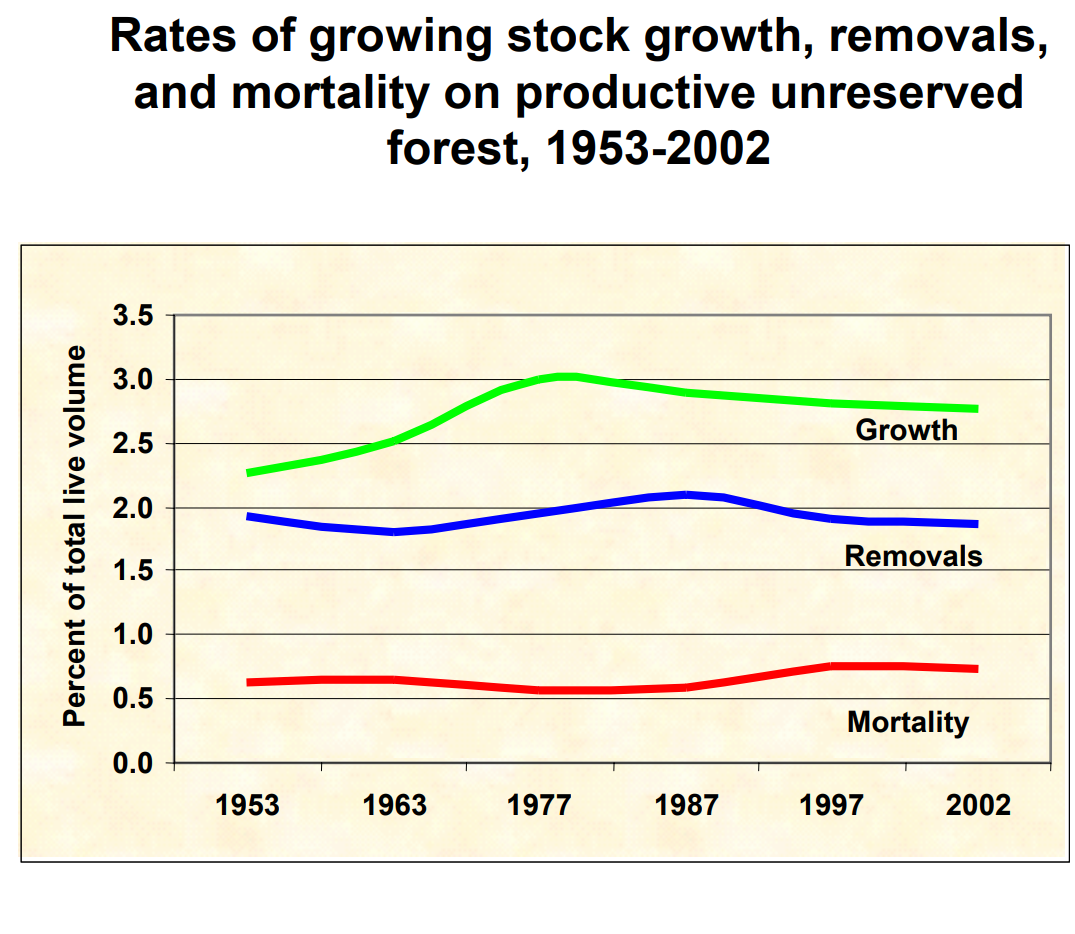
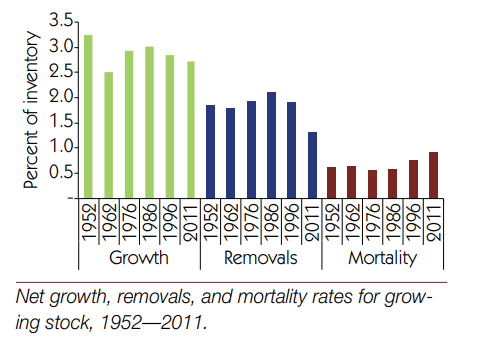
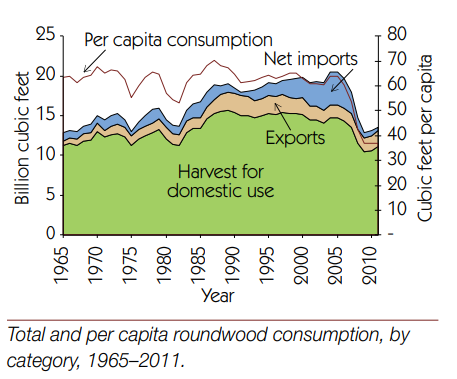
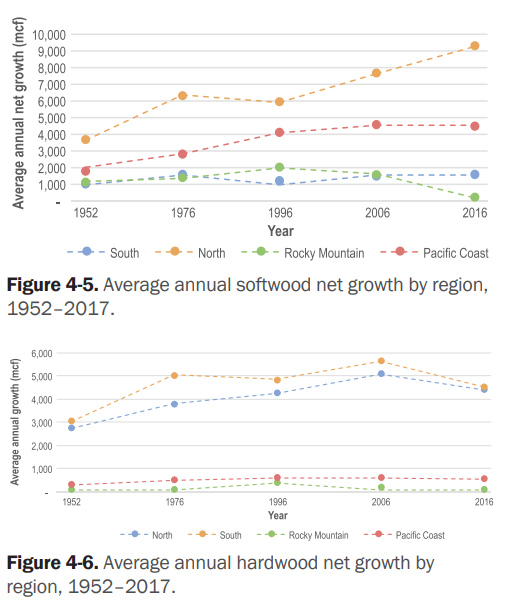
“Many challenges are associated with drought, wildfire, invasive species, and outbreaks of insects and disease—all made worse by climate change. Warming temperatures mean more energy in the atmosphere, which is consistent with severe weather events, such as floods, tornadoes, blizzards, ice storms, and hurricanes.” 

https://www.fs.usda.gov/speeches/state-forests-and-forestry-united-states-1

https://www.cnn.com/2019/07/20/health/iyw-cities-losing-36-million-trees-how-to-help-trnd/index.html

https://www.treehugger.com/more-trees-than-there-were-years-ago-its-true-4864115

https://usafacts.org/articles/how-us-forests-affect-the-environment-and-help-stabilize-the-climate/

https://ourworldindata.org/grapher/proportion-of-forest-area-with-long-term-management-plan?time=2020

Little Pink Houses …

I’ve lived in the Indy suburbs for 34 years, 80 miles away from Johnny Cougar Mellencamp’s hometown of Seymour, IN. These songs were published in 1983 and 1985, VERY early warning signs of the rapidly growing gap between rural and urban America.

Let’s take a look at 2020 per capita income levels for the 92 counties in Indiana.

Indiana per capita income was $51,900, now just 87% of the US average of $59,500.

In 1970, Indiana per capita income was indistinguishable from the national average: $3,020 versus $3,119 (nominal/current dollars). Indiana was the 18th highest rated state, leveraging its manufacturing prowess, highly productive agriculture, central logistics location, proximity to Chicago and ports on the Great Lakes and the Ohio River.

In 2020, just 5 Indiana counties had per capita incomes above the US average. 87 had lower levels. In just 2 generations, nearly the whole state had moved from a proud “average American” level to well below average.

In 2020, only 11 of Indiana’s 92 counties earned 90% of the national average. Just 41 of 92 Indiana counties earned even 80% of the national average.

The distribution of per capita income levels within Indiana expanded. In 2020, just 13 of 92 counties were “above average” compared with the Indiana average, which was already 13% below the national average.

Indianapolis suburban counties Hamilton and Boone averaged $80,000 of per capita income in 2020, far above the US and Indiana averages. No other Indiana counties averaged as much as 80% of this level. Just 4 others reached 70% of this aspirational level: $56,300. Only 11 of 92 counties earned two-thirds of the wealthy suburban level at $53,600. 39 of 92 Indiana counties had per capita incomes above 60% of the suburban winners.

Income distribution matters within counties and across counties. The increasing disparity in incomes is driving American politics.

https://www.bea.gov/data/income-saving/personal-income-county-metro-and-other-areas

Good News: God is NOT Dead In the US

Nietzsche Declared It In 1882: 7 Generations Ago

https://philosophybreak.com/articles/god-is-dead-nietzsche-famous-statement-explained/

Time Magazine Taunted 1966: 3 Generations Ago

80-90% Believe in God or a “Higher Power”

https://www.pewtrusts.org/en/trust/archive/fall-2018/when-you-say-you-believe-in-god-what-do-you-mean

56% believe in God as described in the Bible. Another 23% have a less literal belief in God. Of the 20% who answer “no”, fully one-half believe in some kind of higher power or spiritual force. Only 10%, in 2017, fully rejected any supreme being/force/concept.

Time Says 90% Believe in God

https://time.com/4283975/god-belief-religion-americans/

Gallup Poll Reinforces 80-90% Belief

https://news.gallup.com/poll/268205/americans-believe-god.aspx

US Belief In God Is Twice as High as In Europe

56% in US believe in Biblical God versus 27% in Europe.

https://www.pewtrusts.org/en/trust/archive/fall-2018/when-you-say-you-believe-in-god-what-do-you-mean

U.S. adults are more religious than Western Europeans

Belief in God Forecast to Grow Globally

The Future of World Religions: Population Growth Projections, 2010-2050

However: Non-Religion Affiliated Folks Grew

https://www.christianitytoday.com/news/2019/march/evangelical-nones-mainline-us-general-social-survey-gss.html

From 7% to 22% by this measure!

PRRI summarizes their data and Pew data to assert that the unaffiliated population grew from 16% to 25% but has recently fallen back to 23%.

Other analysts conclude that the “nones” account for up to 30% of the population.

https://www.deseret.com/faith/2022/4/14/23022509/god-is-not-dead-religion-data-politics-faith-in-america

https://www.nbcnews.com/think/opinion/2010s-spelled-end-white-christian-america-ncna1106936

This survey shows the “unaffiliated” category increases from 20% to 26%.

Fewer Young Adults Belong to Churches

Religious Believers Maintain Same Activities

https://www.deseret.com/faith/2022/4/14/23022509/god-is-not-dead-religion-data-politics-faith-in-america

Mainstream Protestants Fell, Bottomed, Recovered

https://www.christianitytoday.com/news/2019/march/evangelical-nones-mainline-us-general-social-survey-gss.html

From 28% to 12%, or from 18% to 13%.

Evangelicals Grew, Then Declined

https://www.christianitytoday.com/news/2019/march/evangelical-nones-mainline-us-general-social-survey-gss.html

About Three-in-Ten U.S. Adults Are Now Religiously Unaffiliated

Based on a “born again” definition, evangelicals have declined by 6%.

https://www.cnn.com/2021/07/10/opinions/american-evangelicals-protestantism-butler-bass/index.html

Evangelicals Increasingly Overlap With Republican Party Identification

https://www.christianitytoday.com/news/2019/march/evangelical-nones-mainline-us-general-social-survey-gss.html

https://www.sltrib.com/opinion/commentary/2021/10/27/ryan-burge-why/

Summary

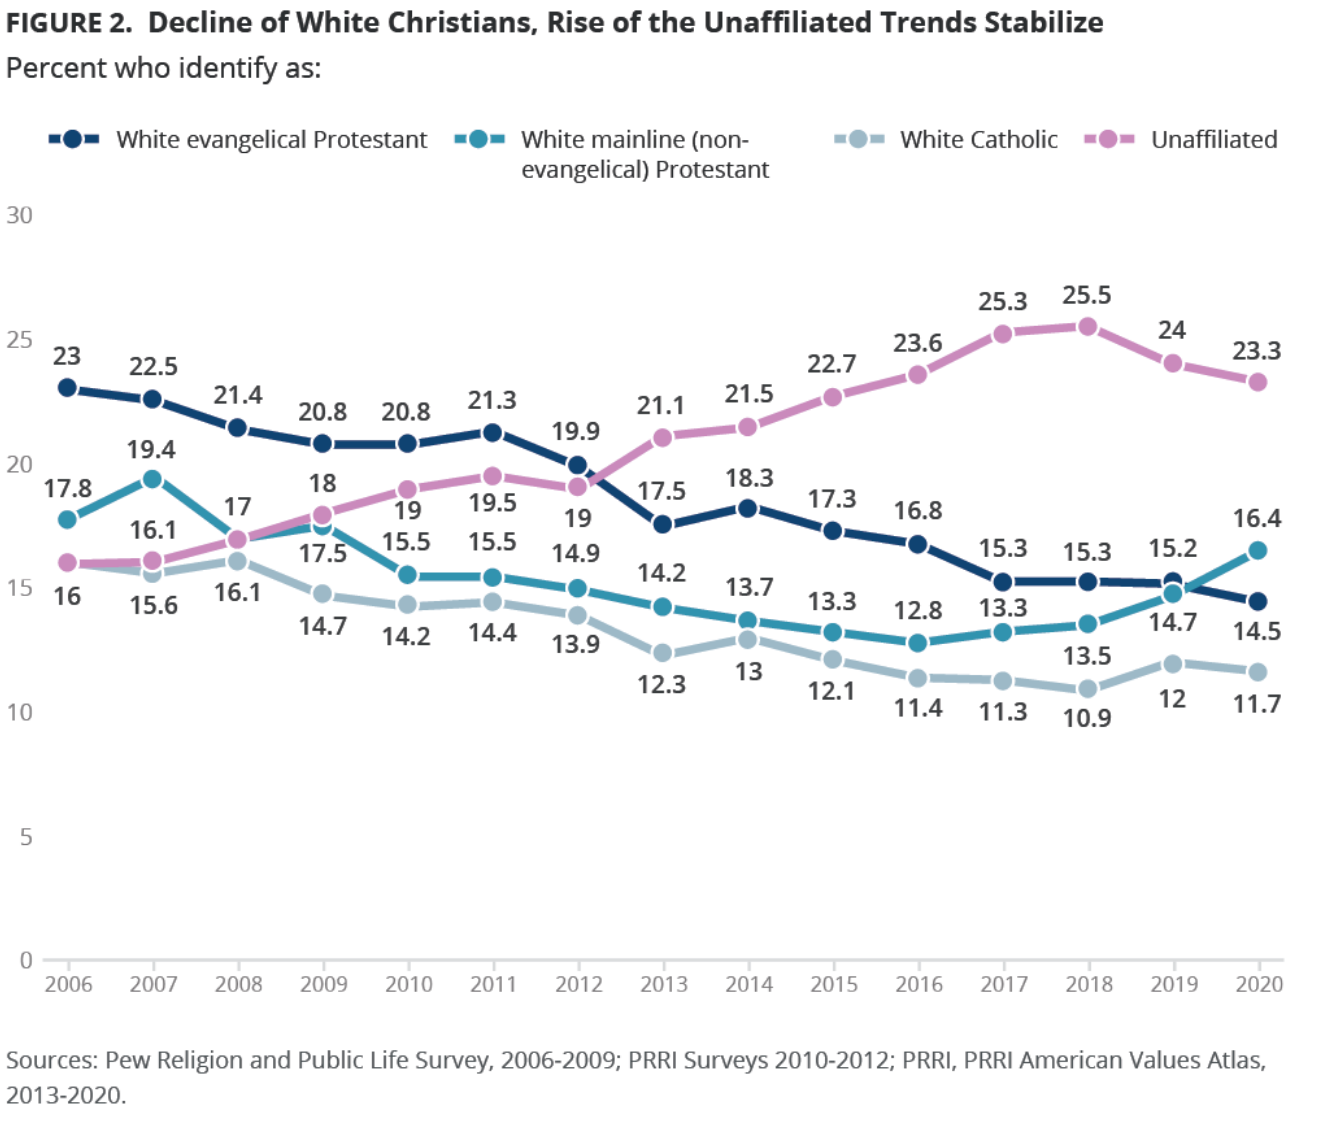
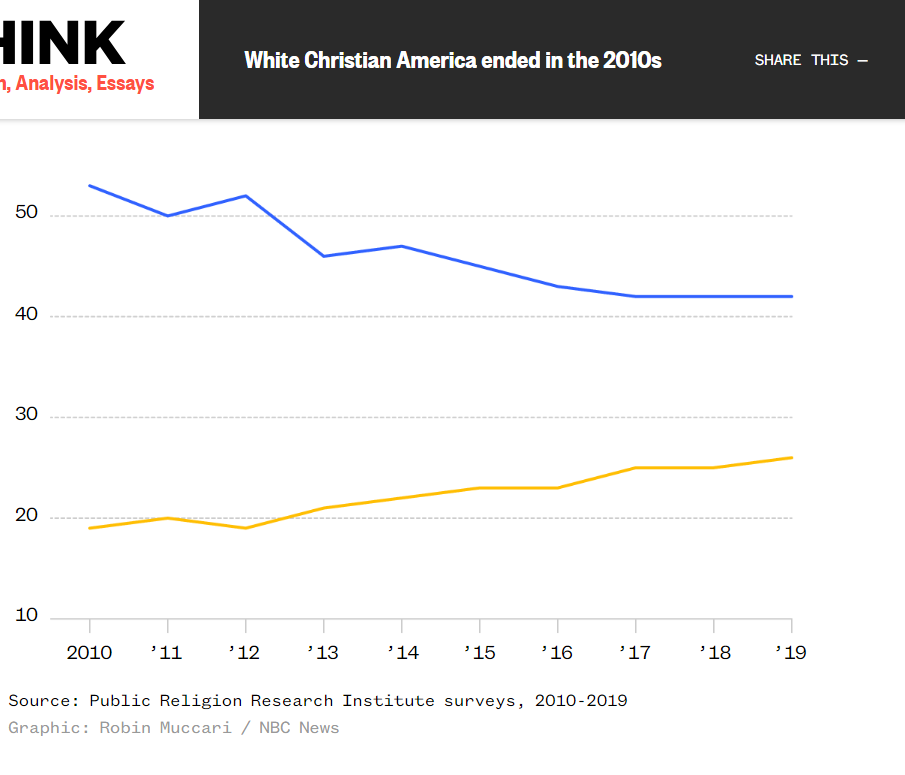
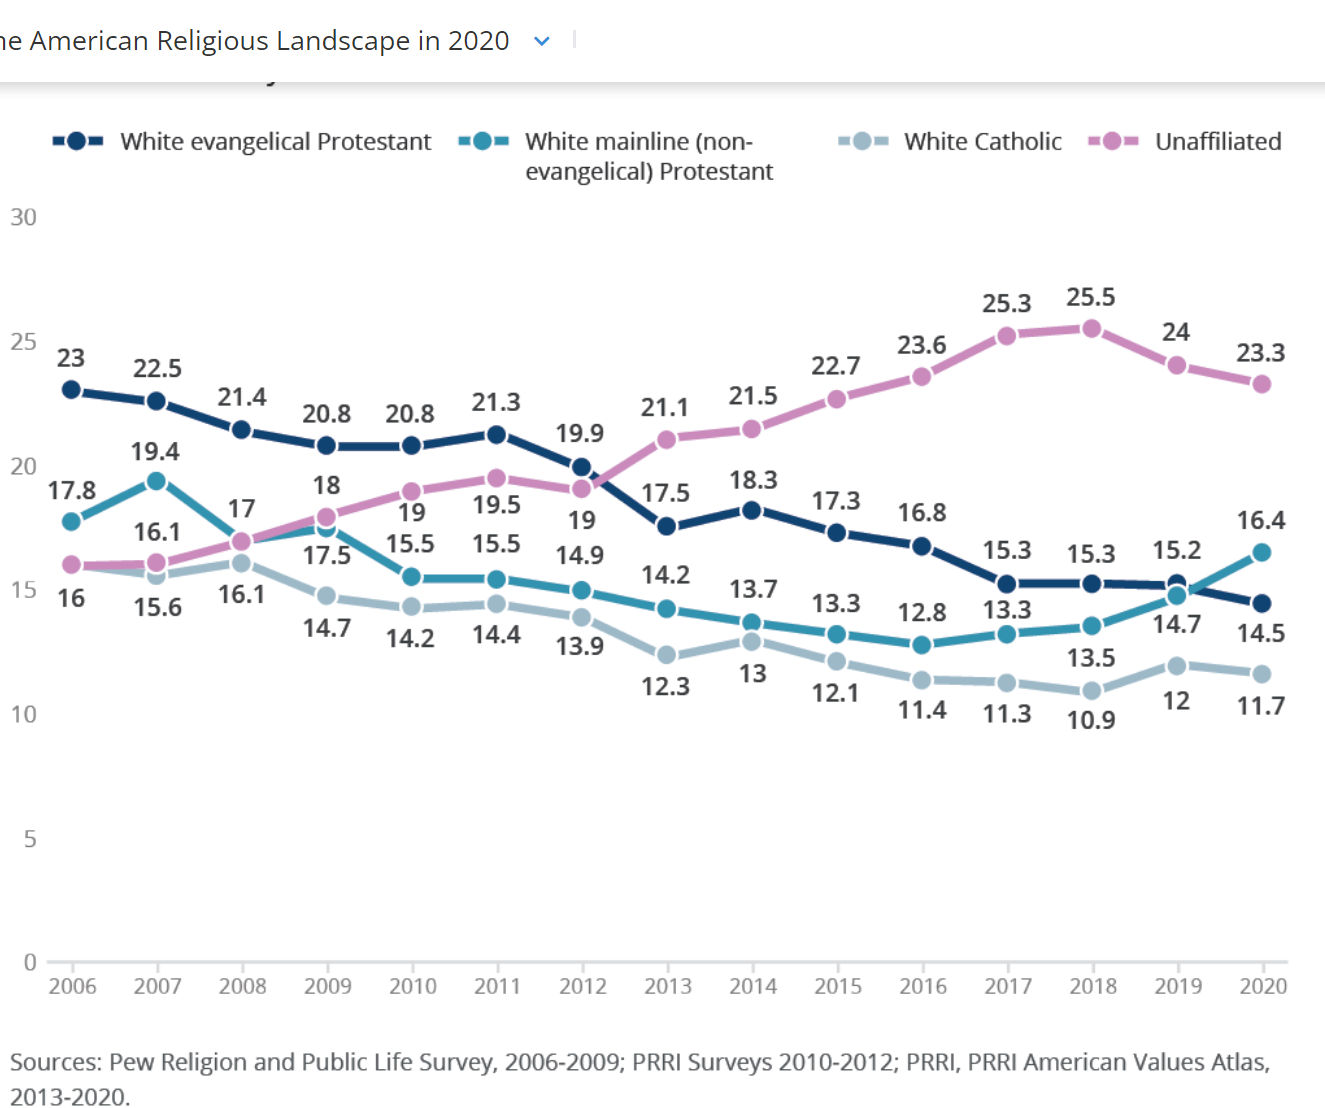
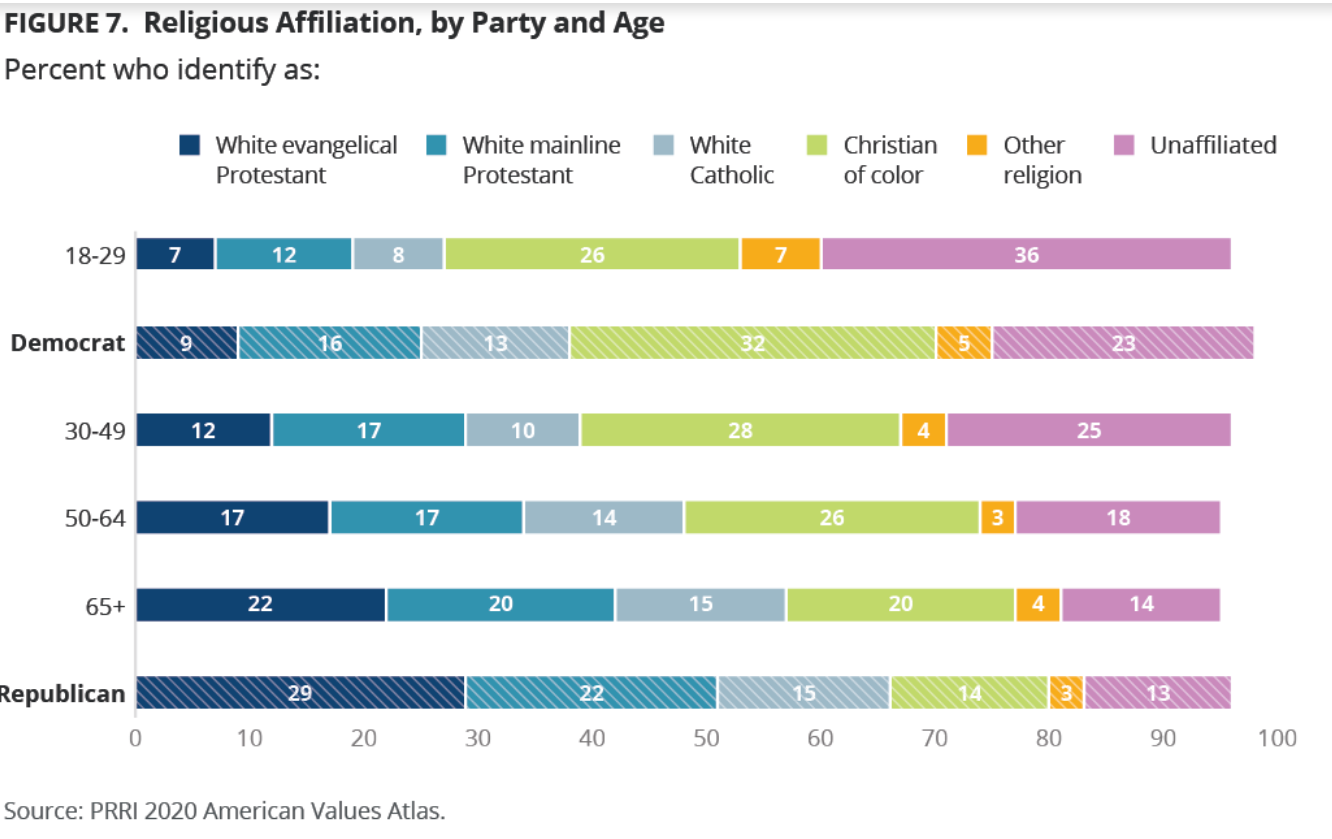
US citizens belief in God remains strong, between 80-90%. Church affiliation has declined to 70%. Mainline (liberal-centrist) Protestant believers have declined dramatically, but recently stabilized. Evangelical Protestant believers increased in the 1980’s and 1990’s, but have declined somewhat since then. Catholic membership has remained roughly constant, with Hispanics replacing Whites.

The decline in Whites as a percentage of the US population, combined with the increase in non/other believers has lead to headlines proclaiming the end of a majority White Christian America. This is true statistically, with politicians attempting to take advantage of the situation.

https://www.nbcnews.com/think/opinion/2010s-spelled-end-white-christian-america-ncna1106936

Good News: US Foreign Aid

US Spends 1% of Federal Budget on Aid, Not 25%

Aid is 1% of Budget, Down from 1.6% in 1980

Aid is 1% of Budget, Down from 1.4% in 2006

https://crsreports.congress.gov/product/pdf/R/R40213

Real $ Spending Increase Driven by Terrorism Threats with Bipartisan Support

https://crsreports.congress.gov/product/pdf/R/R40213

US Leads in Dollar Spending, Trails in $/Person

US Accounts for 23% of Global Aid

US 0.2% of GDP is Very Low for Developed Nation

https://crsreports.congress.gov/product/pdf/R/R40213

Where Does the Money Go?

41% to economic development and commercial interests

35% to military aid and national security

20% for humanitarian purposes

The congressional report splits up the $48B as

Peace/security 16B

Health, Ed $9B

Humanitarian $9B

Economic Growth $4B

Governance $3B

https://crsreports.congress.gov/product/pdf/R/R40213

Where Does the Money Go?

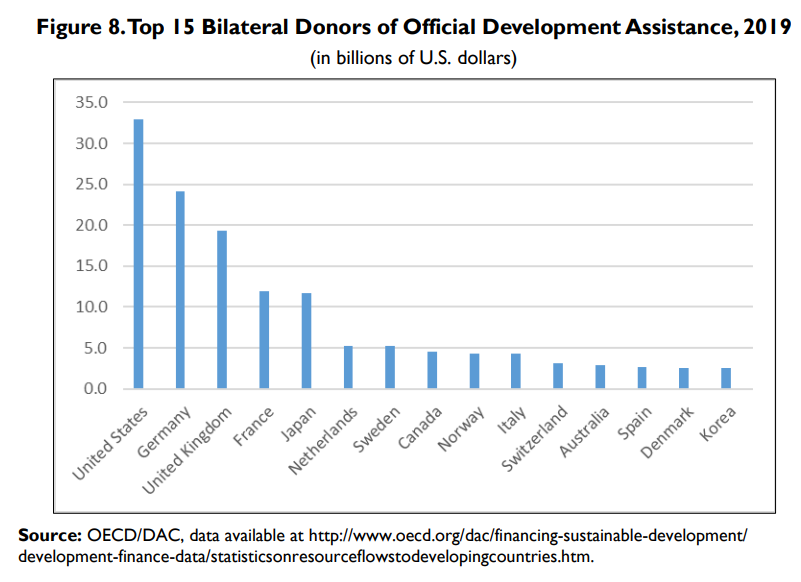
Africa 25%. Middle East 25%. Afghanistan $5B, Israel $3B, Jordan $2B, Egypt, Iraq, Ethiopia, Yemen, Colombia, Nigeria, Lebanon $1B each. Top 10 $16B, one-third of total.

Criticisms of Foreign Aid

Limited evidence that specific country investments provide political returns

Limited evidence of anti-terrorism campaign effectiveness (counterexamples)

Weak administrative structure and oversight at all levels

Direct evidence of individual country economic growth due to aid is limited

Some autocratic governments have benefitted from aid

Some aid is diverted to corrupt governments and individuals

Specific high priority countries have provided weak returns (Egypt, Pakistan, Afghanistan, Iraq)

Higher returns could be gained from investing in Western Hemisphere, Eastern Europe.

https://www.cfr.org/backgrounder/how-does-us-spend-its-foreign-aid

https://www.npr.org/sections/goatsandsoda/2018/09/18/649155725/why-the-u-s-ranks-at-the-bottom-in-a-foreign-aid-index

Benefits

Health measures, disease rates, lifespans. Global health. Economic development results globally and in individual countries. US trade benefits from developing trade lanes. Global education. Increased number of democracies, commitment to mixed capitalist economies. Lower cost of defense. Terrorism activities thwarted. Improved strength of US alliances. Improved flow through NGOs, multilateral organizations improves effectiveness. Dollar allocation provides US policy leverage.

https://www.cfr.org/backgrounder/how-does-us-spend-its-foreign-aid

https://www.concernusa.org/story/foreign-aid-myths-facts/

https://www.pbs.org/newshour/world/column-addressing-myths-surrounding-u-s-foreign-aid