The US economy continues its evolution from agriculture to manufacturing to services to information. President Trump was responsible for the US economy from February, 2017 through January, 2020. President Biden assumed responsibility in February, 2020. In order to compare the two presidents, let’s look at Trump for the 3 years of sustained growth deep in the business cycle before the pandemic. For Biden, let’s look at a comparable 3-year period from June 2021 through June 2024, after the post-Covid rebound. Trump benefitted from an 8-year long business cycle expansion. Biden had to deal with a once in a century pandemic driven economic depression.
Inflation: Advantage Trump
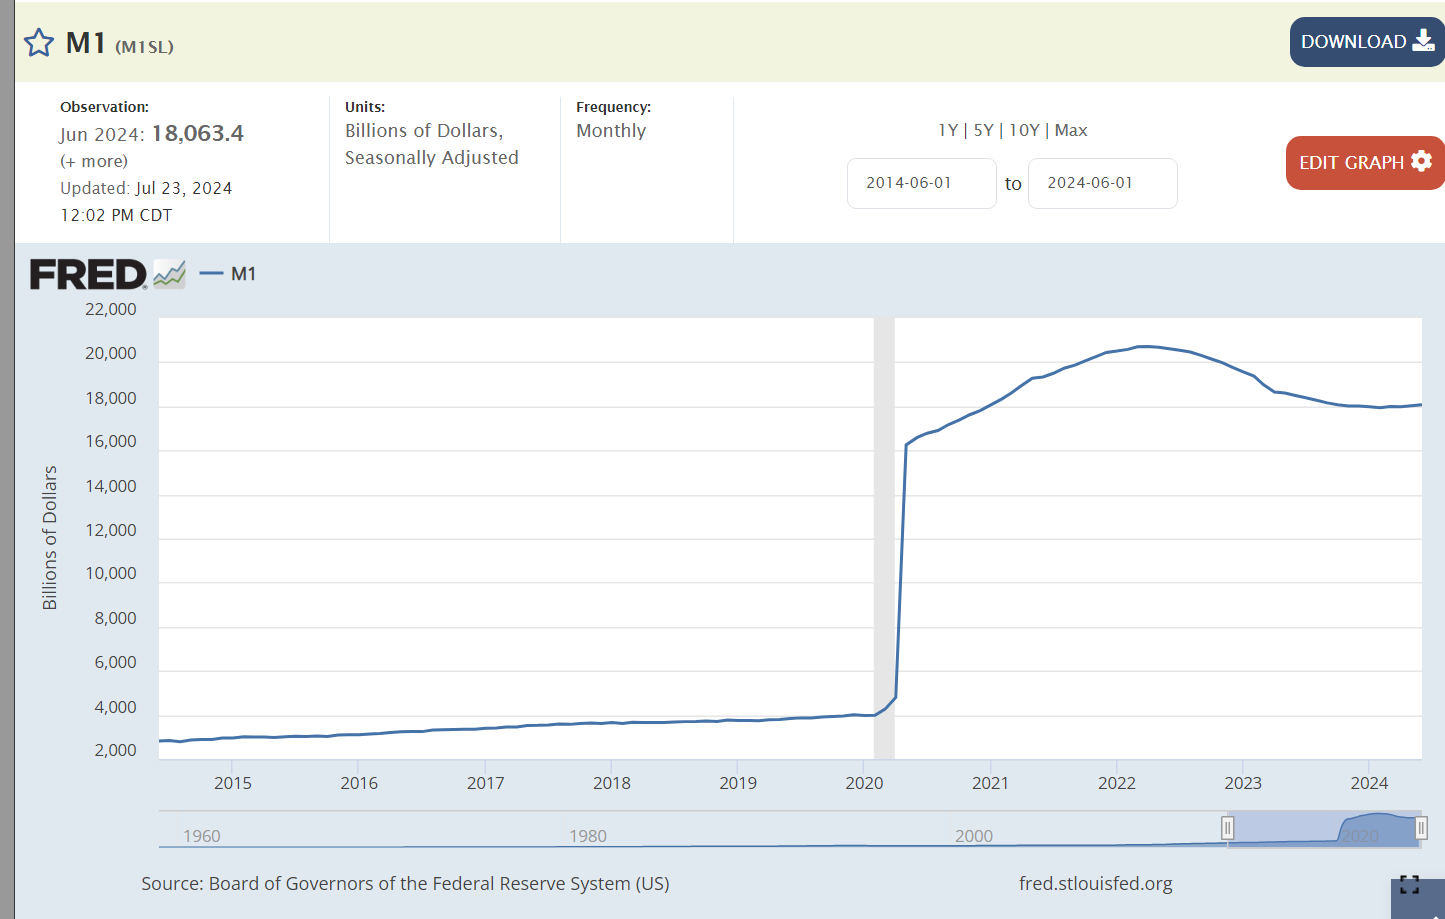
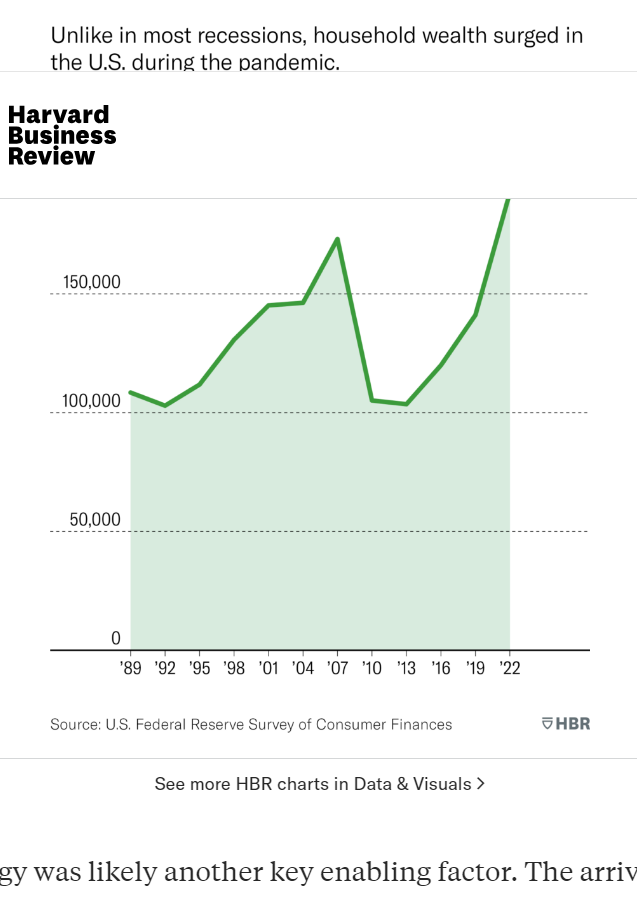
The independent Federal Reserve Board responded to the pandemic by greatly increasing the money supply to ensure that profitable, well-run financial institutions would be able to survive the temporary disruptions in the real economy. The Fed increased the money supply by 4-5 times its prior level to ensure the economy did not collapse! The extra money supply had to end up somewhere. It drove up consumer prices and increased asset values in the stock market and for home prices.
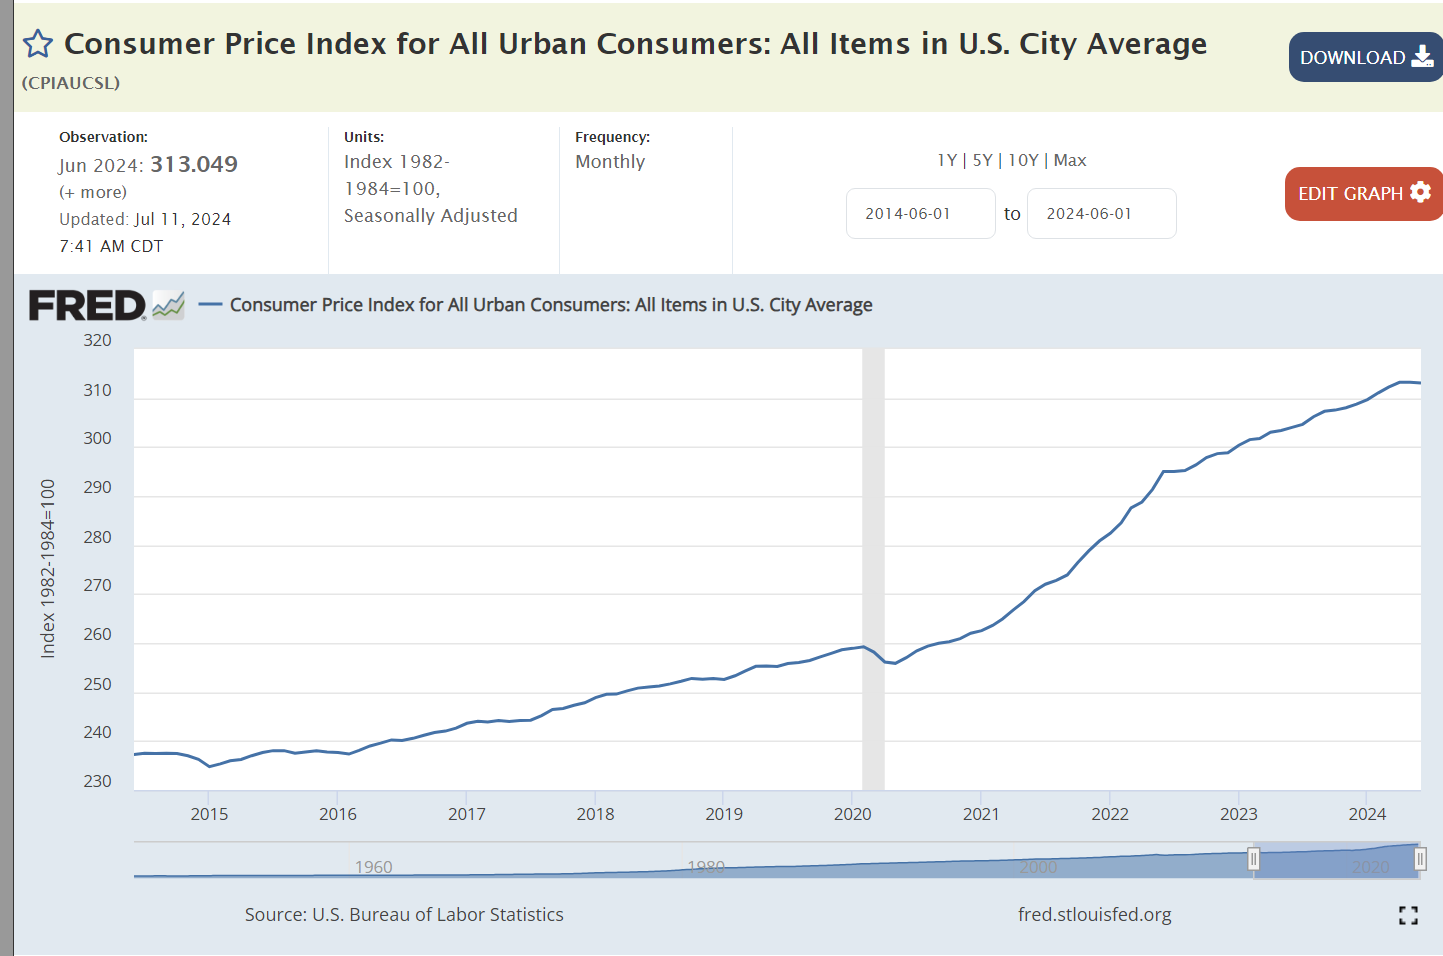
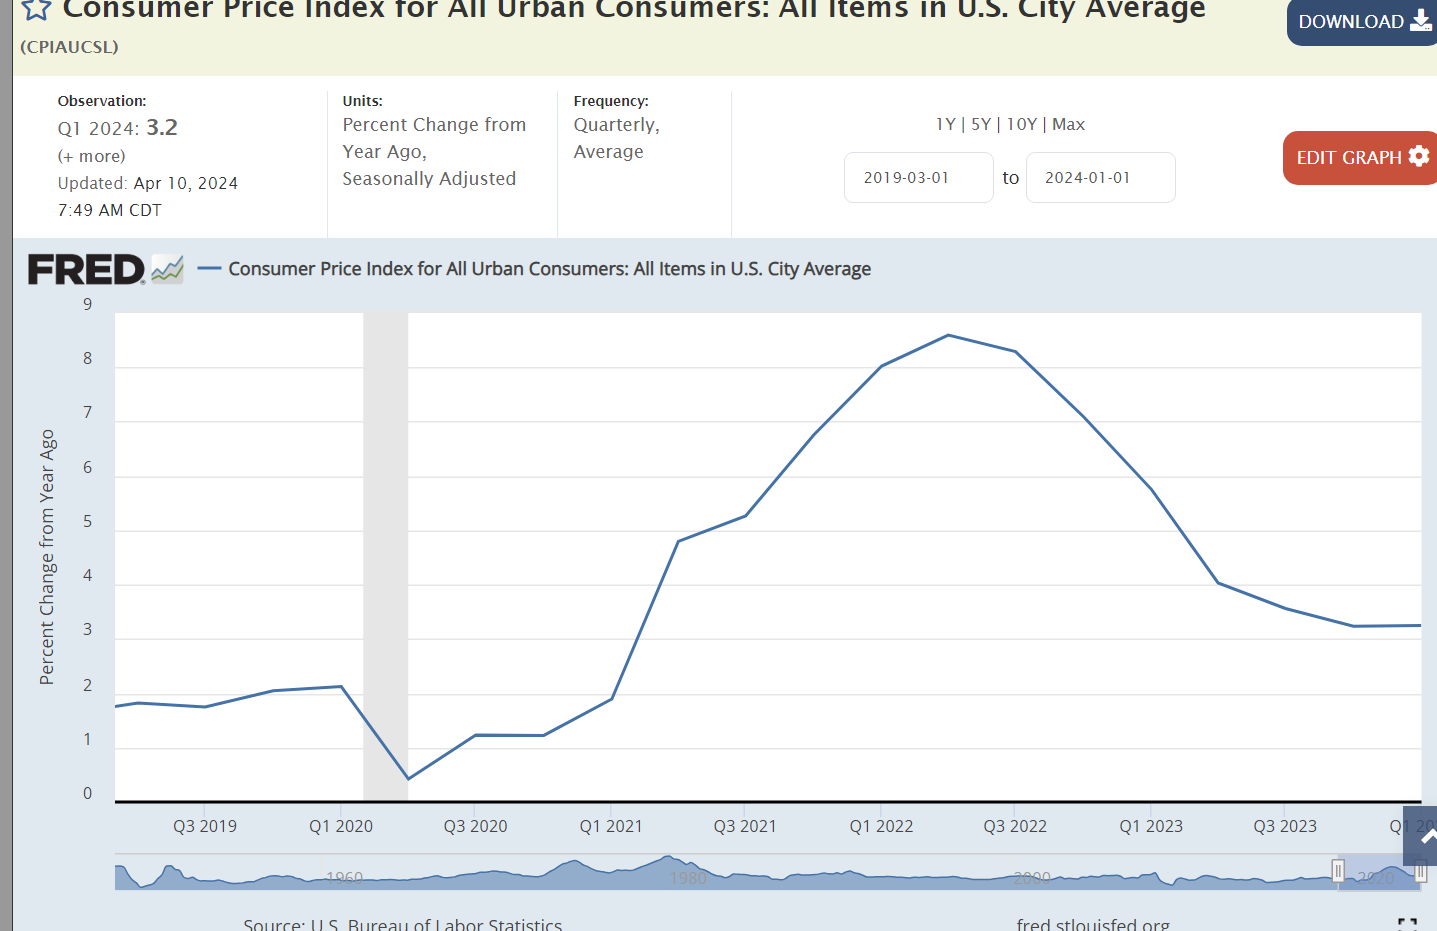
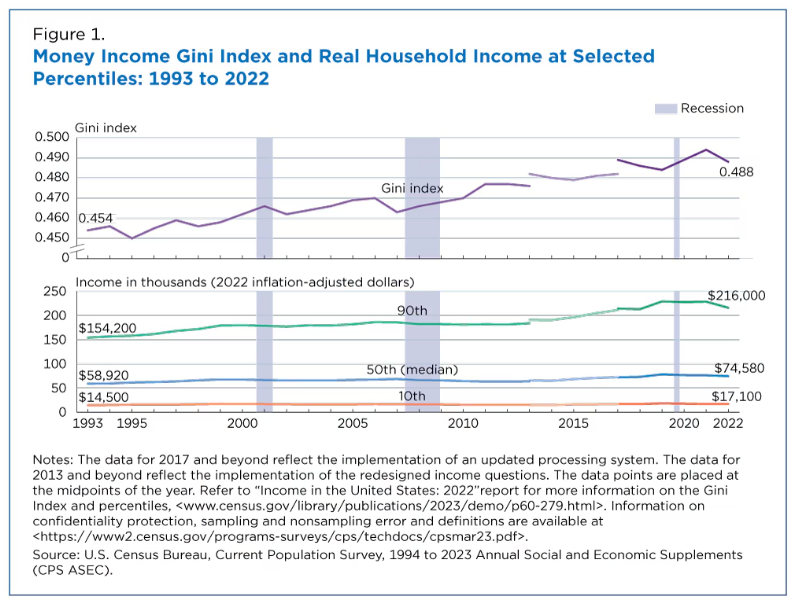
Inflation grew by 2% per year with Trump. It grew by 5% per year, on average, with Biden. Overall prices are 9% higher with Biden. Trump’s economic policies extended the Obama recovery for 3 years without triggering an increase in inflation, despite a low unemployment labor market.
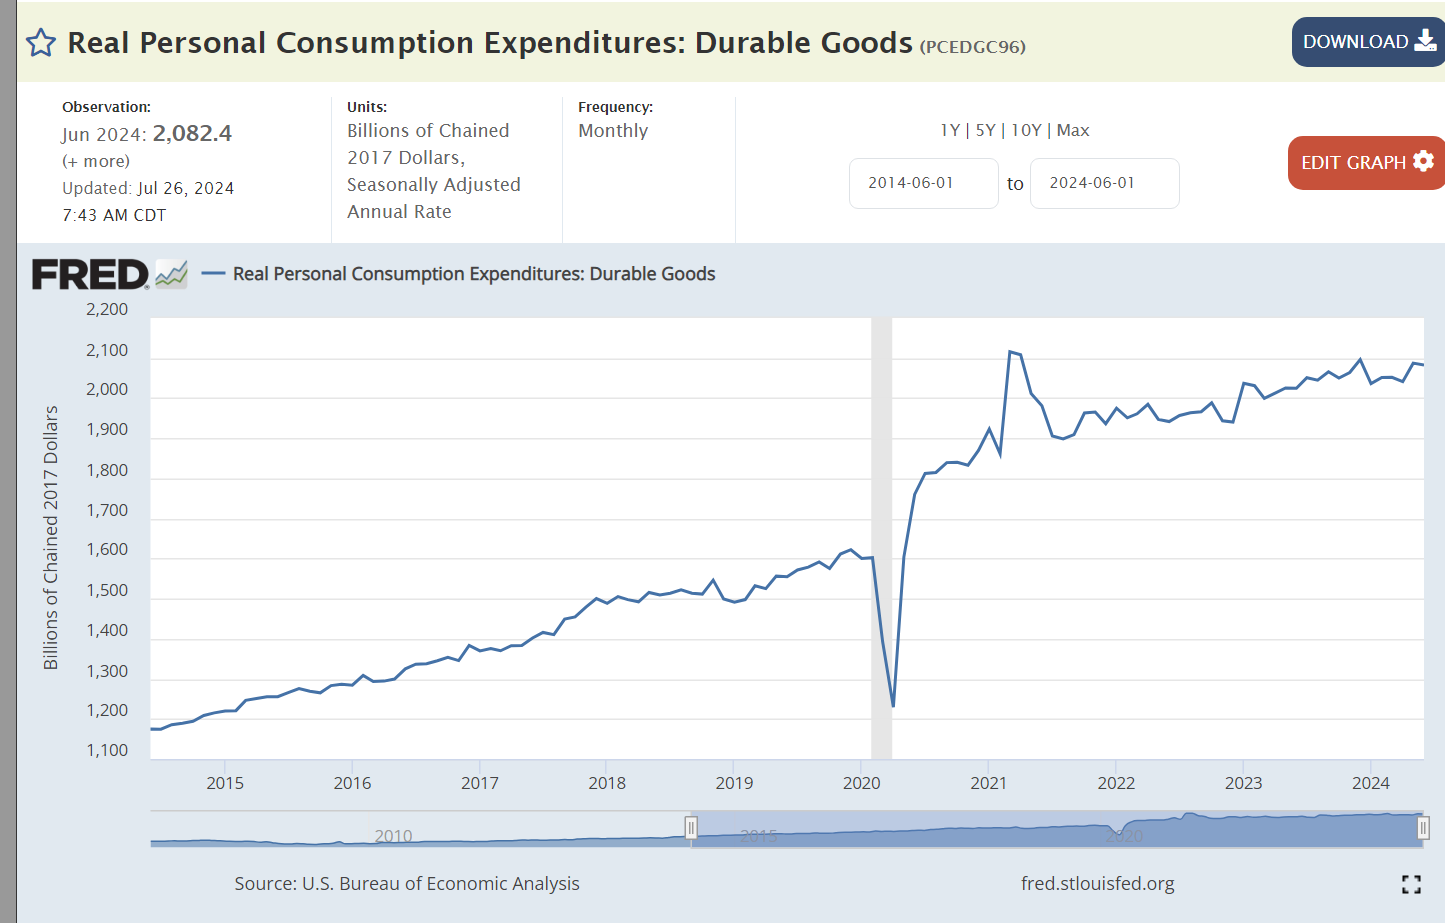
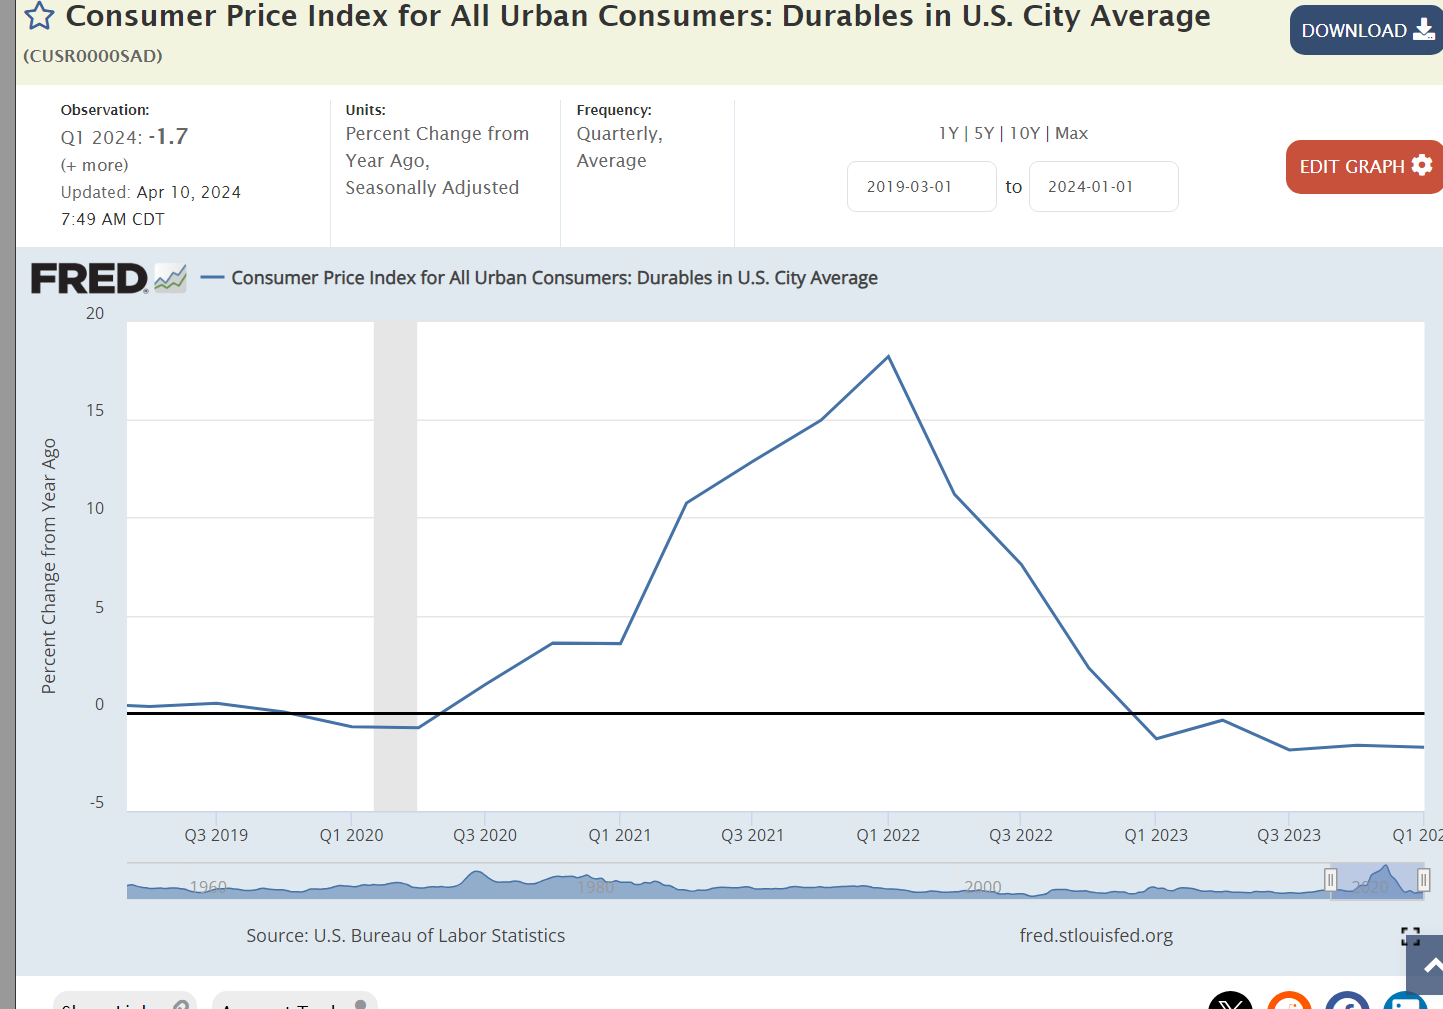
The largest cause of higher than usual inflation in Biden’s term was the 20% spike in US and global demand for durable goods. Factories shut down during the pandemic. Demand rebounded within 6 months as consumers chose to spend money on goods rather than in-person services. Consumer demand at the end of the Biden period is 50% higher than at the start of Trump’s term in office.
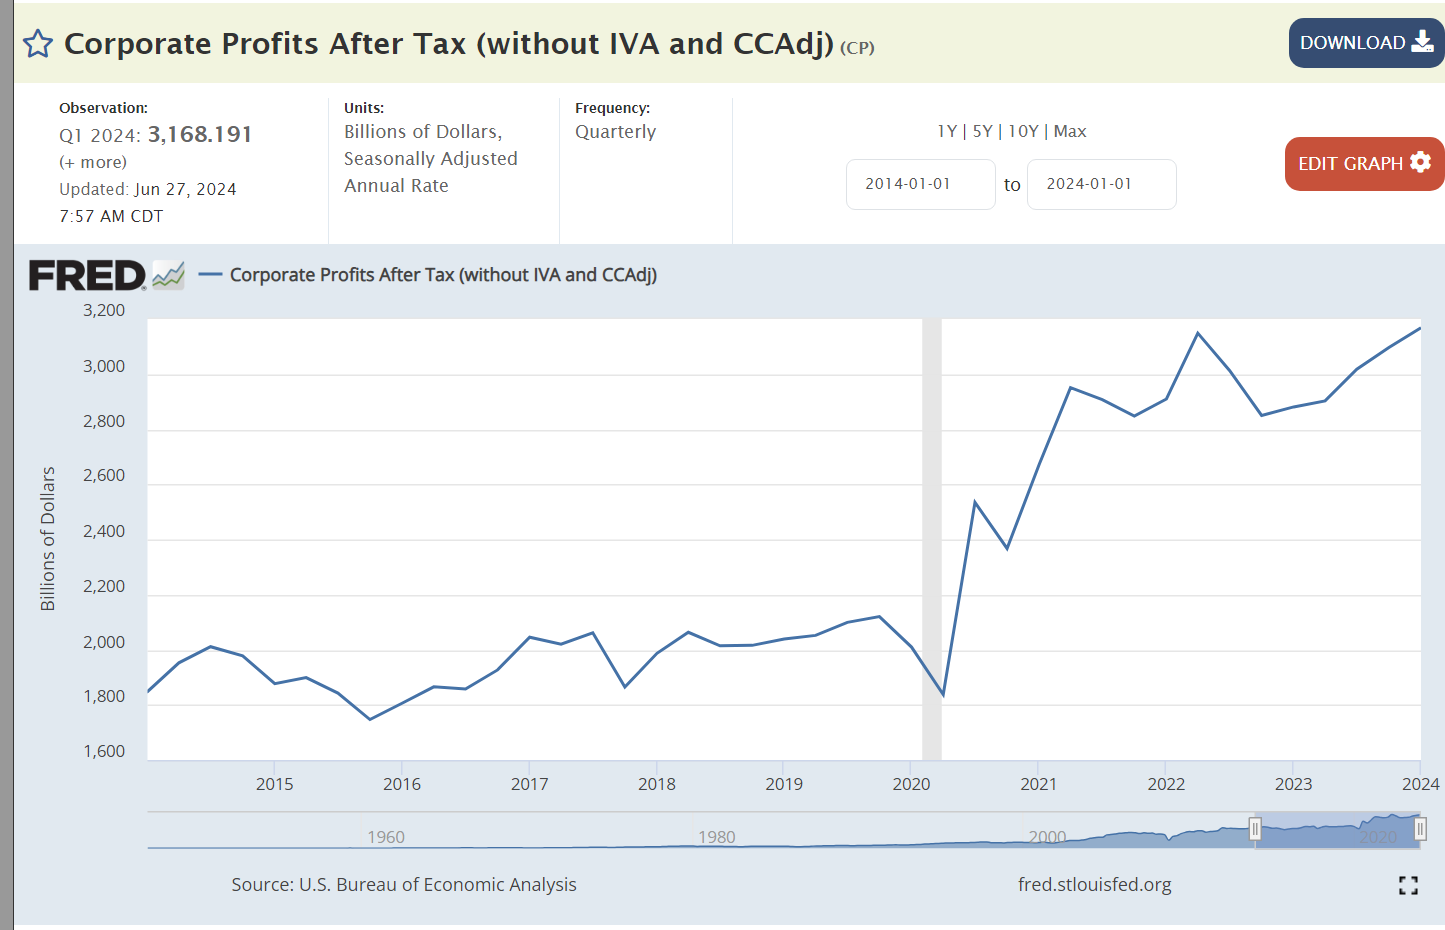
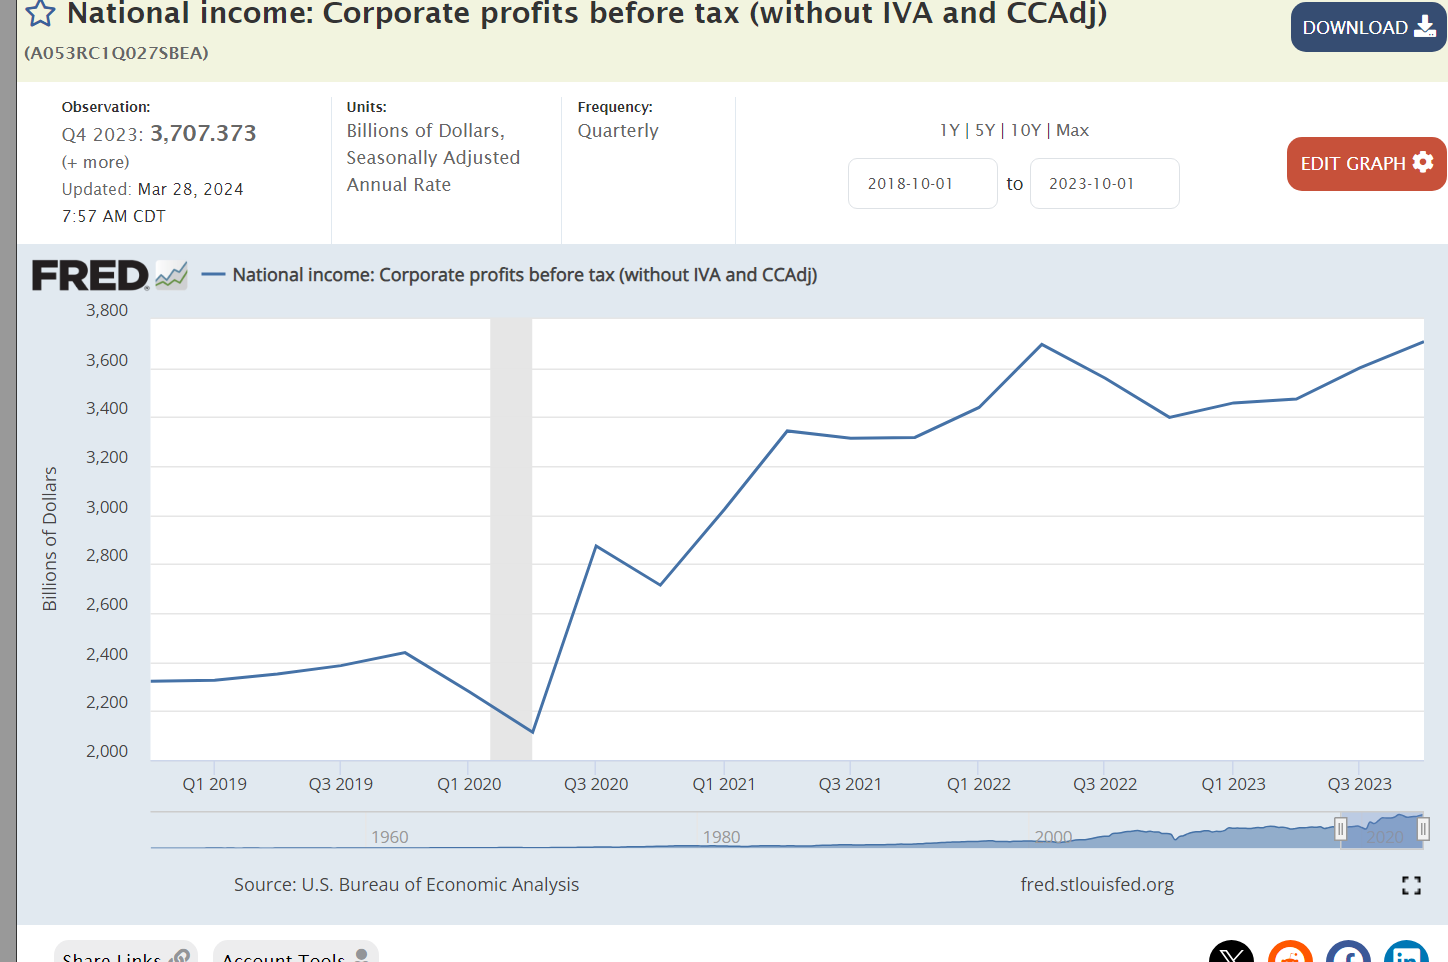
Corporations were able to capture and maintain a 50% profit increases due to market disruptions of the pandemic. Experts mostly reject Biden’s claims that corporate profits were the main driver of inflation, but they clearly aggravated the impact of the supply chain disruptions.
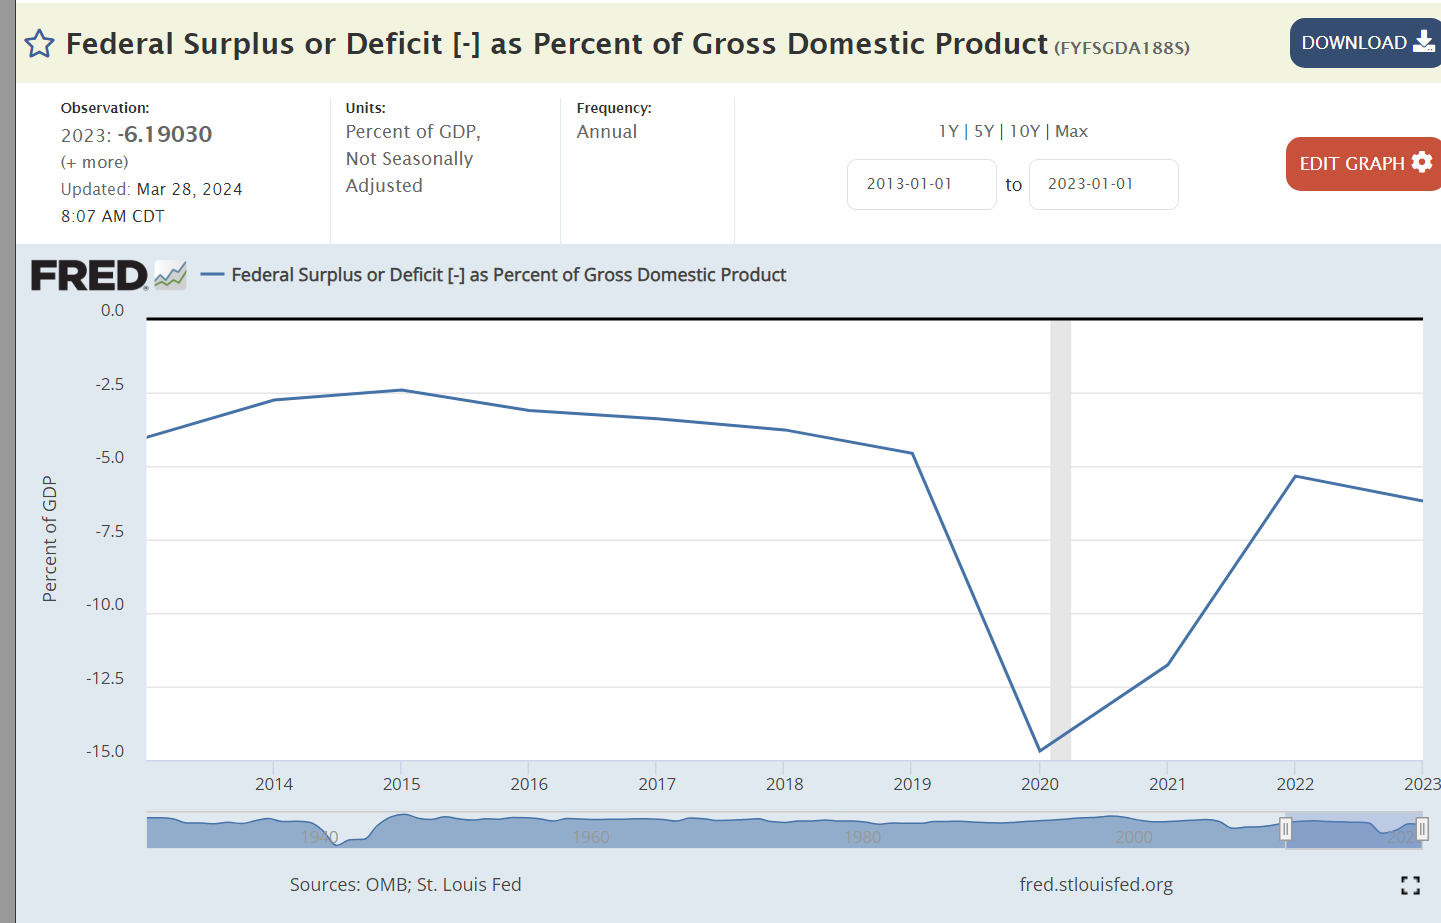
Obama was able to reduce federal budget deficits by two-thirds by the end of his presidency. Deficits doubled on Trump’s watch before the pandemic arrived. Biden cut deficits from their record highs during the pandemic, but they have been 50% higher than the pre-pandemic Trump era. Most economists consider the budget deficits to be the main cause of the continued higher than typical rates of inflation, accounting for 3%, 2% and 1% extra inflation in the 3-year Biden time we’re considering.
High profile gas prices remined flat during Trump’s period. Global supply and demand caused prices to increase from $2.50 per gallon to $3.50/gallon where they have remained for the last 3 years.
Trump enjoyed historically low 4% mortgage interest rates, a thin 2% above the inflation rate. The expansion of the money supply drive rates down to 3% during 2020 and 2021. They rose to 7% as inflation rose sharply and has stayed there. Inflation has fallen but markets typically require years of data to reset expectations of long-term inflation which drive mortgage rates. The Federal Reserve Bank has hesitated to cut its benchmark interest rates until inflation is clearly approaching its 2% target.
Labor Market: Advantage Biden
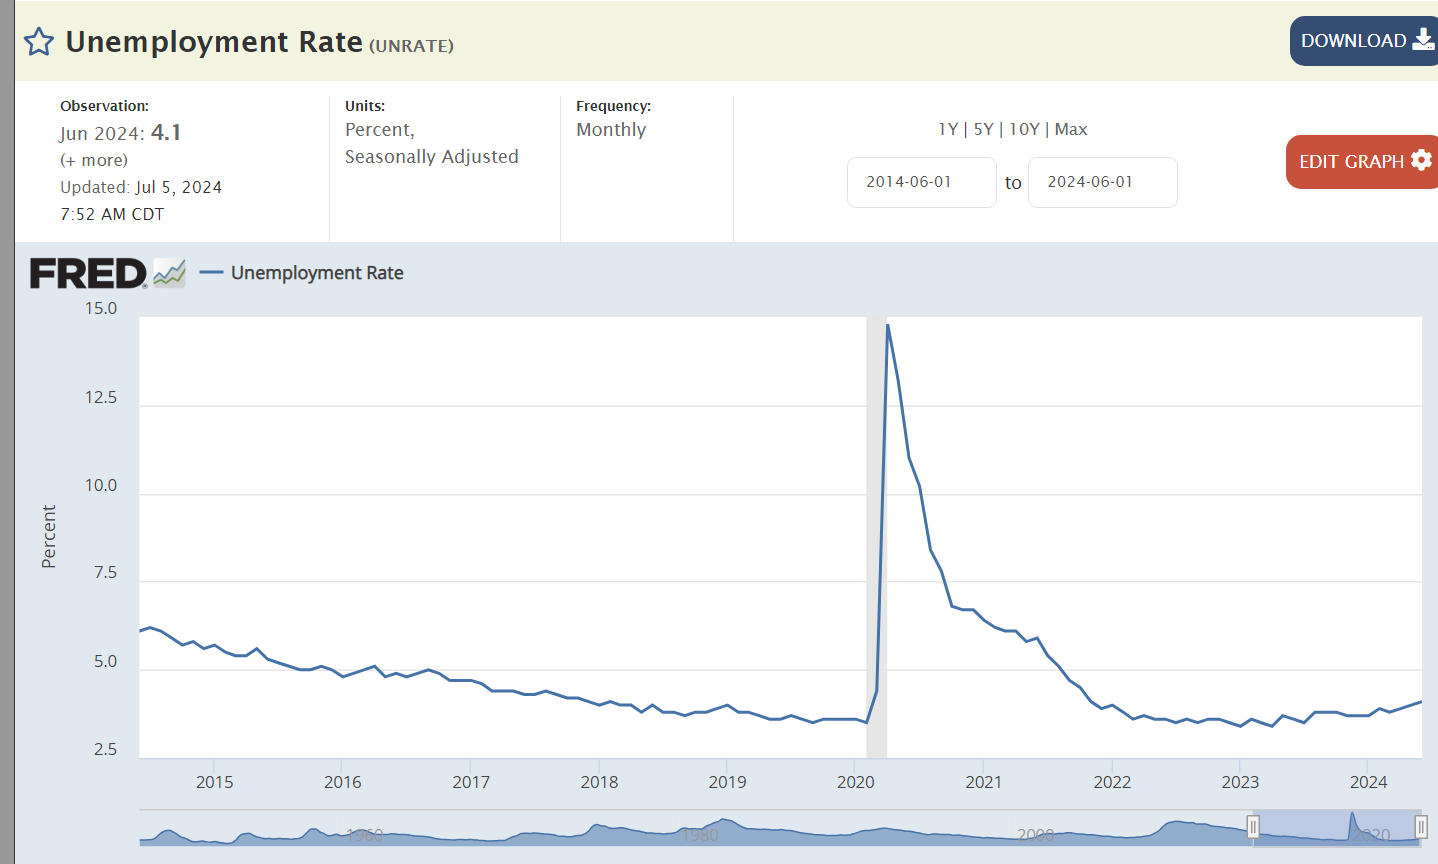
Trump reduced unemployment by 1%. Biden reduced it by 2%. Both presided over best in 50 years overall labor markets.
Layoffs have remained at historic lows, with Biden enjoying slightly lower rates.
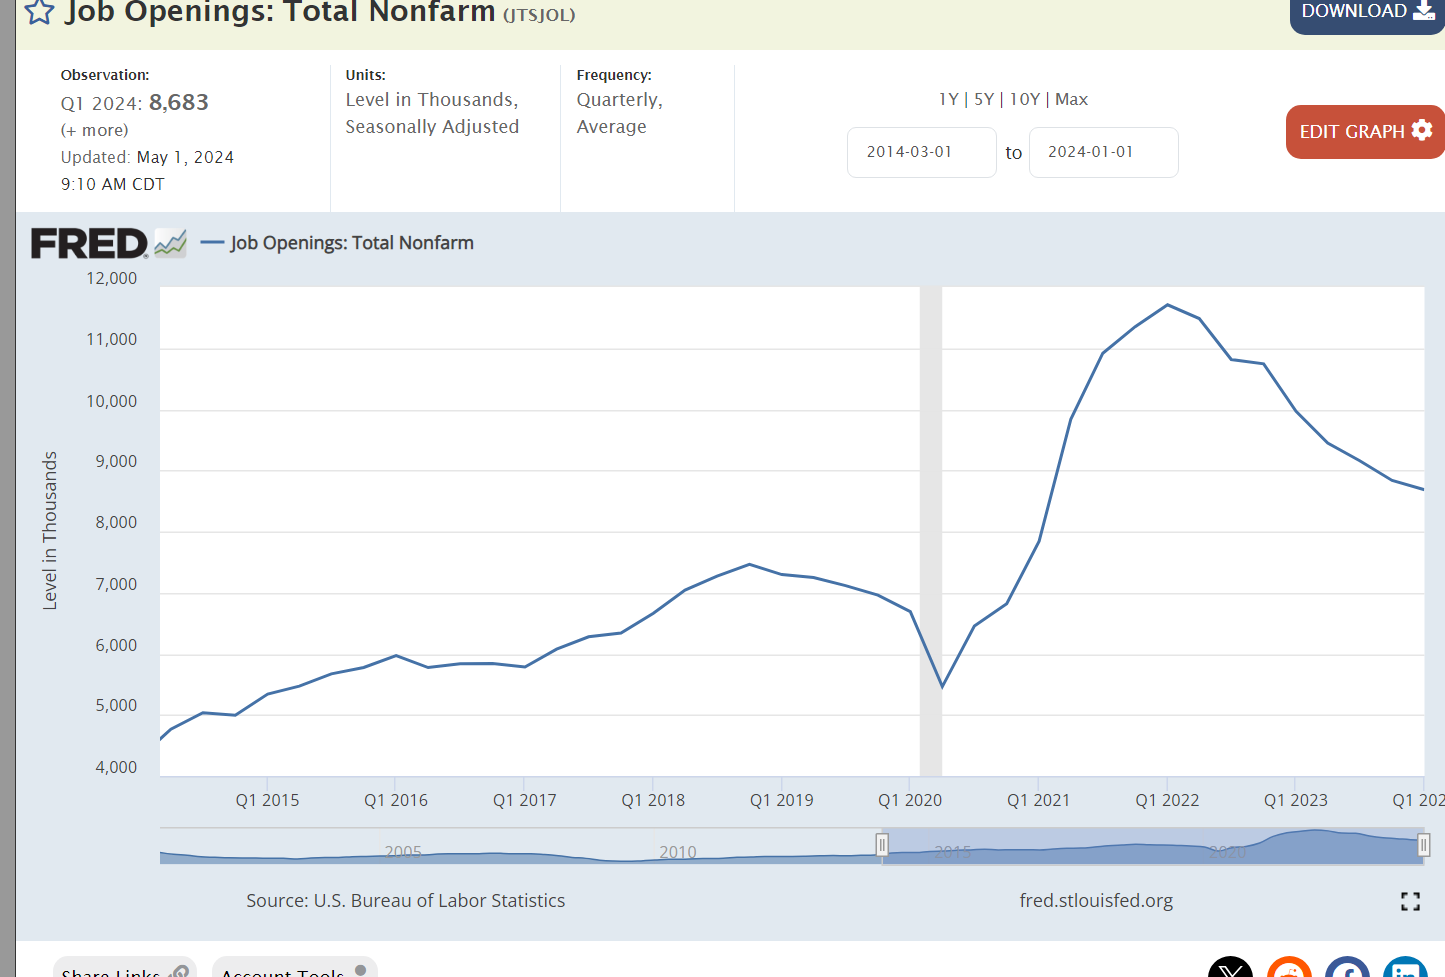
Job openings in the Biden market have been 50% higher than the Trump market, reflecting a strong economy with growing labor demand, despite the impact of the pandemic.
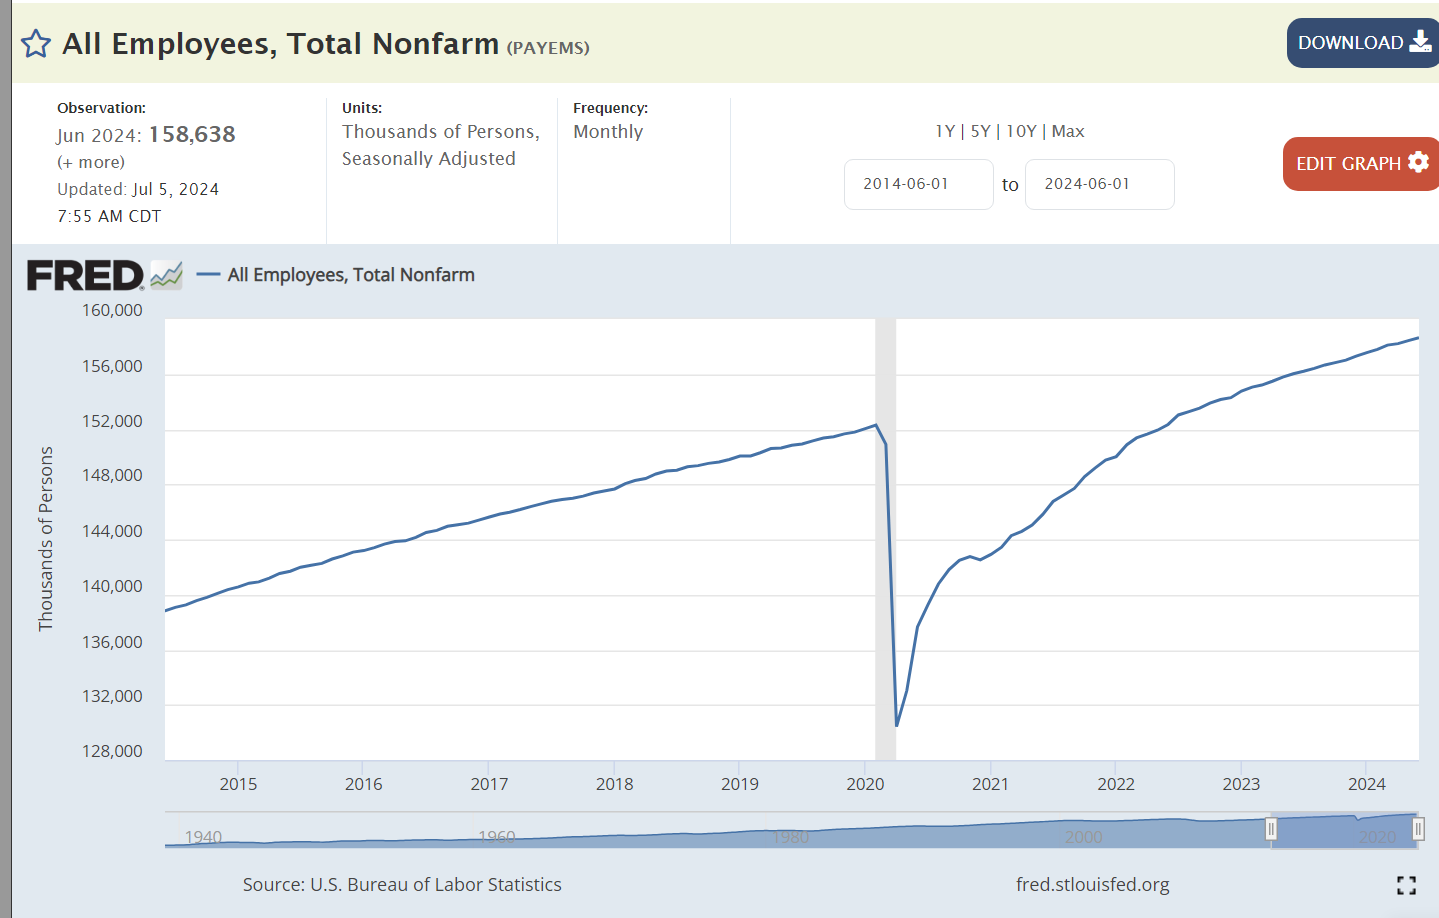
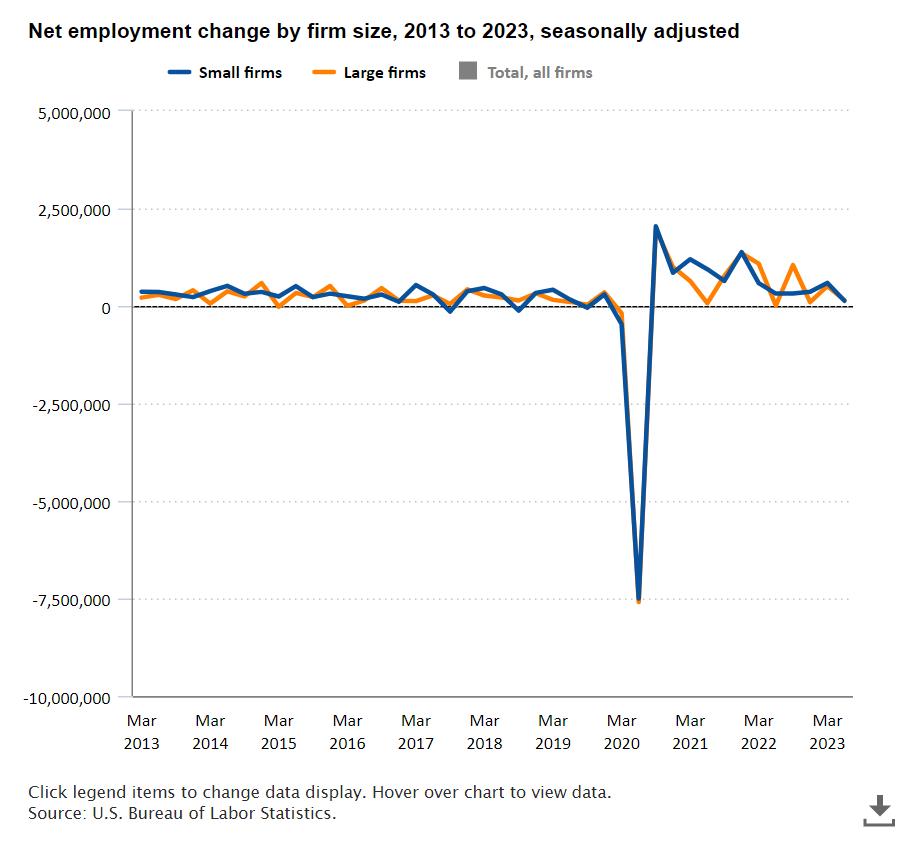
The Biden economy recovered all 20 million jobs lost in the pandemic within 2 years, much faster than expected. Total employment has continued to grow at the trend rate to a record 159 million.
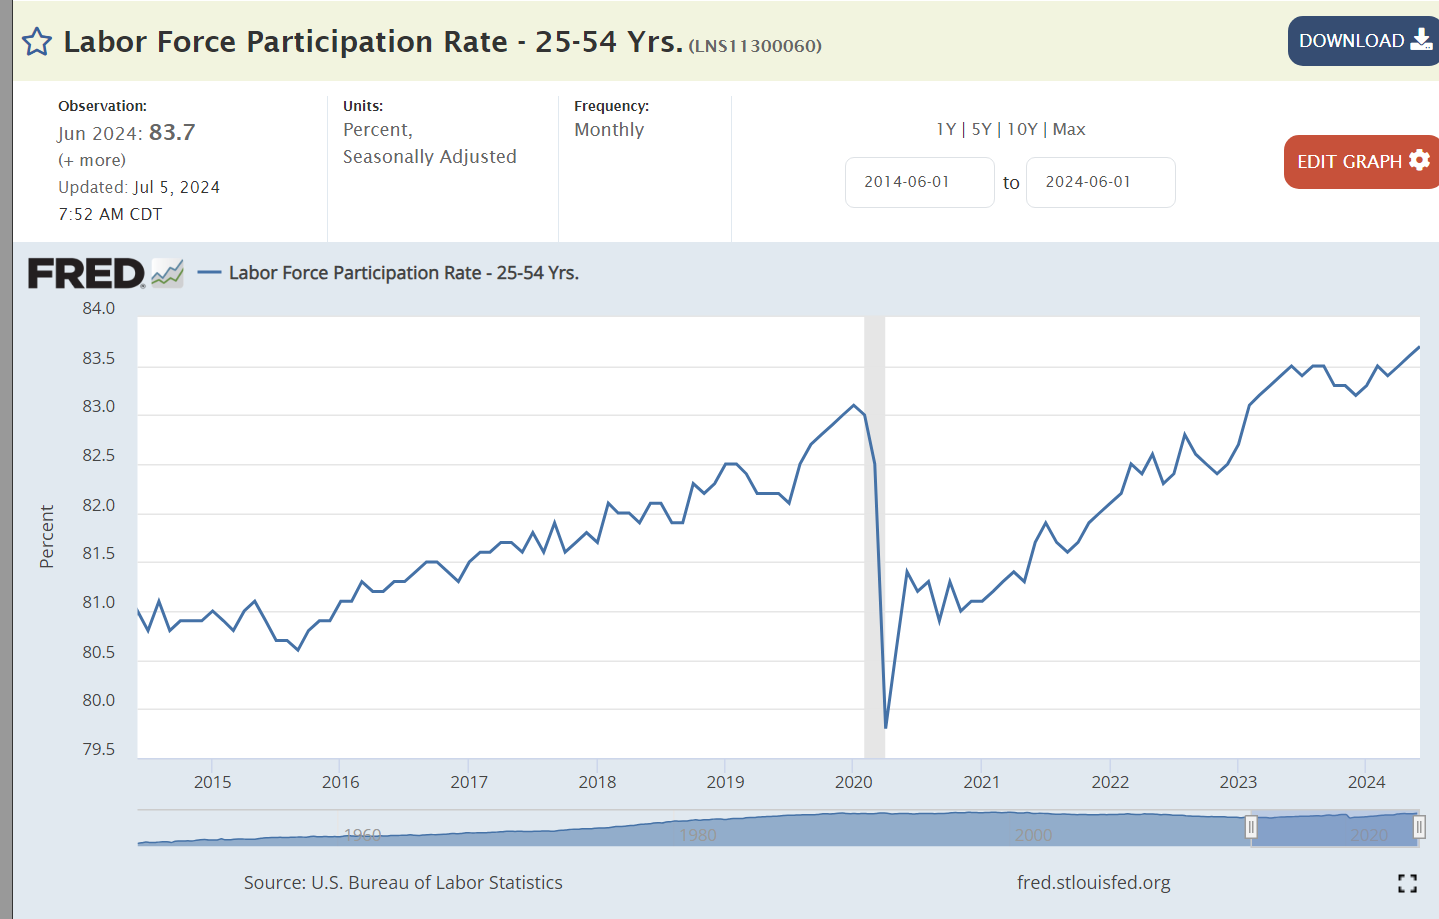
Core labor force participation is 1% higher with Biden than Trump. The current participation rate was last achieved in 2001.
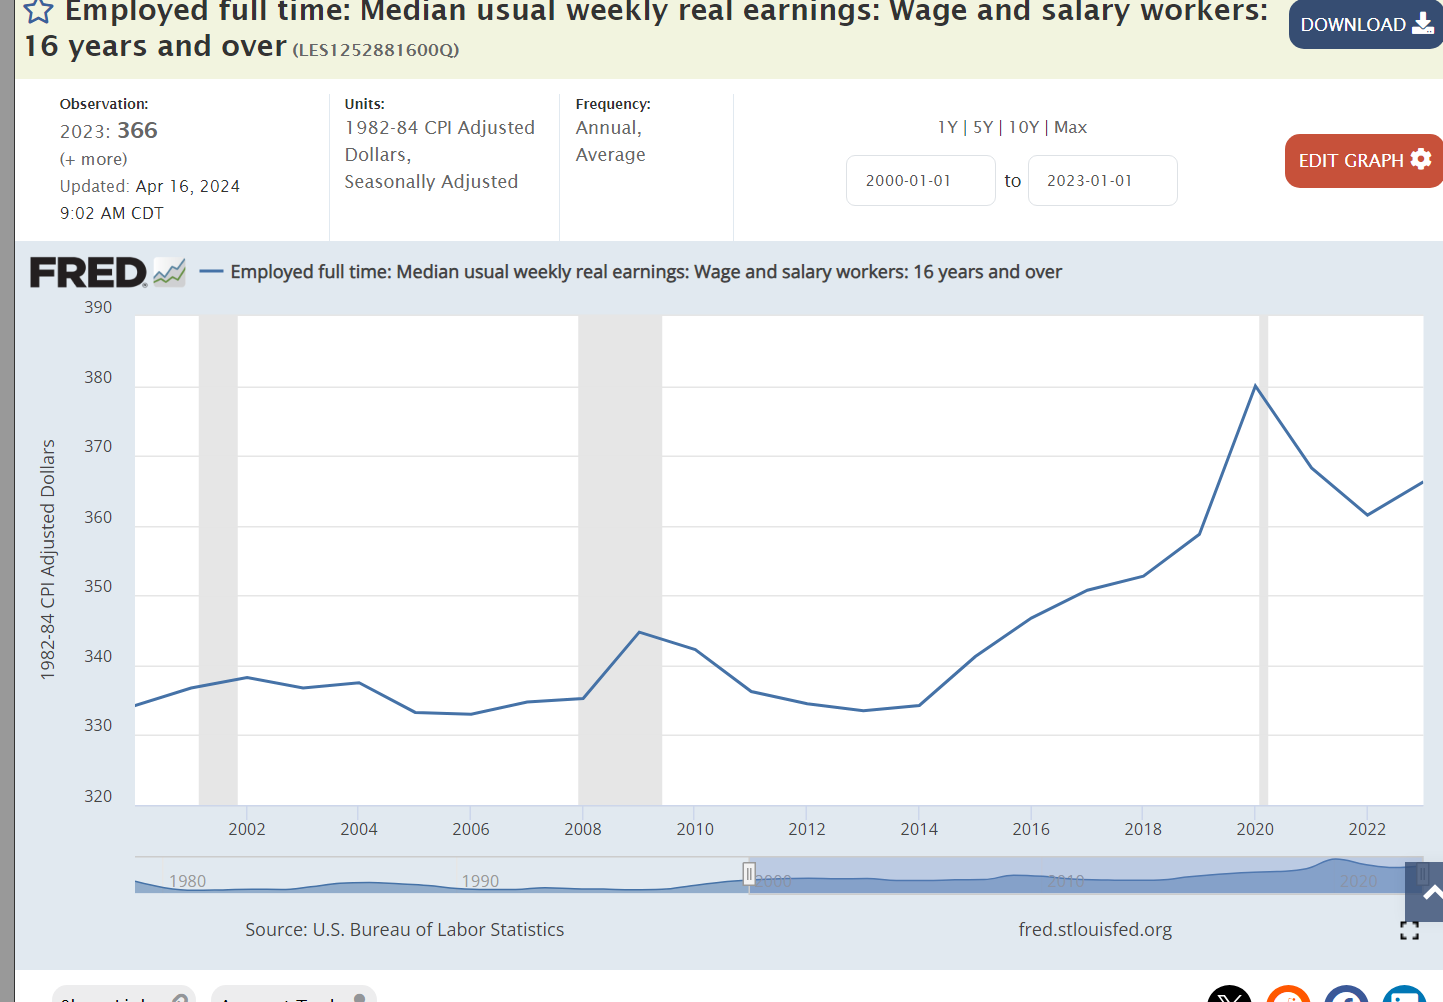
Median real wages have been slightly higher during Biden’s tenure.
Asset Values: Advantage Biden
Despite the pandemic disruptions and losses, US firms are worth 70% more today than before the pandemic. This reflects the 50% profits increase and continued positive future prospects.
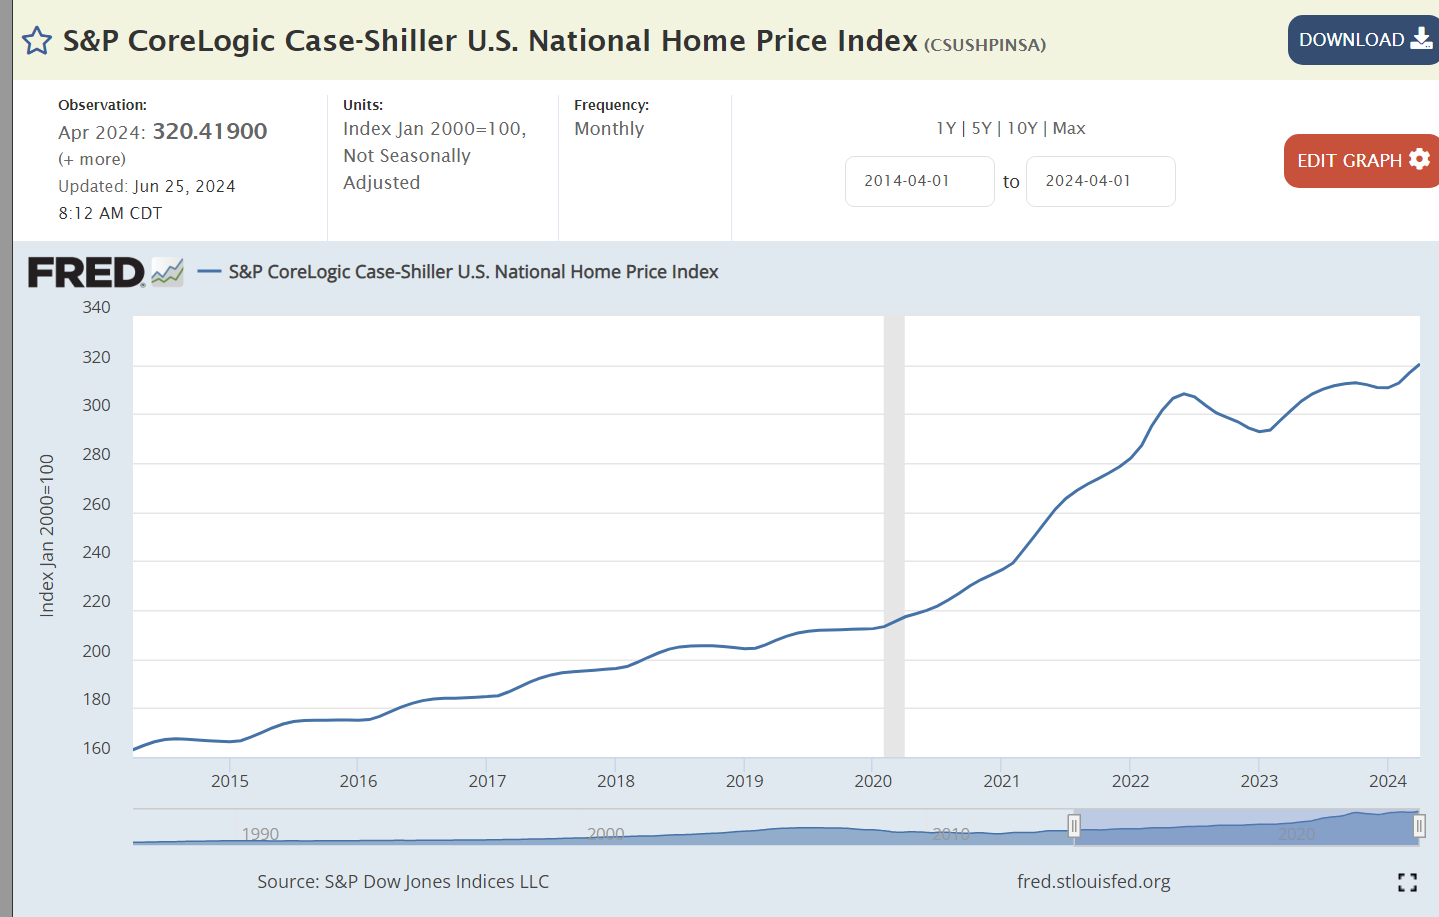
Home prices have nearly doubled since before the pandemic, reflecting the post Great Recession decline in home building, construction issues during the pandemic and general asset inflation caused by the rapid expansion of the money supply.
The US enjoyed a solid 7% savings rate before the pandemic, an extraordinary high 10% after the pandemic, falling to just 4% for the last 3 years.
Human assets increased during Trump’s presidency and resumed growth after the pandemic. As college graduation rates have increased throughout the post WWII years, the cumulative number of college educated individuals continues to rise each year. The growth in masters and professional degrees is noteworthy.
The Economy – Advantage Biden
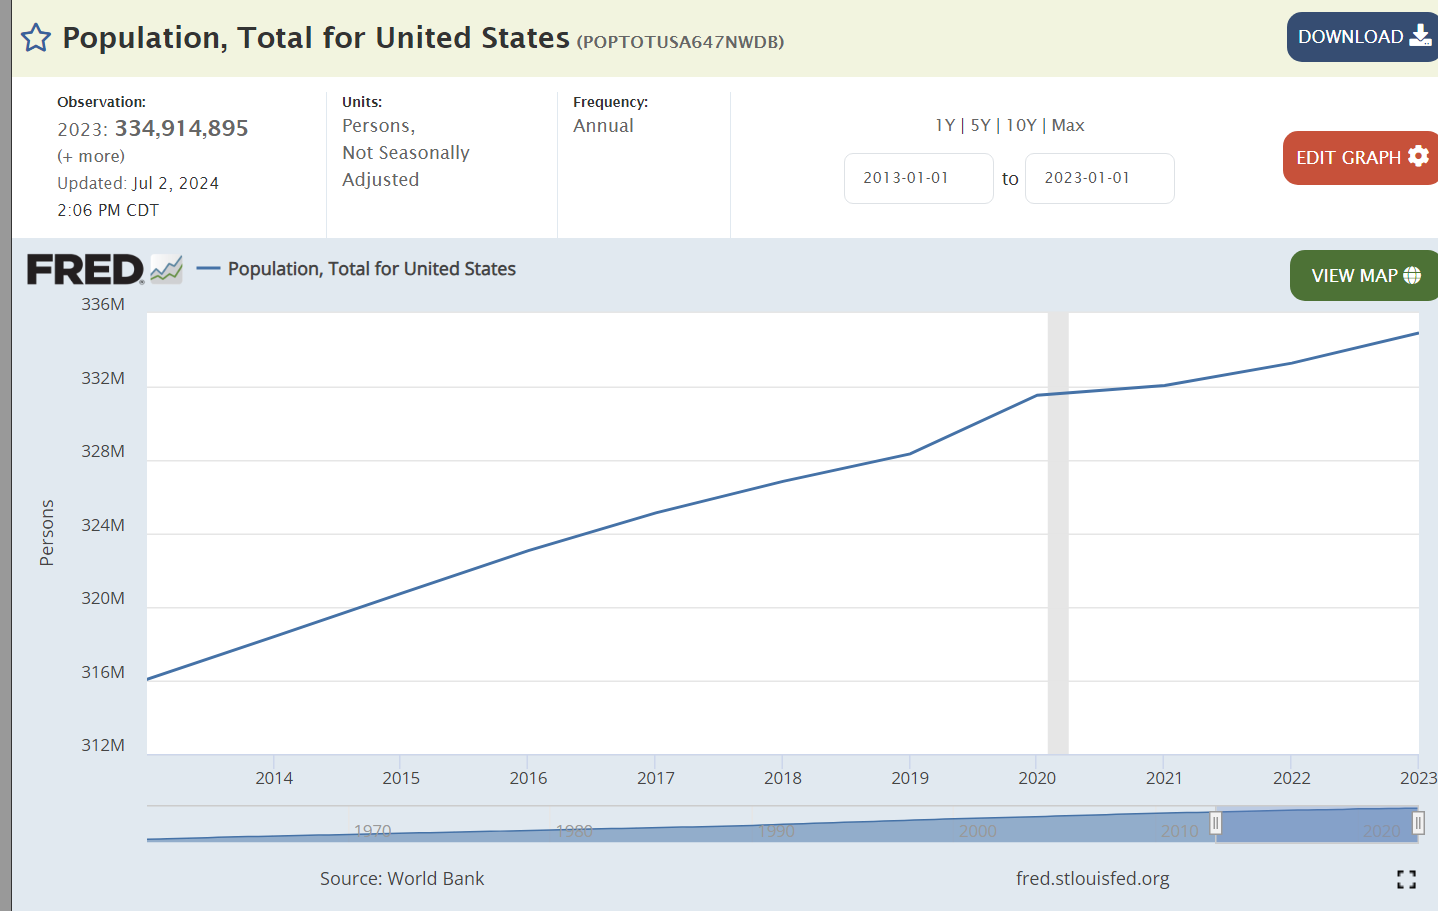
Population growth has resumed after the pandemic.
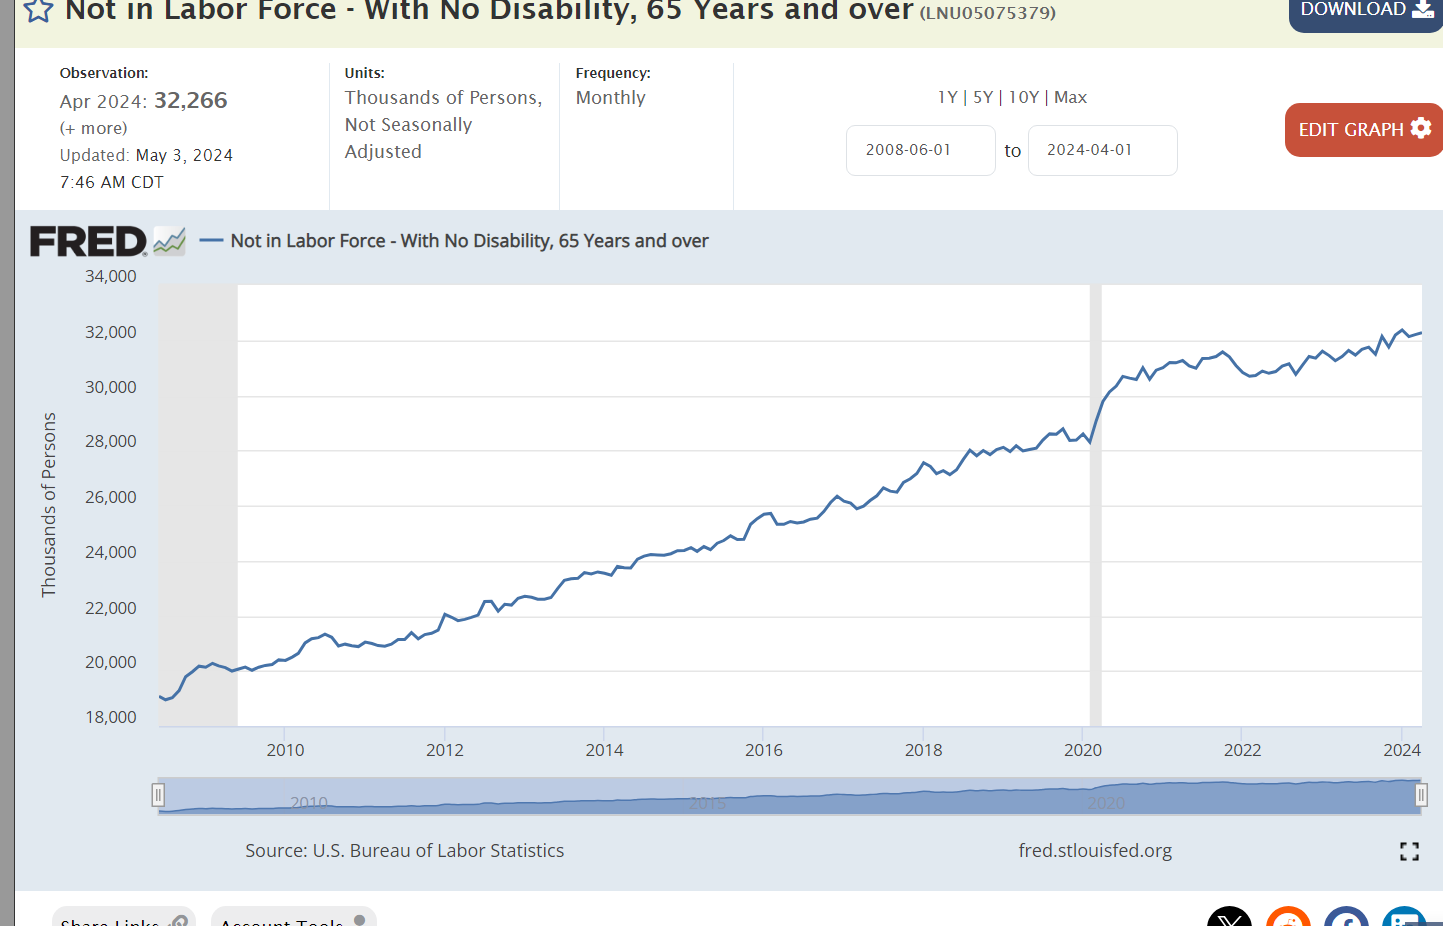
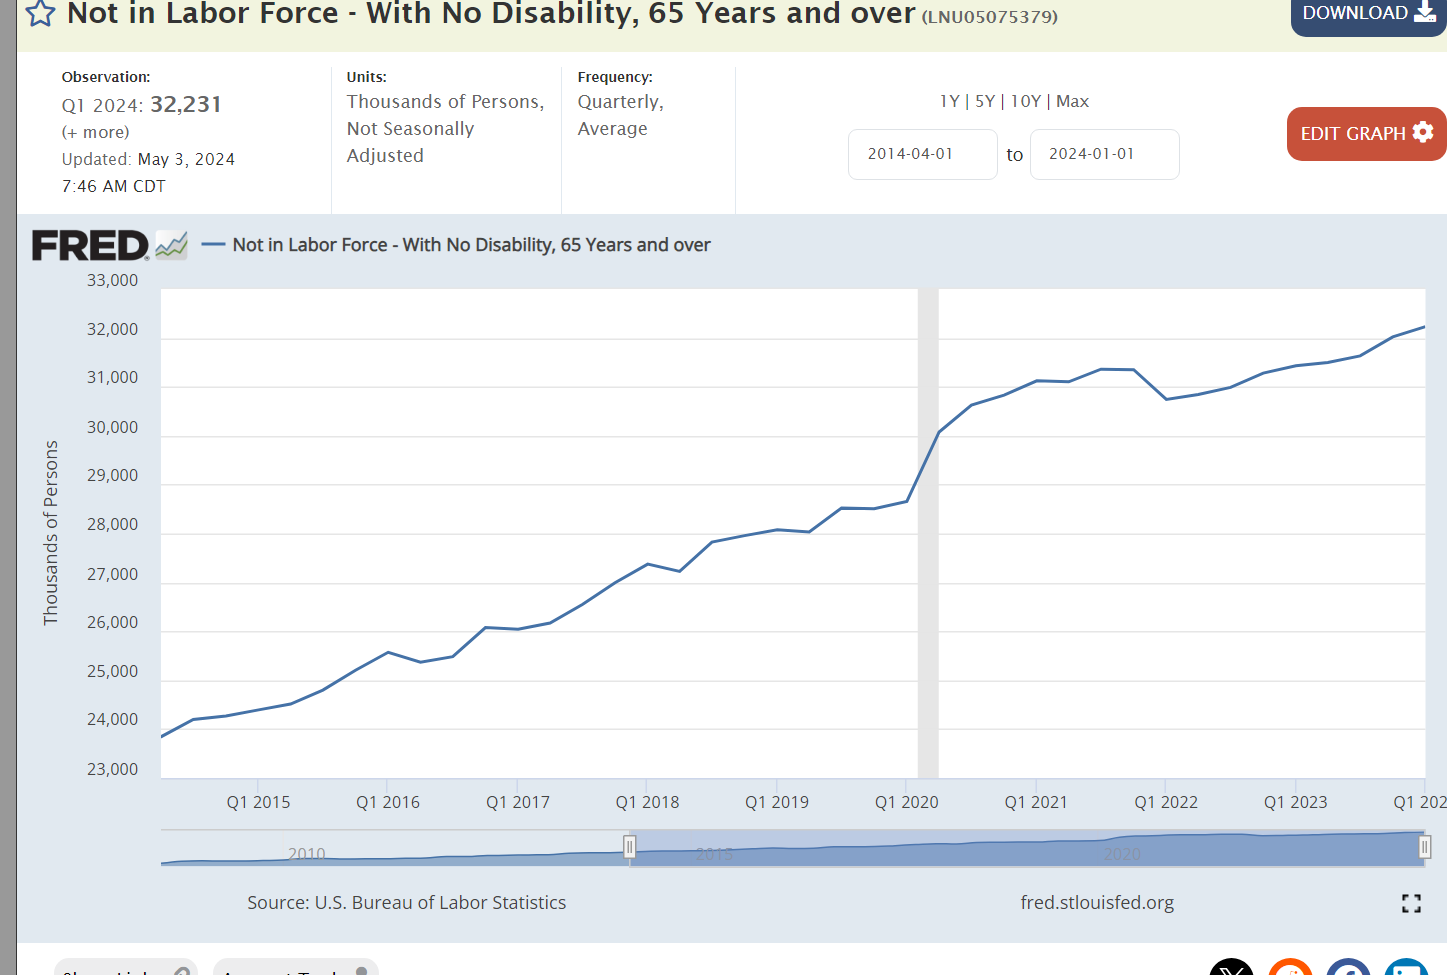
The healthy US economy is able to support 3 million more retirees after the pandemic.
Real dollar GDP is 2 trillion dollars larger than before the pandemic disruption. That increase is the same size as the total GDP of Russia, Canada or Mexico. We added the Canada economy during Trump’s time and the Mexican economy during Biden’s time.
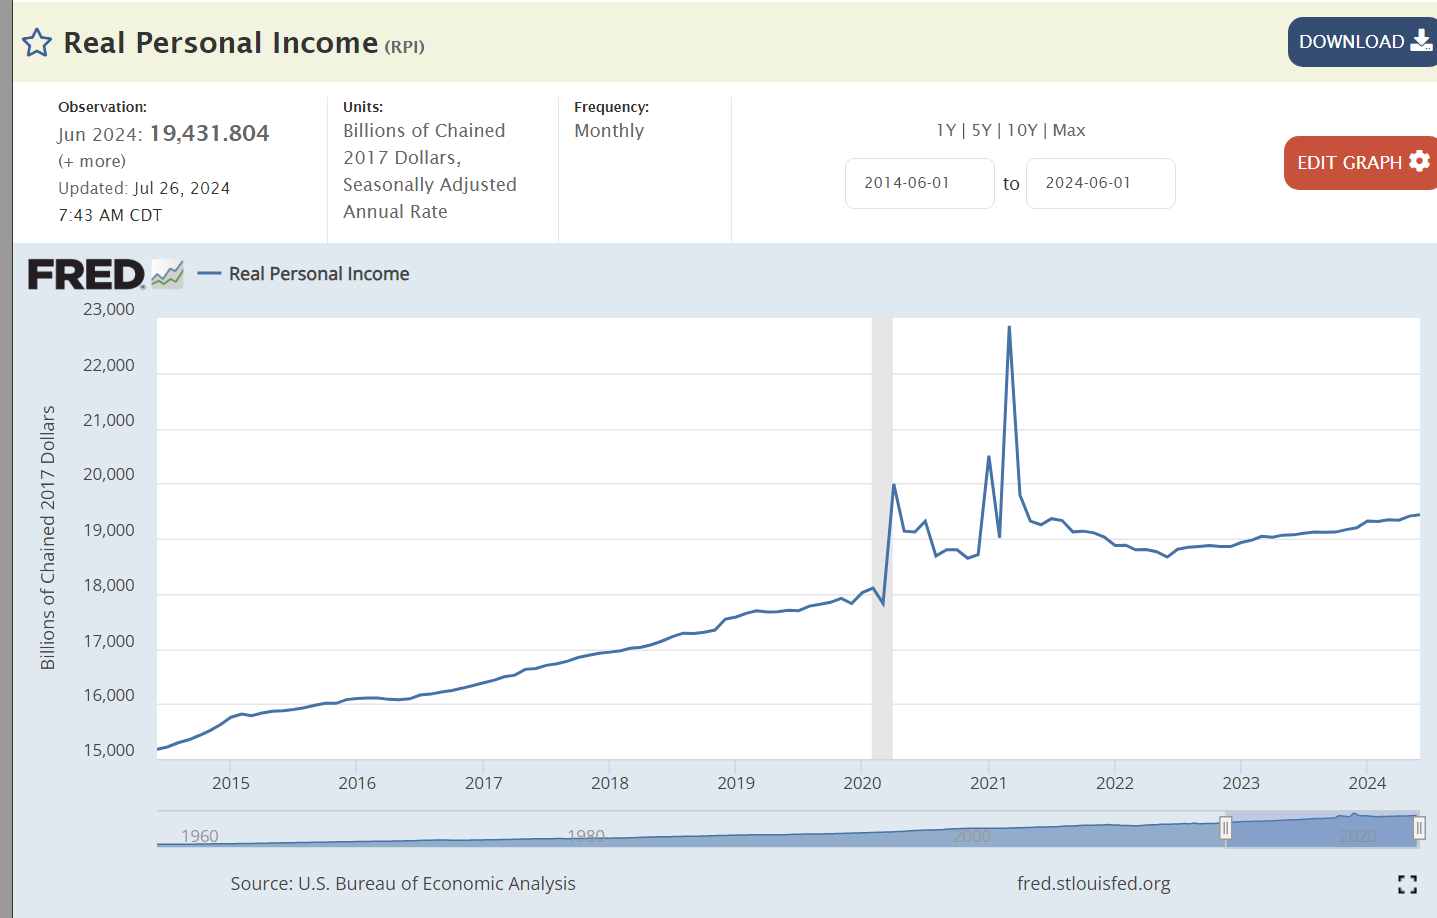
Real personal income grew a little bit faster during Trump’s time and more smoothly. Personal incomes jumped up during the pandemic but have been flat since that time with corporations capturing a greater share of the economy’s returns.
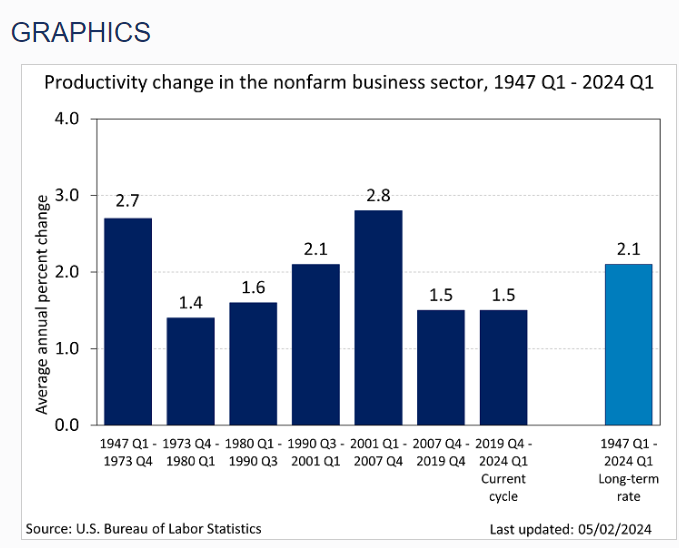
Workers have been 8-10% more productive in the Biden economy.
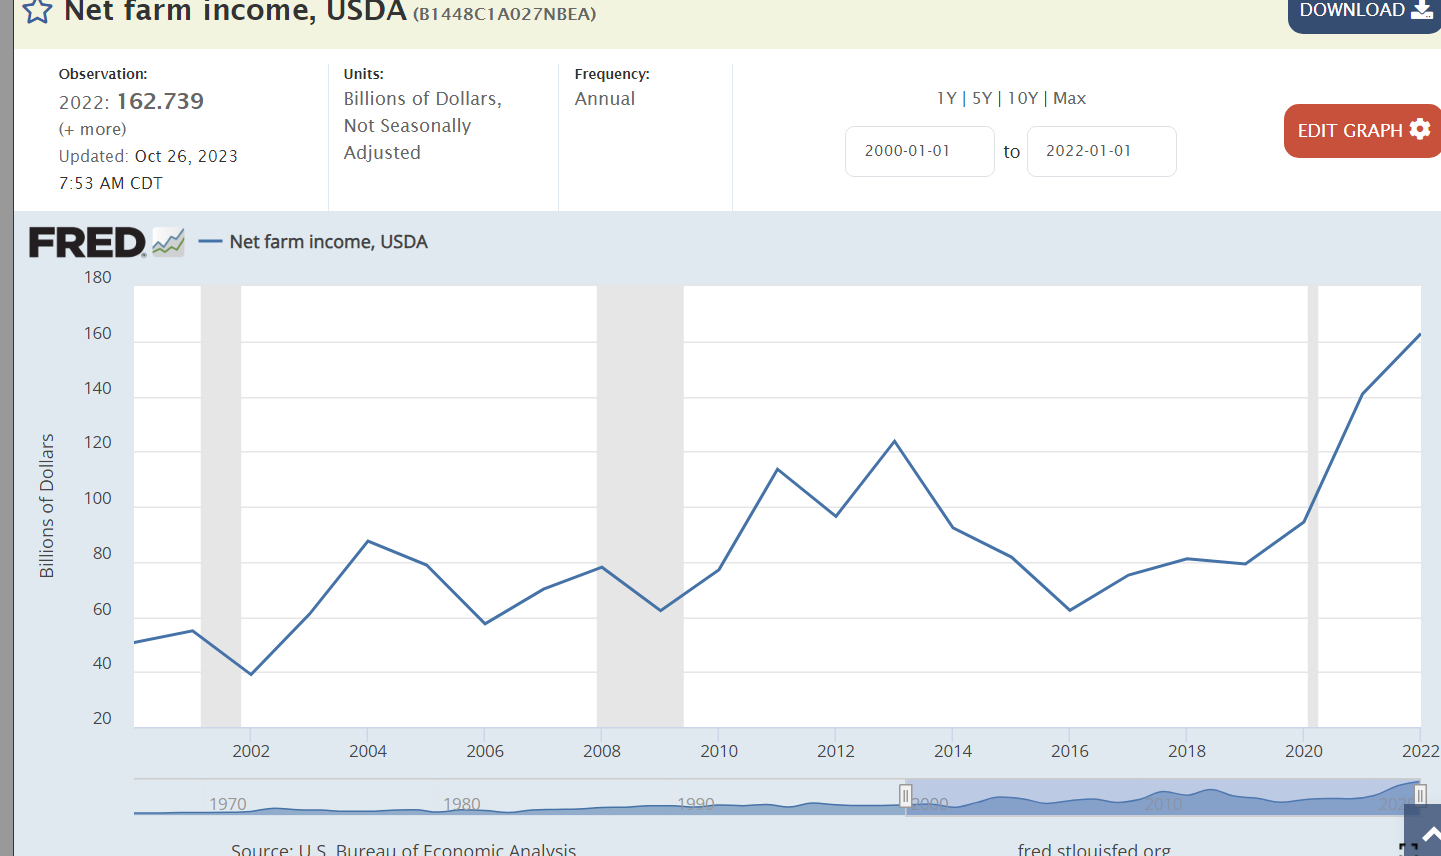
Farm income has doubled in the Biden economy.
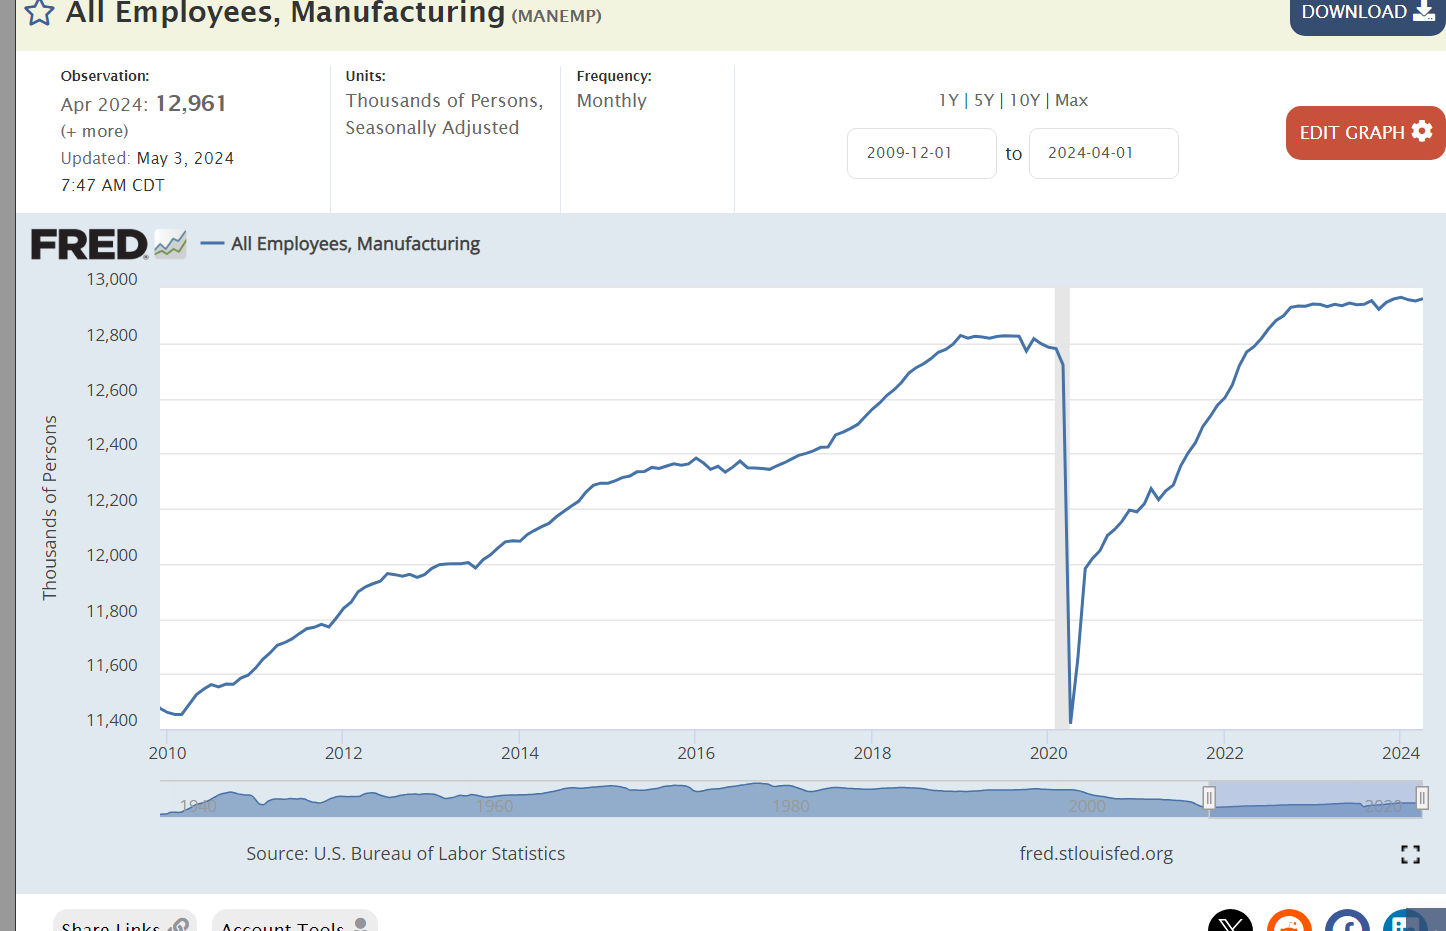
Manufacturing employment grew by a surprising 3% in Trump’s term. It is slightly higher in the Biden era.
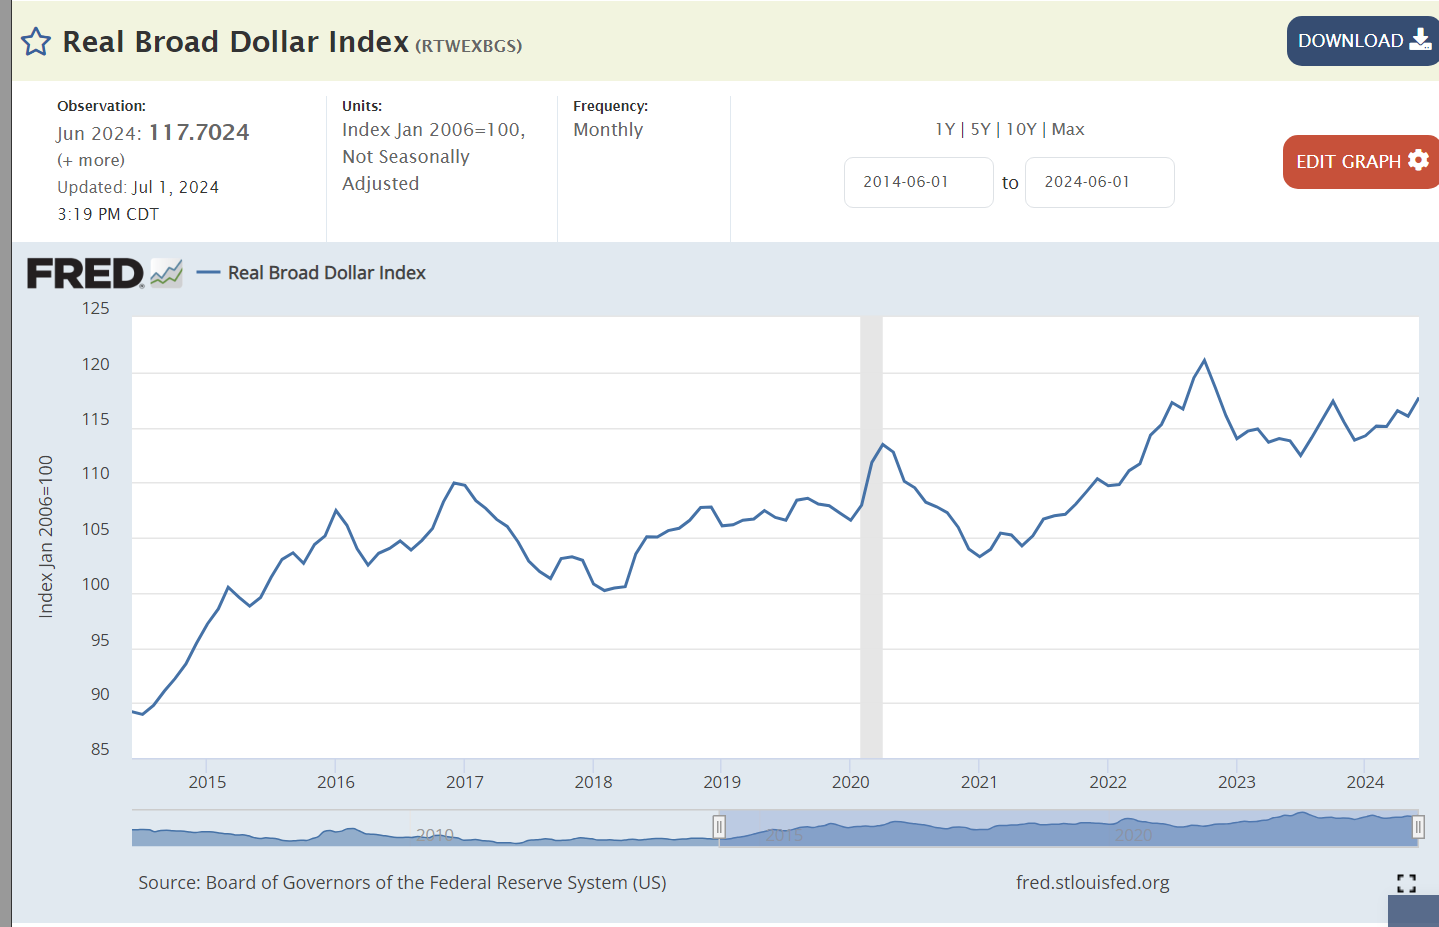
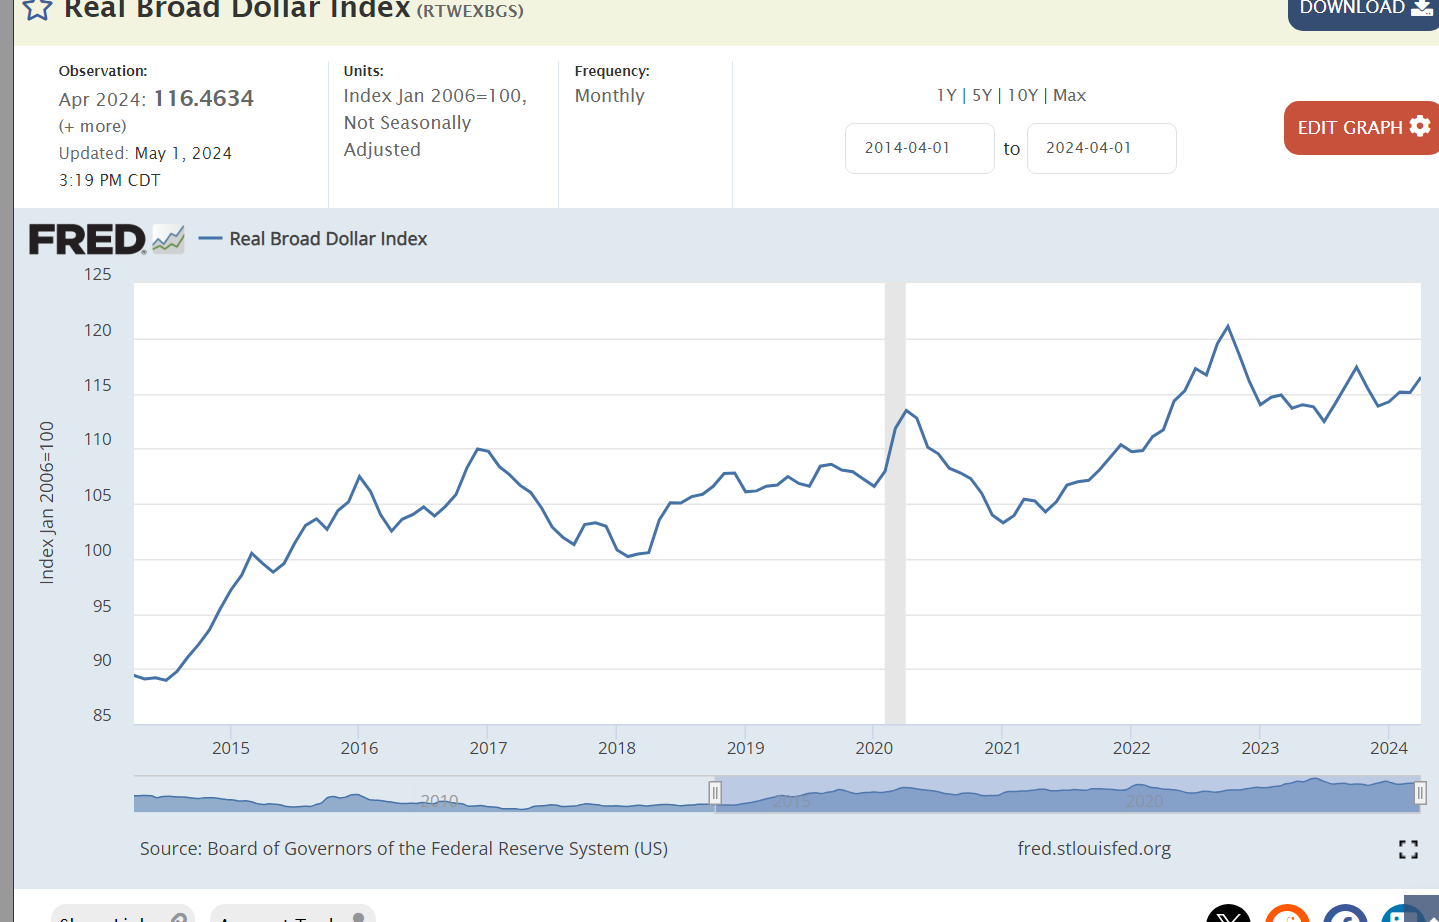
Real dollar exports increased during the Trump presidency and then again during Biden’s time despite a greatly stronger US dollar which hampers exports.
The world is willing to pay 10% more to hold US dollars in the Biden period, reflecting strong economic realities and prospects despite the risks of higher US inflation and budget deficits.
Summary
The US economy is very strong. Trump was able to extend the Obama recovery for longer than most expected, keeping inflation, interest rates and unemployment at low levels. Biden managed the recovery from the pandemic induced recession better than expected. The economy, asset prices and labor market have recovered very nicely. Inflation has remained the weak part of the Biden economy. It is lower than in comparable global economies and trending towards the 2% target in 2025. Critics point to excess government spending as an avoidable source of high inflation.
The Trump economy built upon the success of his predecessor. The Biden economy overcame the disruption of the pandemic to produce equal or greater results. Both presidents delivered solid results.
In an increasingly partisan world, I look for people, processes, incentives and institutions that can build trust, respect, constructive conversation and an emphasis on our shared interests. For most of the twentieth century, the League of Women voters served this role. In the last 20 years, the league has adopted positions that take sides in “the culture wars” so has lost its treasured status as a neutral collector and sharer of political candidates’ views. This is a true loss for our society.
Inflation is dropping nicely but won’t reach 2% this year. Technical issues in calculation of housing costs which drives inflation a year later than reality. Government spending / budget deficit in a full-employment economy pushes inflation. Physical goods prices are declining. Services prices are stickier, with a smaller wage-price spiral effect. Global economy is weaker than the US, which is helping. Independent Federal Reserve is holding interest rates high longer than required, making up for its prior slow increase in interest rates.
Fiscal and monetary policy matter. Other industry level policies can greatly reduce inflation. The president and congress have not responded to my early 2022 advice!
November, 2022. Inflation fears are high. The data is positive, but mixed and not enduring enough to be confident that inflation is falling, not accelerating.
Corporations took advantage of supply chain disruptions and shortages to increase prices quite dramatically. Prices had been smooth for a decade. Firms increased them quickly. Prices have NOT continued to increase. They have dropped a bit, especially for goods.
I participate in our political, economic, social, and spiritual communities.
I respect the innate human dignity and rights of my neighbors.
I accept that we each think, feel, and act differently.
I work to improve my participation, compliance and civility skills and encourage others.
Candidate Pledge
In Carmel, we seek to promote an environment of civility defined as the disposition to respect every human being we interact with as our moral equal and worthy of respect. Therefore, we encourage any candidate seeking public office and asking the citizens of Carmel for their vote, to agree to the following tenets of civility.
The Carmel Civility Project: Candidates Pledge
As a candidate for public office in Carmel, I hereby commit to the following five essential tenets of campaign conduct:
1. Civility and Respect: I will maintain a respectful demeanor towards everyone, regardless of our differences, and foster an environment of open-minded dialogue.
2. Integrity and Truthfulness: I promise to uphold truth and transparency in my campaign rhetoric and actions, swiftly correcting any mistakes should they arise.
3. Positive Focus: My campaign will highlight my vision and policies, eschewing negative attacks on my opponents’ character or record.
4. Informed Discourse: I pledge to inform citizens accurately about my platform and engage in constructive discussions to promote understanding and educated voting.
5. Democratic Process and Accountability: I vow to respect the democratic process, accept its outcomes, and encourage my supporters to engage in campaigns with integrity and decency in support of these principles.
By taking this pledge, I affirm a dedication to dignified campaigning not just out of respect for each resident of Carmel, but also in admiration for the institutions we cherish in our community.
I encourage us to always “look at the big picture”: across time, nations, industries, occupations, institutions and political views when considering the “state of the economy”.
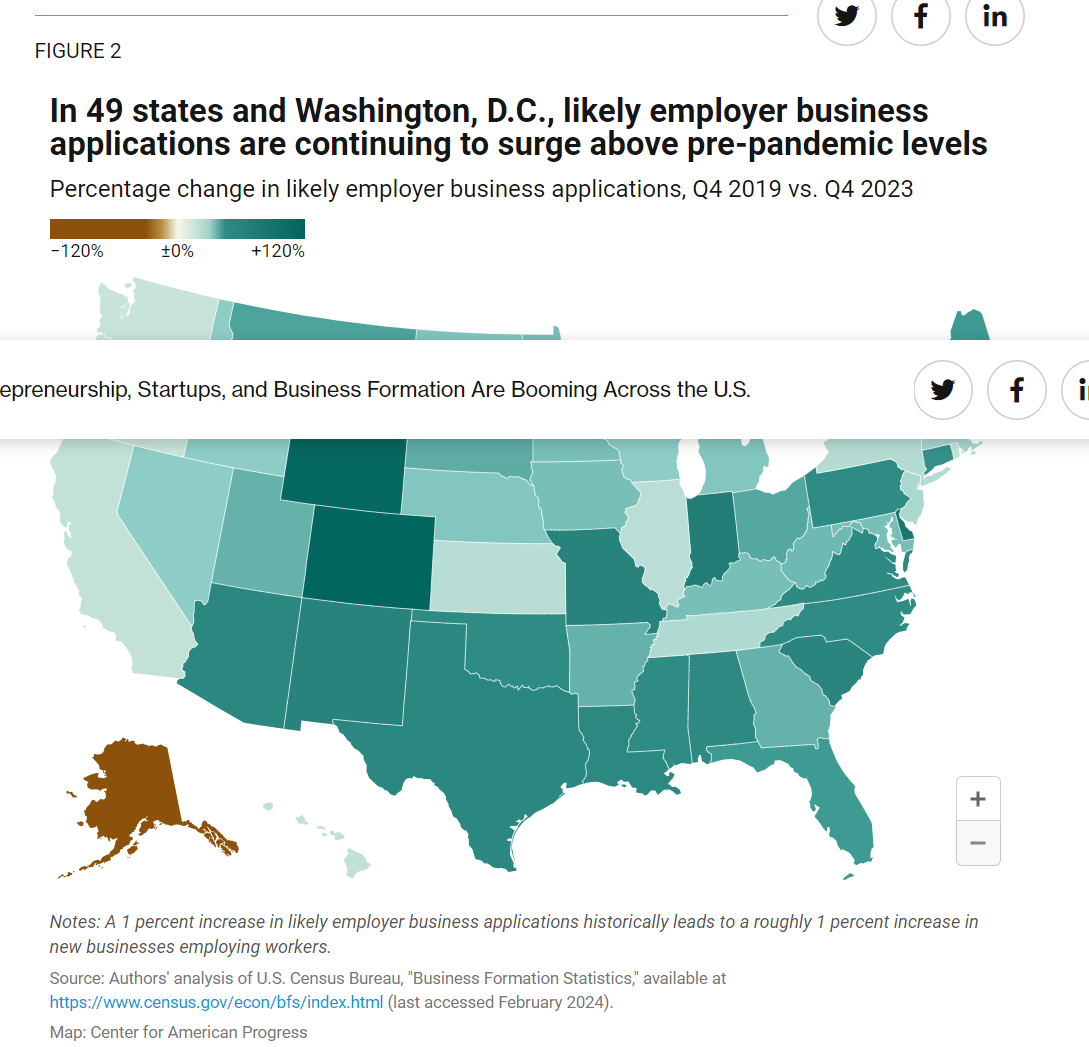
Recent surveys indicate that many (partisan) Americans believe that the economy is in recession, the stock market is down, and unemployment is up (false). The US economy continues to lead the world out of the pandemic driven recession. I’ve documented the tremendous strength of the US economy in GDP growth, job creation, wage growth, profit growth and wealth creation. Today I’d like to focus on entrepreneurship and new firm creation, where the US once again leads the world.
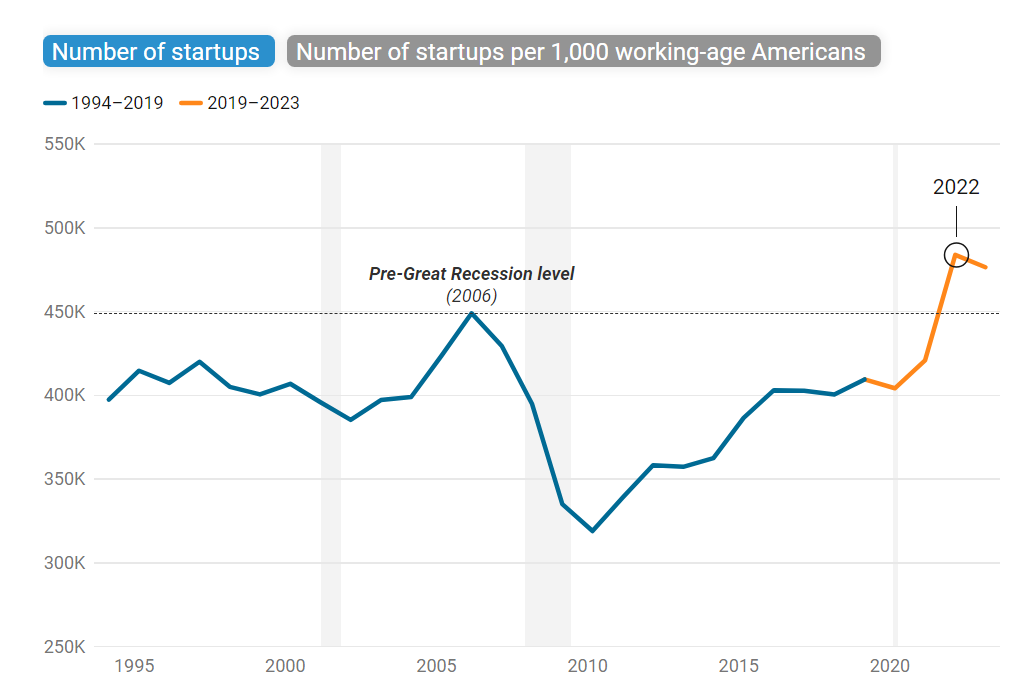
The US economy led the world in creativity, technology, job growth and firm creation in the 1990’s as it recovered from the global economic challenges of the late post-war era. The deregulation and technology driven changes produced benefits into the “oughts”, the first decade of the new century. Unfortunately, the dynamic pace of new firm creation based on economic, trade, relocation and technological changes did not strongly continue in the first 20 years of 21st century. New firm creation lagged. Larger firms held onto jobs as they consolidated industries and protected their positions. Venture capital firms facilitated the most successful new companies to quickly expand market share and vanquish weaker competitors. Many Schumpeter disciples worried that the engines of “creative destruction” had lost their momentum and effectiveness.
The Great Recession of 2007-10 destroyed wealth, slowed economic growth, job creation and new firm starts. The Obama-Trump expansion was longer than expected by historical standards, but slower growing. Many critics and commentators concluded that the US had “lost its entrepreneurial spirit”.
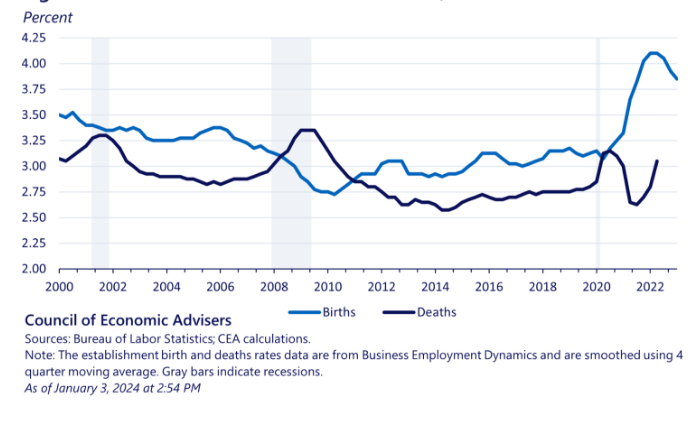
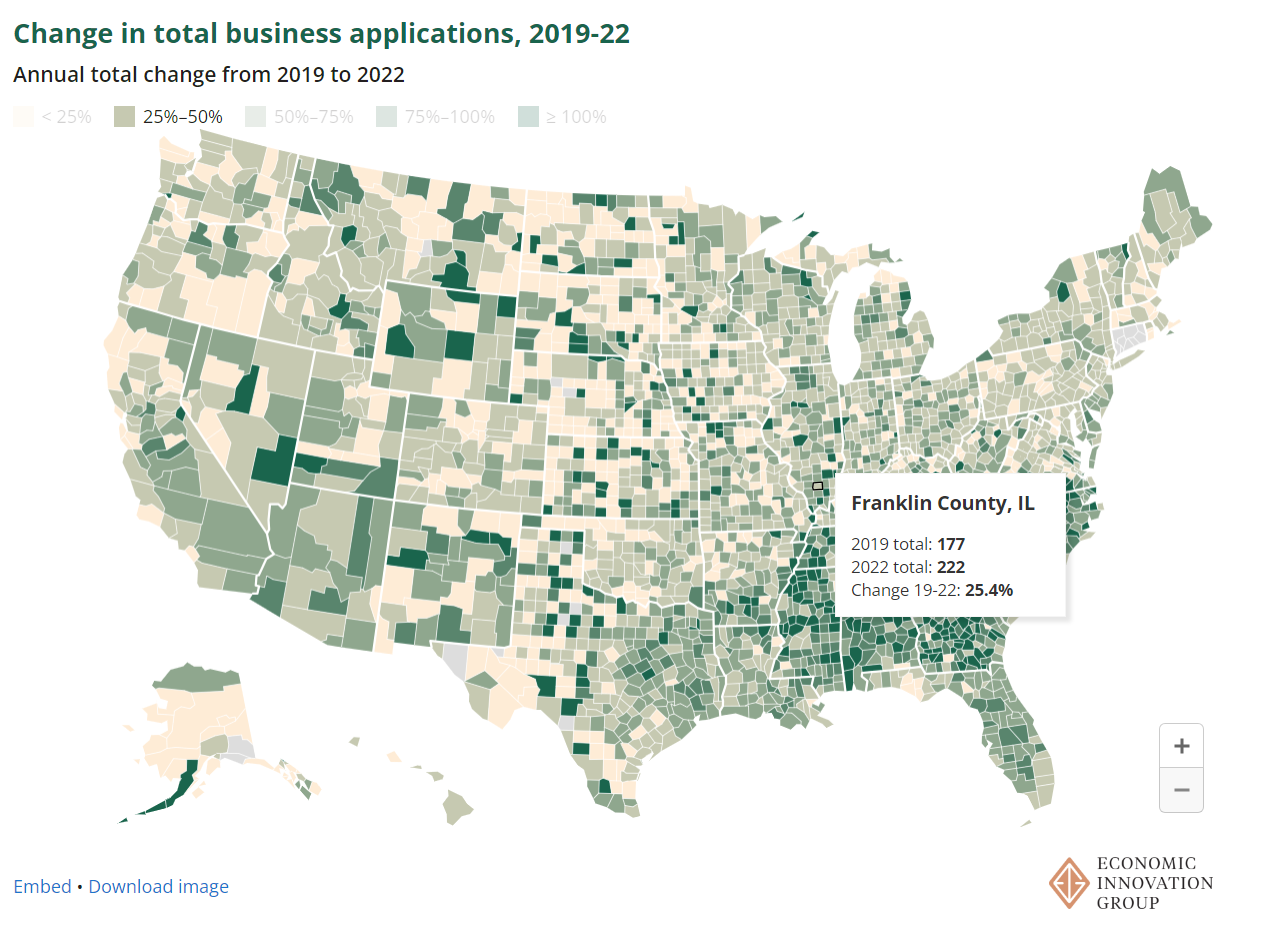
New firm creation since the pandemic has basically been 50% higher than before the pandemic.
This is an AMAZING and unexpected result for the US. During the pandemic, economic activity ground to a halt. Supply chains stopped functioning. People stayed home. 20 million jobs were lost. 1 million lives were lost in the US. Many firms closed. Global trade and military tensions increased. Trust in governments, corporations and other institutions was damaged. In 2020, there was no reason to believe that the pandemic would be medically controlled soon, or that economic growth would quickly rebound and resume its trend growth rate. But it did!
The IRS tracks new firm tax license applications. Most firms never really do business, but the ratio of initial applications to real firm creations has been stable through history. The Census Bureau has determined which subset of IRS license applications leads to real new firm creations. Both measures show the tremendous 50% increase between the pre-pandemic and post-pandemic eras.
As Wendy’s Clara spokeswoman exclaimed long ago, “show me the beef”. Did the increased rate of tax applications during 2021-22-23-24 result in new firm creation?
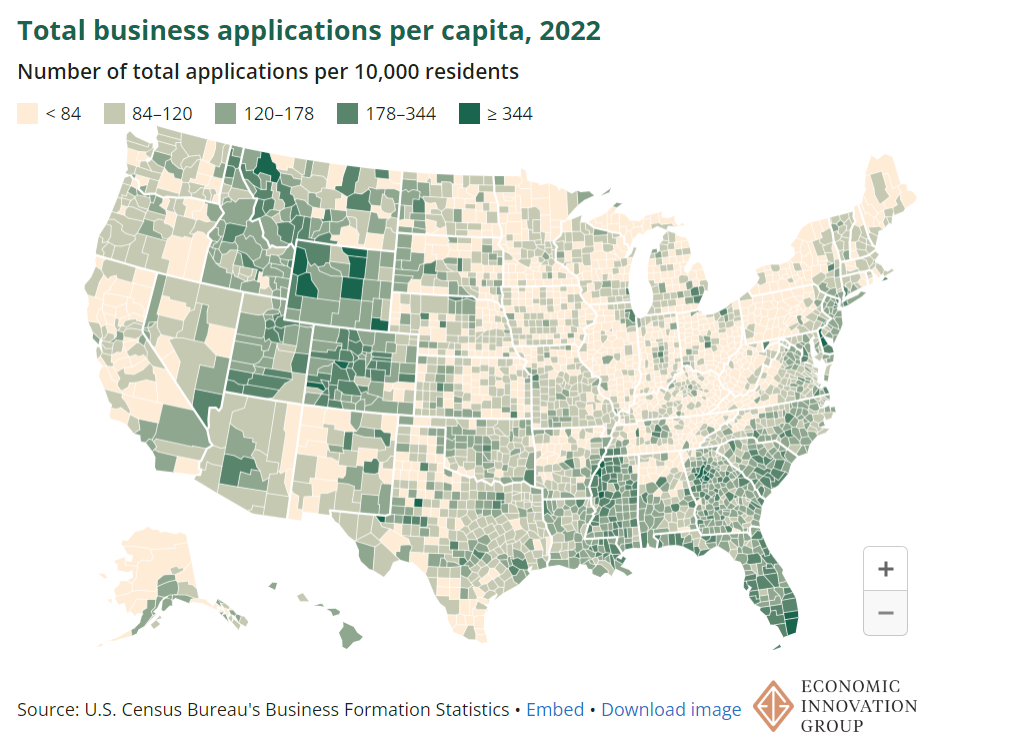
The initial surge in new businesses did NOT include the IT or manufacturing sectors which look ready to benefit from AI and government investment policies. Firm creation should continue at its record pace for the next 2-3 years.
Why/how did this happen? US economy did not see wealth destruction during the pandemic as occurred in the Great Recession. Bipartisan government funding during the pandemic protected small businesses and individuals. The US labor market was strong before the pandemic and recovered very quickly to full employment with high quit rates, high job openings, low layoffs, wage growth, high labor force participation, and new immigrants included. There was no “credit crunch” destroying businesses. Venture capital firms were flush with capital, able to invest in the very best prospects. The US economy was mature as an “information age” economy, identifying opportunities. The virtual economy was mature, allowing individuals with minimal technical skills to easily create new businesses, market their services, and engage skilled resources. Individuals experienced being out of work and at home and determined that they could create new firms from home.
The Biden administration claims that its various public policies have leveraged the “natural” rebound.
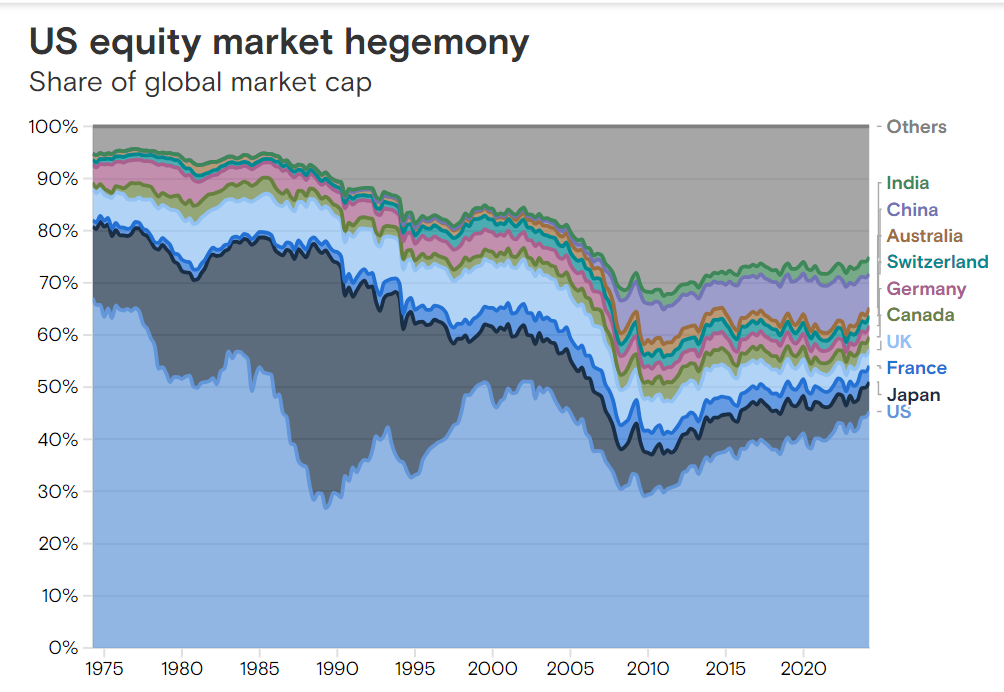
Despite doomsayer predictions for the last 20 years, the USA remains the world’s largest economy. China’s population, productivity, property, politics, energy, trade, innovation and middle-income transition challenges have undercut past predictions of its inevitable world economic leadership.
One way to get a tangible sense of the USA’s economic size and dynamism is to compare individual states with other countries. Most of us have read articles highlighting the size of California, Texas, New York, Florida or Illinois as standalone economies. They would currently rank globally as economies numbered 9, 14, 16, 25 and 30, lining up with France, Spain, Saudia Arabia, Vietnam and Argentina in the pecking order. Their men’s soccer teams are ranked 2, 8, 53, 115 and 1 in the world. The US soccer team is ranked 11th and after its recent 5-1 pasting from 12th ranked Colombia it is sure to fall several places.
The real economic strength of the US is shown by the next 27 states. Collectively their GDP is as large as India. These 27 states match up one by one with the next 36 states in the global rankings. The 27 matched countries are each proud nations. There are surprises throughout this listing. UAE 33rd largest country? Romania 34th largest? Morocco 56th largest? Qatar 60th largest? Dominican Republic 62nd largest? New Zealand 63rd largest?
Even bigger surprises arise from the pairing of US states to their global equivalents. Raise your hand if you predicted that these US states are the economic equals of their global nation partners: Georgia and Switzerland, Massachusetts and Sweden, Virginia and Ireland, Maryland and Ukraine, Arizona and Portugal, Indiana and Denmark, Minnesota and Norway, Missouri and Greece, New Jersey and Singapore, Alabama and New Zealand.
The remaining 18 US states are not so large. Their combined GDP is about the same as our neighbor Canada, which ranks 15th overall by GDP, about the same size as Spain or Texas.
On the other hand, the US soccer team was ranked 11th globally. Three of the top 5 matching countries of Argentina, France and Spain deliver 1st, 2nd and 8th FIFA ratings. The middle 27 states matching nations provide another 8 world-class soccer teams in Belgium (3), Portugal (6), Morocco (13), Switzerland (19), Denmark (21), Ukraine (22), Austria (25) and Sweden (27).
The US is an economic colossus that continues to grow faster than the rest of the “developed countries” and maintains its global economic lead. We don’t normally think of Tennessee, Colorado, Michigan, Arizona, Indiana, Minnesota, Maryland and Missouri as global economic powerhouses, but they would EACH rank in the top 55 countries of the world as standalone economies.
Of 10 largest economies in the world, the US has the 3rd highest GDP growth rate at 3.0%. Less developed China (5%) and India (8%) lead the way. The median growth rate is 1.2%. The UK and Germany have negative annual growth rates (recession)! The US has the second lowest unemployment rate at 3.8%, only bettered by Japan at 2.6%. The median is between China at 5.2% and Canada at 6.1%. France and Italy record 7.5% while Brazil and India trail at 8%.
Despite its high wages, high standard of living and highly valued currency, real dollar US exports exceed the pre-pandemic level.
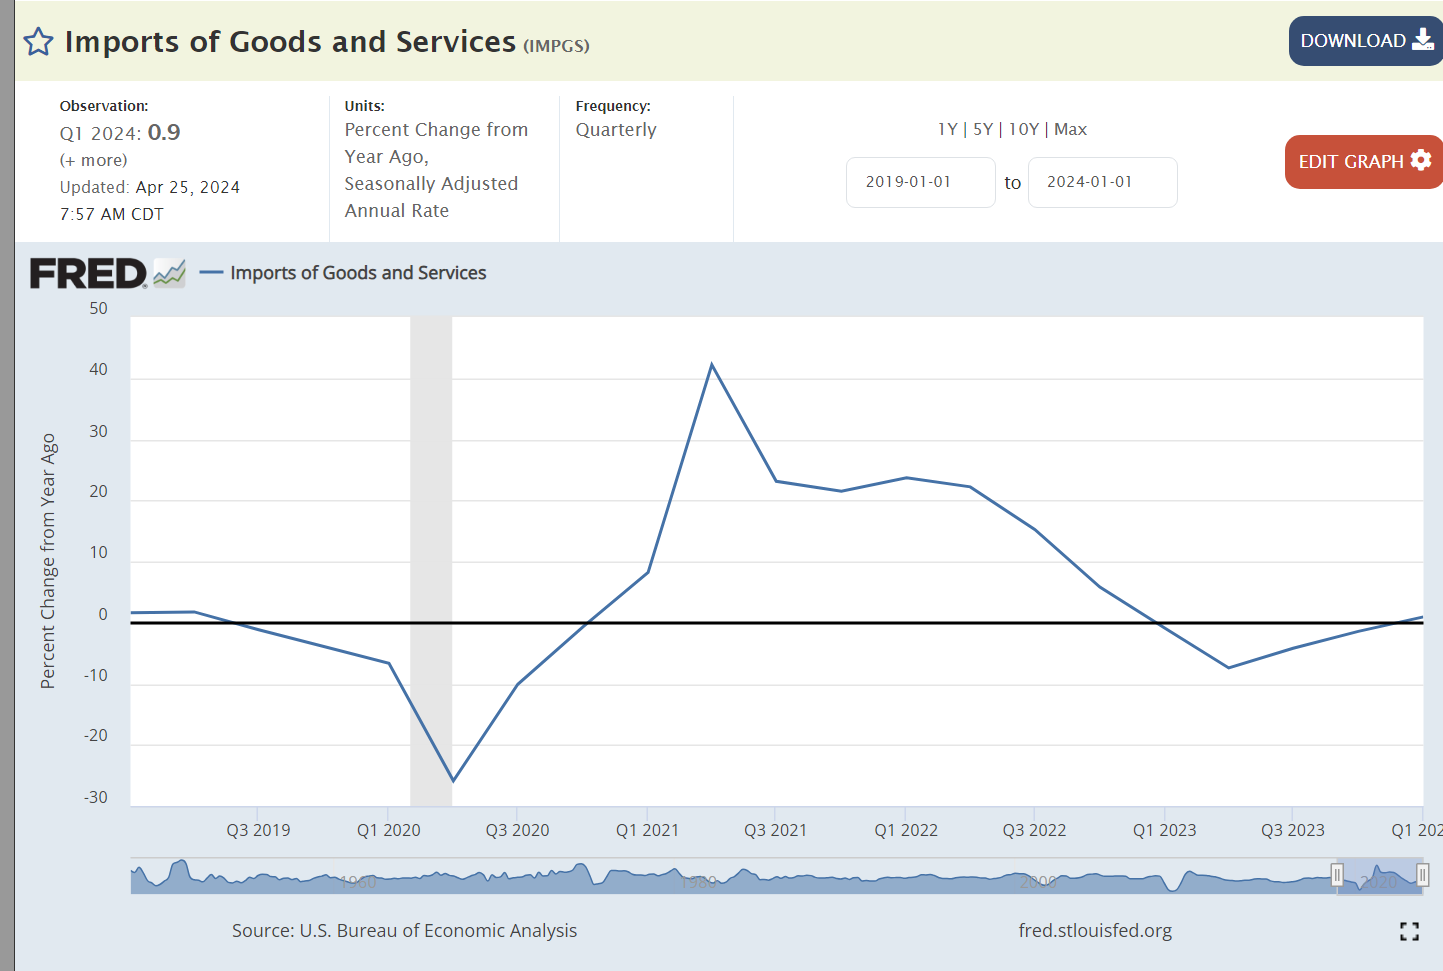
Real dollar imports have returned to their growth trend level, allowing US consumers to take advantage of the differentiated global economy’s strengths.
The misery index, the sum of the inflation and unemployment rates, is down to 7% and trending lower, materially below the 8% average of this century.
US inflation reached 8-9% in 2022 and has fallen to 3%. The “stickiness” is half caused by the lag in housing and rental prices in the index and half due to the continued high 6% federal government budget deficit as a percent of GDP.
There is nominal inflation or actual deflation in most sectors of the US economy today!!!!
On average, the US economy has been adding 2 million new jobs per year for 14 years. 28 million jobs. This is an amazing result.
During the same period, 12 million more people have retired.
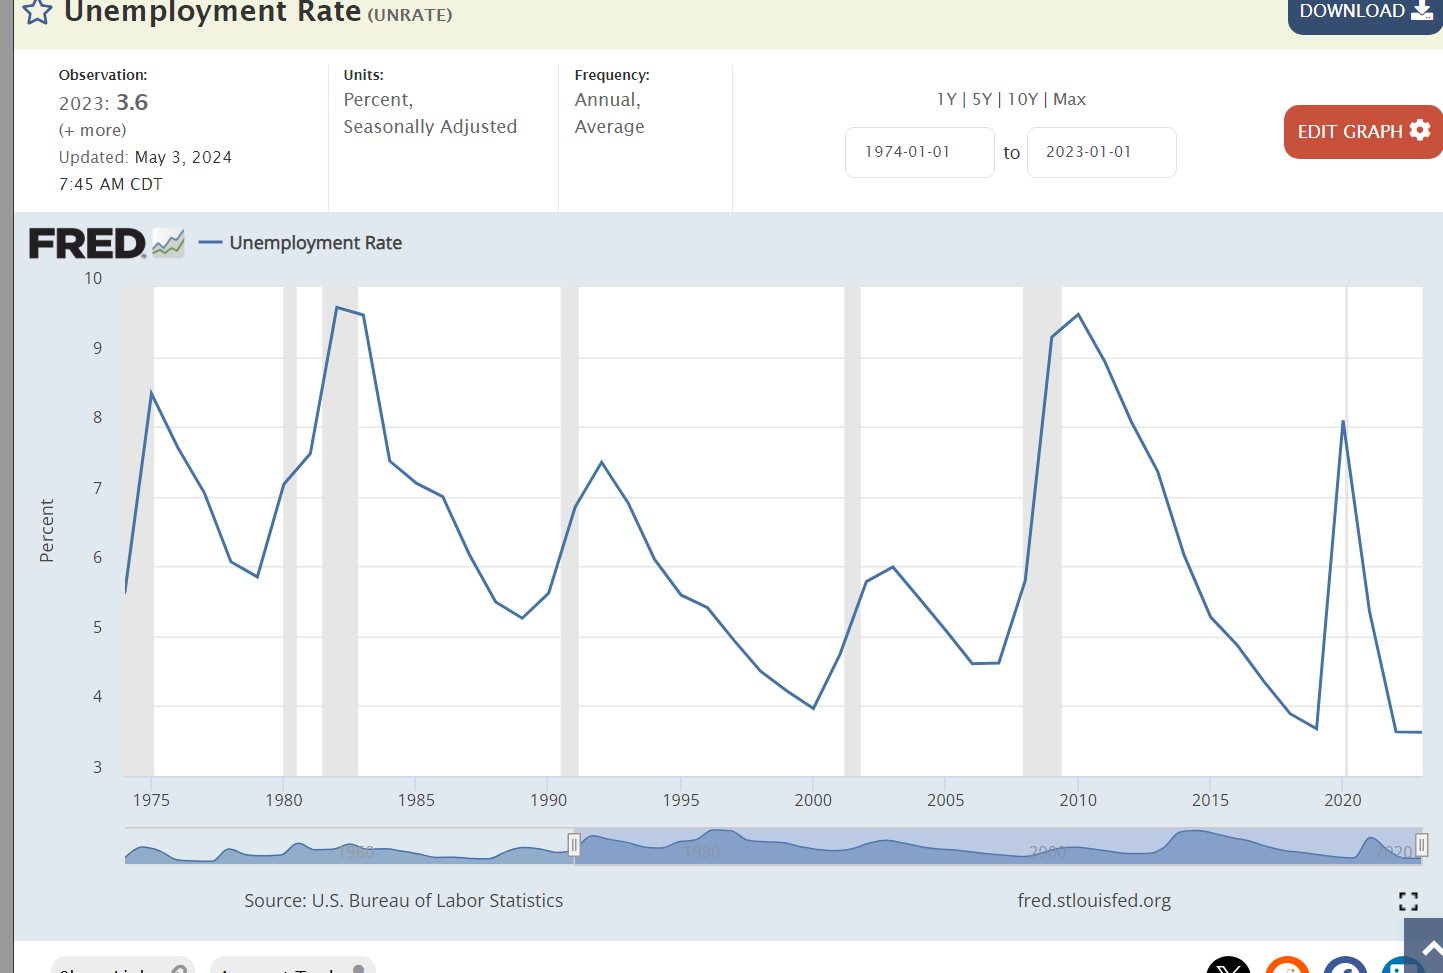
The unemployment rate is at a 50-year low. When I was studying economics in 1974-78, there was a big debate about 5% becoming the lowest possible “structural” unemployment rate possible without escalating inflation. 1997-2007 established that a 4.5% to 5.0% unemployment rate was possible. We raced back up to 9% during the Great Recession. The 35-year average was 6.5%. We experienced 3 years of sub-4% in 2017-19 as economists claimed that this was simply impossible. Unemployment rates are still below 4%.
The Black unemployment rate has been chopped in half, from 11% to 5.5%.
The demand for labor remains high. Job openings peaked at 7.5 million before the pandemic. Job openings remain 20% higher at 9 million 5 years later.
The core labor force participation rate has rebounded from the pandemic reaching a level last seen in 2008.
10% fewer black men participated in the labor force between 1973 and 2013. Participation is now solidly increasing.
Real wages stagnated from 2000-14. They have increased by 10% since then.
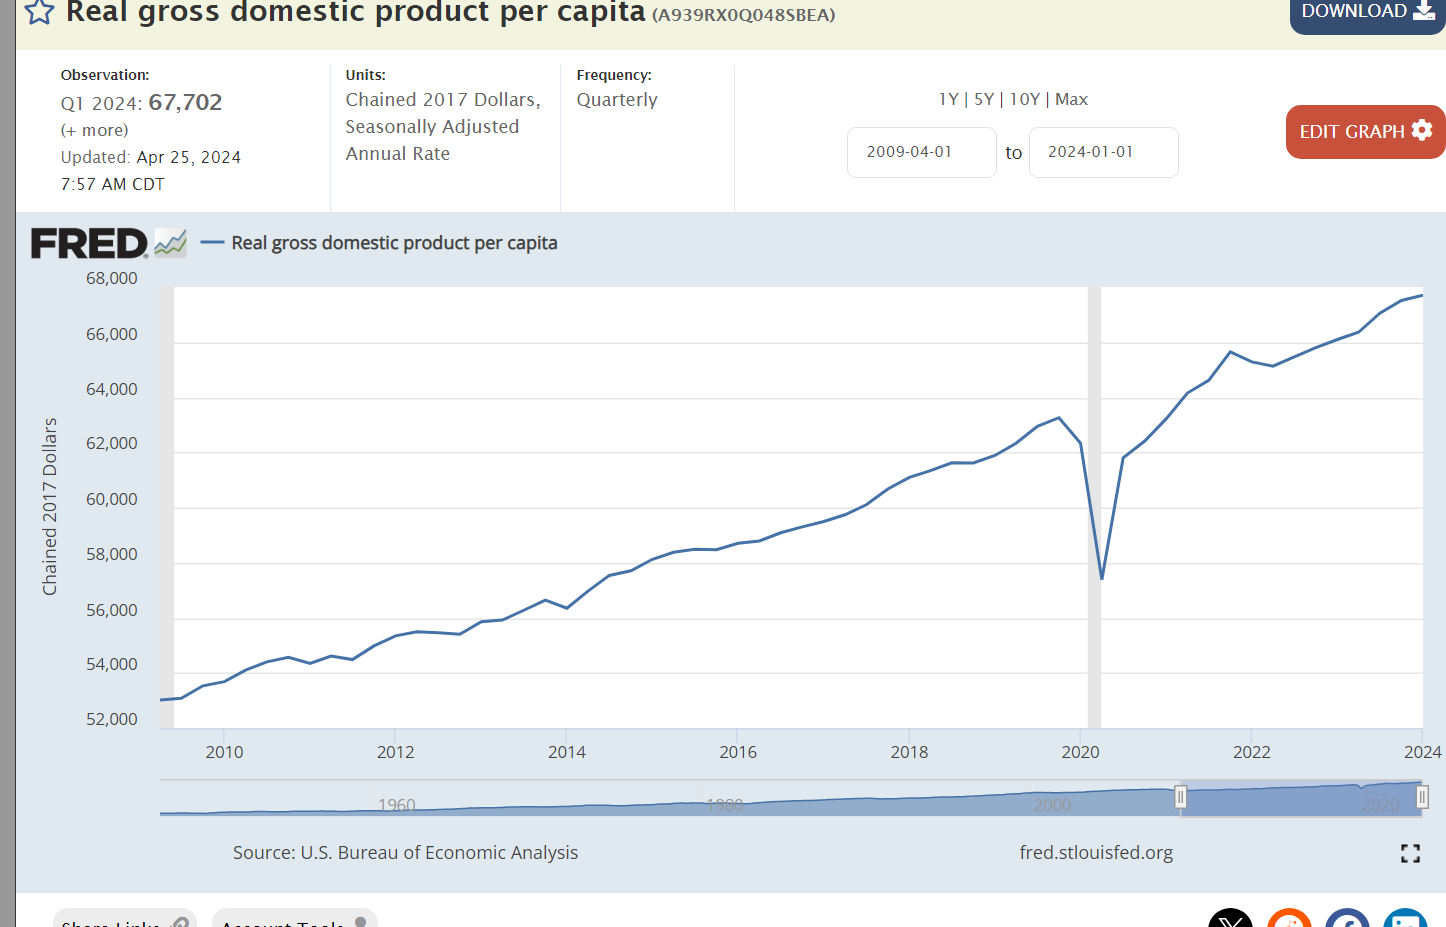
Real GDP per capita continues to grow.
If you’re a homeowner, the recent one-third increase in home values is a windfall. If you’re a prospective buyer, housing is much less affordable.
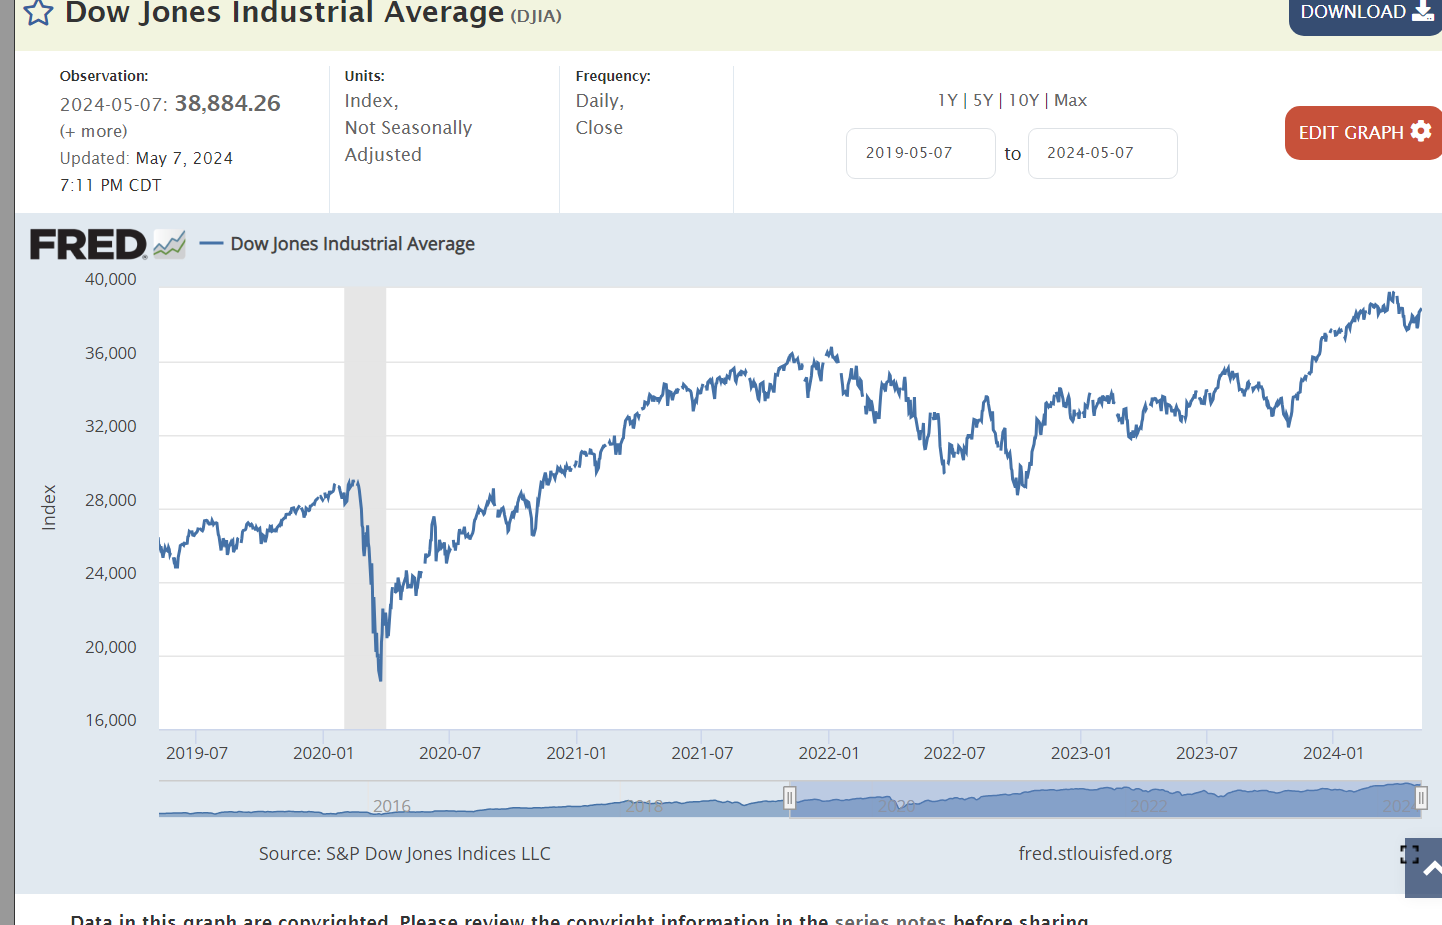
US stock market values are up 50% in 5 years.
Coincidentally (?), corporate profits are up 50% in 5 years.
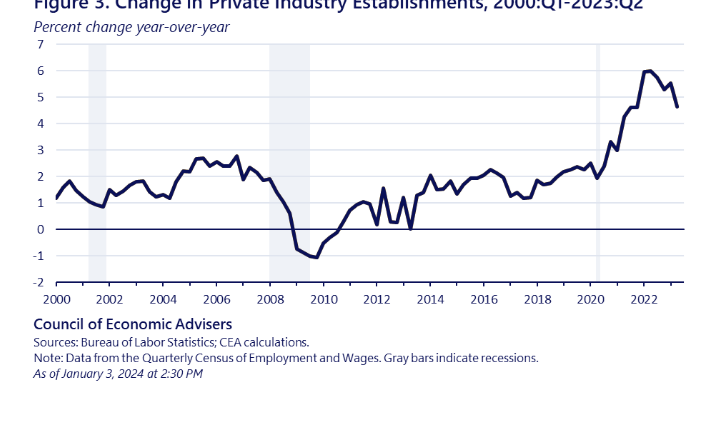
New business creation increased after the pandemic surpassing the pre-pandemic level and exceeding the pre-Great Recession level. Start-ups typically account for all job creation and ensure competition in product and service markets.
Overall productivity growth in the last 5 years has been the same as in 1973-1990 and 2007-19. In recent quarters productivity has begun to increase at a higher rate and many commentators believe that AI will drive productivity at a higher rate for the next 20 years.
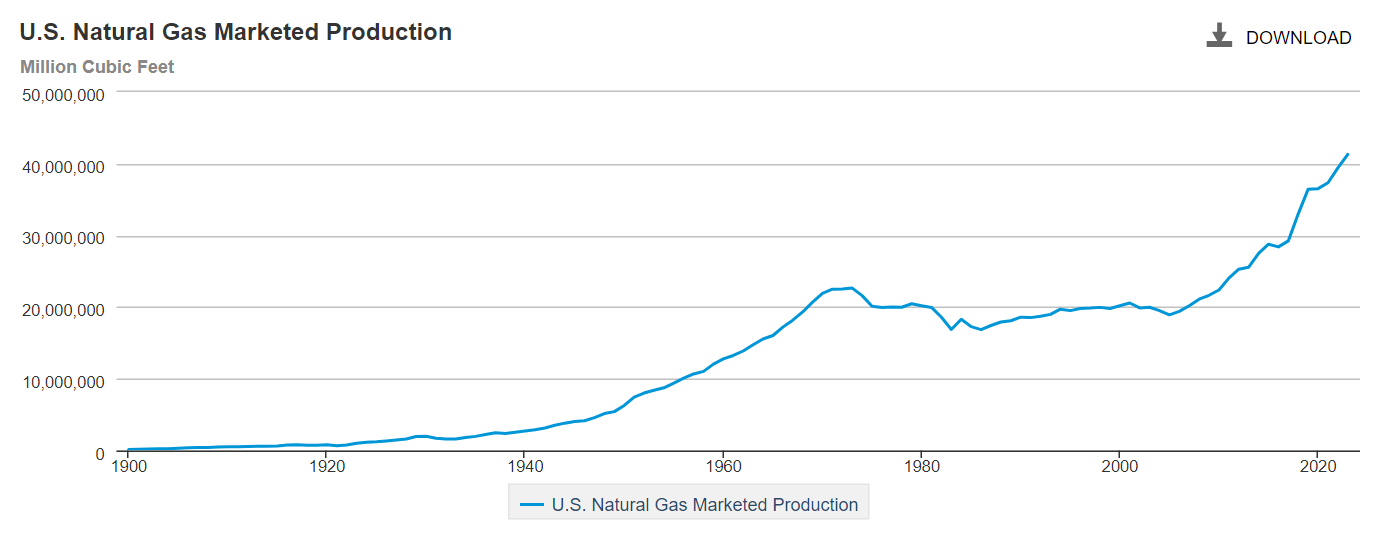
The US has achieved energy independence, doubling its production of natural gas in 20 years.
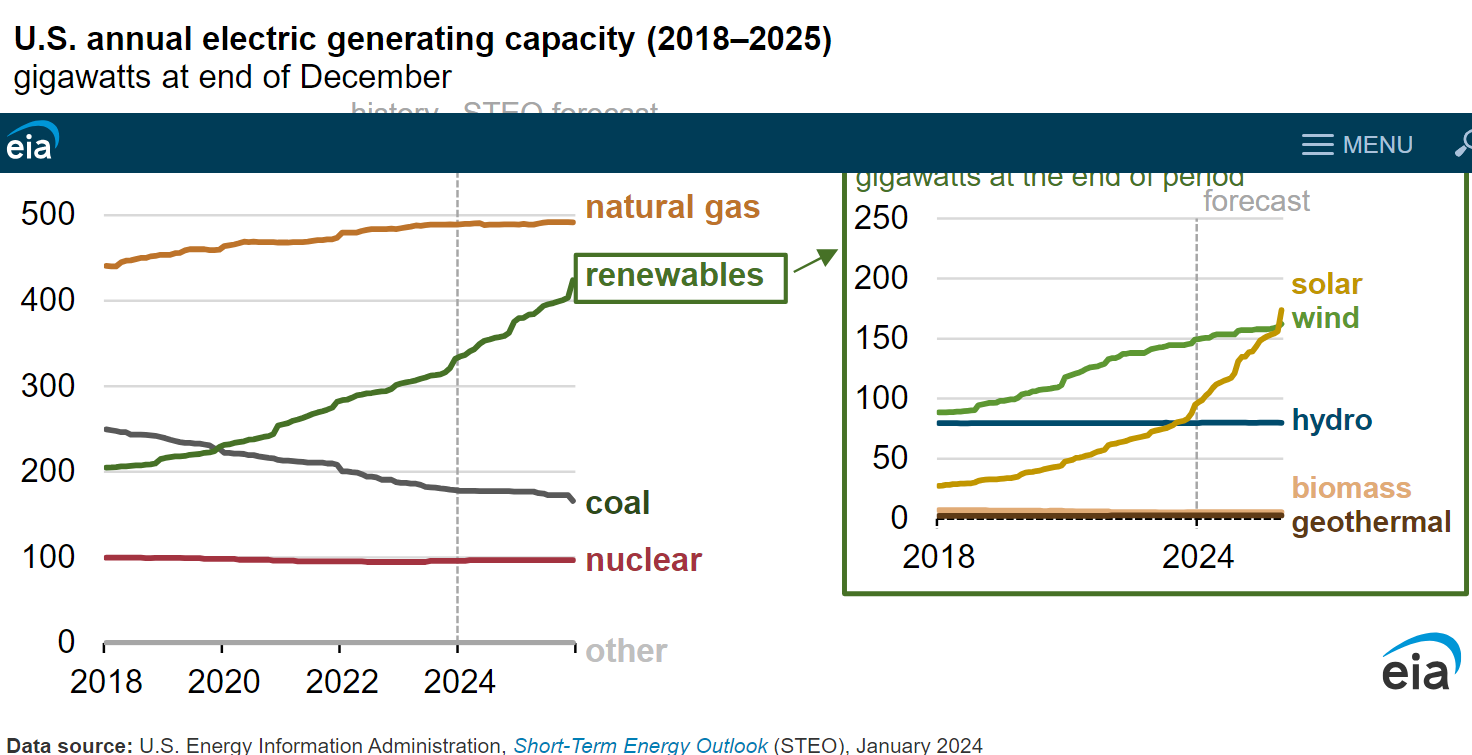
Renewable energy accounts for 22% of US energy generation.
US manufacturing employment has increased by 15% since the Great Recession. It is higher than before the pandemic despite the increase in real median wages and the increase in the value of the US dollar.
Net farm income has doubled since before the pandemic.
We have one-third more voluntary retirees in 2024 versus 2014.
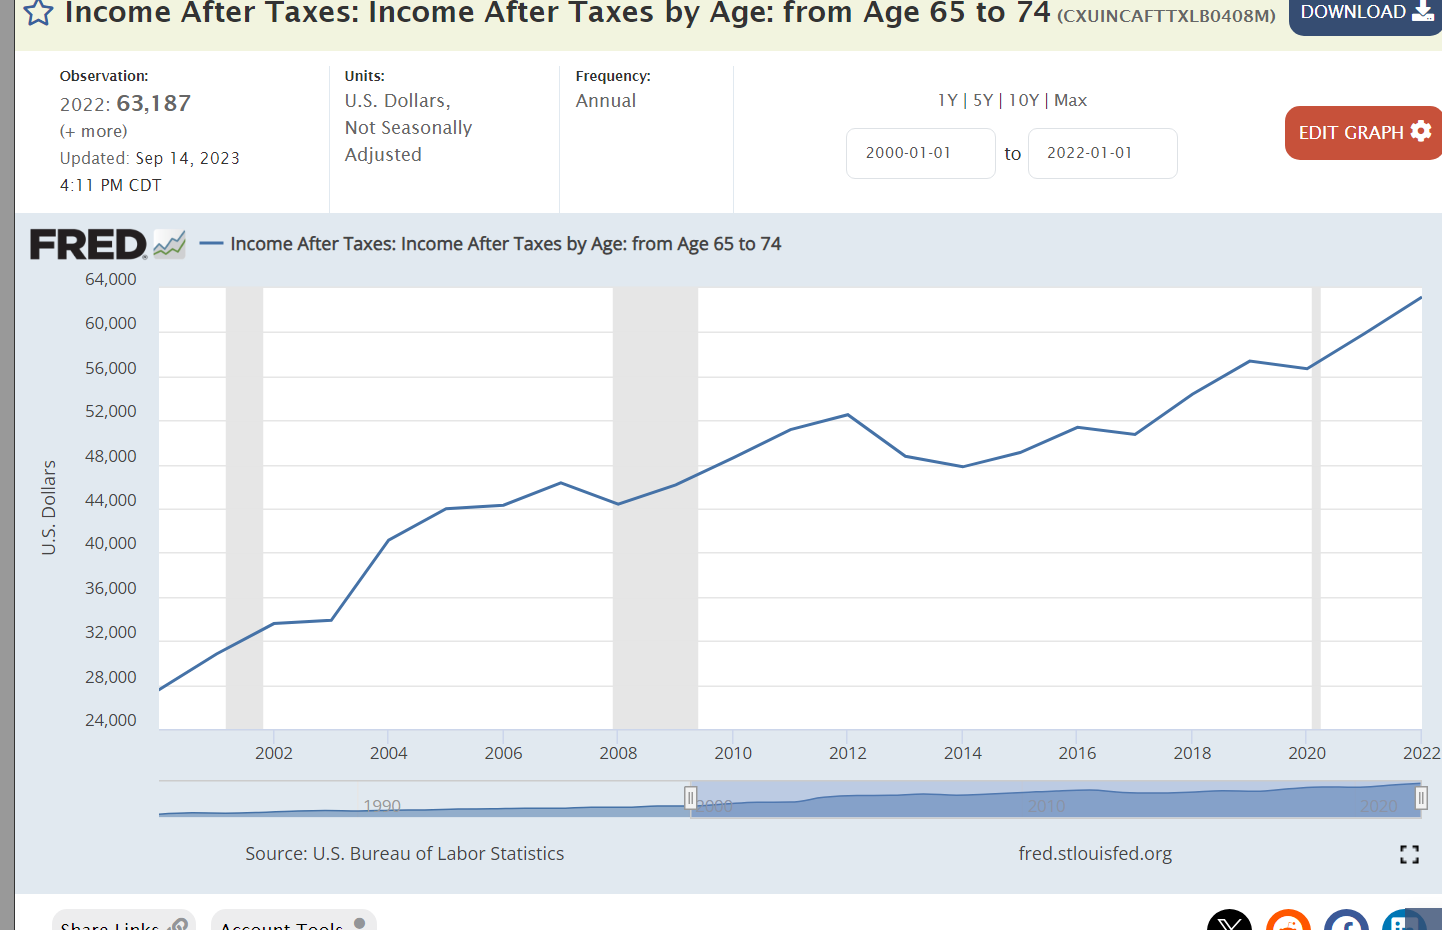
Those retirees are receiving significantly higher incomes.
Retirement assets have increased by 50% in the last 10 years.
US citizens pay very low taxes compared with their developed nation peers.
Summary
The US economy recovered from the uncertain pandemic period faster than other countries due to the combination of very loose fiscal and monetary policy. The fiscal policy boost was bipartisan. The monetary policy boost was nonpartisan. As the strength of the US recovery became apparent by the end of 2021, both Congress and the Federal Reserve Board should have reduced their stimulus levels. The FRB adapted slowly and increased rates. Congress and President Biden have not adapted.
The US economy is experiencing an extra year of excess inflation due to these actions.
It is important to look at the long-run trends and many indicators of economic health. Monetary policy in an independent Fed is effective. Fiscal policy is ineffective. Inflation is higher than ideal.
Let’s list the positive economic indicators. GDP growth, US dollar value, stock market value, exports, employment, retirees and incomes, unemployment, job openings, labor force participation, home values, corporate profits, startups, productivity, energy independence, green energy, manufacturing employment, farm incomes, income equality, poverty, generational progress, and tax burden.
The US economy continues to deliver very positive outcomes for our country. President Biden could do better on reducing the federal budget deficit by increasing taxes or reducing expenditures. Overall, his policies have allowed the economy to continue to deliver benefits.
Last July, I predicted that inflation would be “near 2% by the middle of 2024”. That is not going to happen. Let’s look at the components to assess the last year and the likely future.
Year over year inflation rate peaked at 8.6% in 2nd quarter of 2022. It was more than cut in half at 4.0% a year later in the 2nd quarter of 2023. The last 2 quarters have been 3.25%. The “easy work” is complete. The “hard work” remains.
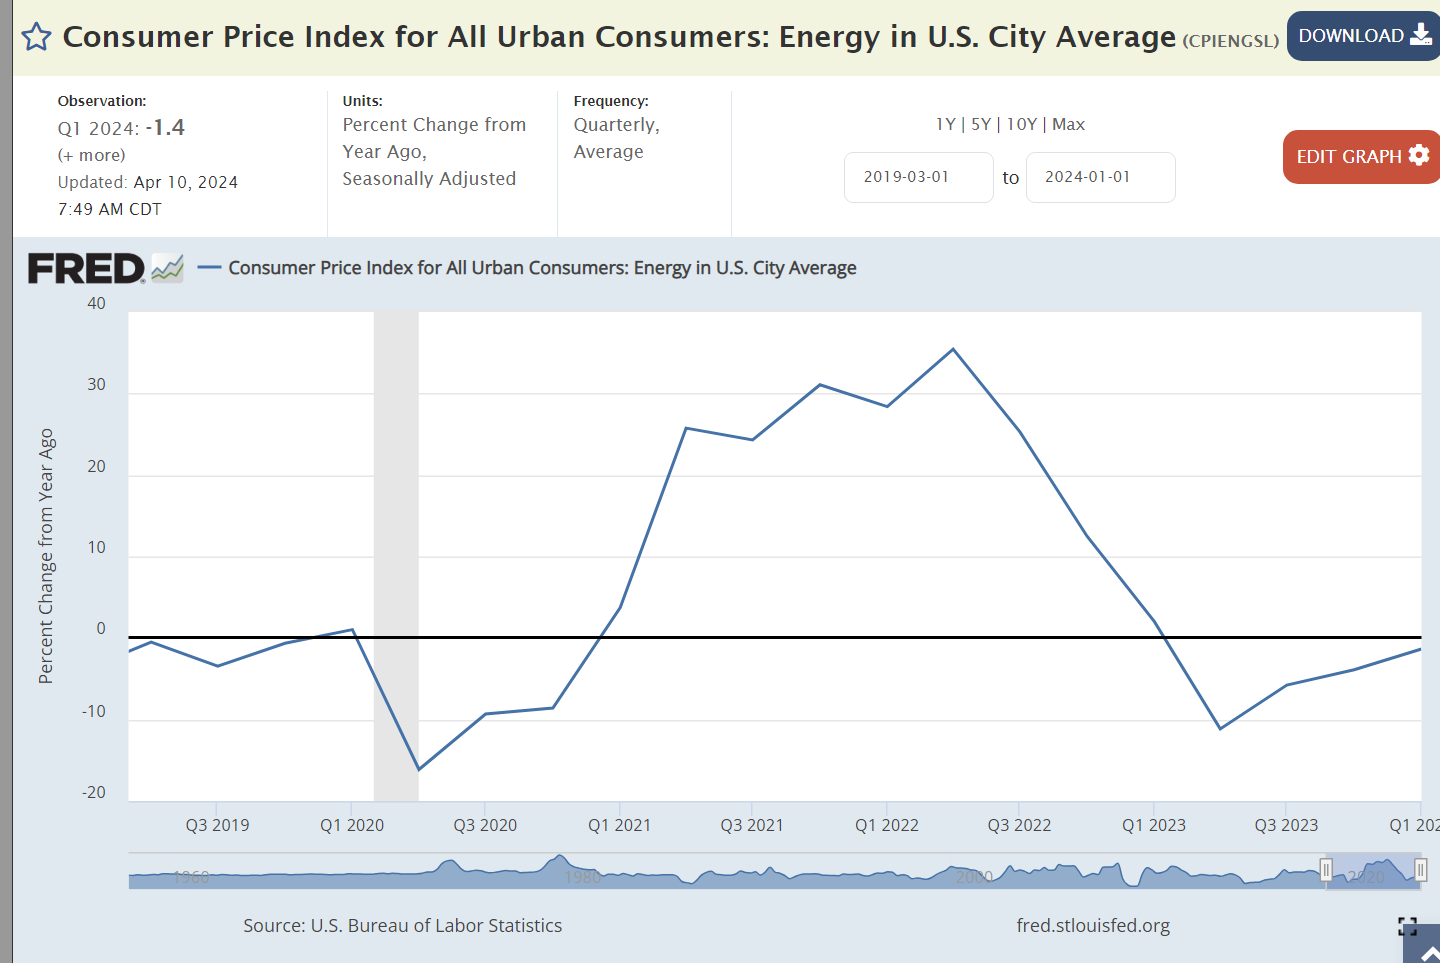
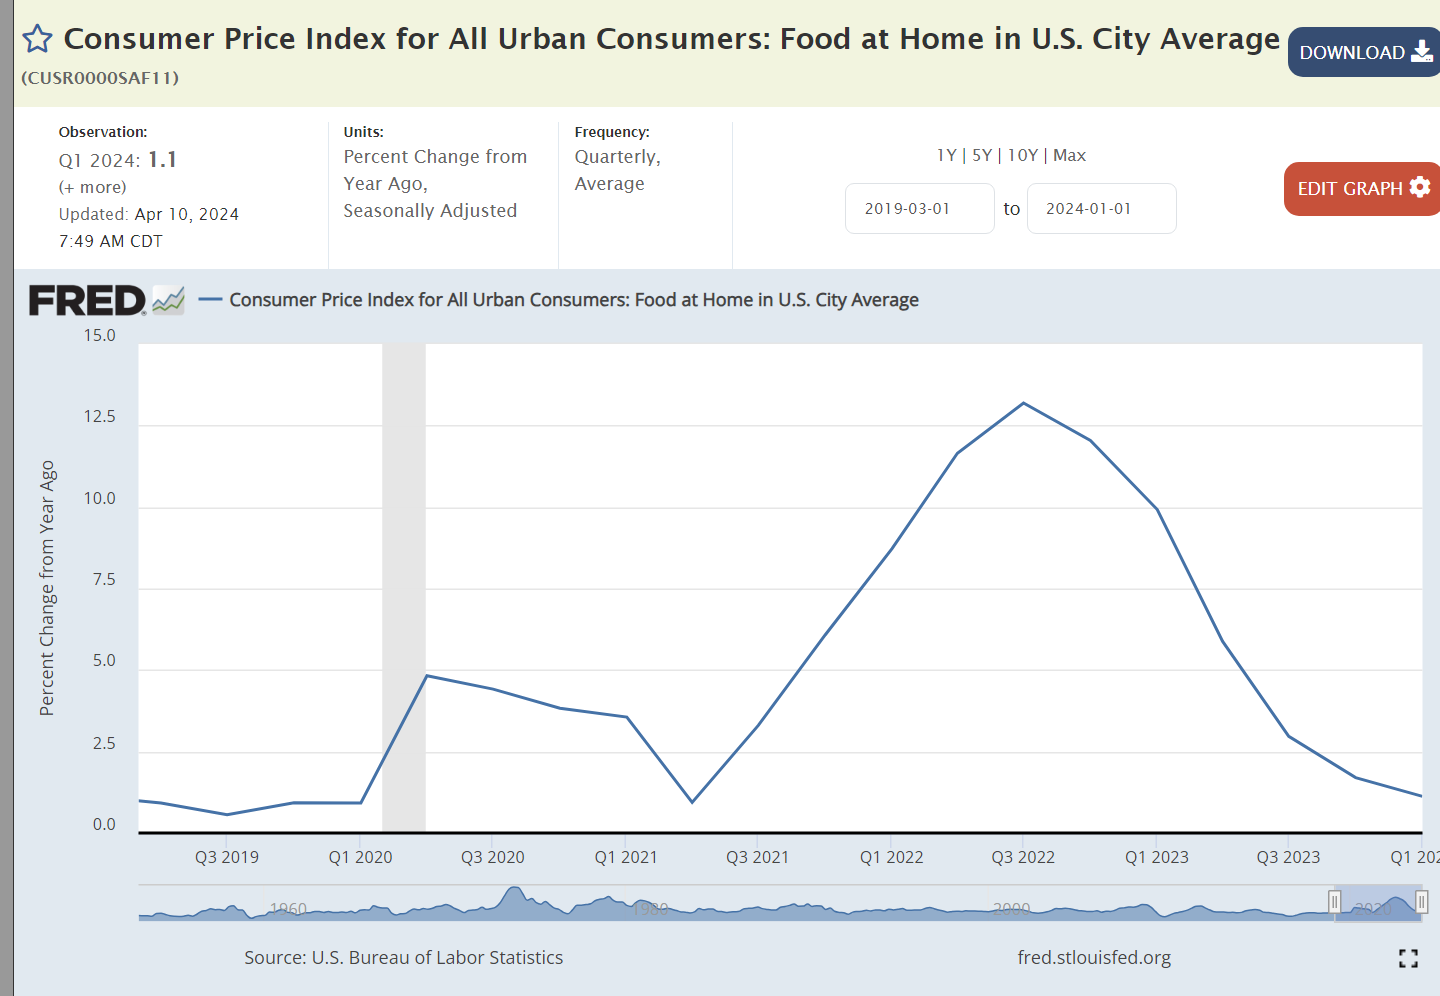
More volatile Food and Energy prices do not explain the continuing 3%+ inflation rate.
We have enjoyed energy price deflation for 3 quarters.
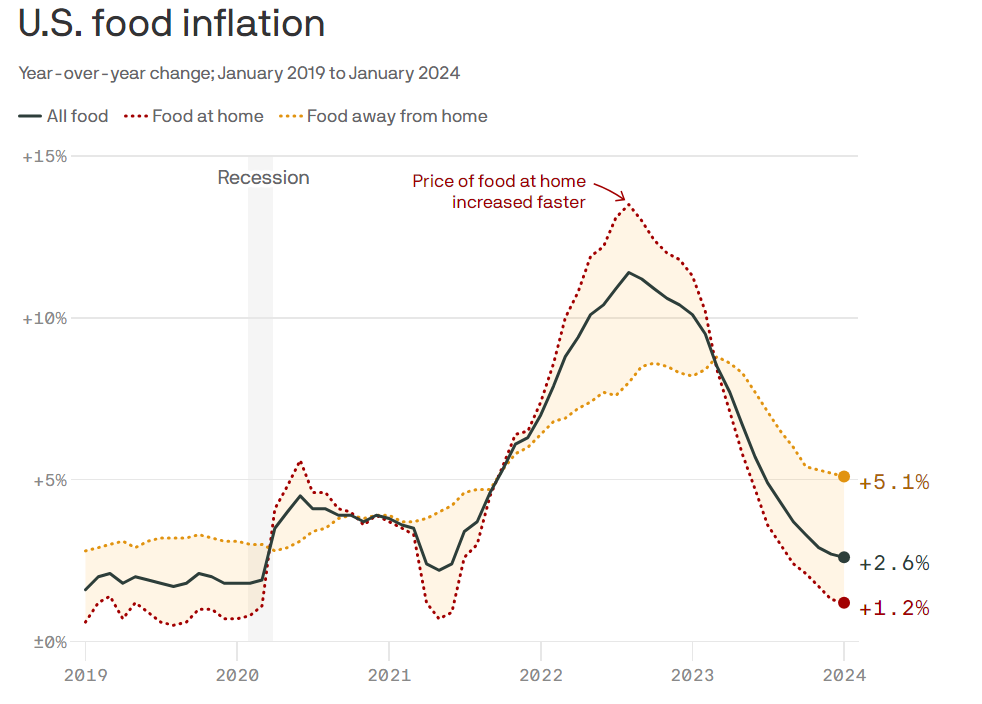
Food consumed at home prices have been nearly flat for the last 2 quarters after the 12-13% inflation during 2022.
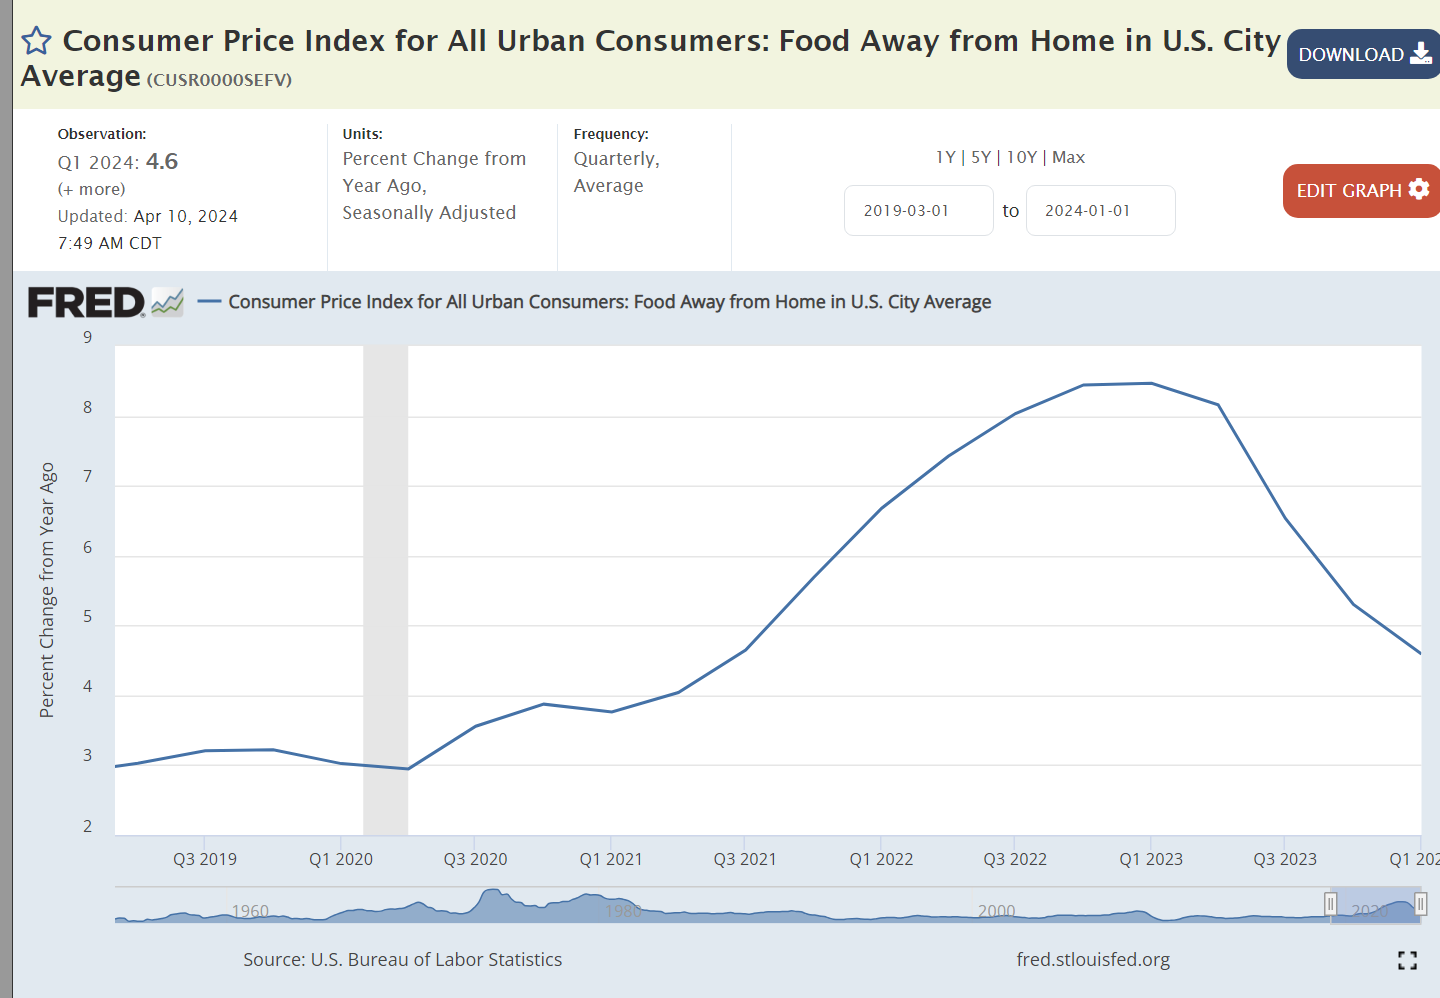
The price of food consumed away from home continues to rise at 4-5% annually. A tight labor market has increased staffing costs for restaurants. High food input costs taught them to better manage their menu prices. Many restaurants went out of business during the pandemic. Restaurants, large and small, lost money during the pandemic and are fighting hard to recover these losses. Following the lean pandemic years consumers have largely returned to their habits of eating out. This is a business sector where high aggregate demand driven by government deficit spending is creating inflation. It is not the “wage-price spiral” of the 1970’s in a manufacturing intensive economy but it is a similar situation in our retail-intensive economy.
We have enjoyed deflation in durable goods prices for 5 quarters as US and global manufacturers realigned their supply chains with more predictable demand patterns.
Nondurable goods inflation has been below the 2% benchmark for 4 quarters.
The broadly defined “services” sector at 5-6% inflation remains a stubborn problem area. It contains a number of sub-sectors with very different market conditions.
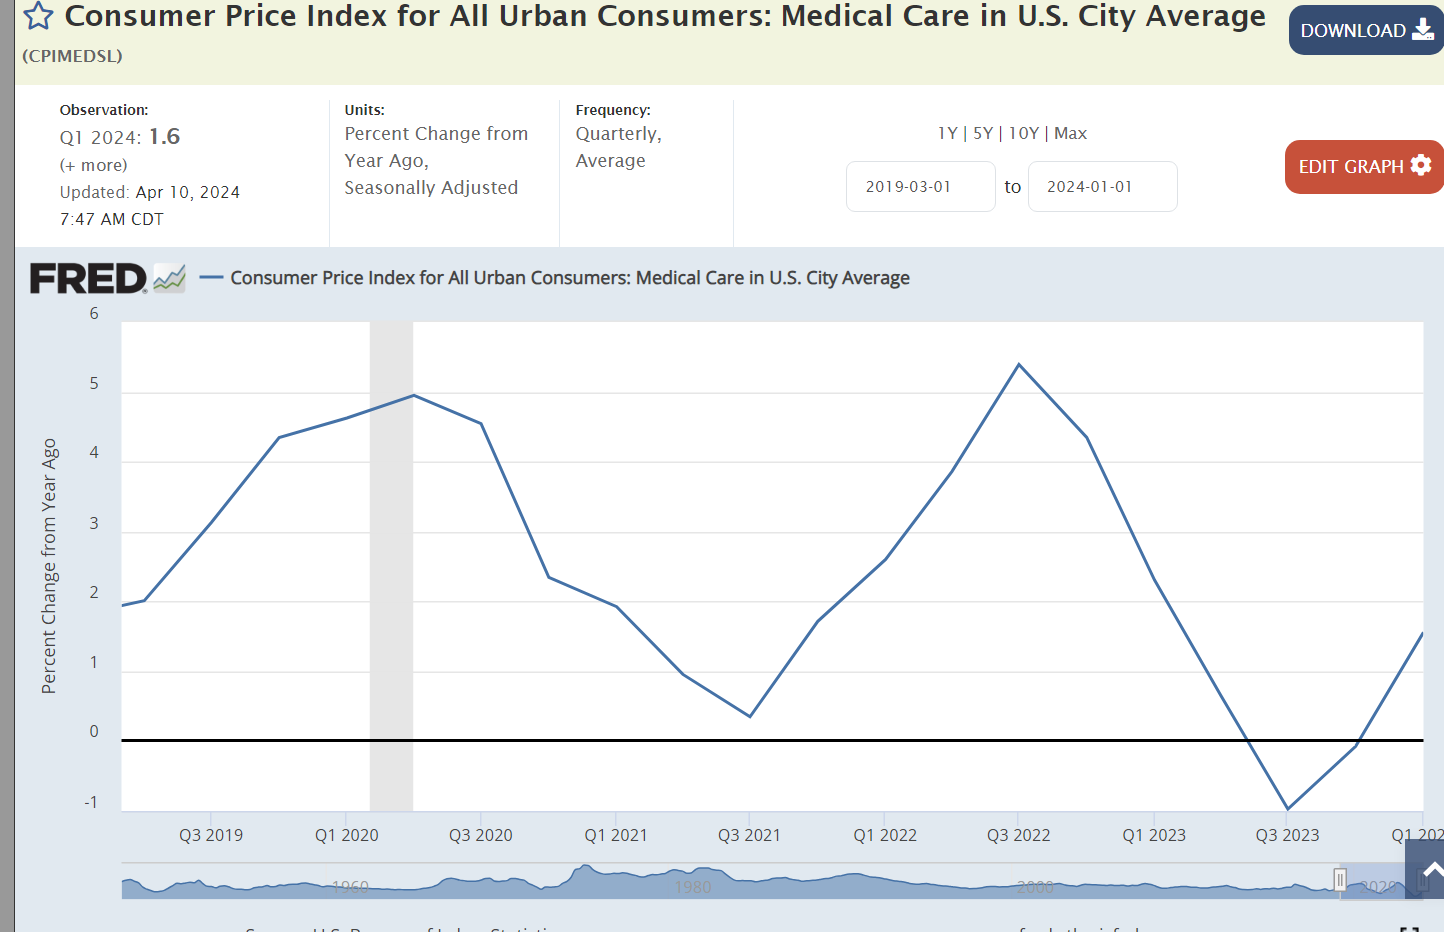
Medical care inflation above the overall inflation rate has been an issue for decades, but it has averaged just 1% for the last 5 quarters.
Transportation services prices have increased by 10% annually. This includes public and private transportation. Public sector transportation is attempting to recover from the pandemic driven decline in ridership. Private rail and truck carriers were disrupted by the pandemic as goods movements plummeted. The prospect of driverless trucks kept freight firms and drivers from returning. Transportation drivers are on the low end of wages. The overall increase in real wages at the low end of the labor market has made these physically demanding, away from home, jobs less attractive. This inflation is part long-term structural adjustment and part short-term recovery of freight flows in the economy. Transportation services is 5% of the CPI, material, but not large enough to drive the total.
The education and communications pair of service sectors has low inflation. Education is higher. Communications is lower.
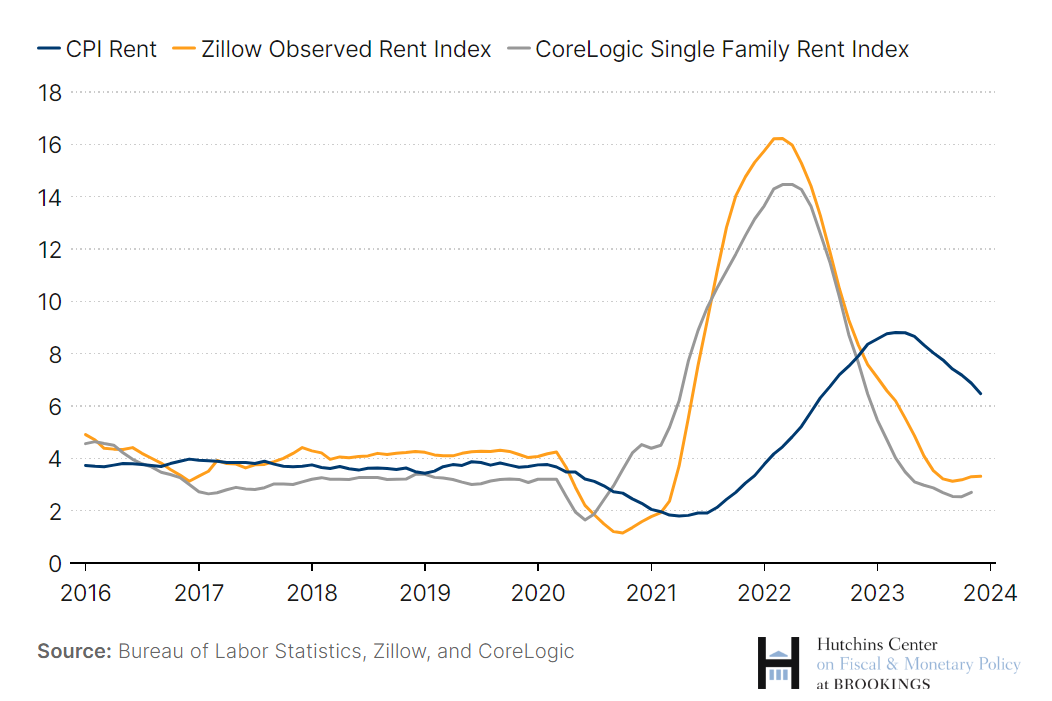
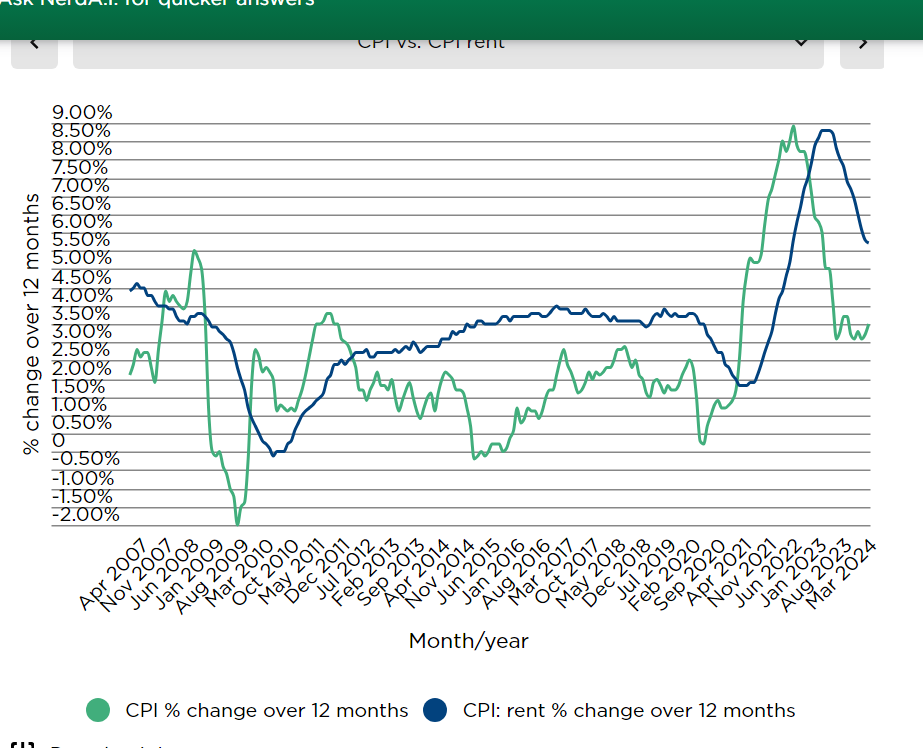
Housing is one-third of the total CPI. It is a very technical, wonky area. It combines a blend of actual rental charges and the estimated rental value of owned homes. Increases in home prices are smoothed out and their impact on the CPI tends to lag by 2-8 quarters. Housing inflation has fallen from 8% to 5%.
Housing sales prices have declined for 4 quarters. This will increasingly blend into the housing CPI, soon producing deflation rather than 4-5% inflation.
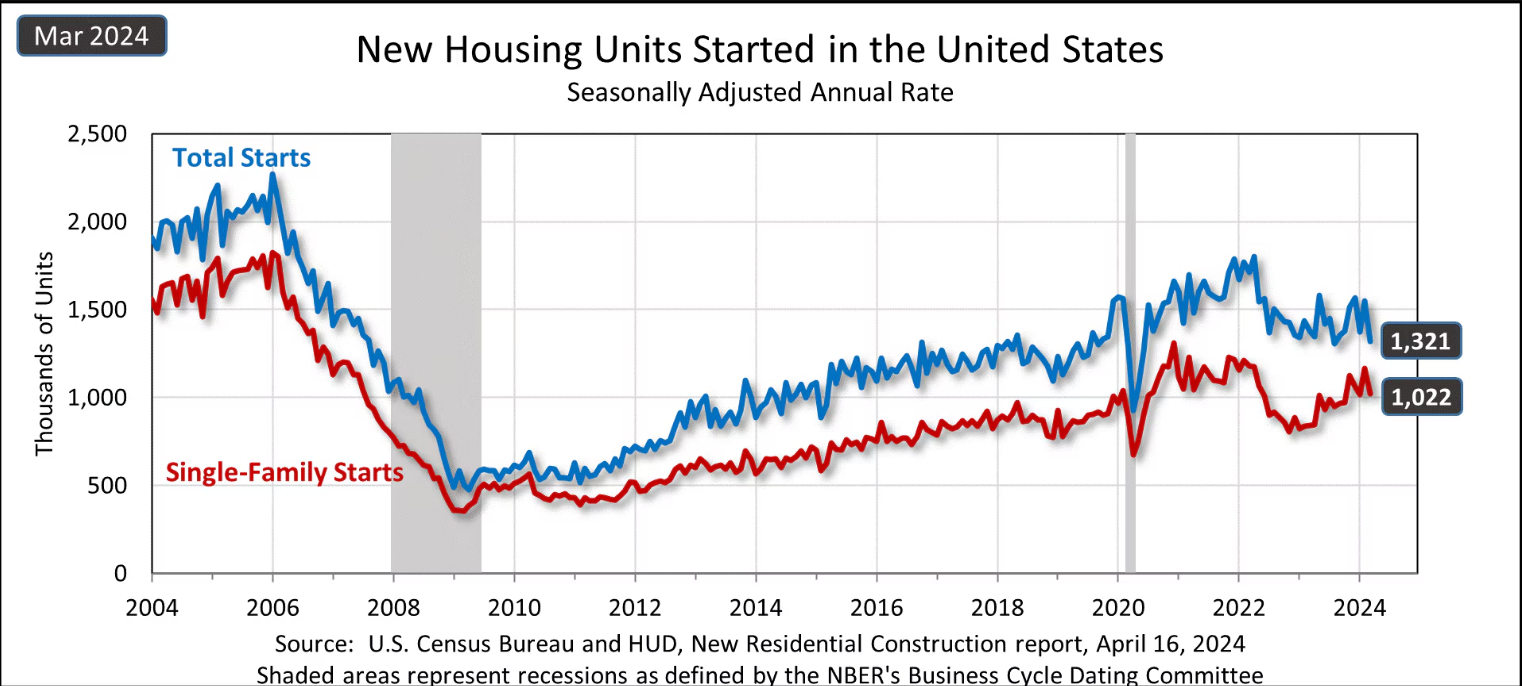
Market rent inflation remains in the 3-3.5% range based on the cumulative lack of US housing construction since the Great Recession of 2007-9. Combined with falling housing sales prices the combined housing CPI should decline to 2% by the fourth quarter of 2024.
Dreaded “cost-push” inflation is not a major factor for the US economy. A tight labor market has delivered 1% annual real wage increases for the last 5 quarters. This is a factor in inflation but not a driver or barrier to reaching 2% overall.
2024 looks like 2023, a very high budget deficit for a full-employment economy. In classical Keynesian economic terms, the aggregate demand pressure indicates continued 3% inflation.
An overheated economy typically shows a strong increase in imports as demand reaches out globally. This is not the situation in the US this year.
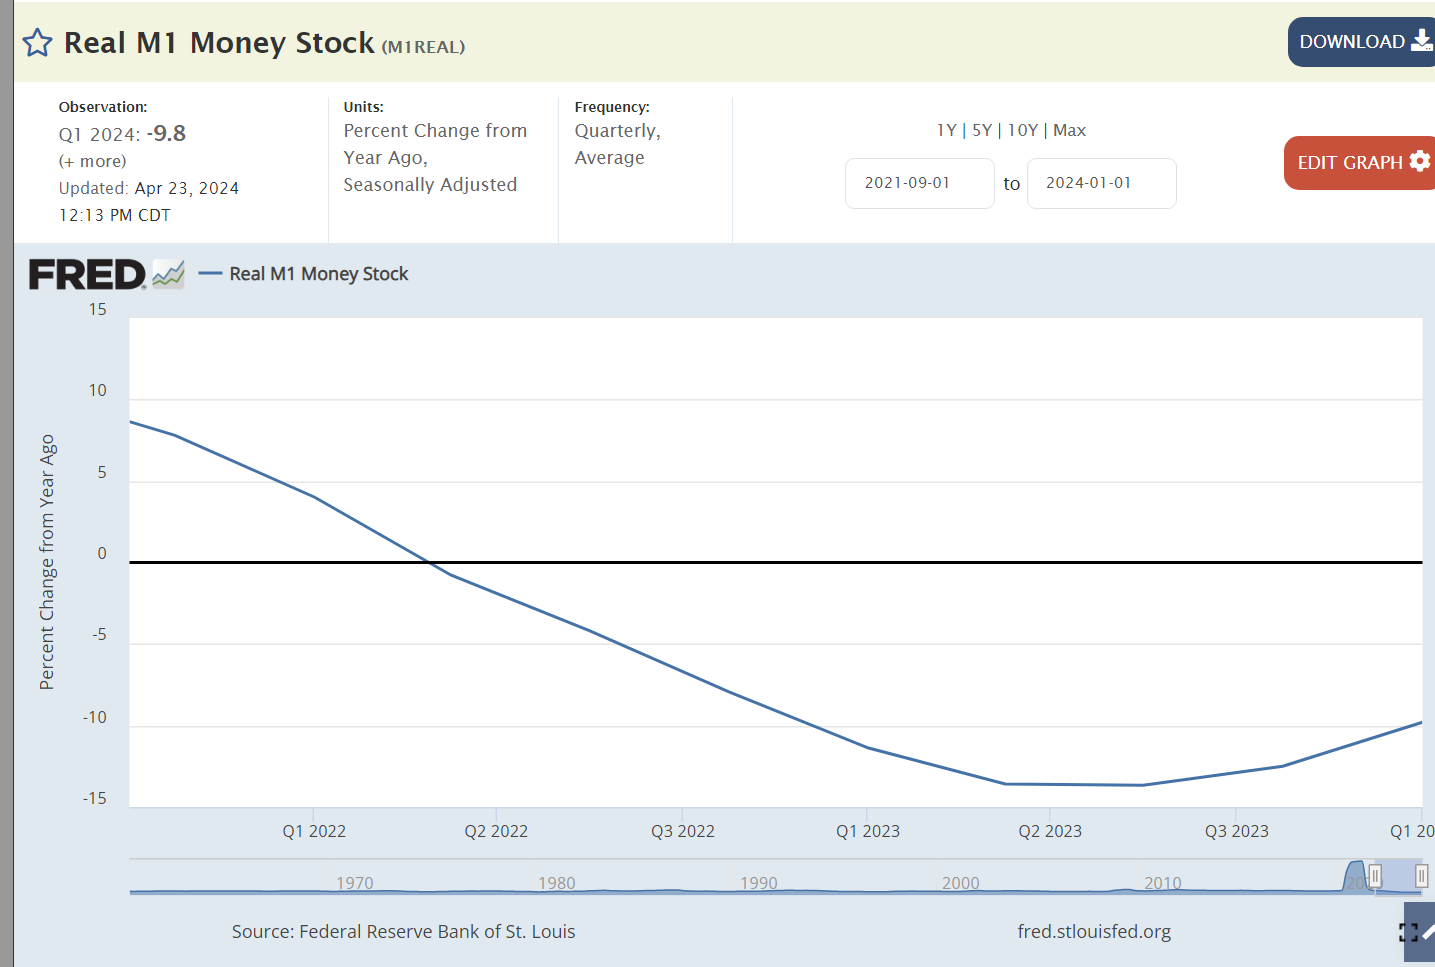
The money supply has a long-term impact on the economy, prices and inflation. The Federal Reserve Bank has been shrinking the “money supply” by 10% annually.
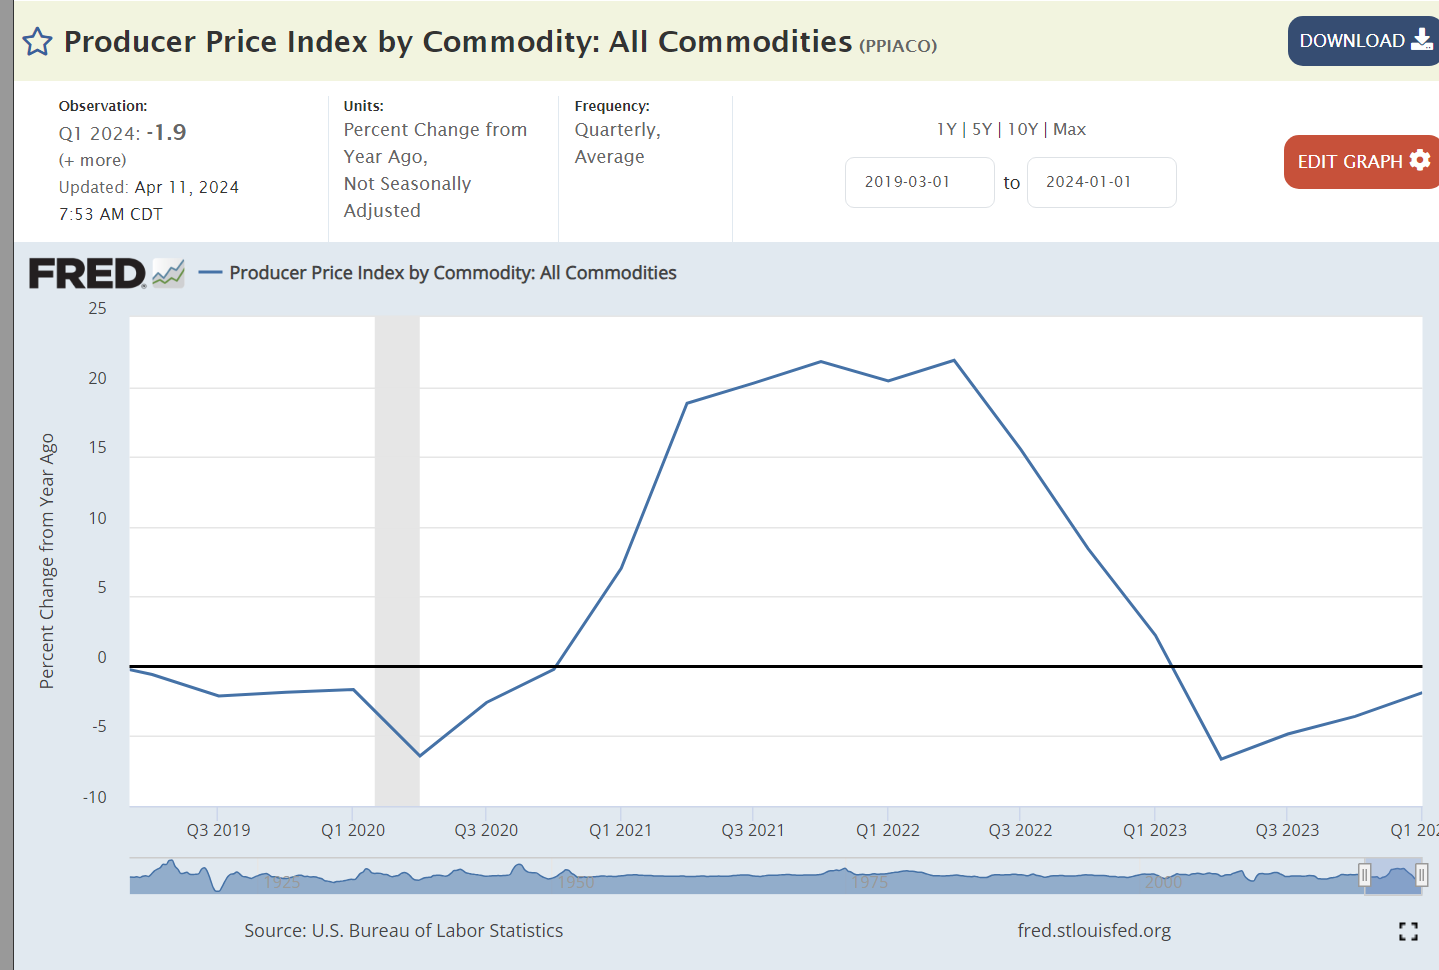
Commodities are the most volatile element of the global economy. Prices jumped by 20% with the unanticipated quick recovery from the pandemic. The last year has delivered commodities price deflation.
Changes in relative market power can drive inflation. Corporations increased profits by 50% in the first year of the pandemic. Profits have been relatively flat since then.
Summary
A dozen sectors point towards 2% inflation by year end. Energy, food at home, durable goods, nondurable goods, medical care, education/communication, housing prices, real wages, imports, money supply, commodity prices and profits.
Four sectors indicate concerns. Food away from home continues to drive high inflation.
Public and private transportation services have not yet reached equilibrium. This pressure may continue for another 4 quarters but should not be a long-term inflation driver.
The “Great Recession” destroyed the construction industry. It has slowly recovered. Total construction has increased, perhaps not enough to bring housing supply into balance with demand 15 years later. Rental inflation at 3% is likely to continue.
The federal budget deficit is the greatest concern. 6% of GDP is a huge deficit.
Net, net, I predict that the Urban Consumer CPI increase in the fourth quarter of 2024 versus the fourth quarter of 2023 will be 2.25%. The federal government spending deficit will directly and indirectly boost inflation.
The brands that are growing the fastest in the world all have this in common: they have a target audience that serves as their guide to build their brand around. These brands are able to see tremendous growth as they focus on the right community of people.
Too many churches don’t take the time to take aim before they take action with their marketing efforts and this creates waste with their resources. Don’t let this happen to you.
Get focused.
A target community allows church leaders to be effective as they build their brand because they are able to focus on those people they are good at reaching.
Let me first say this: As a church, you should welcome anyone that is breathing, because that is what God’s love compels us to do.
The point I’m making is simply that you need to have a strategic target in your approach to marketing and advertising because focus allows you to be most effective in attracting people. I like to say that confusion is the enemy of your vision.
Each church is equipped to reach certain types of people based on the leadership that is in place, the location it is in, the type of ministry it offers and the resources it has. The more clarity a church has on it’s primary people group the more effective it will be in reaching people as the brand is built around this community.
I want to let you in on a little secret: you have a target audience, whether you know it or not. Everything your church does or says is going to appeal to one group more than another. It just is. People don’t all enjoy the same kind of theology, music, decor, or preaching style. Some people like communion to come in little plastic cups. Others prefer intinction.
The choices you make are excluding people who would prefer something else. If they don’t like drums in the worship service, and your church uses drums in some fashion, you’re excluding them. If they don’t like drums but stay anyway, of course you’ll welcome them. It’s not like you’re putting a sign on the front door that says, “If you don’t like drums, go away!” But some of the choices you make will potentially turn some people off — and that’s okay.
One thing stagnant churches haven’t realized yet is that by not choosing who they intend to appeal to, the choice is being made for them. Everything from the interior design to the music is being chosen by different people using their own preferences as criteria. What you often end up with is a strange quilt of elements that might not necessarily appeal to anyone.
Wait, isn’t the Church for everyone? No, the Gospel is.
This is the number one mistake we see churches making. They assume that because the Gospel is for all people, their church is too. When in reality every Church is called to a specific group of people, like Paul was called to the Gentiles and Peter to the Jews. So your local church is called reach and minister to a certain, defined, group of people.
JESUS LOVES EVERYONE, SO DON’T WE WANT TO TARGET EVERYONE WITH OUR MARKETING?
Every single person in your city, within a fifty-mile radius… that’s your target audience. Right? If that is your mindset, you have an uphill battle in front of you. Don’t get me wrong, you certainly want to see every man, woman, and child come to know Jesus through your church. As Christians, we love everyone! But here is the crazy truth: to reach more people, focus on fewer people. Your church is going to make a much deeper impact on your community if you tailor the entire experience to a specific demographic. It seems counterintuitive, I know.
While reaching the whole world with the gospel is the mission of the Christian faith, life-giving churches recognize that the world is made up of many different audiences. Since different groups of people have quite different cultures, needs, and methods of communication, a church that intentionally tries to reach a specific group with the message of Christ, will normally be much more effective than one that tries to reach everyone with a general attempt. Every church should have a sign that says, “Everyone Welcome,” but a deliberate strategy must be in place or they will only see accidental growth.
As Christians, we want to reach and include everyone. This is our ultimate goal as disciples. However, from a specific ministry standpoint, this approach ends up reducing the relevancy of the message and spreads efforts too thin for significant impact. Afterall, a standard marketing rule of thumb states:
If you try to reach everyone all the time, you’ll end up REACHING NO ONE.
Each person, ministry, and local church is uniquely equipped and positioned to reach different types of people. Therefore, it is vital to understand who your audience is before you create content, write a single social media post, or spend any money on social advertisements. This section will help you learn how to effectively shape your messages and content to match your audience’s needs and reach them effectively, no matter their age, gender, ethnicity, location, or situation.
There’s a marketing axiom that says if you try and market to everyone, you market to no one.
It works that way in the church too. When a church tries to reach “everyone,” it effectively reaches no one. That doesn’t mean everyone isn’t welcome … if everyone isn’t welcome, you’re not running a church, you’re a private member’s club.
But just because everyone’s welcome, it doesn’t mean you should (or even can) accommodate everyone.
Defining a target audience is a marketing concept where you describe a person who is the ideal customer for a product. It helps to shape branding decisions such as colors and fonts so the designs hit the mark.
A church can use a target audience to provide clarity in the experience it provides online and in person. It creates alignment which builds trust so people decide to be part of your church.
Different groups of people have different felt needs. American firms started to cater to these groups with truly “differentiated products” in the 1960’s, 1970’s and 1980’s. American religious denominations have increasingly offered creeds, worship and experiences to meet diverse needs. By the 1990’s individual congregations began to refine their offerings and messages to match the needs of their congregations. Today, American consumers are spoiled. They expect to be served.
On the universal customer needs dimensions of QSFVIP, “I want it all and I want it now”. Quality: relevant, meaningful and entertaining sermons, worship and program experience. Speed: 45 minutes, on-line, recorded. Flexibility: multiple times and delivery channels. ”Call me”. Value: programs and message directly touch me where I live. No pledge commitment. Ala carte funding of programs. Information: no transaction costs. 6 ways to give. No pledge commitment. Personal: monitor my needs and follow-up.
In a world of such expectations, congregations cannot easily meet the expectations of everyone that visits or becomes a member. They must welcome everyone, but they are unable to serve everyone.
The marketing folks emphasize that effective organizations refine their services so that they clearly meet the needs of a target audience. This allows the marketing machine to do its magic.
Benefits of Defining a Target Market
Much more effective marketing to attract new members and retain existing members.
A consistently defined and executed set of programs, brand image and messages is more effective.
The process of defining a target market forces staff, volunteers and elders to more deeply consider the priority needs of the congregation and community.
A clear target market helps to identify, define and prioritize local mission investments.
Congregations struggle with resource allocation decisions. A clearly defined target market helps to prioritize worship, outreach, youth, children, adult, local mission and global mission efforts.
Prioritization within ministry areas is easier to do.
Able to evaluate and justify investments in marketing and outreach.
Helps to focus all programs to deliver specific benefits to meet the perceived needs of the target market communities.
A target market is needed to do effective marketing. It can also help to shape worship, facilities, programs, outreach, events, music and mission activities to better serve the congregation and the community.
Safeguards When Defining a Target Market
But wait, there is good news. Even though you focus on one demographic, that doesn’t mean you will only reach that one person type. Other demographics will also be served by and attracted to your church. I am constantly amazed by how many people don’t fit into our cultural norms. I see people that don’t fit certain stereotypes—wearing brands, attending events, or watching shows that I would have never guessed that they would like. You don’t have to worry that your church will end up only serving a specific type of person, or that everyone else will feel out of place. This is just about making your marketing specific. You will still have a well-rounded congregation, and people will still feel like they belong, even if they are outside of your defined target audience. Don’t be all things to all people, but find who you truly are and go all in with that.
Targeting a specific demographic as a strategy for church growth is problematic. It can create needless obstacles for any church wanting to have an open door. If you say you are interested in ministering to any and all people, shaping your ministry to fit just one group is contradictory.
People who are not the aim of your reach efforts will feel left out or overlooked. For instance, if you decide that your congregation will be a “family church,” focusing on children’s ministry, marriage sermon series, and small groups for couples, then singles will feel unwanted. Creating a youthful vibe that only interests millennials will make older people feel unneeded or unwanted. In targeting one group, you’ve eliminated any space for other groups.
This is one of the worst unintended consequences of the church growth movement. Many have written solid critiques of the movement and have much to say about other consequences. The most grievous is the contextualization of the gospel. And focusing on one demographic to the exclusion of others can lead down that same slippery slope.
When you direct your ministries toward one group, you run the risk of forcing every message into a one-size-fits-all box. You base every decision on that one demographic you’re trying to reach. You adapt your sermon applications to fit a perceived felt need, rather than letting the Word of God speak for itself and leaving space for application to every life situation.
There is a difference between reflecting your immediate community and targeting a specific demographic. Ultimately, your congregation will likely start to resemble the makeup of the surrounding neighborhoods. If they are homogenous, then your church will probably be the same.
Church marketing won’t work unless: We focus less on what we say and more on how we act. We realize that louder isn’t better. We look at it as relationship-building and stop viewing it as information-sharing. We talk less about how great we are (“organization-focused”) and instead deliver a message and ministry that leads to life change (“people-focused”). We realize we can’t force what we think people need until they know they need it. We reduce the number of competing messages we are trying to communicate. We know who we are trying to reach and we’ve acknowledged we can’t reach everyone. We deliver on what we promise.
Here are some mindset examples of people a church can focus on:
A church may focus on people who love music and they build an experience that is excellent around a worship experience. The church then attracts musicians and those who love to worship by coming to a corporate gathering.
Another church may focus on people who are doers and love to make things happen. They build an experience around outreach to the local community and equipping people to make an impact with their lives. They might have an emphasis on missions work around the globe so the people are able to do the most good with their resources.
Yet another church may focus on people that are business professionals. Their experience may be in line with teaching principles and having opportunities to build projects that make a large impact.
Here are a few more mindsets that a church may target:
Young parents who are in need of a guide to help them do it right
Those who desire to make a difference with their lives
Young adults who are seeking a place to belong with others who are like-minded
When churches begin going down this road, they’ll often decide that their church demographic is something like “young families.” This is a good place to start, but isn’t quite as dialed in as you would like. If you can be even more specific and say, “young families with infants” or “families with elementary-aged kids,” it’s much easier to understand how things could change to be more welcoming for them.
Some churches have had great success focusing on groups like unchurched men, musicians, cowboys, military families, etc.
Here are a few examples of a well-defined target audience: – Young couples with children under ten years old – Men between the ages of twenty-one and thirty who have a worldly past – Established professionals in their forties – Local college-aged students
When it comes to outreach and evangelism, most churches have a “target market”- an ideal audience for their services and ministry programs. Frequently, that tends to be young families, and the key decision maker for church attendance is often the mom/wife. Understanding how women communicate and make decisions regarding church visits can help you create a website designed to appeal to them. If you know women in their 30s are your target audience, don’t design a website that appeals to men in their 50s.
Nearby residents, homes built since 2000 (within 3 miles)
New city homeowners
Office corridor employees
Senior citizen center members
Adult children of church members
Local government and schools’ employees
Local hospital/medical employees
Parents of preschool enrollees.
Former members of the church.
People attending a “civility” meeting.
Parents of on-site and off-site youth sports participants
Parents of cub scouts
Local retail and restaurant employees
Young Republicans and Young Democrats
Determine Your Target Audience
The first step in reaching your audience is to develop a clear picture of who you are talking to. Begin with surface-level demographic information. Use the criteria below and fill in the information for your ministry’s target audience. Surface-Level Demographic Information:
Location
Age
Gender
Ethnicity/Language
Interests
Deep Level Characteristics:
Needs
Core Values
Shared Experiences
Motivations
Additional Insights
hese cultures are potentially endless in variety, but can include:
Platform
Age groups or generations
Gender
Language(s)
People groups: race, ethnic, immigrant v. first generation, etc.
Current location: city/suburbs/country
In school vs. out of school
Lived in a specific geolocation their whole life vs. transplant
Faith groups, life-long Adventists vs. converts vs. former Adventists/Christians
Professional groups vs. homemakers vs. working mothers
College educated vs. blue-collar workers
Offline social clubs vs. online identities and groups
To be honest, most churches today have opted to try and target a shrinking audience … adults who have some history in the church. Lapsed church-goers. The Dones. But almost every church is trying to target all of them all at the same time.
The graduated-from-college but not-yet-married group
Transitioning into the real world is hard enough for young people, so make it easy for them to get plugged in at your church. There is a lot of pressure for this group to land a good job, get their own place and possibly even find a spouse. This group needs support, so be there for them.
Married couples that, for one reason or another, do not have children
Getting married is one of the most exciting times in someone’s life. But afterward, where exactly do married couples without children fit in at church? There seems to be an abundance of ministries for families, but the church lacks in ministering to couples of all ages who don’t (or maybe can’t) have children. Don’t neglect this group.
30- to 40-year-old singles
I think from this short list, this could be the most neglected group. Maybe these people have never married, or maybe they’re divorced. Regardless, they are generally more mature in their faith (and life in general) than younger singles. And because of this, the last thing they want to do is join a small group of 20-year-old singles whom they can’t relate to at all. Men and women who fit into this group can be such an asset to a church. Hmm … and isn’t there a single guy in the New Testament who modern-day churches frequently study? Yeah, his name is Paul. Don’t ignore this group; they could be the “Pauls” of your church.
Discovering your church’s target audience can seem daunting. Still, with a few simple steps, you can clearly define and communicate with the people most likely to engage with your church digitally.
Consider the typical characteristics of the people that attend physical services.
Look at outside influences like location and demographics to determine who could be interested in your message.
Research their motivations, their relationship status, and any other vital details.
Then, create a persona for each segment of your target audience—a living representation of your ideal members.
Finally, create marketing strategies that make use of these personas and help to keep churches on-mission in spreading their message.
For most churches, the most important audience to market to is going to be your existing congregation. That’s because word of mouth is a powerful tool when marketing your church. unSeminary reports, “The fastest-growing churches in the country consistently encourage their people to invite friends and family to be a part of their church. It really is that simple.”
Think of it this way: when your friend recommends something to you, how likely are you to take their advice over the advice of someone you may not know as well? Most of us tend to trust the recommendations of people we love and enjoy spending time with.
For most churches, the primary target market is actually their current congregation. Though it may seem a bit backward, word-of-mouth advertising for churches is one of the most effective. Think about it: Most of us tend to believe the advice of those we cherish and value our time with.
When defining who makes up your church, it’s good to start by differentiating between who is your current audience and who is your aspirational audience. Your current audience is those who your services and events are actually attracting, so it’s a good idea to focus your efforts on people from this demographic. Have a look around your church, you may even have data already. What type of areas do these people live in? What’s their average age? Are they mostly families?
Your Aspirational audience is those your church want to be attending. Is your Church is is called to a specific community or neighbourhood, what are the demographics of the people?
Take a good hard look at your church and ask, “What kinds of people already attend here?” It helped me to understand people and churches immensely when I discovered the homogeneous principle. “A ‘homogeneous unit’ is simply a group of people who consider each other to be ‘our kind of people.’ They have many areas of mutual interest. They share the same culture. They socialize freely. When they are together they are comfortable and they all feel at home.” 2 People are attracted to those who are like themselves. This does not mean that you are not going to minister to those who don’t fit your desired target audience.
Focus on “Felt Needs” and Culture, Not Just Demographics
DETERMINE THE FELT NEEDS
Paul did this in his ministry. His preaching met the needs of people. Listen to him: “Though I am free and belong to no man, I make myself a slave to everyone, to win as many as possible.
“To the Jews I became like a Jew, to win the Jews. … To the weak I be came weak, to win the weak. I have become all things to all men so that by all possible means I might save some. I do all this for the sake of the gospel, that I may share in its blessings” (1 Cor. 9:19-23, NIV).
We can do no less. Unless our preaching and ministry meets the felt needs of people, we cannot succeed.
“This is the only known way to open closed minds. Gearing your message to the felt needs of any audience is the key to unlocking closed filters. In fact, extensive research and documentation confirm that ‘people will not listen to the gospel message and respond unless it speaks to felt needs.'”4
We must do whatever it takes (within the confines of biblical principles) to win the lost around us. If you live in a retirement area, you must have programs for the retired. If you live in a Spanish-speaking community, your services should be in Spanish so those coming will under stand the gospel. If you live in a baby boomer community, your worship service must speak the language and meet the needs of the baby boomers.
Jesus used this approach 2,000 years ago. “Christ’s method alone will give true success in reaching the people. The Saviour mingled with men as one who desired their good. He showed sympathy for them, ministered to their needs, and won their confidence. Then He bade them, ‘Follow Me.'” 5 Every ministry in the church should be examined to see if it is meeting the needs of the people you are trying to reach.
People no longer fit into neat categories, so we must connect with them on a more profound level, transcending the standard marketing demographics of age, ethnicity, gender, language, location, and interests. If you can dig deeper, your audience will be loyal to your brand because you resonate with them at their core.
The best way to do that is to investigate their needs, experiences, values, and perceptions. Conducting surveys and interviews is one key way to collect more information. Then start asking yourself questions that will help you to get inside the minds of your audience members. What motivates their actions? What makes them who they are? What do they have in common? How can I speak and write in a way that my audience will find relatable? What do they value? What do they actually need?
Examples of needs may include: a spiritually supportive community, affordable education, employment, affordable medical care, safe spaces for their children, mentorship opportunities, a better future, healthier relationships, self-improvement, Christian guidance on real-life issues, food security, or practical life-skills training.