The New College trustees could benefit from reviewing the actual current state of affairs. It’s easy to caricature New College as left and woke, indoctrinating students and not preparing them for careers. The college might take a random sample of students who graduated in 2012, 2002 and 1992 and summarize their experience, education and career results to provide some perspective.
I’ve taken my own non-random sample of 13 students from my time at New College: 6 that did a state legislature internship with me, 6 roommates/housemates and me. I’ll share their New College graduation status, major, senior thesis title, other education and quick career highlights.
Stephen Duprey. 1974. Public Policy. “The Concept of Representation”. JD, Cornell. New Hampshire State Representative. Investor. NH State Republican Party Chairperson. Advisor to many presidential candidates.
Josie Coster Martin. 1978. Political Science. “Candidates and the Mythic Presidency”. Republican New Hampshire State Representative. US House and Senate staff member. Lobbyist and communications director for a half-dozen national associations, including Pharmaceutical Research and Manufacturing of America (PhRMA). VP, Communications, Steward Health Care.
Darcy Ashman. 1978. International Relations. “Neighborhood Action”. Masters, International Relations, Fletcher/Tufts. DBA, Organizational Behavior, Boston University. Prolific author of academic papers. 30 years as project manager and consultant to international agencies. Recently, Technical Director, Management Systems International.
Betsy Crabtree. 1978. American Studies. “Split Seeds”. Recently President, SF Arts Media and Board Chair, Head-Royce School.
Janet Weisenford. 1977. Public Policy. “Things We Dreamt We Died For”. Masters, Public & International Affairs, U. Pittsburgh. 20 years Navy program manager. Senior Director, ICF Consulting.
Rick Kint. Music and IT. BM, Music, George Mason. MS, Info Systems, George Mason. Systems engineer, including a decade at Google.
Tab Uno. Political Science. BS, Political Science, Utah. MPA, Public Administration, Utah. MSW, Social Work, Utah. Therapist, licensed clinical social worker, candidate for Utah House of Representatives.
Bridget Patton. 1978. Economics. “A Direct Test of the Tiebout Hypothesis”. law courses, CWRU.
Julia Carrasquero. 1978. Political Science. “Chief Justice Warren’s Legal and Socio-Political Theory”. Legal and post-grad studies at Sanford University. 30-year Army veteran. Training supervisor.
Glenn Hendrix. 1982. Political Science. “Islam and Politics in Egypt and Iran”. JD, Emory. Chair, Atlanta law firm Arnall, Golden Gregory.
Jane Marie Pinzino. Humanities. PhD, Religious Studies, U Pennsylvania. Humanities Librarian, Tulane U and Earlham College.
Tom Kapostasy. 1978. Economics. “Determinants of Migration”. MBA, CWRU. CPA. Executive finance and operations roles.
Summary
Some serious academic work in this sample. Ten of 13 completed New College degrees and defended their senior theses. Eleven added graduate degrees, a professional certification and other post-graduate work.
We have an arts executive, therapist, librarian and home professional, somewhat aligned with the New College stereotype. But we also have an international consultant, systems engineer, lawyer, investor, lobbyist, accountant, salesman, Navy program manager and Army trainer.
New College in the 1970’s had little “wokeness” and no “indoctrination”. Given the opportunity to focus on relevant coursework, we were highly engaged in learning and building learning skills. We argued politics. The faculty made sure that we always looked at multiple perspectives. There is always “room for improvements”, but I urge the trustees to apply their critical thinking skills to the current situation.
Florida governor and presidential aspirant Ron DeSantis decided that my alma mater, 700 student New College in Sarasota, Florida needs a makeover. He appointed 6 new trustees and expressed his desire for the publicly funded liberal arts college to be overhauled to better provide for the public good and to eliminate “woke” policies, practices and culture.
New College was founded in 1964 as an alternative private college with an innovative program of study emphasizing personal responsibility for learning using all available resources without the usual bureaucratic constraints. Private New College was folded into the University of South Florida in 1975 and eventually set up as New College of Florida, branded as “the honors college” of the Florida state university system. New College’s very low student faculty ratio (7-1 to 10-1) has made it an inherently costly investment. In 2021 Florida politicians introduced bills to fold it into some other state university. A new president was hired in 2021 to help the small college re-evaluate its academic, financial and political strategies in order to re-establish its long-term viability.
The college has continued to attract very high potential students, its graduates have a truly enviable record of graduate and professional study and fellowships, but its 5-year graduation rate is low versus comparable schools and its graduates disproportionately pursue academic, not-for-profit, small business and other non-traditional career paths so that the average measured financial success of graduates is not competitive with schools which produce students who pursue more conventional professional careers.
I hope that the 6 new trustees will invest some time to analyze the “current state” before seeking to overhaul, makeover or revolutionize the curriculum, culture, faculty and leadership. I believe that there is a large overlap between what really matters at New College historically and today and what conservative leaning Florida politicians, citizens and voters value.
The Individual Matters
New College curriculum and culture emphasize the central role of the individual in making life choices.
Personal responsibility for the student’s program of study is at the heart of the curriculum.
Freedom of thought is honored. Left, Right or Center. Various shades of left.
Humility. Great thinkers among classmates, professors and writers. Chances are good that your views are not “simply the best”. In a post-Freudian world we only “know” so much. Many have a “piece of the truth”. Pride is risky.
Authenticity. Consistency. Self-awareness. Embracing feedback and interaction.
Ideals Matter
Ideals matter. The unexamined life is not worth living. Politics, community, philosophy, religion and spirituality matter. Dead serious. It’s important to proactively explore options and make choices. Evaluate choices versus experience, data and new frameworks, paradigms and world views. Individuals are responsible for developing personal philosophies.
Growth and Learning Matter
College provides an opportunity for tremendous learning in many dimensions. So much to learn. Consider all possibilities. Personal quest. No limits to growth. The journey matters. There is no end to growth and learning, so develop those skills. “Still there’s more”. Embrace feedback and interaction, even when it hurts.
Community Matters
Community of learners and seekers of knowledge, wisdom, truth, beauty and meaning. Small scale community where “everybody knows your name”. Forced to interact and be authentic. Academic discipline and profession matter. Generation matters. Groups matter. Politics matters. Service matters.
Character Matters
Classical philosophy focused on “living a good life”. Authenticity. Humility. Respect for others. Openness. Personal responsibility. Tolerance/acceptance of differences. Dead serious. Excellence. Merit.
Competency Matters
Demonstrated learning. The Western Canon. Mastery. Results. Achievement. Research. Critical thinking. Written expression. Debate. Progress. Examination.
Creativity Matters
“Both/and” perspective. Multiple intelligences. Multiple perspectives. Interdisciplinary views. Paradigms. Two cultures. Theory and practice. Local and global.
Founded in 1964
The post-war economic expansion was followed by a culturally conservative 1950’s and then concerns about the role of the individual in a world where big business and big government dominated. World War I and World War II shattered simplistic modern expectations of “progress”. Romanticism and utopian socialism were in decline. Cultural critics worried about the sameness of suburbia, the organization man, the man in the grey flannel suit and “the lonely crowd”. Existentialist philosophy was very influential at the time. I think that New College’s curriculum and culture were shaped by this founding period. Existentialism focused on the individual in a different way than Ayn Rand, but clearly on the individual. The key insight was that “in spite of” the challenges provided by modern knowledge and society, an individual could move forward (maybe).
The relation between the individual and various communities was a clear focus. The contrast between existential “existence” and the historical emphasis on “essence” by philosophers and religions alike was unavoidable. The “solution” was to study, learn and grow, while accepting that final, deterministic answers were very unlikely. The best a person could do was to work through life considering the conflicting viewpoints and holding on to whatever he or she thought was best. This is a fundamentally “liberal” view, even if many/most of the implications greatly support historical conservative views that aim to preserve individual character and institutions.
Unavoidable Conflicts Between New College and Modern Conservatism (The Rub)
Rejection of civil and religious authorities. Belief that the individual must choose (and live with the consequences).
Inherently a “relativistic” perspective. There are many ways to frame situations, decisions, politics, religion, etc. No one view, perspective or paradigm is clearly correct. Individuals may embrace fixed perspectives but should accept that others might make different choices.
The classic western canon of received literature and science continues to evolve. There is value in having “everyone” share in the study of “the classics” but diverse perspectives also have an important role to play.
Individuals belong to many “communities of limited liability”. The nation or church does not automatically take dominant priority.
The global community and priorities may be as important as the national and commercial perspectives.
No one deterministic religious perspective is fully adequate.
Individual “rights” compete with the community’s rights and interests.
There is an intolerance of “intolerance” by left-leaning institutions like New College and its students, faculty and leadership.
Summary
New College was founded in the early 1960’s within a culture that raised up the individual in contrast to the conformist social norms of the state, community and businesses. Yet, it was a child of the US which embraced individualism even as it promoted patriotism. The New College curriculum and culture which I experienced in the 1970’s and which largely continues today supports this individual centered model of learning and personal growth. Most of the curriculum and culture is compatible with classic conservative views. Some of the beliefs are incompatible with more fundamentalist conservative views. New College has recently become a pawn in the national “culture wars”. I hope that the trustees will see the very positive role which New College can play in helping a small share of students to wrestle with the difficult questions posed today and contribute mightily to society.
The relationships between firm size, age, growth, survival, death, locations and job creation and retention are many, complex and politicized. However, the core relationships expressed in my 2 recent posts are well supported by data and theory. I’d like to share more background information.
The 10-year job survival rate for startups is roughly 80% and has improved in the last 10 years. However, the FIRM survival rate is much lower. The surviving firms, through economic natural selection, grow rapidly from a low (4 average employees) initial base.
This study of 2011-14 highlights the initial start-up job surge, followed by 10 years of net job attrition and then modest net job growth by mature firms when low firm death rates (5%) are exceeded by decent levels of net jobs added.
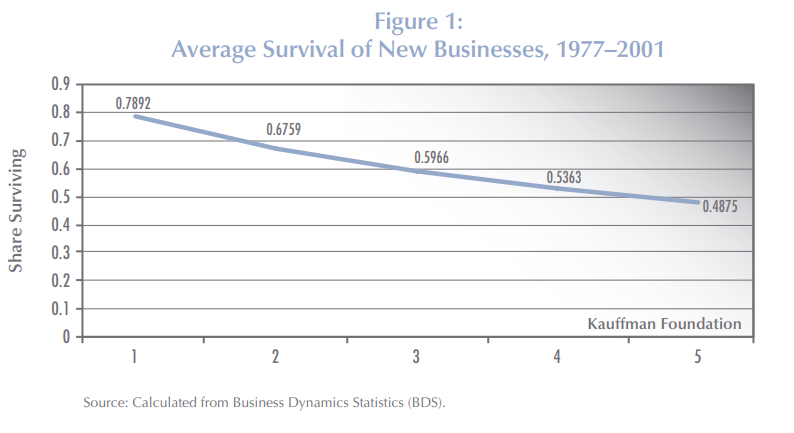
The Small Business Administration (SBA) reports the average firm survival rates for 1994-2019 as roughly two-thirds for 2 years, one-half for 5 years, one-third for 10 years and one-fourth for 15 years.
My review of the 10-year data confirmed the 33% rate for most of the period, with an increase to 36% for firms that began after the Great Recession in 2010-12.
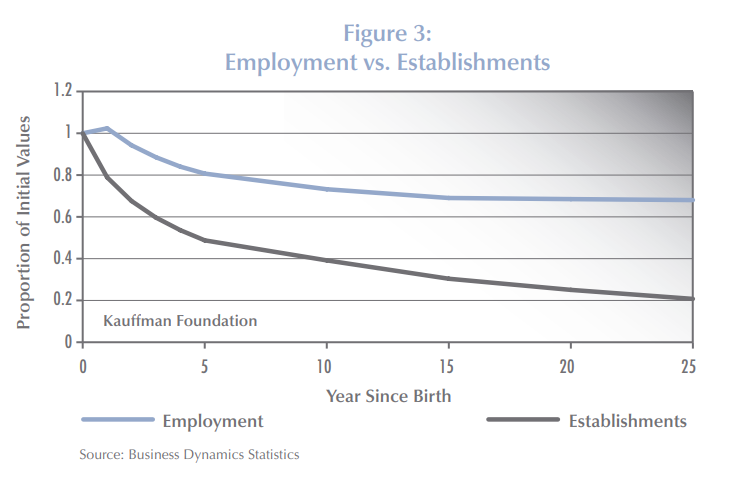
In 2010, Kauffman Foundation researchers summarized the detailed Business Dynamics Statistics (BDS) data, showing the relatively slow decline in net added employment from 100% initially to 80% at 5 years to 70% at 15 years and the rapid decline in the surviving firms rate to one-half at 5 years, 40% at 10 years and just 20% at 25 years.
Another Kauffman report from 2010 shared similar results. The universe of firms is dominated by young firms because the cumulative attrition makes “mature” firms quite rare.
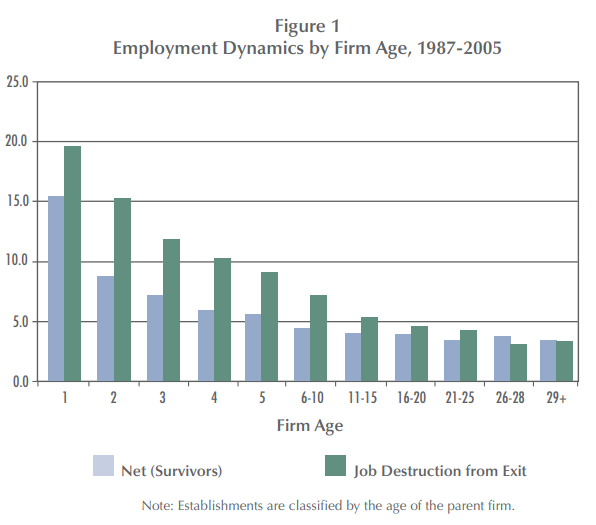
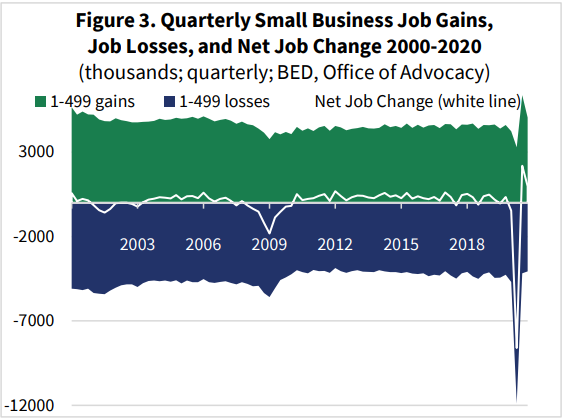
Another Kauffman report in 2009 summarizes this competition between dying firms killing jobs and surviving firms adding jobs. In the first 5 years, the firm failure rate is so high that it overwhelms the high job growth rate of those successful startups. In years 6-10, the death rate is still winning, but the total net job destruction is much smaller. For this 18-year data set, firm deaths exceed added jobs at every age, although 29+ year-old firms basically break-even. This is a critical insight when thinking about the claim that all or nearly jobs are added by startups. It is “true” due to the firm survival and jobs added rates at different ages. It is possible to have quite different results, with existing firms accounting for relatively more jobs, but that would require either the firm/establishment death rates to fall or the job creation rates of surviving firms to increase significantly. It looks like there has been some of that change after the Great Recession. This chart also helps to show that the “net, net” addition of jobs from start-ups, when considered as the sum of their first 5 years is in the 75-80% range, because the net jobs lost in those early years is only 5% per year, despite the more rapid loss of firms.
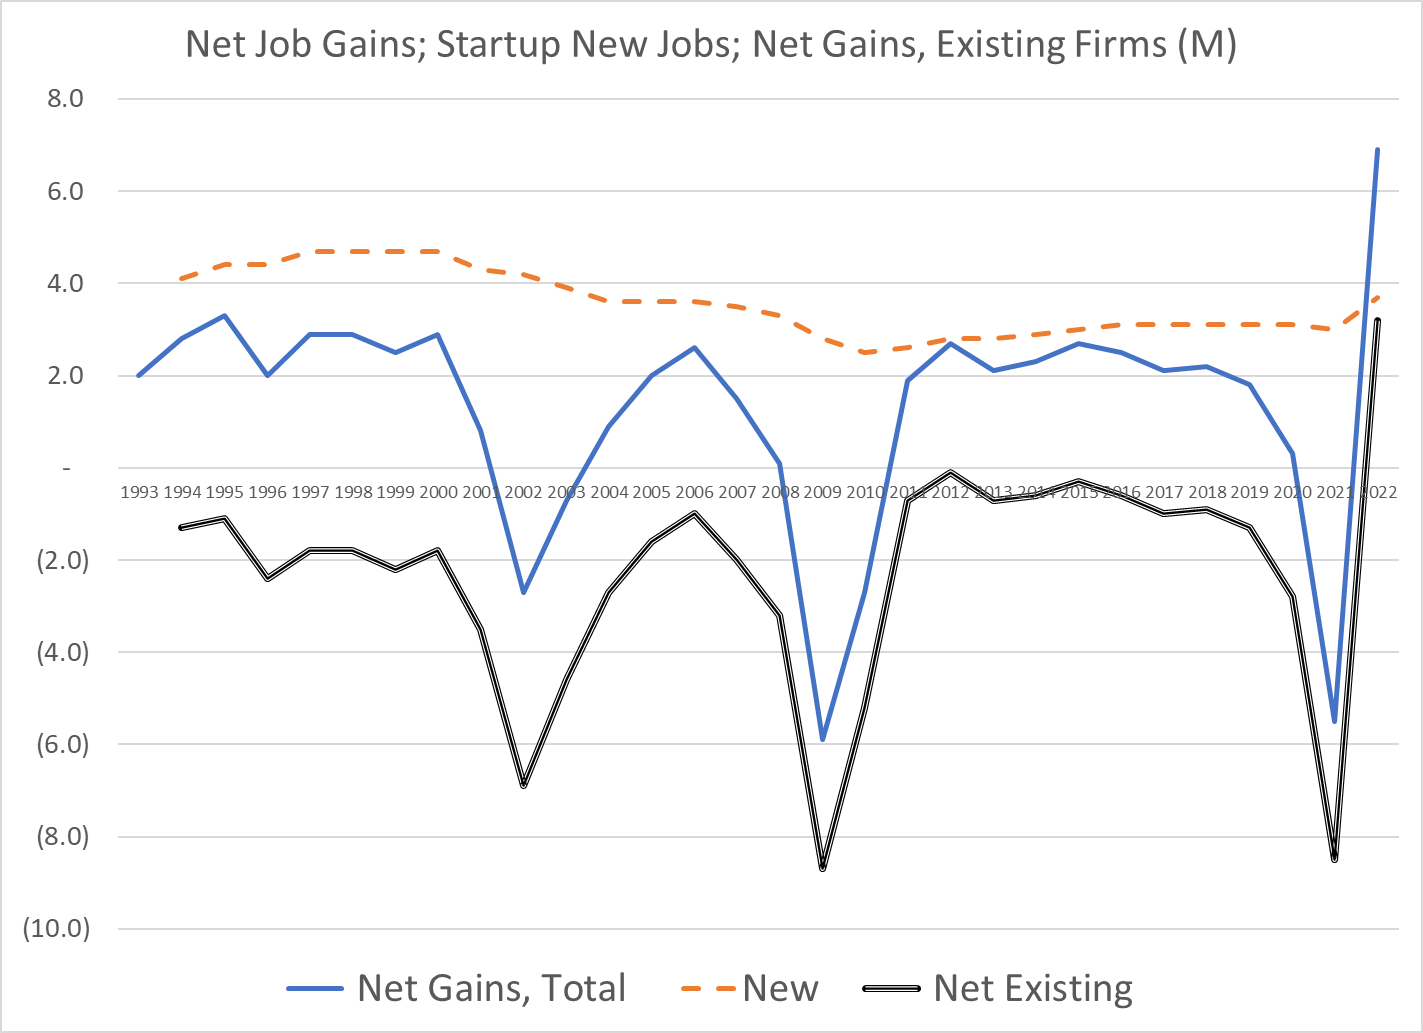
My summary of the last 30 years of data shows that startup firms do account for “all” new job growth. As others note, in a way this is almost “by definition”, because this is the only age group that only has “adds”, but no “losses”. It always must be positive. As we’ve seen in the details on job departures/hires, jobs created/lost, firms created/lost and establishments created/lost the positive and negative flows tend to be “roughly equal”. Hence, even a single year which is not burdened with an offset will stand out as the “big winner”. So, on the one hand we can discount the critical, essential, vital role of startup job creation, but we can’t ignore it. It is a necessary part of the life cycle of firms that delivers a growing economy.
The 2010 Kauffman study combined the initial jobs created with the jobs lost in the next years to emphasize the vital role of startups, using 2007 data. Mature firms also made a small contribution to jobs added.
A follow-up report in 2011 by Dr. Haltiwanger summarized the data slightly differently but tells the same story. New firms, nearly all “small”, account for almost all job growth. Other small firms destroy jobs in their first 10 years at a high rate and as mature firms at a modestly high rate. Middle-aged firms lose jobs while successful firms grow to more than 500 employees and become large firms! Young large firms add a few net jobs. Old large firms lose a small percentage of jobs for this time period (1992-2005).
The central takeaway remains valid with more recent data across industries. The initial growth of jobs is not offset by the net losses in the next 5 years. Firms more than 6 years old do not add jobs overall.
I don’t know how to reconcile these competing claims but expect that the time periods chosen, and firm sizes chosen, are keys to understanding the significantly different claims.
In the early papers the Kauffman Foundation explains that it is new firms that drive new jobs. There is an overlap between new firms and small size that makes an analysis based on size alone appear to say that “small firms create most new jobs”; but the “newness” logically comes first. Existing small employment firms tend to shed jobs through firm death or internal job reduction.
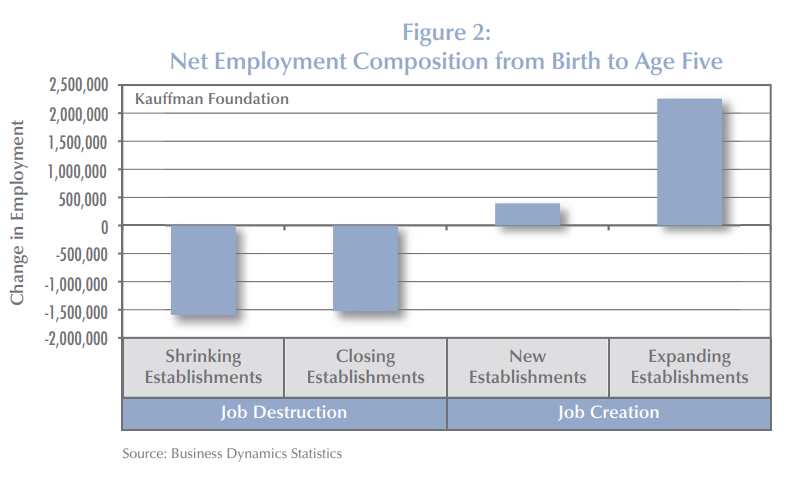
A simple model focuses on just the first 5 years of a firm’s life after the initial startup year and defines four buckets of job growth and loss due to adding new establishments or experiencing deaths versus internal job growth (up or down) at the survivors. All four buckets matter. New establishments are infrequent for startup firms. Deaths are a major job killer. Job creating firms outweigh job losing firms. But the net gains from internal job growth is less than the drag from firm deaths.
Kauffman also created a complete theoretical model of job changes through time based on the key parameters and demonstrated that the model was a good match with the observed relative consistency of the parameters and the net output of jobs created. In a prior life, we called this the “layer cake” graph, using it to explain the composition of revenues or profits in a business based upon the year of customer contracts signed or new products introduced. At any point in time, there is a history of additions of various ages. Employment tends to decline over time based upon the combination of firm deaths, establishment gains/losses and internal job growth. Each year a new group of firms is added, all with job gains in the first year. This group too follows the pattern of job erosion in the first 5 years, smaller erosion in the next 5 years, close to break-even by age 20 and small net job creation for the mature surviving firms. Again, the parameters could be different, and the results would be different. But this framework provides economists and statisticians with the tools to analyze the components.
Another author created a dynamic model which illustrates how this process works through time.
The Small Business Administration promotes the view that small businesses (less than 500 employees) are essential to the US economy and create a majority of all jobs. As noted above, startups are the key. Size is a byproduct.
In my earlier post I discounted the importance of the decline in the share of new to total firmsbecause the corresponding decline in failure rates and improved job creation by mature firms was still delivering solid annual job creation. However, this warning signal is worth monitoring together with the other measures. The Brookings Institution provides some other “warning signals” about the health of the new firm/job creating capacity of the economy in light of reduced measurable competition in many industries (a topic for another day).
New firms account for a smaller share of total employment.
Business formation takes longer. Recent Kauffman reports shows that this trend has continued.
The entrepreneurship rate of college educated Americans has fallen most significantly.
One professor analyzed this and concluded that it was the result of American firms taking advantage of the low cost of capital and paying the higher salaries and incentives needed to attract and retain high potential employees. He says that job creation is happening more in existing firms and less in startups with no negative overall effect. He says that “marginal” (low return) entrepreneurs have been removed with little negative impact on the economy as a whole.
The slowdown in the new firm/job creation rate after the Great Recession attracted much attention from the media and politicians. Two representative articles are listed below, mostly bemoaning the decline of startups/small firms and the relative growth of large firms.
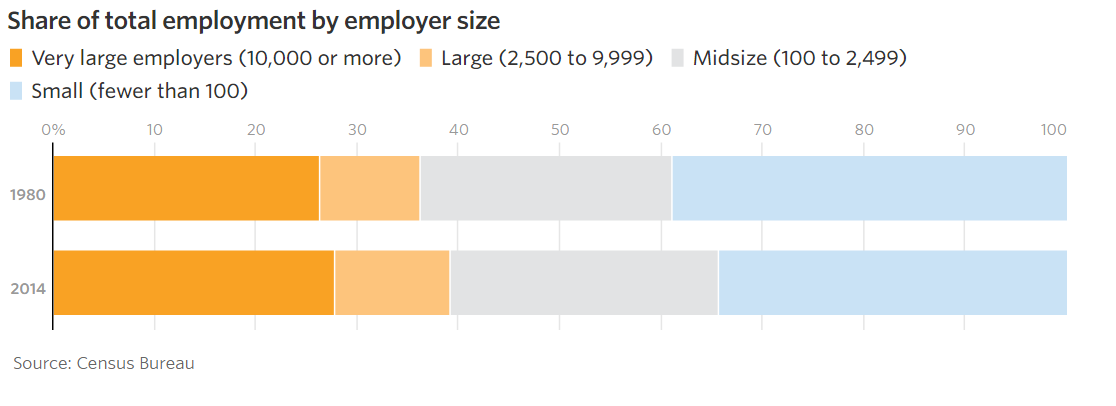
With the renewed emphasis on small firms and public policy to support them, others have responded by emphasizing the benefits of large firm growth and questioning the need to support/subsidize small firm growth.
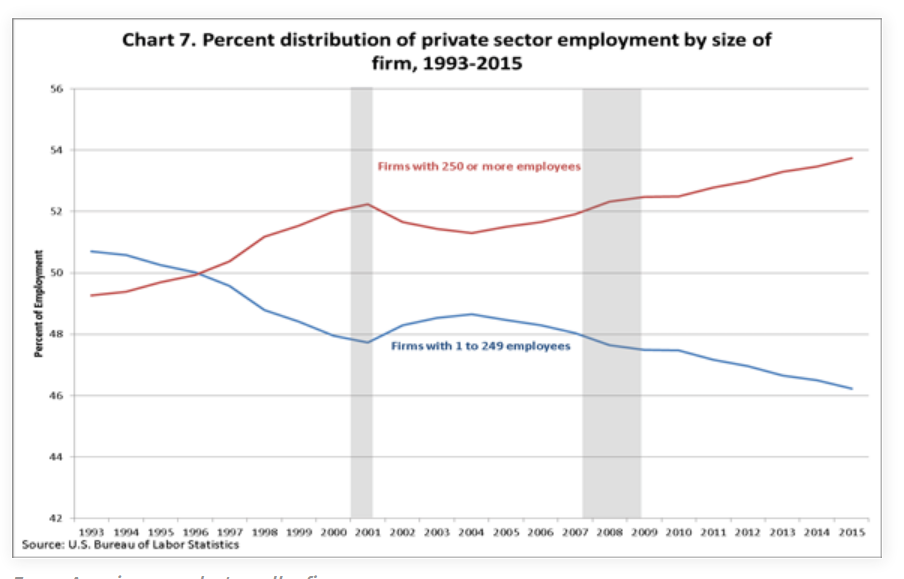
Using less than 250 employees to define “small business”, this article shows a 4% decline in small business share and 4% increase in large business share.
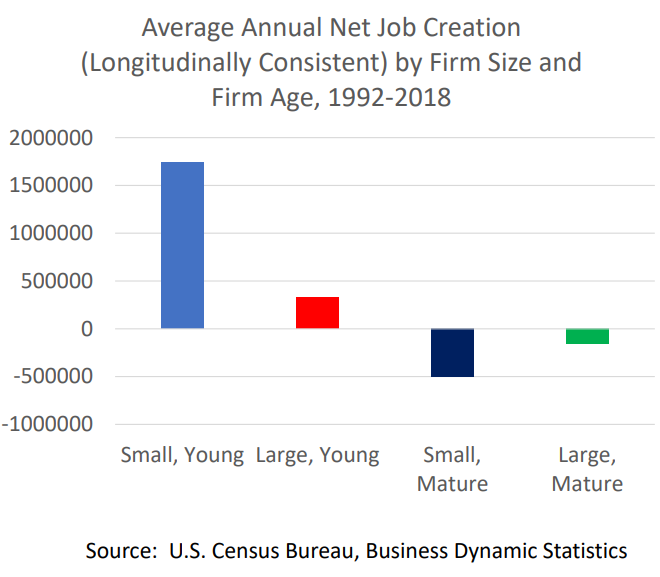
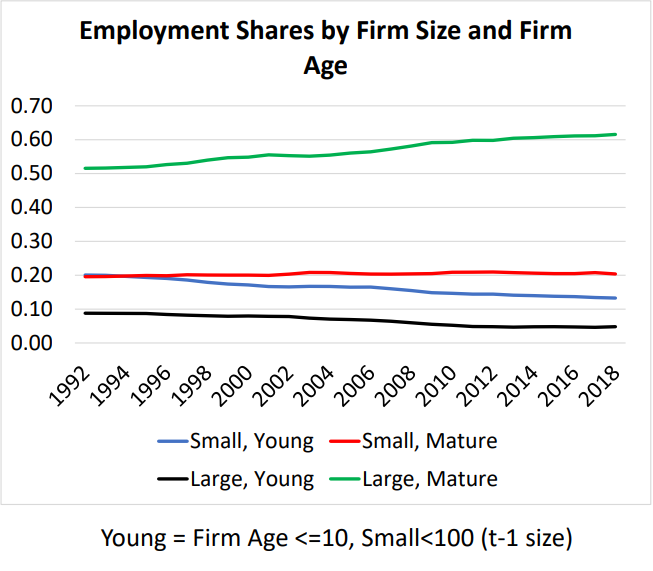
Professor Haltiwanger reports that large, mature firms have increased their share of total employees from 50% to 60% between 1992 and 2018. Both large and small young firms have lost offsetting market share.
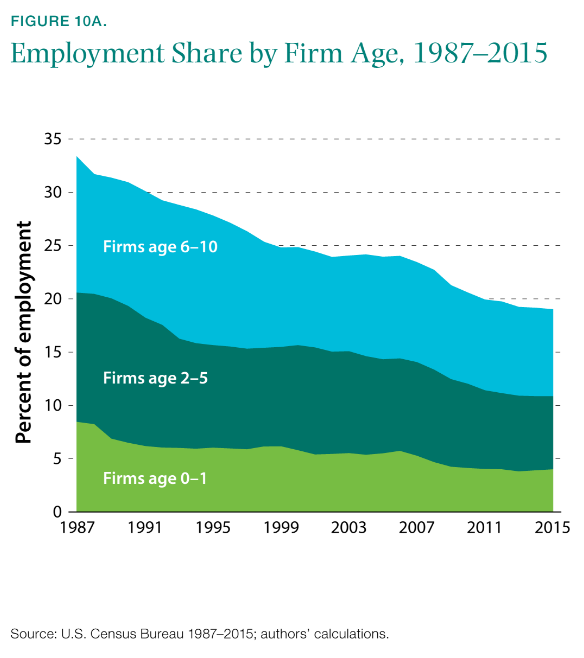
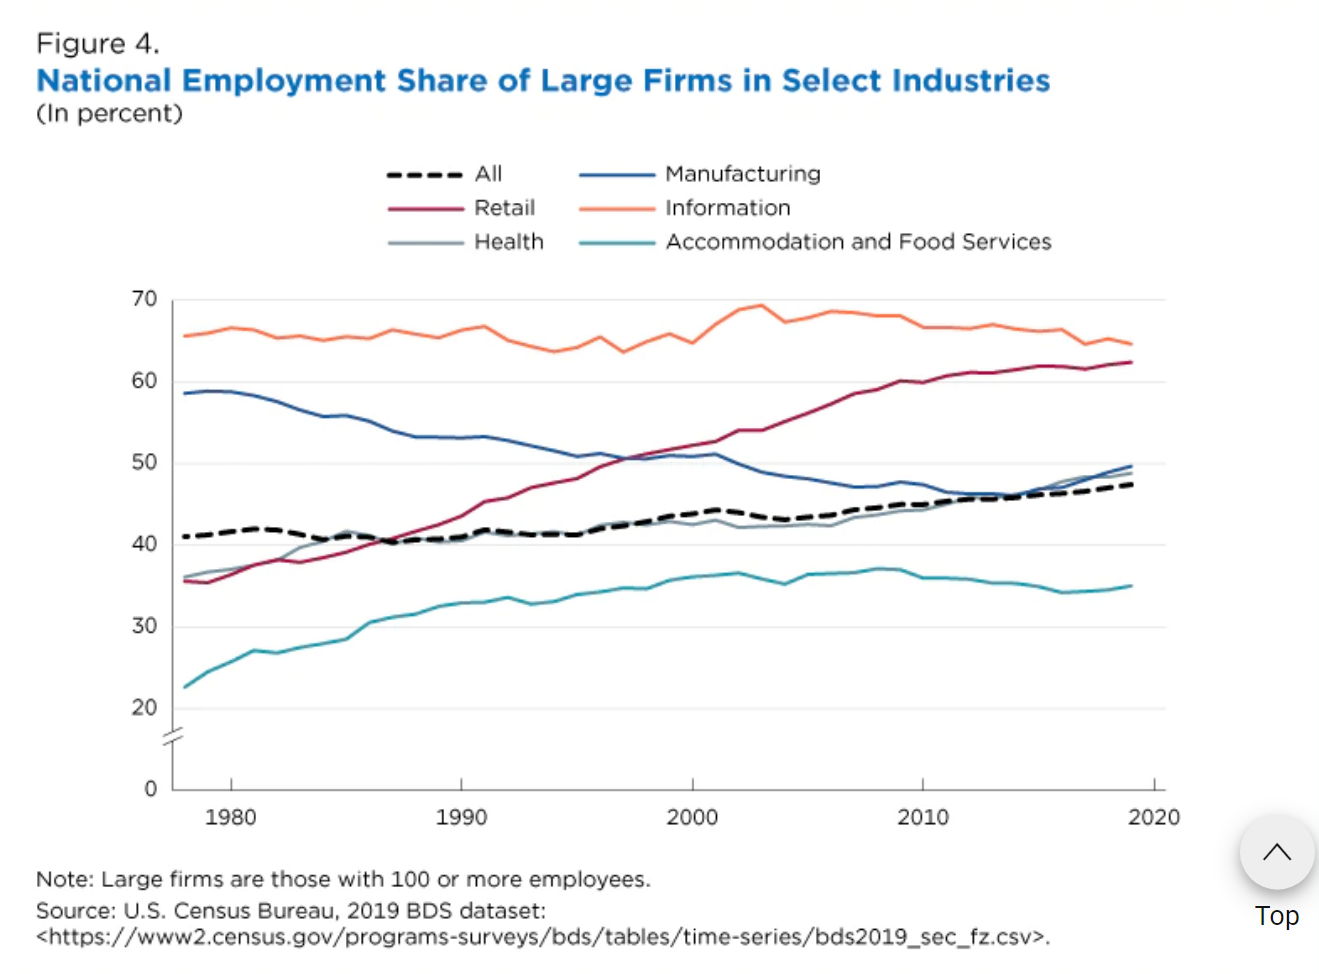
A recent Census Bureau article documents the increased employment share of older firms (6 years+) in many key industries.
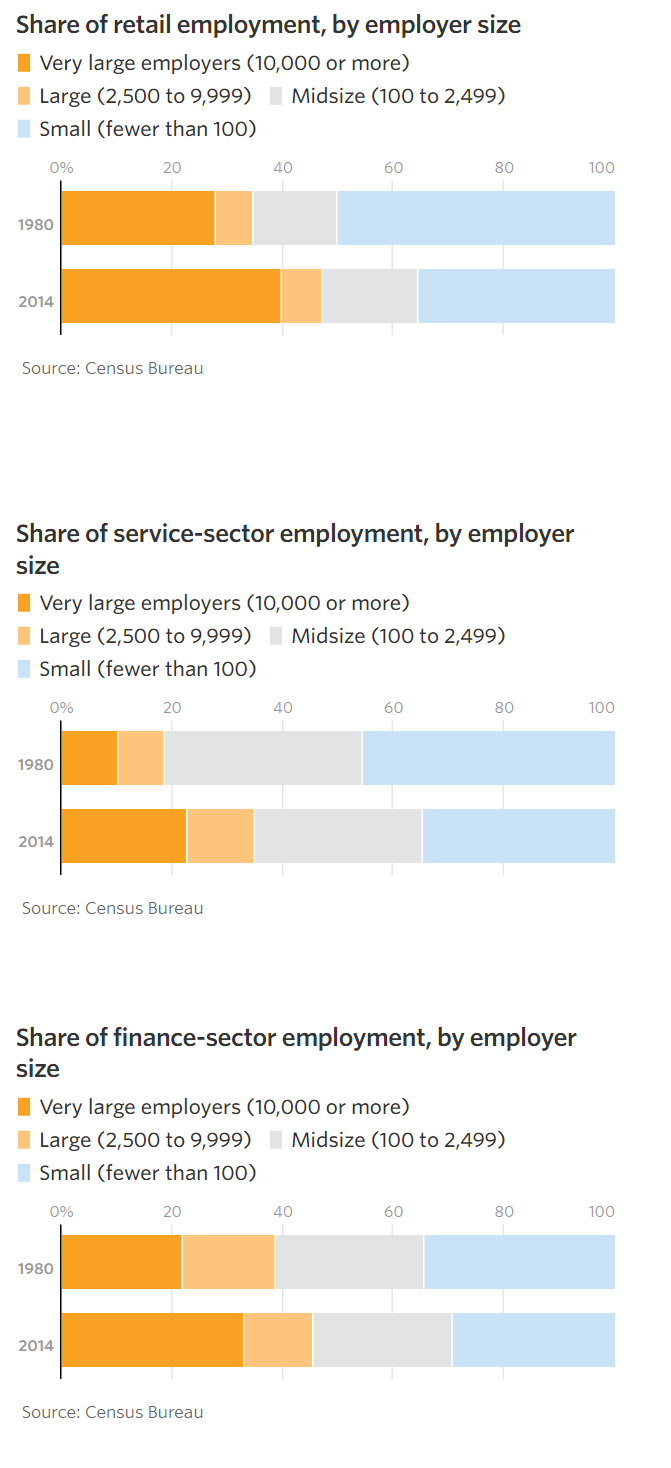
It also highlights the increased concentration of workers in large firms in the retail, health care, accommodation and food services sectors.
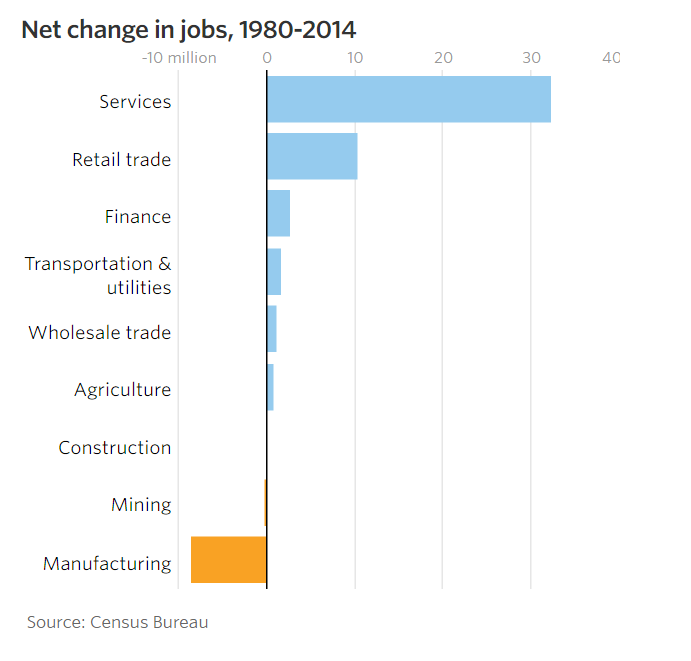
The WSJ articles itemizes the increased concentration of employment in large firms in the retail, services and finance sectors and documents that these are the growing segments of the economy.
Summary (It’s Complicated)
The Business Dynamics Statistics database provides researchers with the consistently defined and reported data since 1977 to document the key role of startup firms in adding net new jobs to the US economy. Startup firms are one part of an ecosystem of firm, establishment and job creation and destruction that plays out through time in relatively predictable ways. The death rates of young, middle age and mature firms play a similarly important role. The growth and decline of new establishments in existing firms matters. The internal job growth rates of young, middle age and mature firms matter. The relatively small size of startups compared to mature firms has an impact on job growth. Historical parameters are generally similar and change slowly, causing the layers of employment by firm age to be similar in this 50-year period. The model and framework for measuring firms, establishments and jobs is solid. Startup firms are essential, but they are not the only driver of success.
“Jobs created by firm size” is similarly shaped by all of these factors which describe the typical firm life cycle. Small firms are not superior job creators. New firms are job creators, and they happen to have small individual employment levels (4 on average), so small firms have higher measured rates of job creation.
In the last 10-20 years there has been a significant decline in the rate of new firm creation as a share of total firms. New firms created have not lost as many jobs due to firm deaths in their first 5-10 years. Mature firms continued to shed a disproportionate number of jobs during recessions, but after the Great Recession began to add more net jobs due to internal growth than they had in the prior 40 years. The overall number of jobs created has remained in the 2-4 million per year range across the 50 years.
The conservative SBA, Kauffman Foundation, WSJ and Republicans promote policies to ensure a thriving entrepreneurial environment for new and small businesses. The more liberal Brookings Institute, college professors and Democrats have an instinctive distrust of big business and concentrated economic power, so also lend support to some pro-small business policies. If job creation falters during periods of economic prosperity, this may be a rare place where bipartisan agreements could be reached to promote new firm and job creation.
During 2021-22, Florida Governor Ron DeSantis appointed 29 people to various Florida state college and university boards.
They included 8 business leaders, 3 real estate professionals, 5 doctors, 3 lawyers, 2 accountants, 3 educators, a banker, a farmer, a government leader, a not-for-profit leader and a public relations leader.
The 11 news articles emphasized the nominees’ professional and civic achievements. None mentioned any strategic agenda or revolution desired by the governor.
22 men and 7 women.
Every nominee was a Florida resident, with most highlighting their long ties to the state. One was touted as a “fifth generation” Okeechobee resident. Most highlighted their Florida college degrees. A handful listed experience with national US firms or military experience. Many listed their other board of director experience. Only 3 had obvious political roles in their biographies. Dr. Madhu Sasidhar, president of Cleveland Clinic, Port St. Lucie is the only nominee with limited Florida ties.
The governor’s office, board nominees, journalists and advocates from both parties highlight that the 6 recent 2023 appointments to New College of Florida’s board are intended to “revolutionize” the small (700 student) college in Florida.
The governor is only revolutionizing one institution. This appears to be for national political purposes. Florida voters, visitors, alumni and politicians need to consider what their response would be if the governor, of his own accord, decided that it was time to “revolutionize” an institution that they attended or supported.
The “contract system” replaces distribution requirements. Students cooperate/negotiate with a faculty sponsor to define their “program of study”, term by term. Foreign language requirements gone. Western civilization gone. Religion gone. Humanities gone. Science gone. Each student will have a “major” in order to graduate, but the first 1-2 years can be very flexible. The student-faculty relation/interaction is essential. Starting with just 100 “high potential” 18-year-olds in 1964.
Narrative evaluations replace letter grades. Pass, fail or incomplete. Faculty try to clearly define “mastery” up front for each course, tutorial or project. Real feedback is provided in person and in writing regarding progress and “opportunities for improvement”. Faculty and students are fellow learners, but standards are high; basically elite graduate school level.
Many independent study projects are required for all students. Tutorials with significant “independent study” components are offered by faculty to cover subjects not frequently offered. Students are encouraged to ” define their program of study, including the creation of interdisciplinary majors.
A senior “honors thesis” is required for graduation. The ability to research and write at a high level is required. Students must pass an oral examination of their thesis and related “major” program of study. Quasi-graduate school for undergraduates.
The US is leaving behind the pains of the 1930’s and 1940’s, enjoying more than a decade of solid economic growth. The business cycle is still very relevant. Rapid and extended post-war growth was unexpected once the economic demand of the war fell off. General economic growth into the future is now generally expected by 1964. The Keynesian economic model and policy prescriptions appear to be working. But true poverty continues in both urban and rural areas, especially among the elderly. Union-management relations remain tense, with strikes and labor actions frequently in the news.
Social Context
This is a conformist period where most individuals are willing to “go along to get along” in a world that is generally deemed positive by most. Religious attendance increases and conformist symbols on money “in God we trust” and the pledge of allegiance are adopted in the context of the Cold War. There is no 4th religious “Great Awakening”, but Pentecostal and fundamentalist churches see rapid growth. The Roman Catholic Church works through the second Vatican Conference to reform, update, reorganize and modernize the church. Mainstream Protestant churches are at the peak of their membership and influence. Liberal Paul Tillich is the representative theologian, emphasizing “matters of ultimate concern” and “the courage to be”. “Rock and Roll” music grows as an expression of teenage independence, but the “British Invasion” is yet to come. Racial justice is growing as a major topic, south and north. National and regional politicians take small steps forward on race as liberal judges take controversial larger steps ahead.
Global Context
The Cold War is topic A, B and C. The threat of nuclear war is omnipresent with students learning to “duck and cover” and citizens and communities building “bomb shelters”. Oppenheimer and other scientists who wish to “limit” further development are sidelined by the military and national leaders. Eisenhower warns about the power of the military-industrialist complex as he retires. The United Nations fills some global functions and Europe begins its long journey of integration. The US builds NATO into a strong alliance and supports the recovery of Germany, Japan and Europe through the Marshall Plan. Imperial/colonial holdings are released around the world within the context of the Cold War. Military technology continues to advance. The US is shocked by Soviet rocket, nuclear and satellite advances and invests in programs to recapture the lead. Displaced people and immigrants are resettled. Limited food production, oil availability and unlimited population growth are highlighted as a new Malthusian challenge. The pain is mostly felt in the “less developed” world, but policy elites highlight the risks. The Peace Corps is founded.
Political Context
Truman rode FDR’s goodwill to victory in 1948. Eisenhower accepted the New Deal and governed in a low-key, centrist manner for two terms. Populism and McCarthyism (nationalism) were largely eliminated in the 1950’s, but the existential threat of “Red” communism in Russia, China and its allies remained as a major political debate. Modern conservativism began with the academic scribblings of Russel Kirk (1953), the voice of William Buckley (1955) and the political moxie of Barry Goldwater and Ronald Reagan. However, John Kennedy squeaked out a narrow win over Richard Nixon in 1960 and provided that time with an idealistic, progressive, academically supported New Frontier and Camelot.
Intellectual Context
Some academics were walking away from the party line Marxism of China and the USSR by 1960 as the shortcomings of the economic, political and social systems were becoming apparent. They were very focused on the French existentialism of Sartre and Camus. In the shadow of “mutually assured destruction”, this was not surprising. The structuralism and post-modernist philosophies emerged at this time but did not quickly impact American cultural life. Universities were growing rapidly in this period, fueled by the GI Bill and the coming Baby Boom freshmen.
Public intellectuals were still a significant part of national debates about politics, technology, the economy and culture. The mainstream media provided print, radio and TV stages for public debate.
The “popular” intellectual debate was largely focused on the eclipse of the individual versus the power of the group, whether that group was society, advertisers, corporations, neighbors, property developers or government.
The continued growth of science and technology as practical applied science and theory was also a major concern at this time. The split between scientists and the humanities scholars was emphasized. The changing view of “science” as a firm, fixed, objective body of work conducted by objective scientists was also called into question.
The local (Sarasota and Florida) and national founders of the college were shaped by the context of the period. In hindsight, it is clear that they worried about growing “individuals” who could resist the power of the various social and organizational forces that demanded compliance. This was not a left- or right-wing political initiative. These were business, government and university elites doing their best in a patriotic American way to shape a new institution in a growing city, state and country.
60 years later, it’s not clear that these founding principles were “leaning left”. The focus was on the individual, not on the community, society, nation, state, religion, history or culture. The founders: well-minded business, religious and academic elites, emphasized this dimension of education because they believed that a simple, patriotic, conventional, practical, productive, well-defined, professional, feasible, traditional model of education was simply inadequate. It’s 1960. Two dozen successful people got together to form a new college in a resort town. They did a quick SWOT analysis (strengths, weaknesses, opportunities and threats) of colleges and universities. They chose to innovate. Let’s “reach for the moon”. We want to attract the “best and the brightest”. (Ouch).
College freshmen today (1960) are unduly shaped by society’s expectations. Let’s “turn them loose”. Young people are much more mature today due to their exposure to the “mass media”. They are very well educated in many high schools. Faculty and administrators are also much more highly qualified to lead the education process. Let’s fully engage them in the learning process.
This was an idealistic birth process only possible in a positive period of confident national growth.
I don’t see any incompatibility between New College’s historical educational program and associated learning environment with Florida Governor DeSantis’s stated desire to improve the critical thinking skills of students, making them less influenced by “trendy” philosophies. I believe that New College already provides a solid base in those skills. The burden of proof is on new trustees or new programs of study to better deliver the desired results.
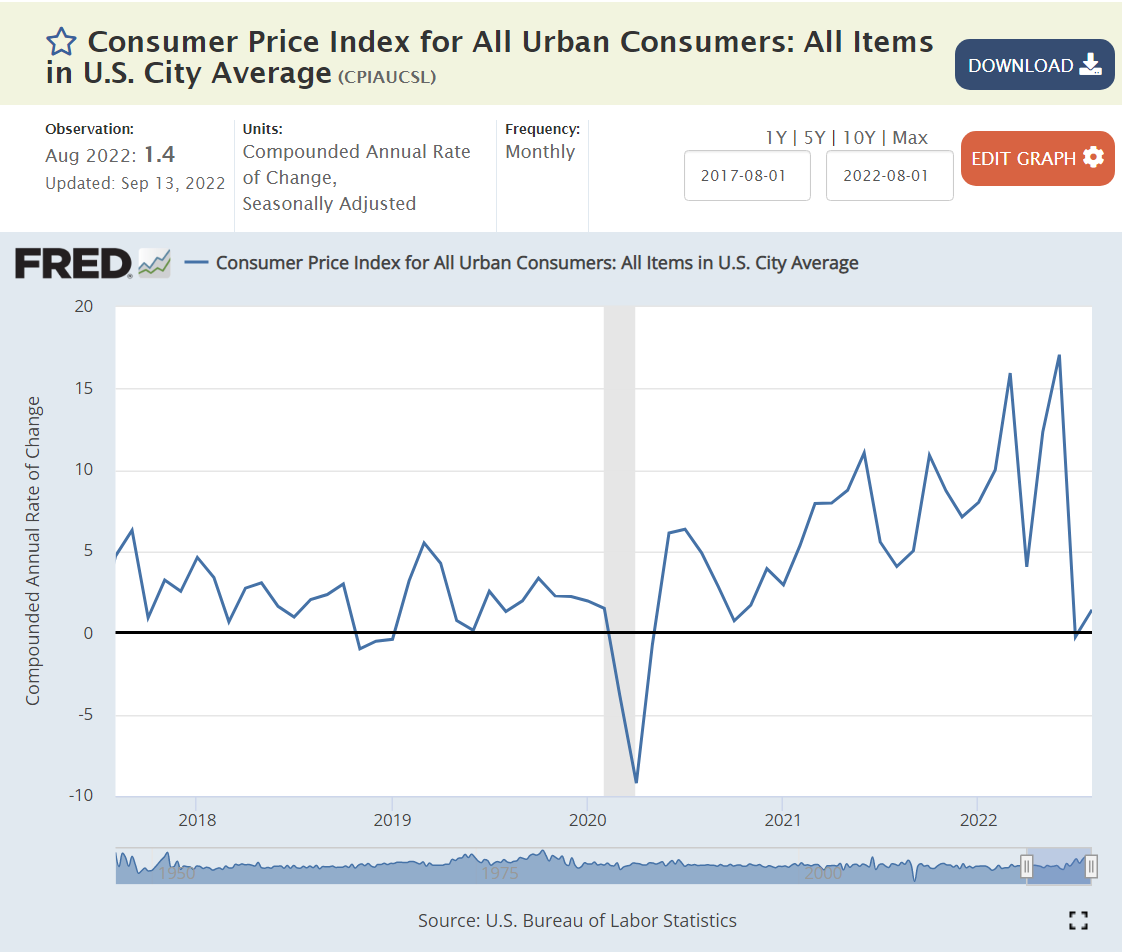
Since July, overall inflation is immaterial (1%), about 2% on an annual basis.
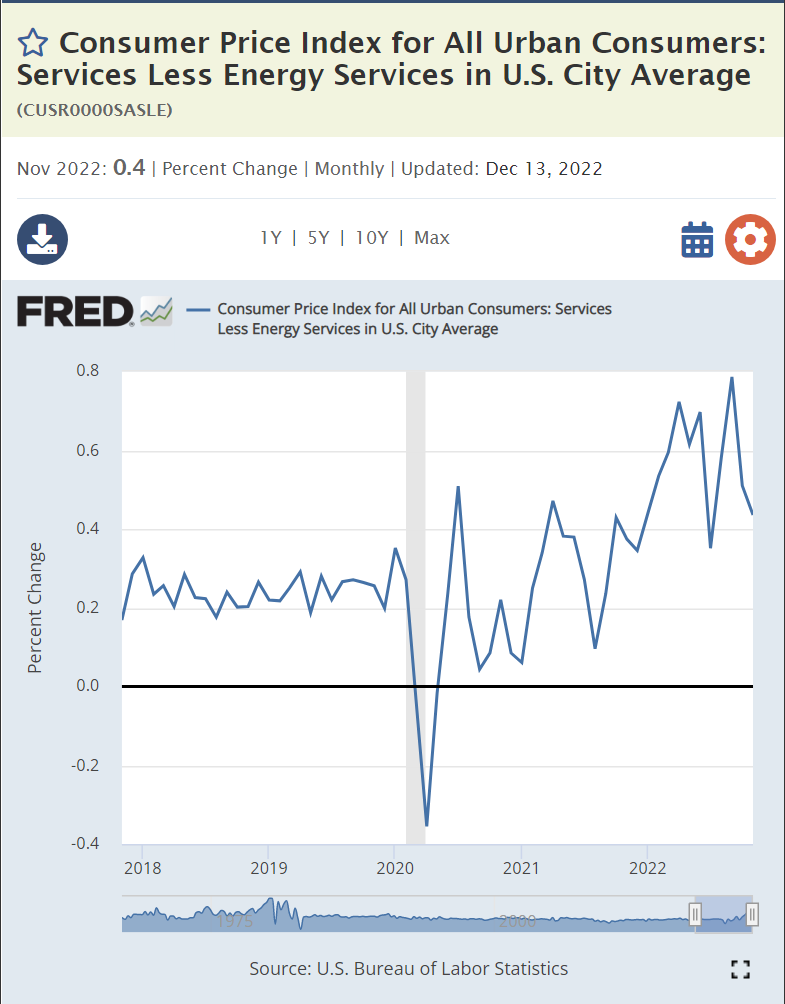
The Services sector is the most concerning, with annual inflation still running near 6%. The recovery from the pandemic started with the goods sector and then slowly rotated into the services sector as “in person” services re-emerged.
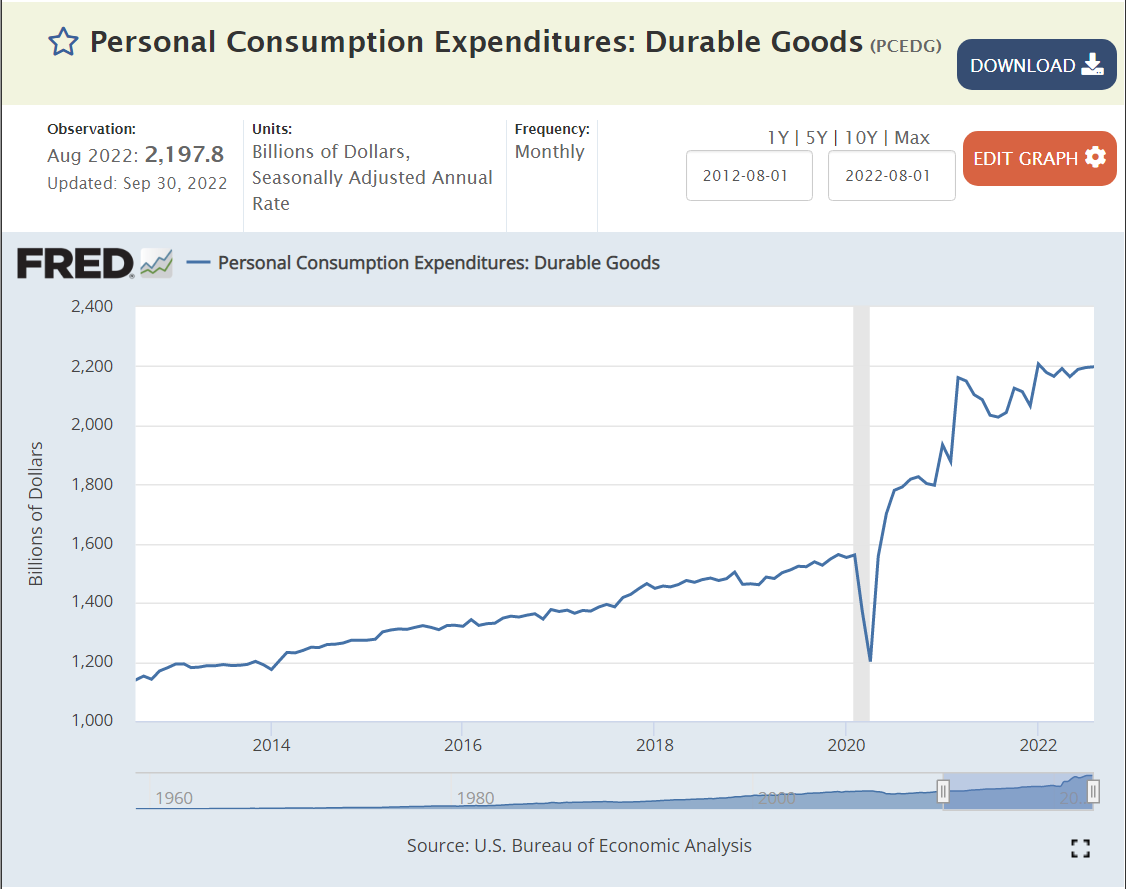
Since March, 2022 durable goods have reassumed their long-term price Deflation.
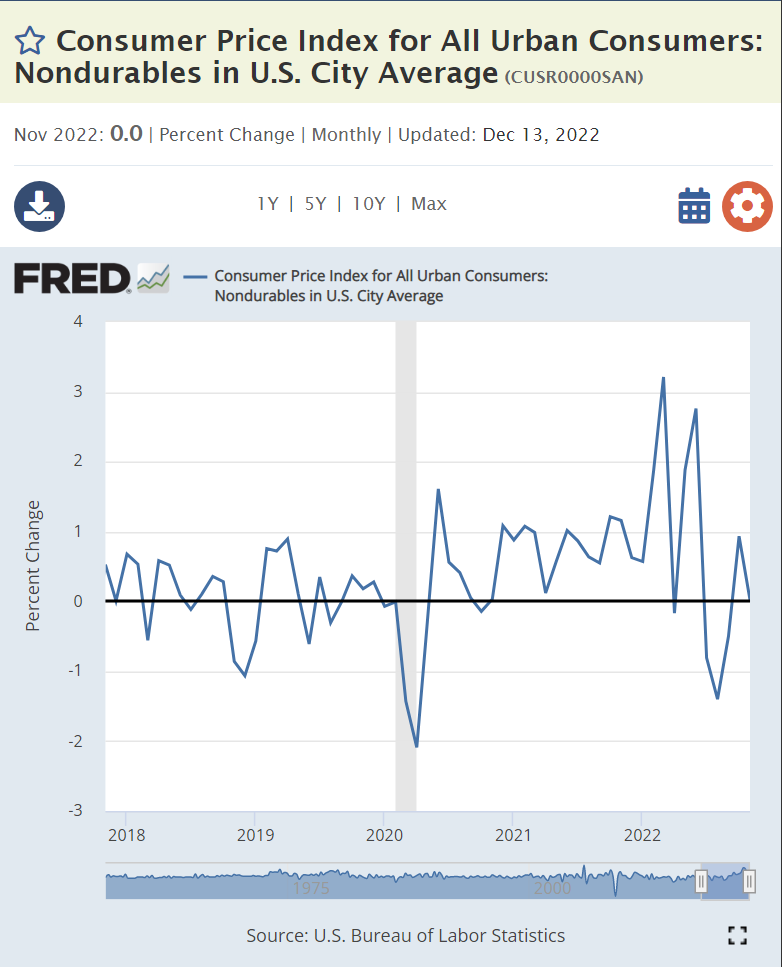
Nondurable goods are back to 0% inflation.
Energy prices are clearly falling now.
Gas prices have retreated back to $3 per gallon as quickly as they increased.
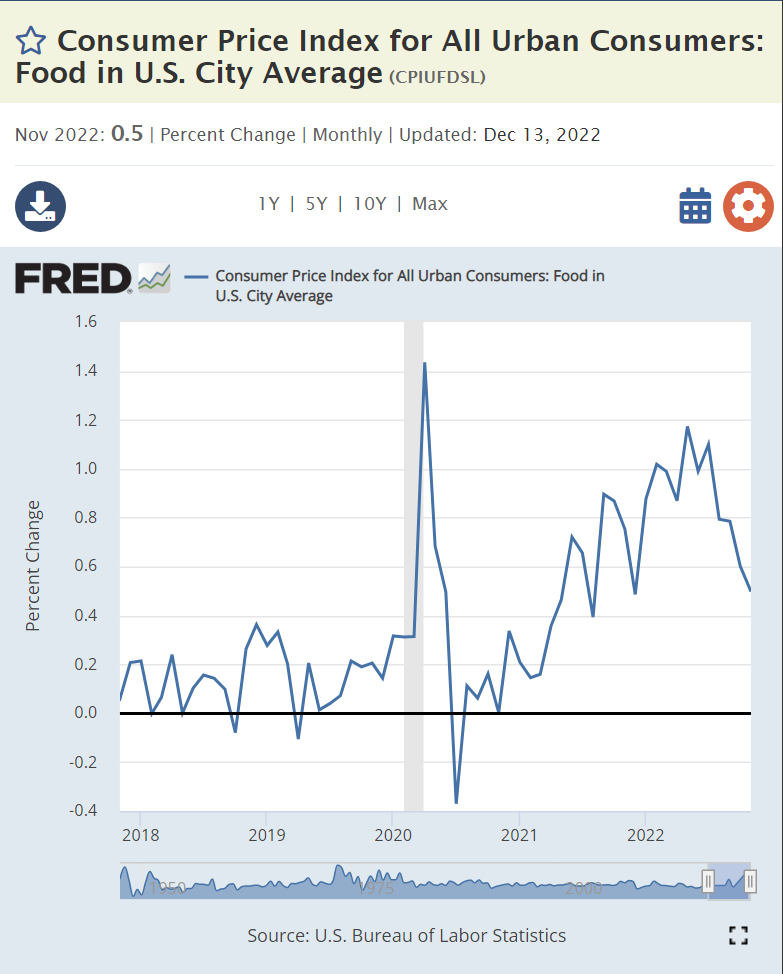
Food prices have fallen but remain abnormally high, growing at 6% annually. Global pressures may keep this category above normal during 2023.
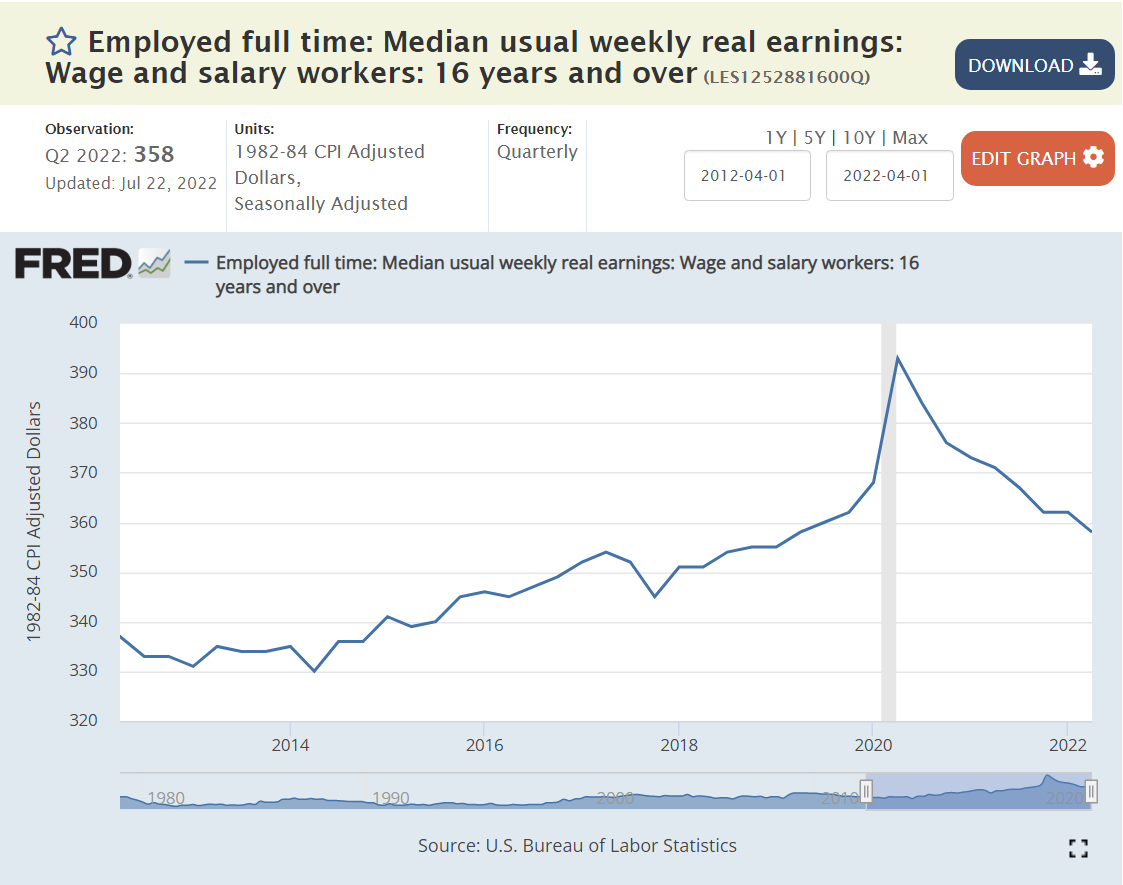
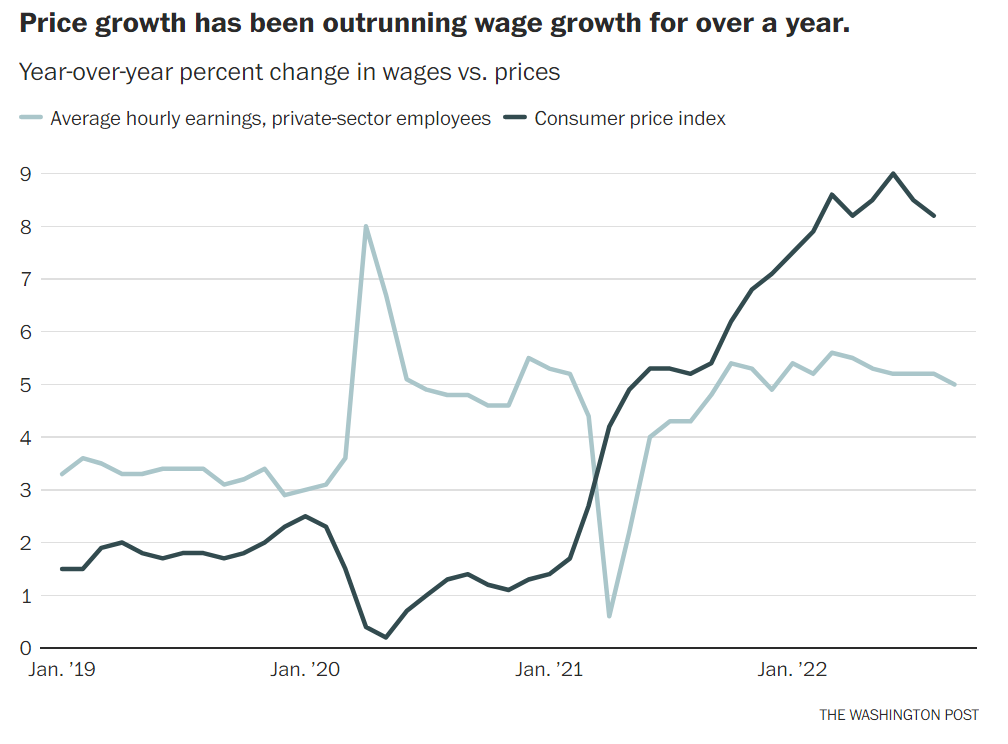
Wage-push inflation remains a thing of the past. Real wages remain flat.
Strong economies with solid currencies are able to import cheaper goods and reduce domestic inflation.
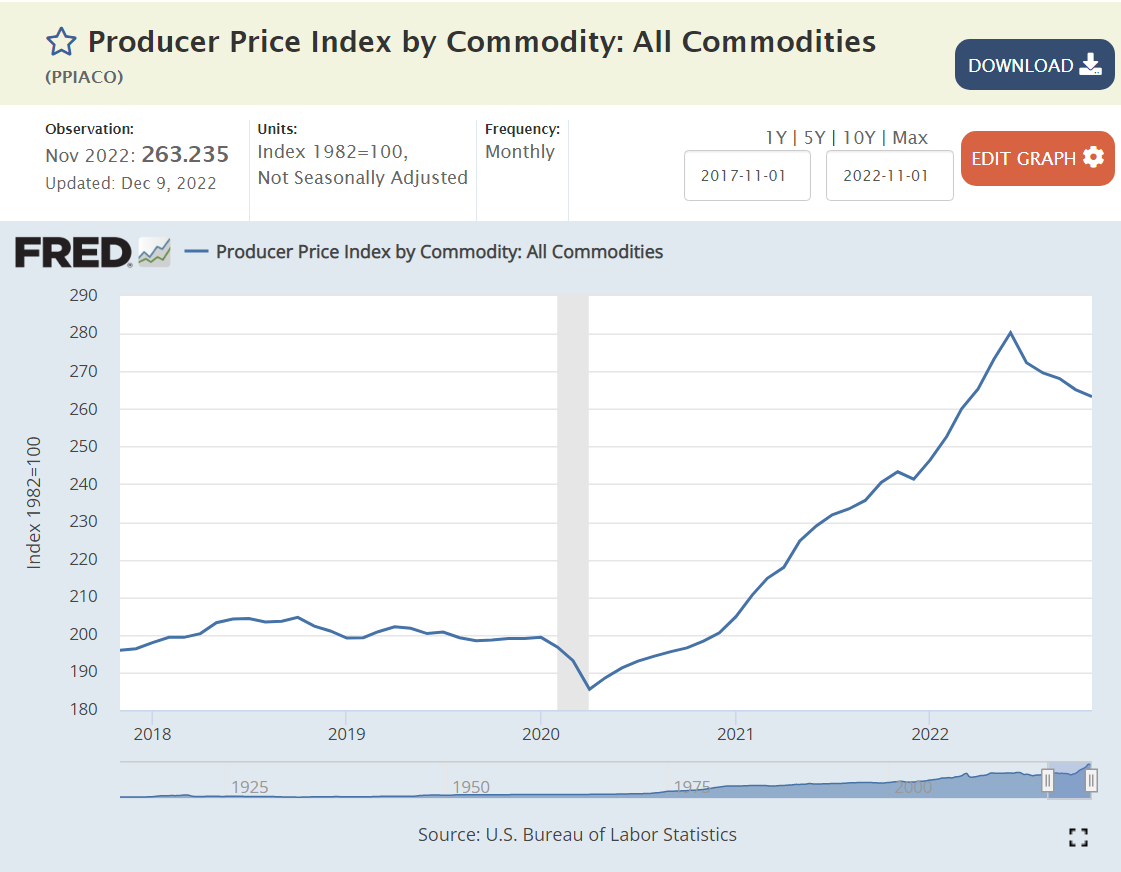
Producer prices have fallen by 6% from their peak.
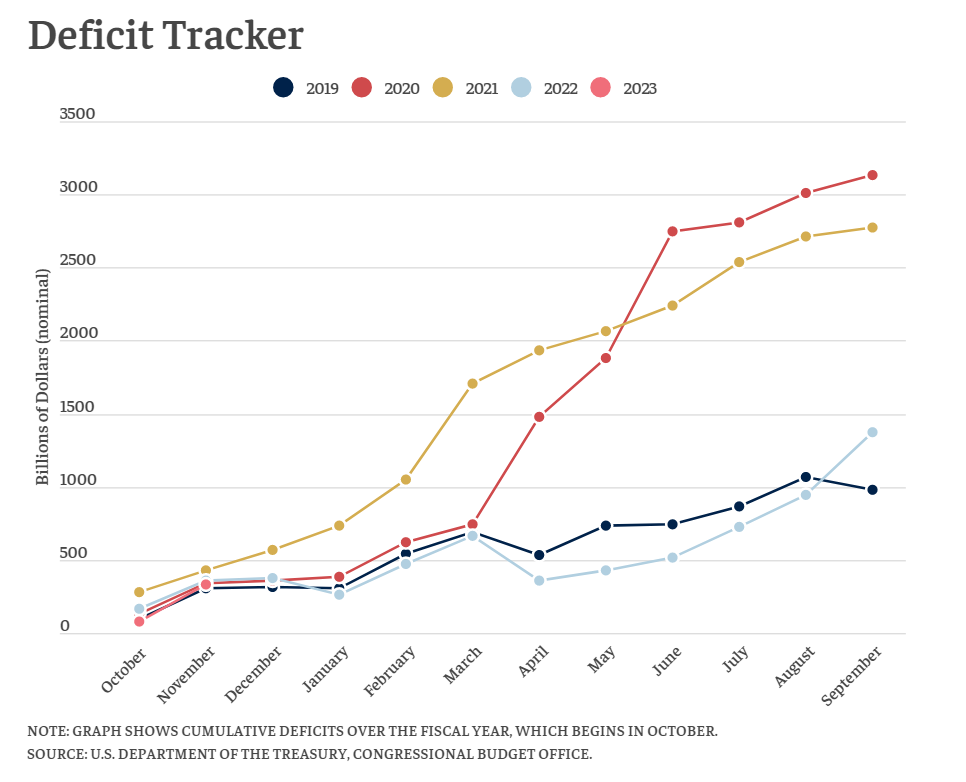
US fiscal policy for 2022 was at the same expansionary level as pre-pandemic 2019. I think it was a little too expansionary, but this level of deficit did not significantly drive the increased inflation in 2022. The budget deficit for fiscal year ending September, 2023 is expected to increase by a small amount, even though the latest official CBO forecast showed a smaller deficit.
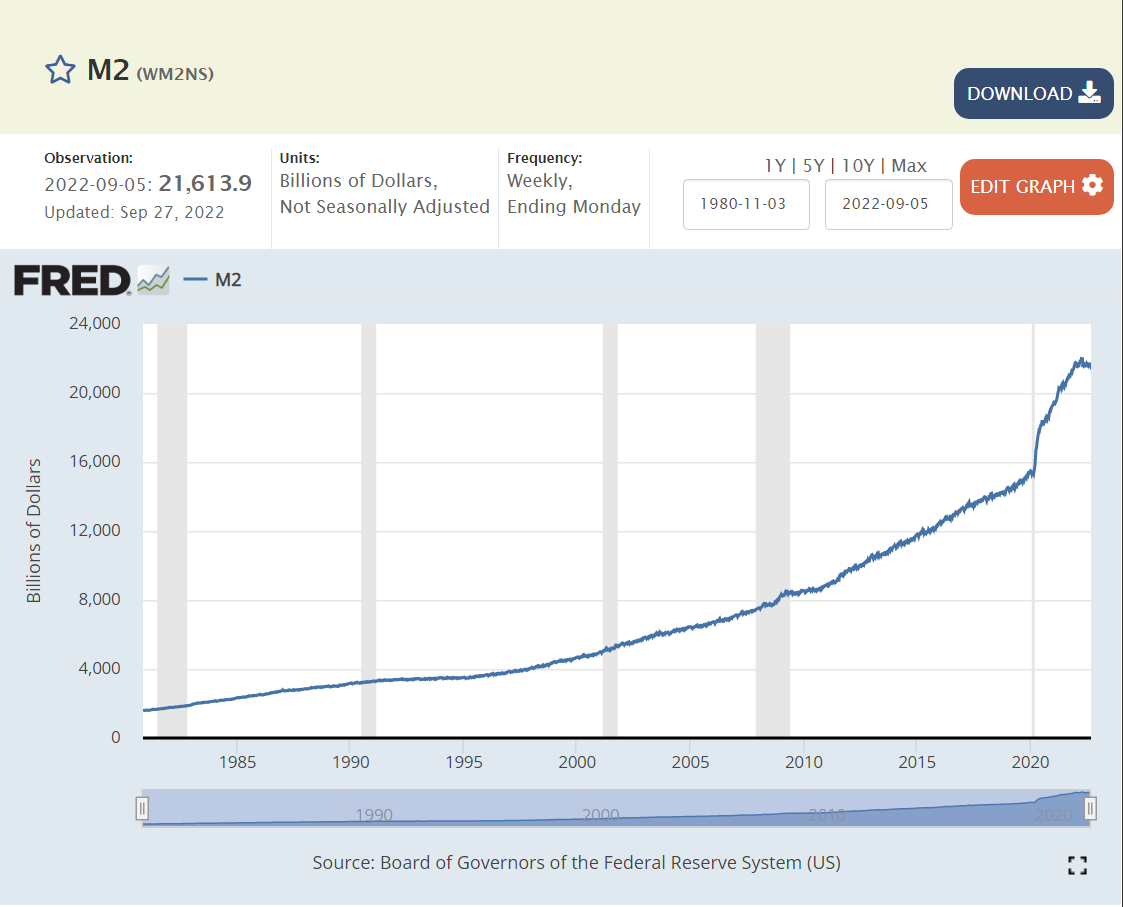
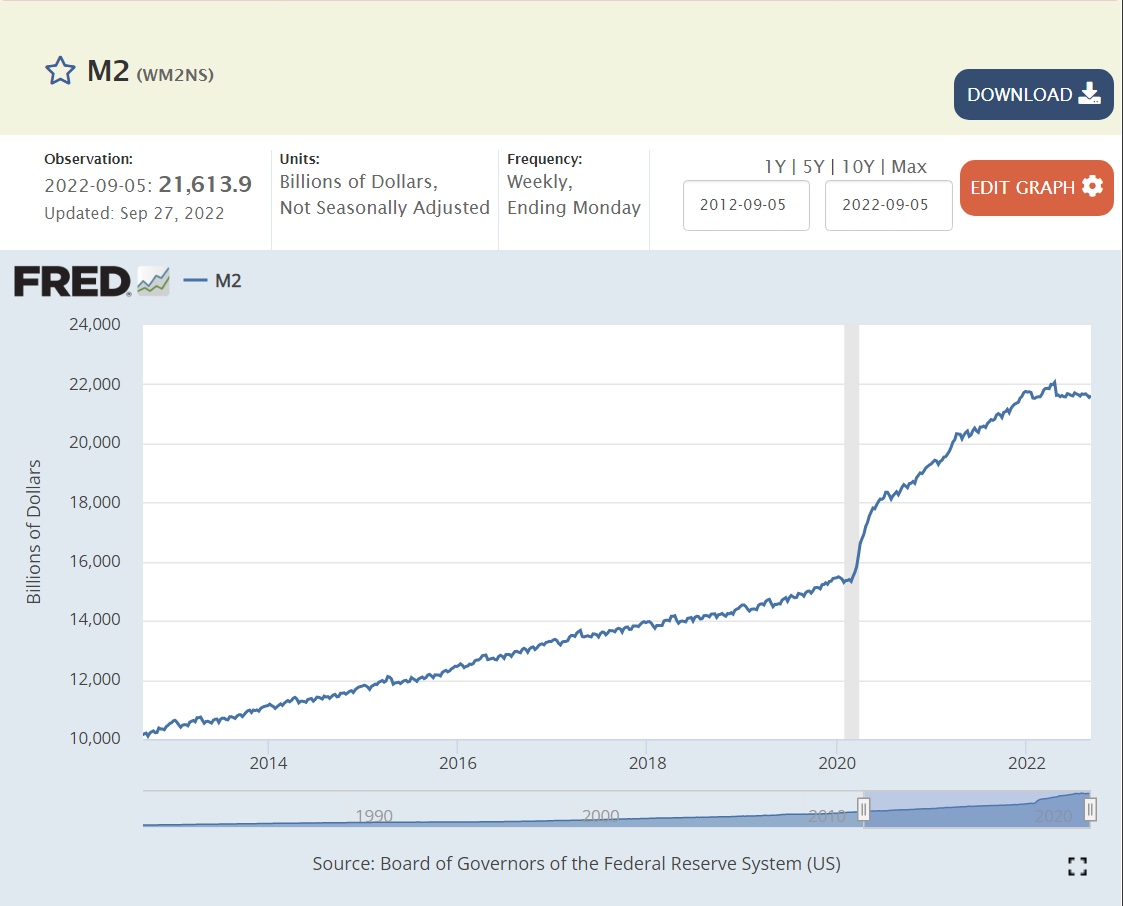
Monetary policy was very loose in 2020, attempting to offset the many threats to the economy. It has since been closer to “neutral”. There is no solid historical or theoretical basis to carefully predict the effect of this huge increase in the money supply two and a half years later.
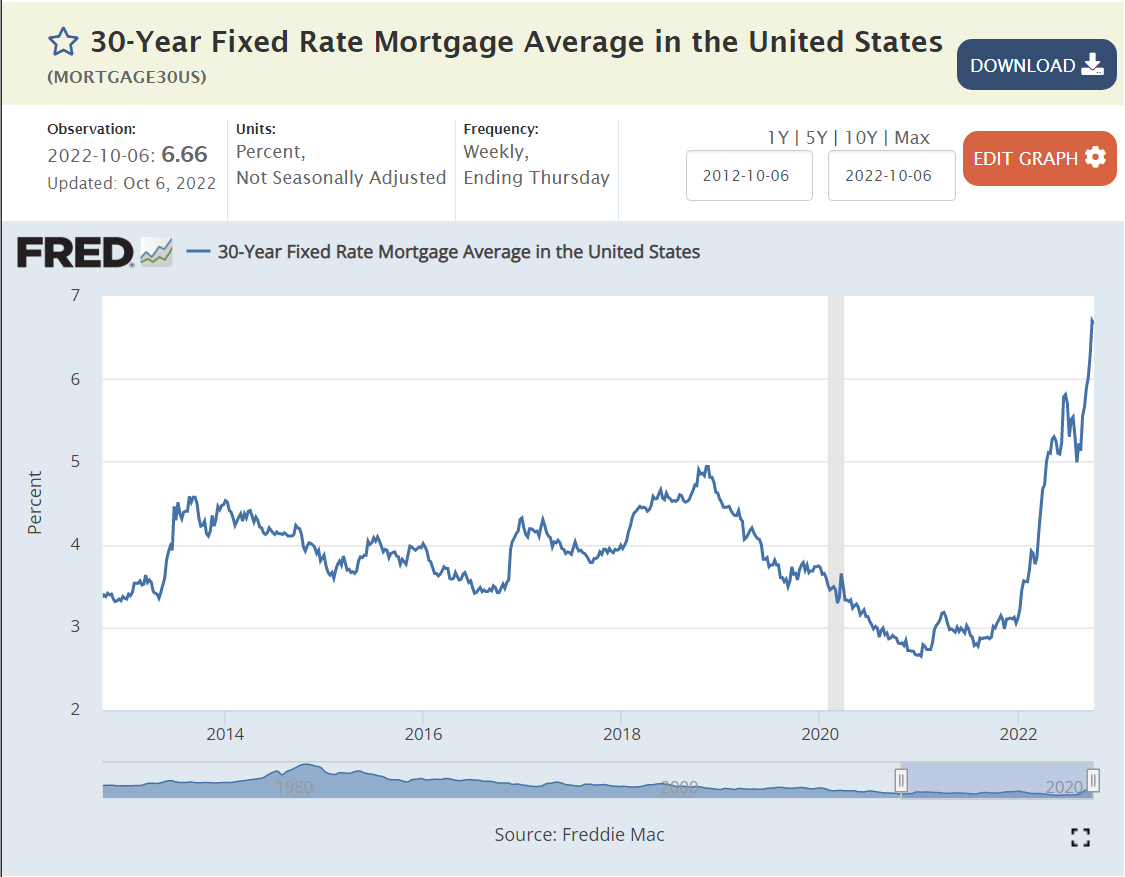
The Federal Reserve Bank has increased interest rates and the housing, stocks, bonds, construction and commercial investment markets have been impacted, slowing aggregate demand for assets, goods and services.
The stock of “excess savings” which supported the rapid recovery from the pandemic peaked in early 2021 at $2.25T. It had fallen by 20% to $1.75B by the 3rd quarter of 2022 and continues to fall, reducing aggregate demand.
Summary
The scariest inflation scenarios are no longer plausible. Durable goods, nondurable goods, producer and energy prices are falling. Food and services prices remain elevated at 6% but are not in double digits and are not increasing. Real wages spiked briefly during the heart of the pandemic but quickly returned to pre-pandemic levels where they have remained.
The federal budget deficit in 2022 was the same as in 2019 when inflation remained low. Even with a slowing economy, the forecast 2023 budget deficit remains about the same as in 2022, not adding materially to excess demand. Monetary policy in 2022 has consistently been tighter and tighter, with the Federal Reserve chairman promising to “do whatever it takes” and highlighting the much greater negative consequences of inflation that does not return to the target level. Weakened fiscal and monetary policy should help to further reduce any remaining supply chain constraints in the global economy. The housing and capital investment sectors are declining. The impacts of changed monetary and fiscal policies are seen 6-24 months later.
Double-digit and accelerating inflation are no longer credible. Deflation is the rule in a large part of the US economy. Monetary and fiscal policies are tightening. Overall inflation is falling. The economy has already slowed, so we may even be entering a period of self-reinforcing lower rates of inflation.
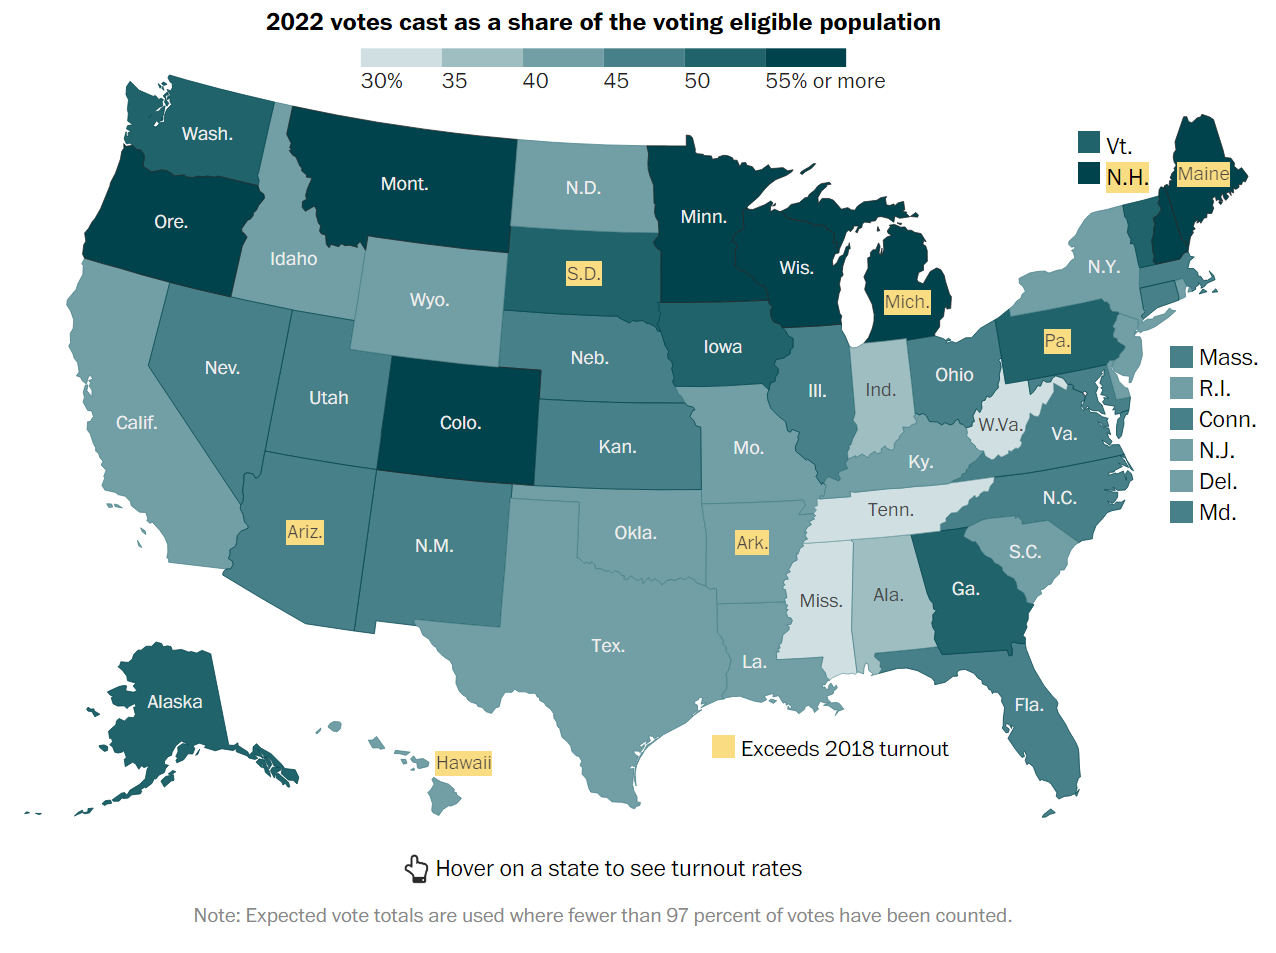
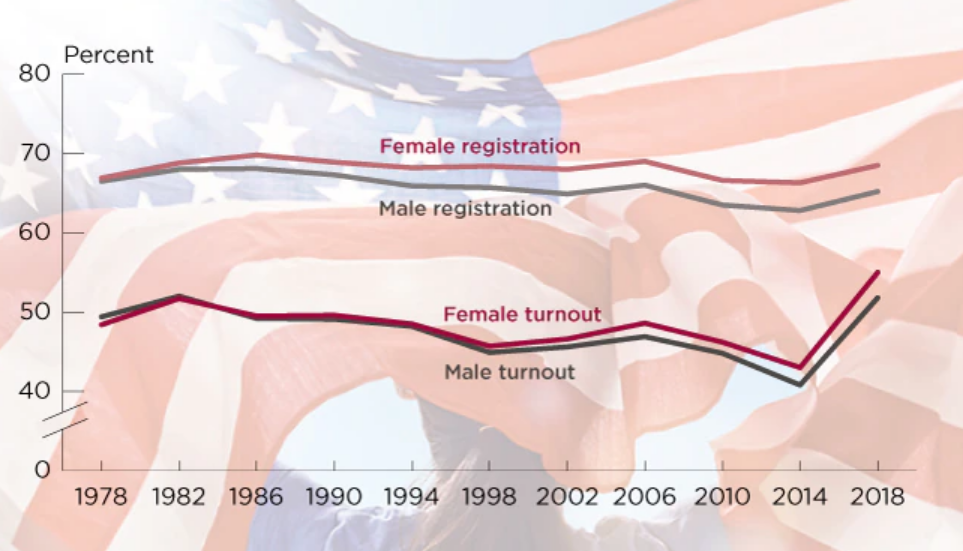
2018 and 2022 elections showed widespread increased voter participation. Increases were seen by all races, genders, income, ages, states and education levels. Increased voting by the youngest age group and Hispanic Americans were most notable.
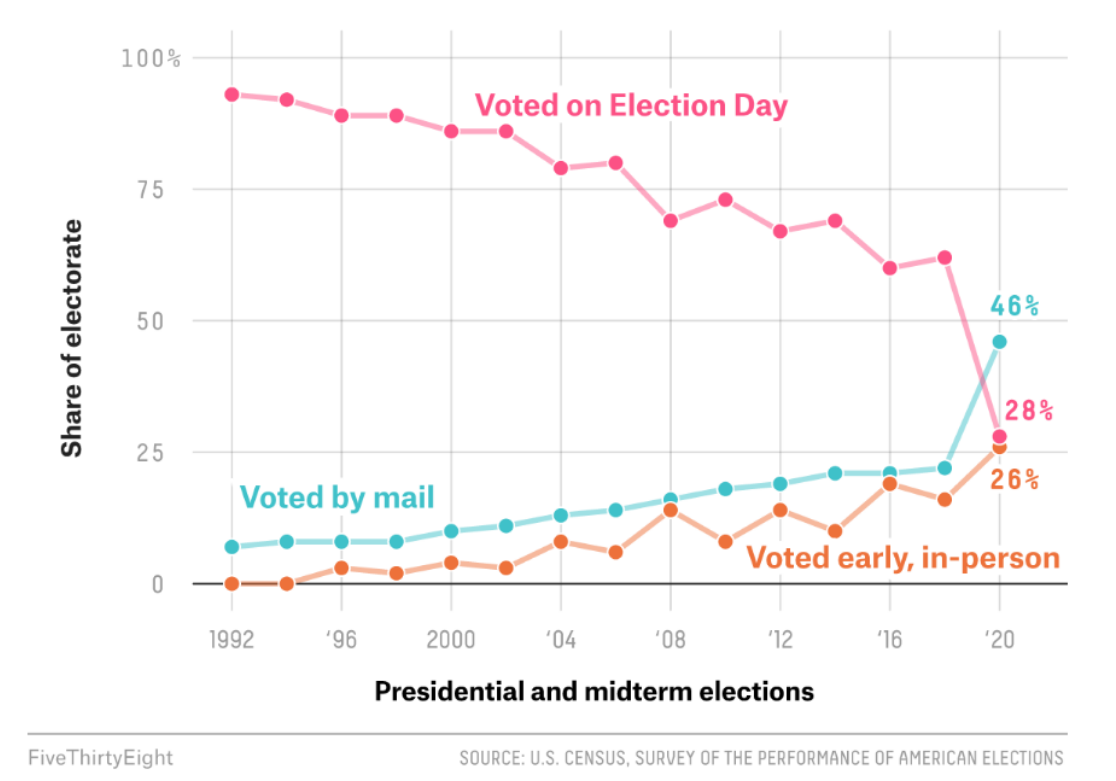
The 2020 and 2022 elections both relied heavily upon mail-in and early voting options. Early voting participation, especially in competitive states, was equal to or ahead of 2018. Hence, election day participation in 2022 was somewhat lower than in the record year.
Voter Registration is as Important as Participation
Voter registration in the states with party-preference records increased from 108 million in 2017 to 117 million in 2021 and then a little to 120 million in 2022. Registrations have increased a little faster than voting age population, but have not made a material difference.
The Democratic party share has declined significantly in the last 2 decades, replaced by “independent” voters. The Republican party share has declined by just 3%.
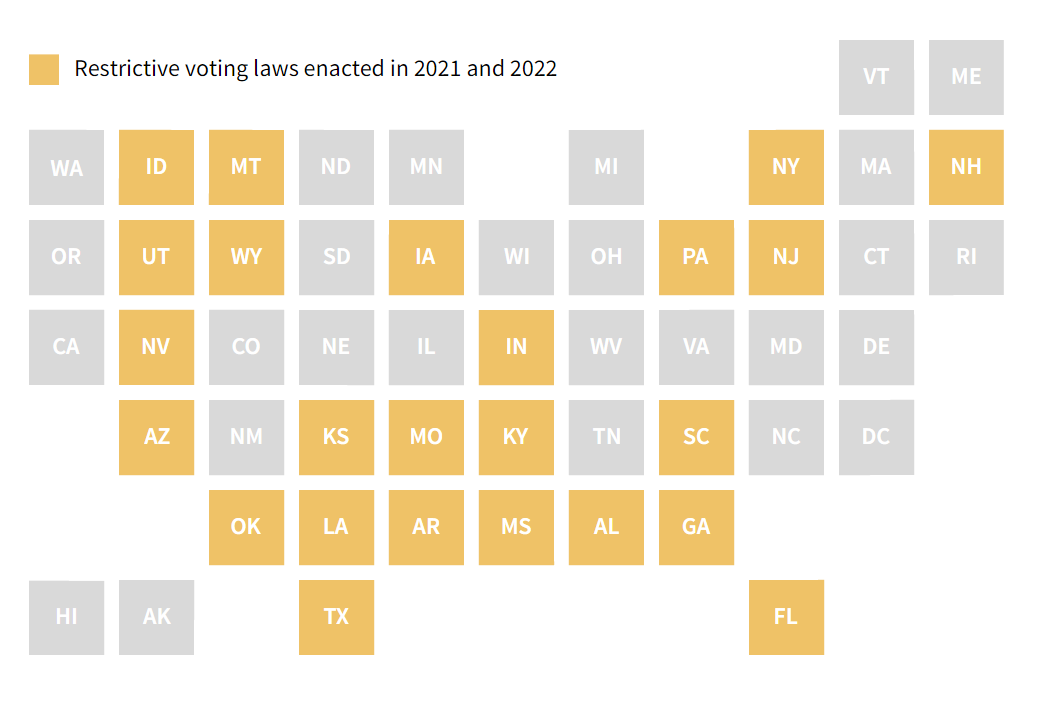
Good data on the impact of various voting law changes is not yet available. Anecdotal media reporting of the 2022 election did not indicate extremely large changes in voter behavior.
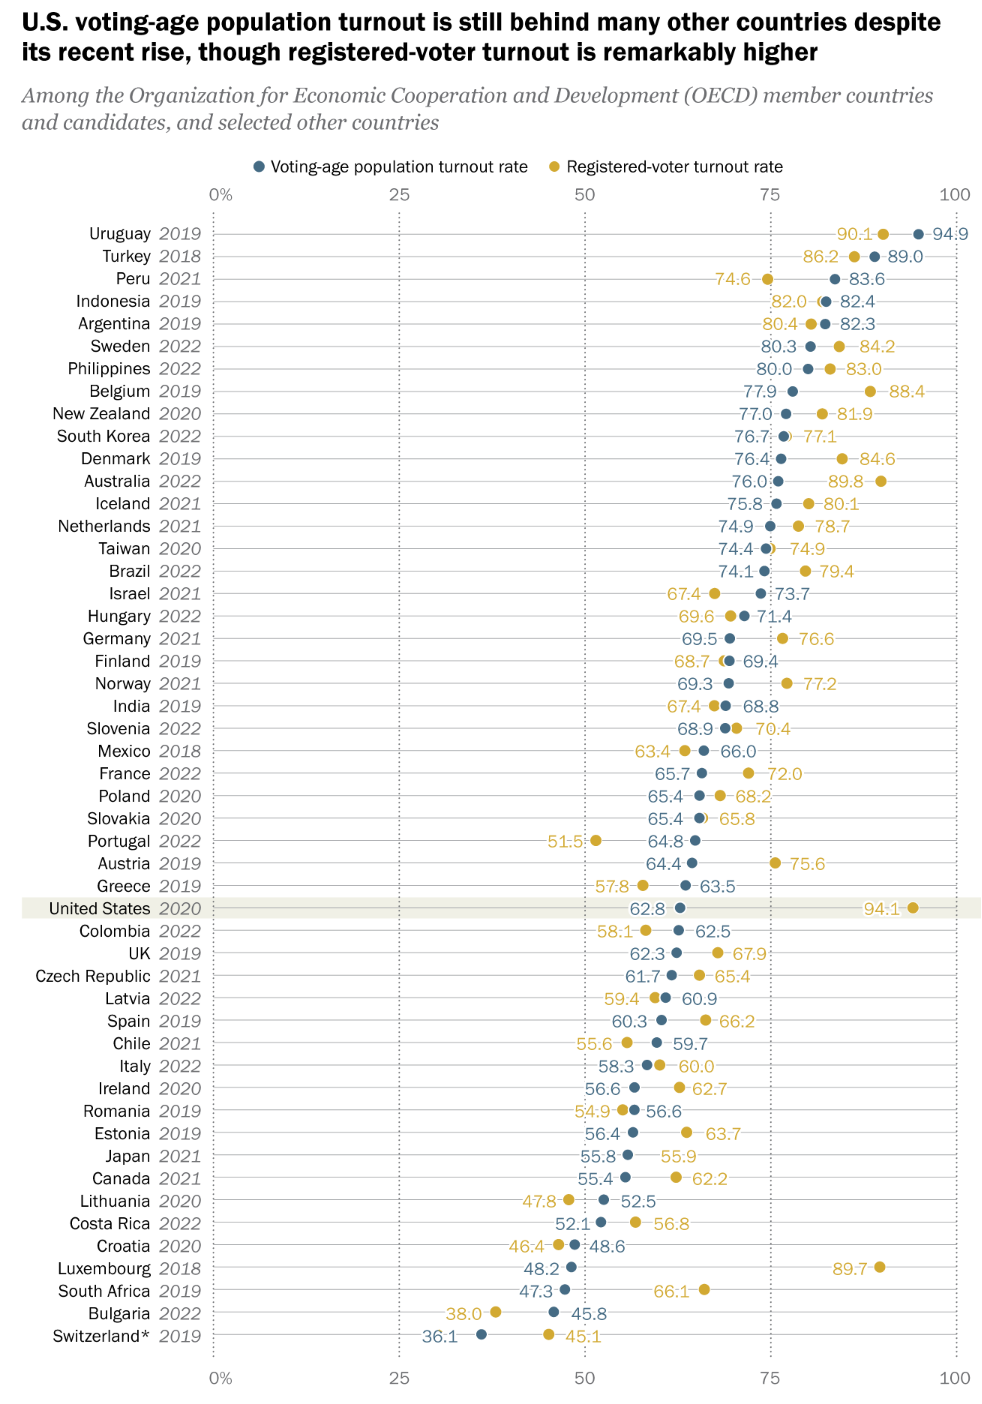
US Registration and Net Participation is Low versus other Advanced Economies
Voting participation in the US varies significantly by gender, race, age, state, income and education level. It recovered to some degree in 2018-22 following a 40-year low period. Voter registration has increased by a small amount in the last 10 years, but increased participation among registered voters has been the driver of overall results. The availability of mail-in and expanded early voting clearly boosted turn-out in 2020 and 2022. The impact of additional voting restrictions is unclear, but obviously intended to reduce turnout. Polarized politics in the US has increasing voter turnout, but only by 10-15% versus recent history. Presidential years boost turnout by 15%. State by state participation in election years ranges from 58% to 76% (excluding a few extremes), based on habits, demography and state laws. Presidential elections could have 10% higher participation if all states followed the examples of the high participation states.
Government has an increased impact on all citizens. Democracy requires participation to make the decisions and programs of governments (at all levels) legitimate. The US can do better.
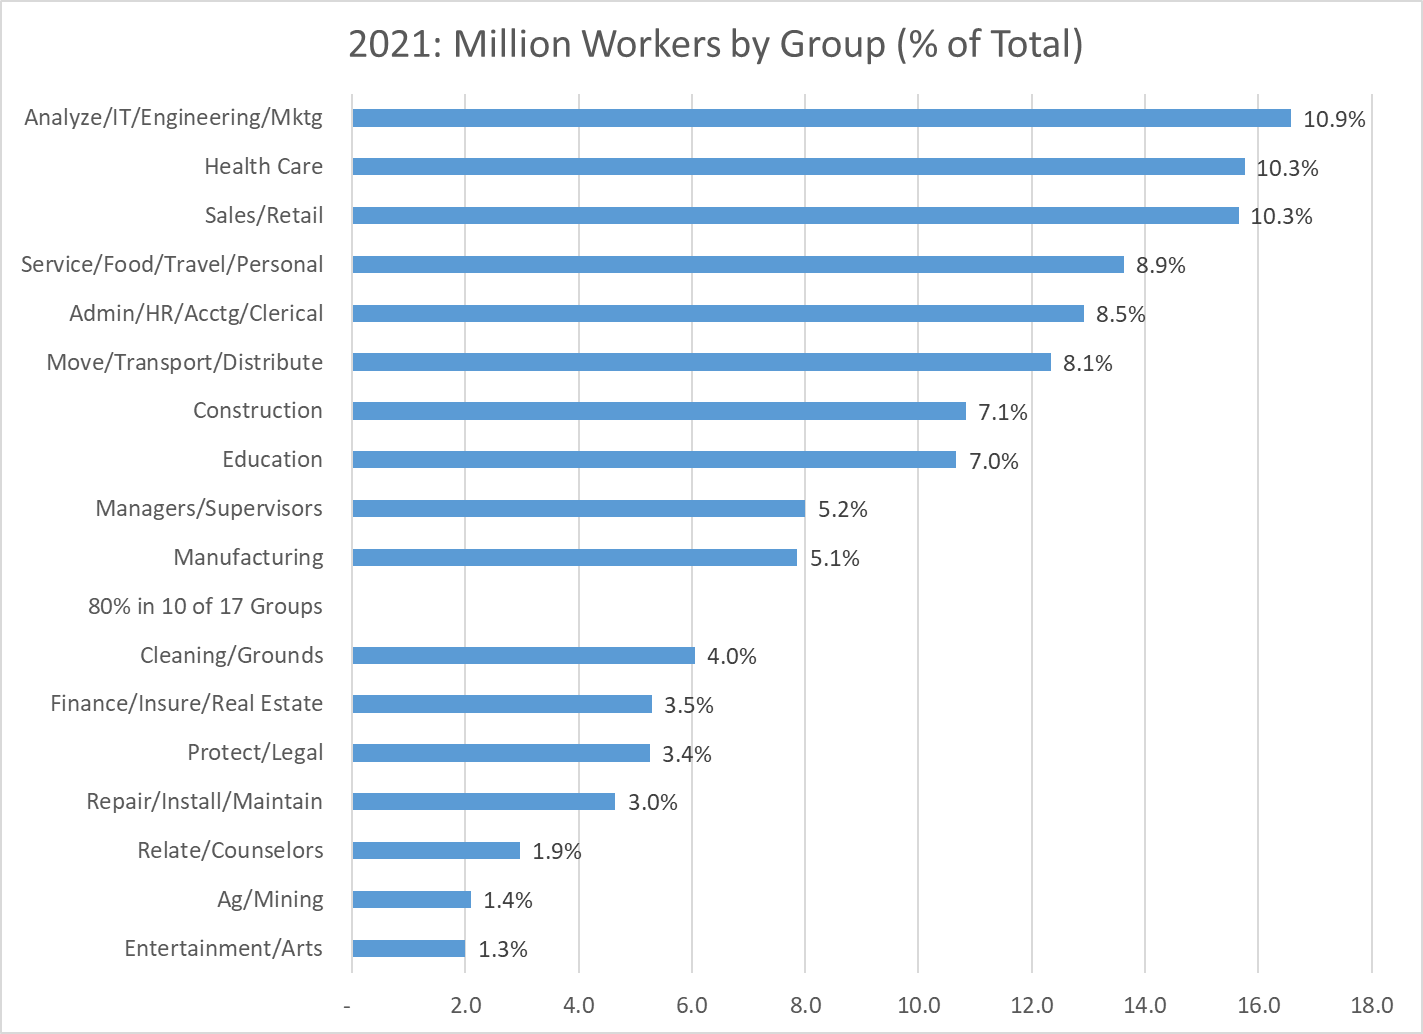
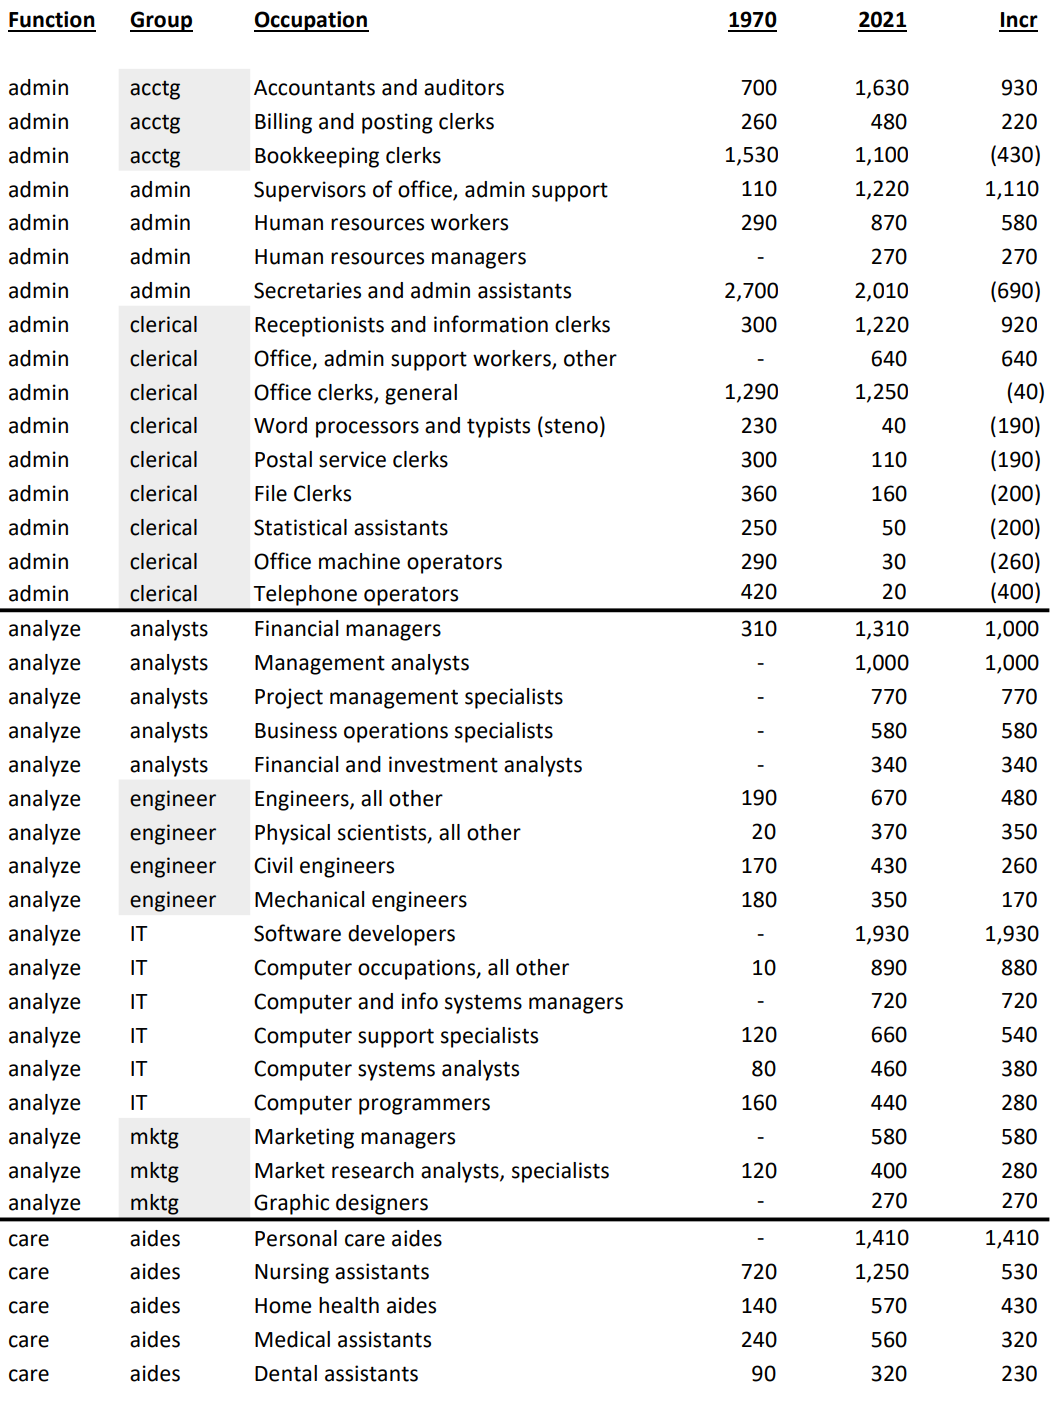
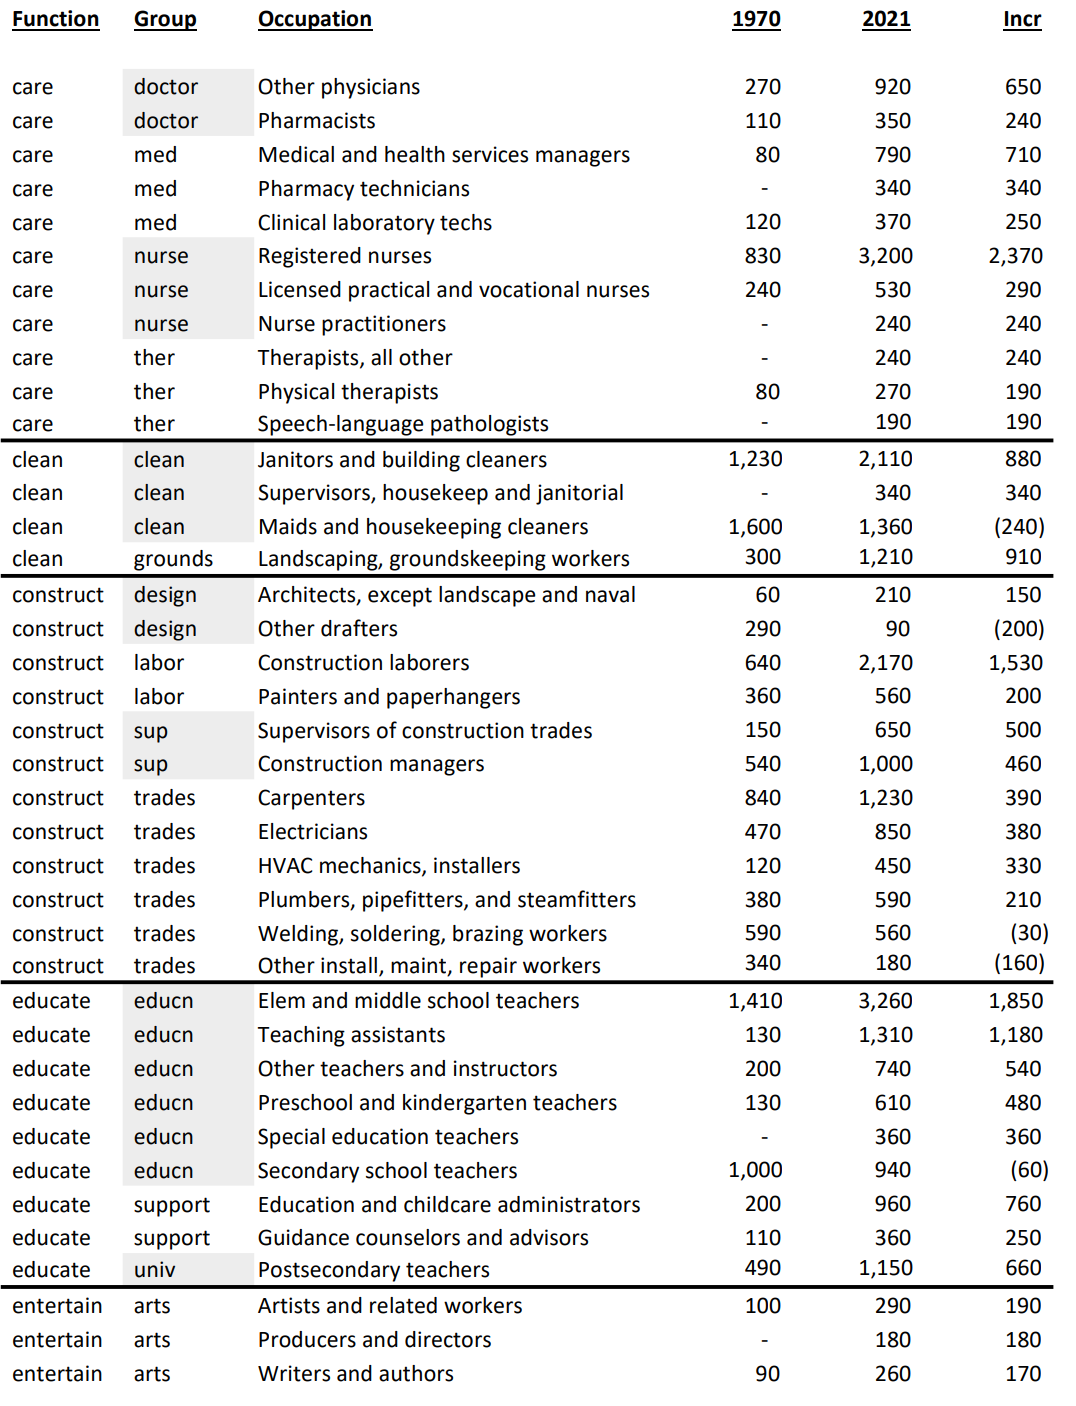
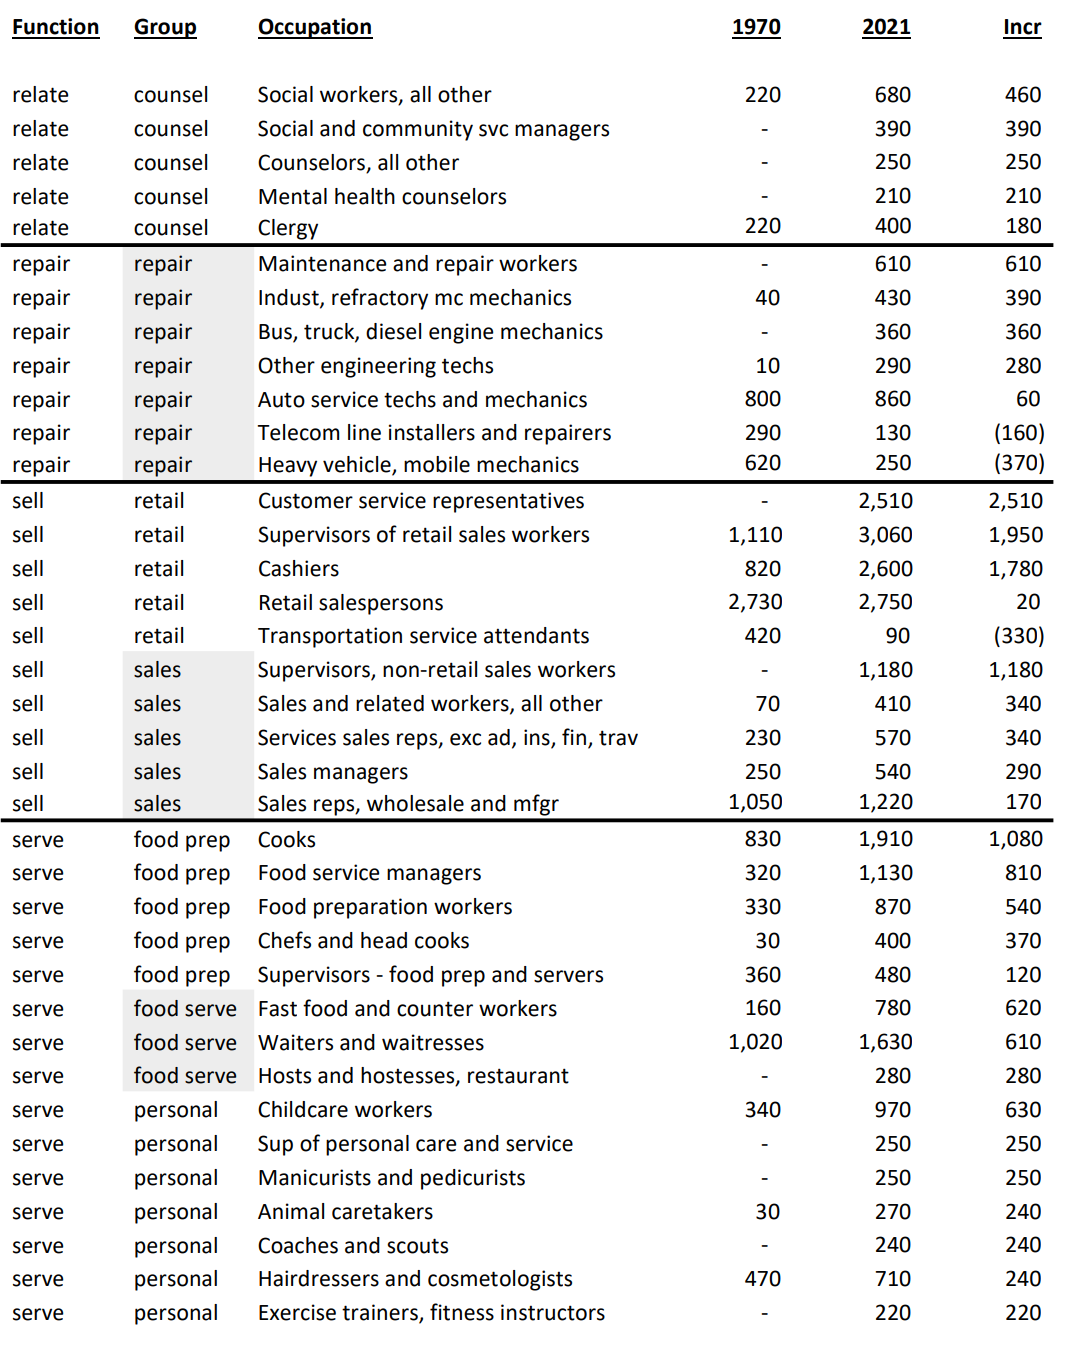
This is a follow-up article to my recent post on “A Very Robust Long-term US Labor Market (1970-2021). Rather than focus on total growth or the “skill-level” of jobs in the labor market, I want to focus on the roles or functions (like career clusters, similar to industries) played by the 150 million US workers in 2021. I’ve grouped the 500 detailed occupations into 17 categories so that we can look at subtotals ranging from 1% to 20% of the total, with an average of 16%. Enough detail to highlight the very significant changes in the last half-century.
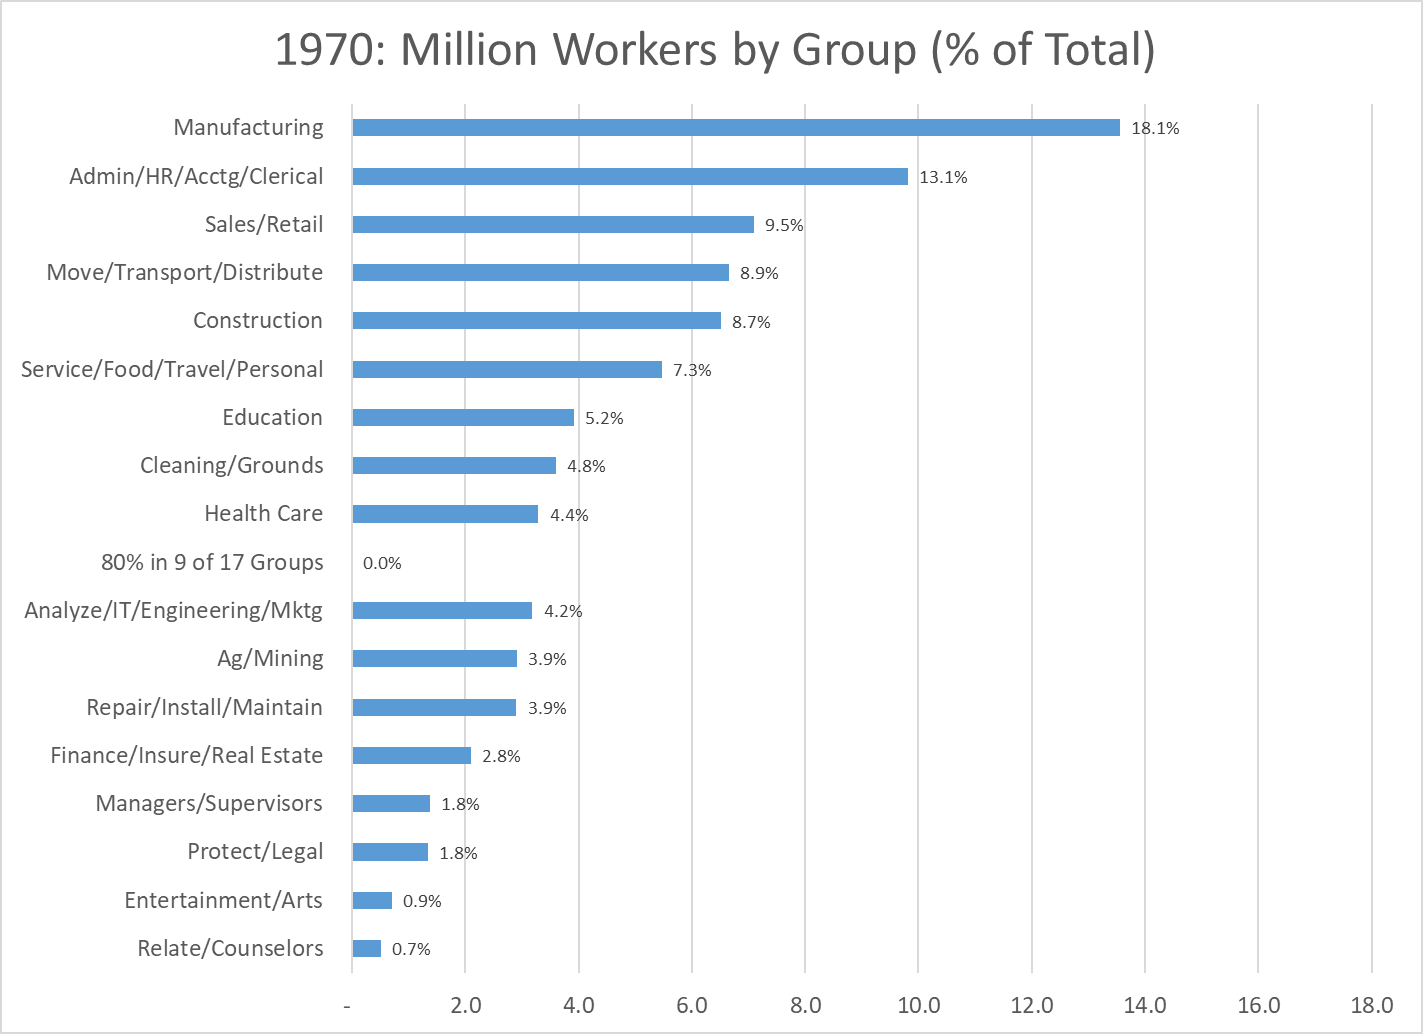
Let’s start with the 1970 data. 75 million employees. Manufacturing was the “big dog”, with almost 14 million workers, 18% of the total, a little less than one out of five.
Administrative workers, including clerical, HR and accounting staff at all job levels were the second largest group, with 10 million people and 13% of the total, one out of eight jobs. These two traditional categories accounted for 31% of the total, not quite one-third.
The next three groups each accounted for 9% of the total, one of every eleven employees. Sales workers, at managerial, professional and retail/clerical levels. Members of the logistics industry broadly defined, including both transportation and distribution staff. Employees of the construction industry. Once again, classic job functions in 1970 that would have been familiar in 1930.
The narrowly defined “service sector”, combining staff in the food service, travel and personal services industries contained 5.5 million workers, or 7% of the total. These six together included 70% of all workers.
Six other categories were each a much smaller 4-5% of the total: Education (KG-post secondary), Cleaning and Groundskeeping, Health Care, Analysis (finance, IT, operations, engineering and marketing), Ag/Mining and Repair/Installation/Maintenance.
The final five categories each averaged just 1.5% of total jobs: Finance/Insurance/Real Estate, Managers/Supervisors, Protection/Legal, Entertainment/Arts and Relating/Counselors.
By 1970 production agriculture had already declined to an immaterial share of the economy. The historically male and blue collar dominated Manufacturing, Logistics, Construction and Repair categories combined to account for 40% of all jobs; two out of five. The historically more female friendly Administration and Sales functions held 25% of all jobs, one in four. Education was the largest “information industry” at 5%, largely dominated by traditional elementary and secondary school teachers. A more broadly defined service group of food service, travel, personal service, cleaning/grounds and health care summed to 17% of the total, or one in six jobs.
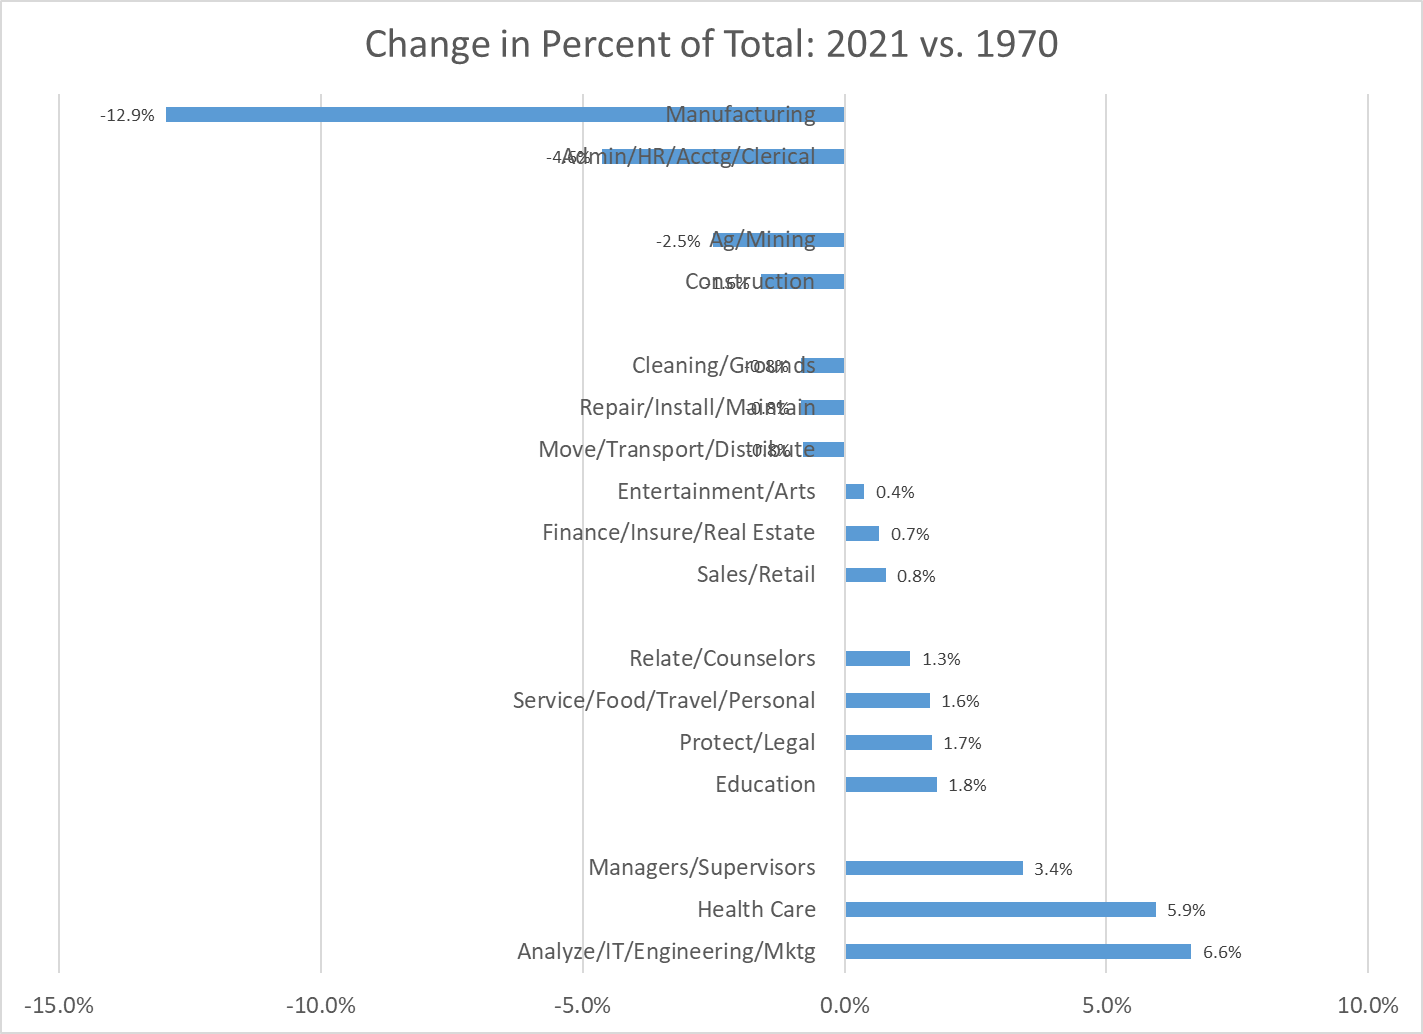
Six categories changed very significantly between 1970 and 2021. Manufacturing dropped from first place to tenth place, from 18% to just 5% of employment, from 14 to 8 million employees. US firms improved labor and overall productivity throughout this period, keeping the most productive firms and factories open, while closing and outsourcing work from the others. This was a tremendous change in the labor market, completed in just two generations of workers.
The Administrative category also declined markedly, from second place to fifth place, shrinking from 13% to less than 9% of total employment, but increasing slightly from 10 to 13 million staff. Process, computer and telecom changes drove improved productivity. Some administrative jobs were outsourced. While the Manufacturing sector lost two-thirds of its labor market share, the Administrative sector lost one-third.
The Ag/Mining group was the third losing category, dropping by nearly two-thirds from 3.9% to 1.4% of all employment. When politicians talk about “reviving” manufacturing, mining or production agriculture they are working against very strong long-term trends.
The largest growth was in the “Analysis” category, which grew by two and one-half times as a share of the total, from 4% to 10%. There was incremental growth in the existing Engineering sub-category, adding 2 million roles. The IT category grew added almost 6 million roles from a base near zero. The operations, finance, marketing analysis group added another 6 million positions to its base of 1.5 million. The “Analysts” category rose from tenth place to first place as firms became more complex and found ways to better employ the talents of individuals with high level analytical skills. At 11% of the economy, one out of every nine jobs falls into the analysis category.
Health Care increased from ninth place to second place, moving from 4.4% to 10.3% of all jobs (2.5X). The number of jobs grew by 13 million, from 3 to 16 million.
The Managers/Supervisors category climbed from fourteenth to ninth place, rising from 1.8% to 5.2% of the economy, adding almost 7 million jobs. The 1970 detailed coding was somewhat different from the modern approach, with many supervisors and managers grouped with other professions or industries. My best guess is that on a comparable basis, the 1970 category would have been closer to 2.5 million than the reported 1.4 million managers and supervisors. This would have put this group in thirteenth place in 1970. Hence, the growth as a share of the total market would be smaller, from 3.3% to 5.2%, but still quite significant. Once again, larger firms with more complexity demanded more managers and supervisors.
In total, we have 20% (1/5 workers) leaving the Manufacturing, Administration and Ag/Mining sectors and 16% (1/6 workers) joining the Analysis, Health Care and Managers sectors.
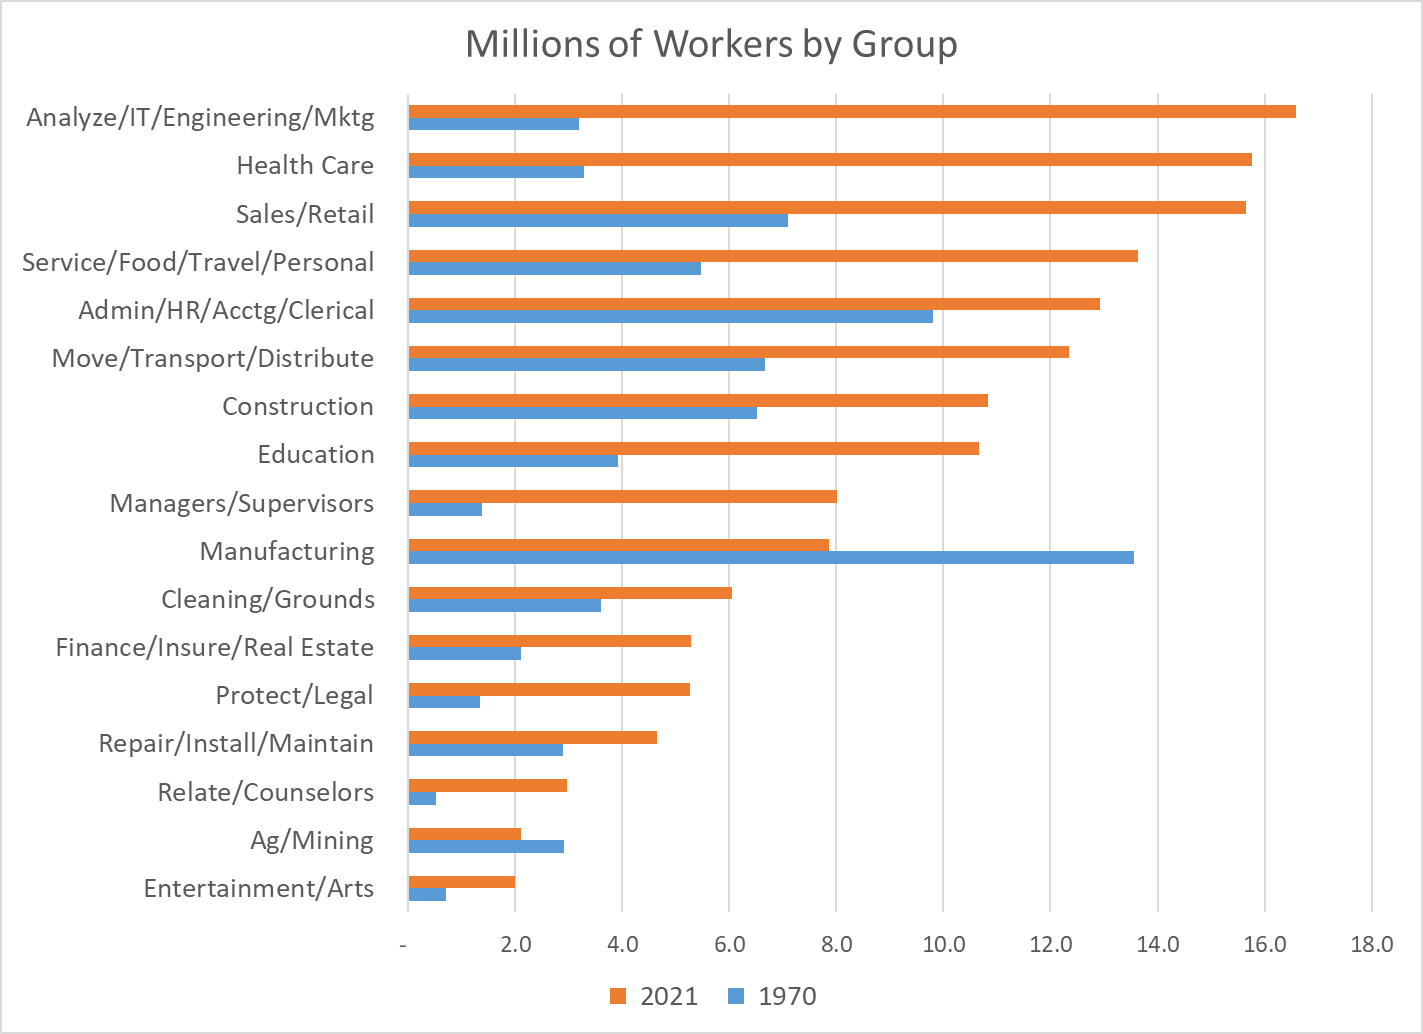
Comparing the millions of employees in 1970 to 2021 by sector clearly shows the massive changes in the labor market. The Health Care and Analysis sectors leapt from a small 3 million workers each to 16 million workers each. Manufacturing fell in absolute terms from 14 to 8 million workers. The Sales and Service sectors began as large sectors, so their relatively normal growth still added about 8 million roles each. Construction and Administration began as larger sectors and were able to add 3 million employees each, despite slower than average growth rates. Logistics grew slightly slower than the market, but added 6 million workers. Education grew faster than average, adding 6 million colleagues.
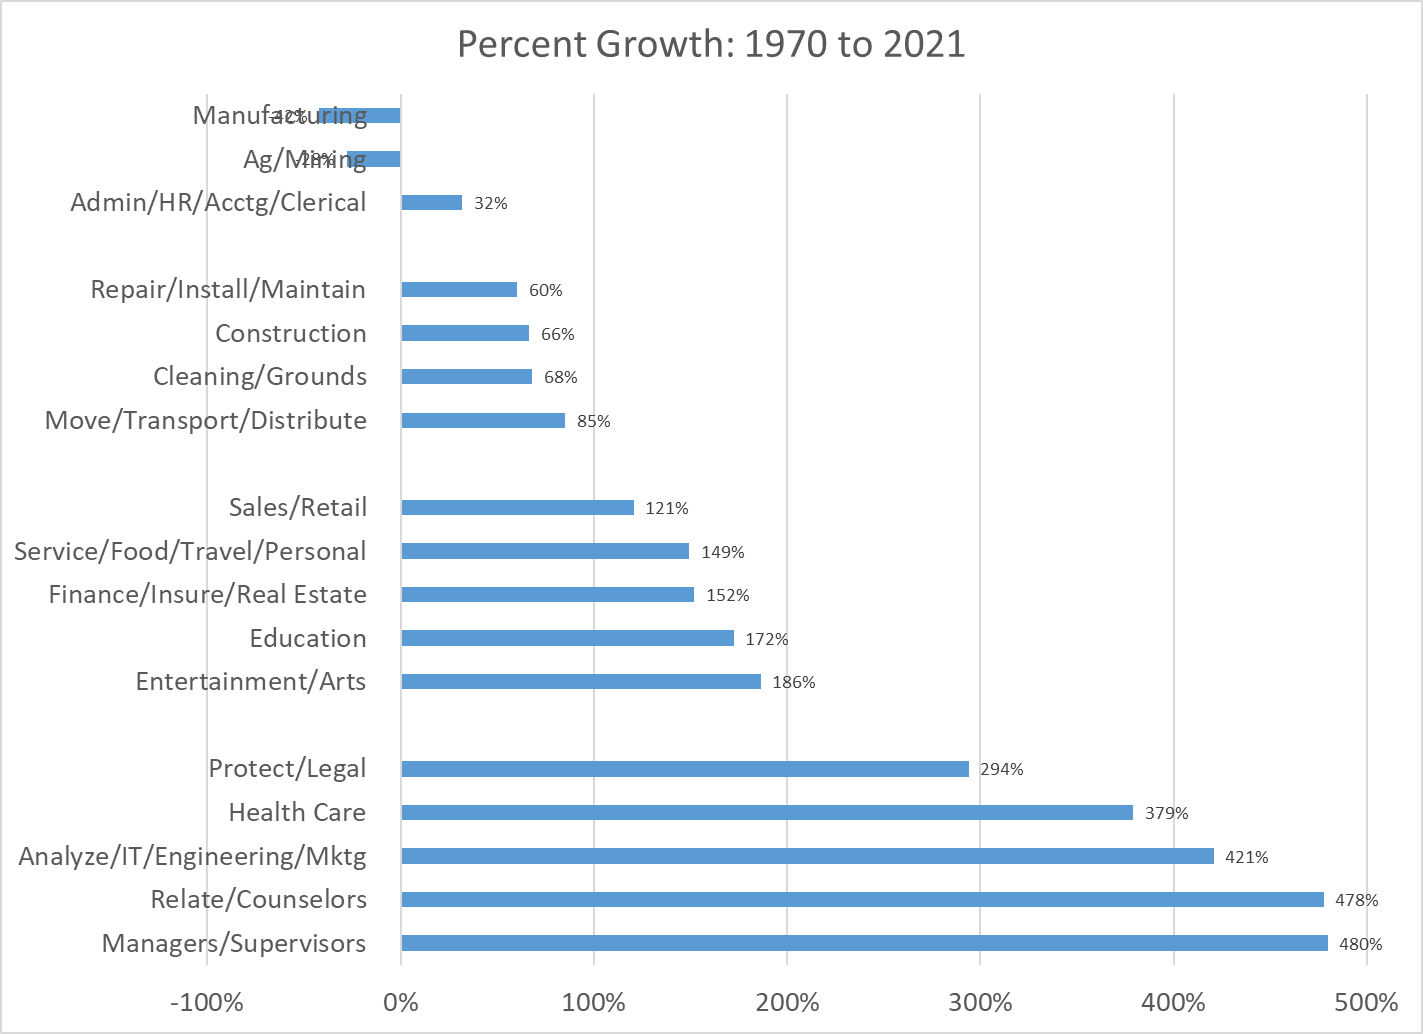
Relative growth rates as a percentage of the 1970 base or as a percentage of the total mostly tell the same story. Manufacturing, Administration and Ag/Mining have declined sharply. Analysis, Health Care and Management have grown materially.
The 152 largest detailed occupations and those with the greatest change in employment are documented below. They account for 91 million jobs, 59% of the 2021 total.
Economists assert that the principles of comparative advantage drive national economic activity. In essence, nations, firms and individuals rationally do what they are “relatively” best at, which changes through time. We see this reduction in the role of agriculture, manufacturing and mining across long periods in the US.
Economists assert that consumers’ tastes change as they have higher income and the relative prices of goods change. Once basic “food, clothing and shelter” needs are met, people turn to other “needs” and “wants”. These tend to be “services” and we also see this transformation.
Economists assert that profit maximizing firms will employ labor that provides a return on the investment based on the marginal or incremental value added by the labor resource. In a more complex economy, professional and managerial skills are in greater demand. Firms (and not-for-profits and governments) have adapted very well to these major changes in the last 50 years.
These changes are not without major pain to individuals, firms and local economies. The general trends in the economy (more automation, greater trade/outsourcing, more services, more personal care, greater role for analytical skills) are clear. Nations, firms, individuals and regions that adapt to the trends will be relatively successful. This requires wise individual and political choices and investments.
It’s time to revisit the state of the US economy. The media and stock market are overreacting to the positive news today that the US economy added about 250,000 jobs in September. Pundits and investors deem this as a “too hot” labor market which will drive higher inflation and force the Federal Reserve Board to further increase interest rates to slow the economy. We need to look at history, components of the economy and specific measures carefully to evaluate our position.
In a nutshell, the US Congress and President spent so much to offset the pandemic that we have classic inflation from higher demand and lower supply. At the same time, the Fed increased the money supply and lowered interest rates to zero to ensure that the banking sector did not provide a “credit crunch” to businesses or households. Foreign governments and banks acted similarly. This allowed the world economy to work through the pandemic with minor negative effects. However, the boost to the economy was too much and governments and central bankers were slow to reduce the stimulus they provided. The world was tightly focused on “recovering” to the pre-pandemic GDP and employment levels during 2021, so major changes in government spending and the money supply were not implemented until near the end of 2021. By the start of 2022, it was clear that growth was unsustainable and inflation was rising quickly, so policy makers needed to adjust. They have now done so and the impacts can be seen. So far, the economy is slowing, official recession or not, to low/zero growth and looks to remain at that level through the end of 2022 with low/slow growth expected in the first half of 2023.
We can call this a “soft landing”. We can call this a “growth recession”. We can call this a “recession” or a “recessionette”. There is no evidence of a “major recession” with 2% GDP declines or 3% unemployment rate increases or “50% declines” in housing starts or bank lending freezes or massive industry balances to liquidate or … Inflation is high and seems to have peaked. It is not coming down as quickly as most experts (or me) predicted during the first half of 2022, but many factors indicate that we are not in a self-perpetuating inflationary spiral.
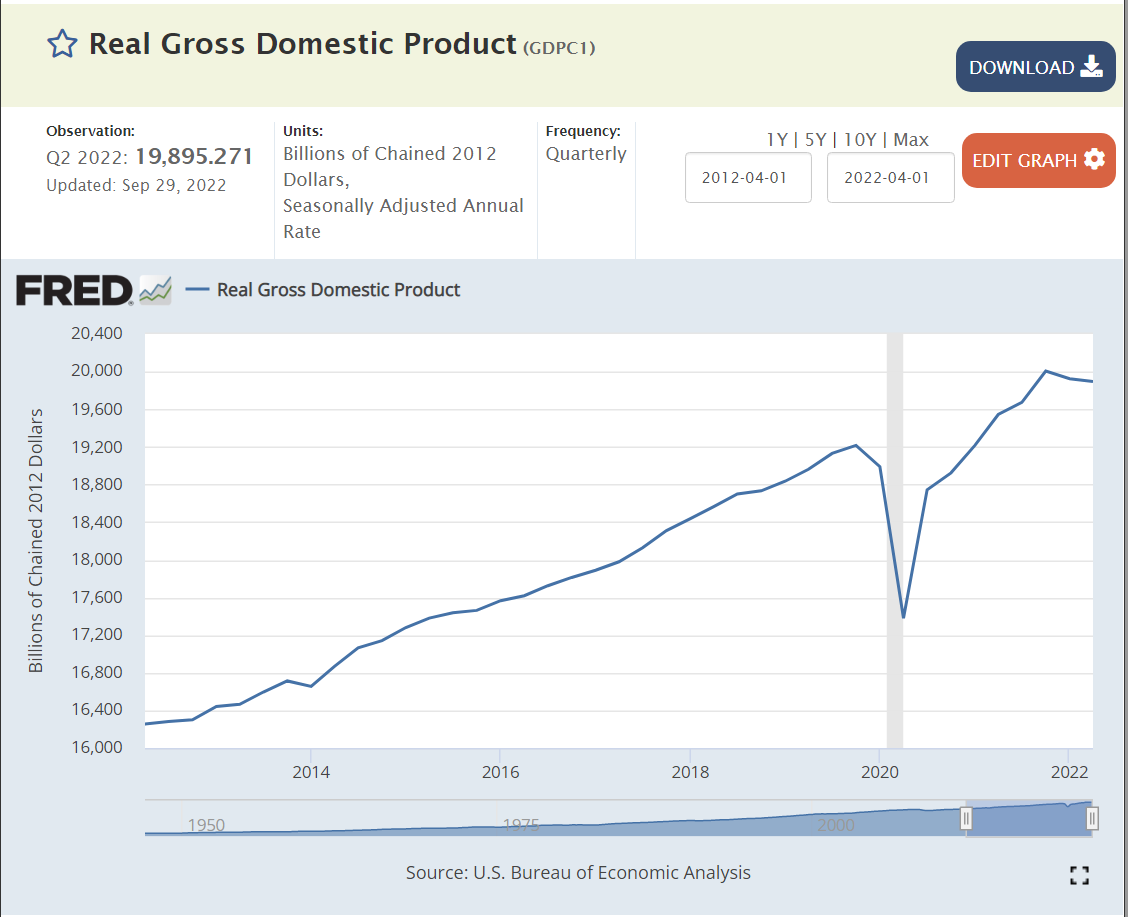
With the benefit of hindsight, real GDP growth during 2018-19 was somewhat above trend and unsustainable. A 2% excess output doesn’t seem like much, but it does matter. The economy at the end of 2021 was in roughly the same place with 3.5% style unemployment. 4Q, 2021 was more than $1 trillion higher (5%) than 4Q, 2020. 5% real annual economic growth is very rare for a large, modern, developed economy. This was after the immediate pandemic bounce. The 3rd and 4th quarters of 2022 are likely to be reported as essentially flat with the 2nd quarter. Consensus forecast is near zero growth in the first half of 2023, returning to 2-3% growth in the second half.
US government budget deficit will be $2 trillion lower in the fiscal year ending September, 2022. This is good news. The “excess” spending was capped more than one year ago, so the trend rate is part of the current core economy. “Excess government spending” is not driving inflation today. It contributed to the inflationary build-up during 2021 into the first half of 2022 (economic stimulus works with a lag effect).
The increased money in consumers’ pockets lead to a 30% increase in purchases of durable goods. Consumers had money. They were afraid to consume in-person services. They bought stuff. They’re still buying stuff. The transition from buying goods to buying services has been slower than expected. This has led to extended supply chain disruptions (globally), higher demand for many commodities and increased goods prices which feed higher inflation and higher demand for labor. The total demand for durable goods has flattened and prices have stopped increasing. This is a much-improved situation from late 2021.
Consumers did save some of their extra earnings during 2020 and the first half of 2021, but as prices increased and services became available, consumers chose to spend more and reduce their savings rate down to just 4% of income, well below the 7-8% of the prior expansion period. So, part of the “excess demand” in late 2021 was the drawdown of savings. That cannot happen again. It’s possible that low consumer confidence will reduce spending in the next year, but flat spending is more likely.
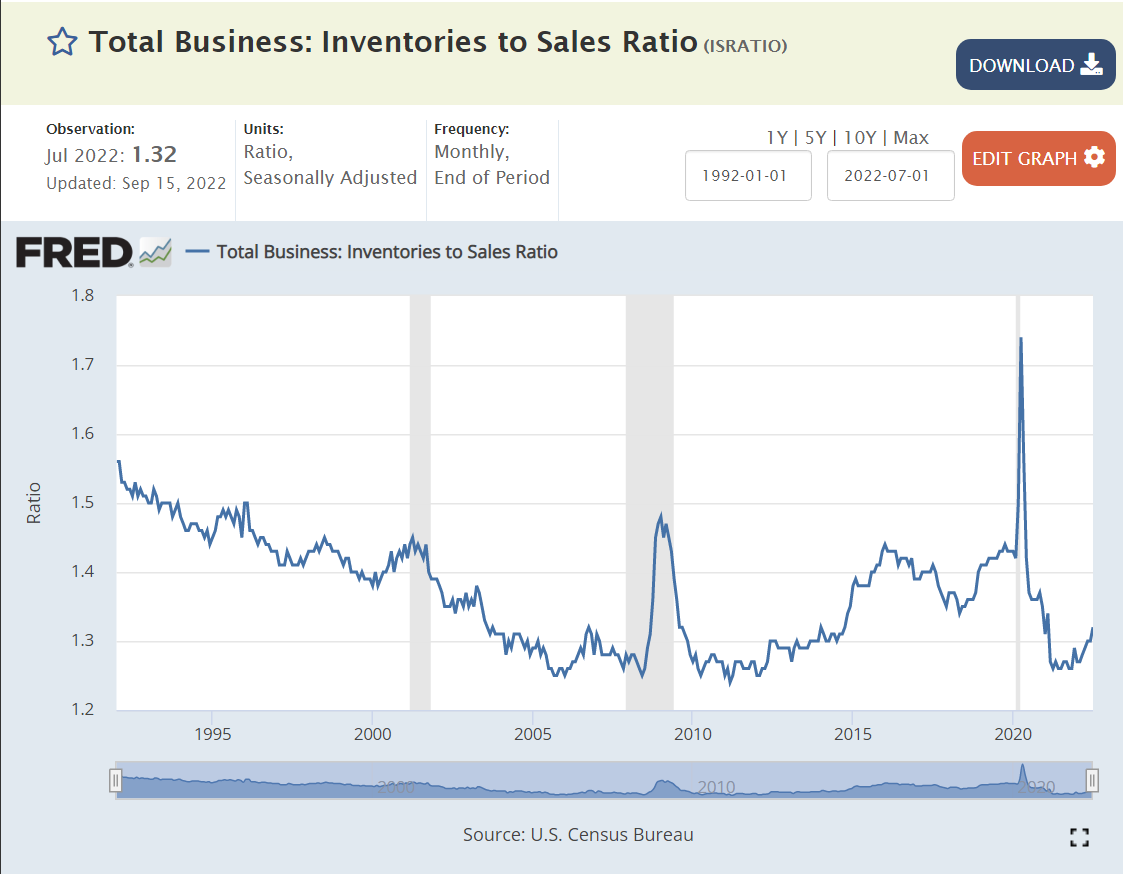
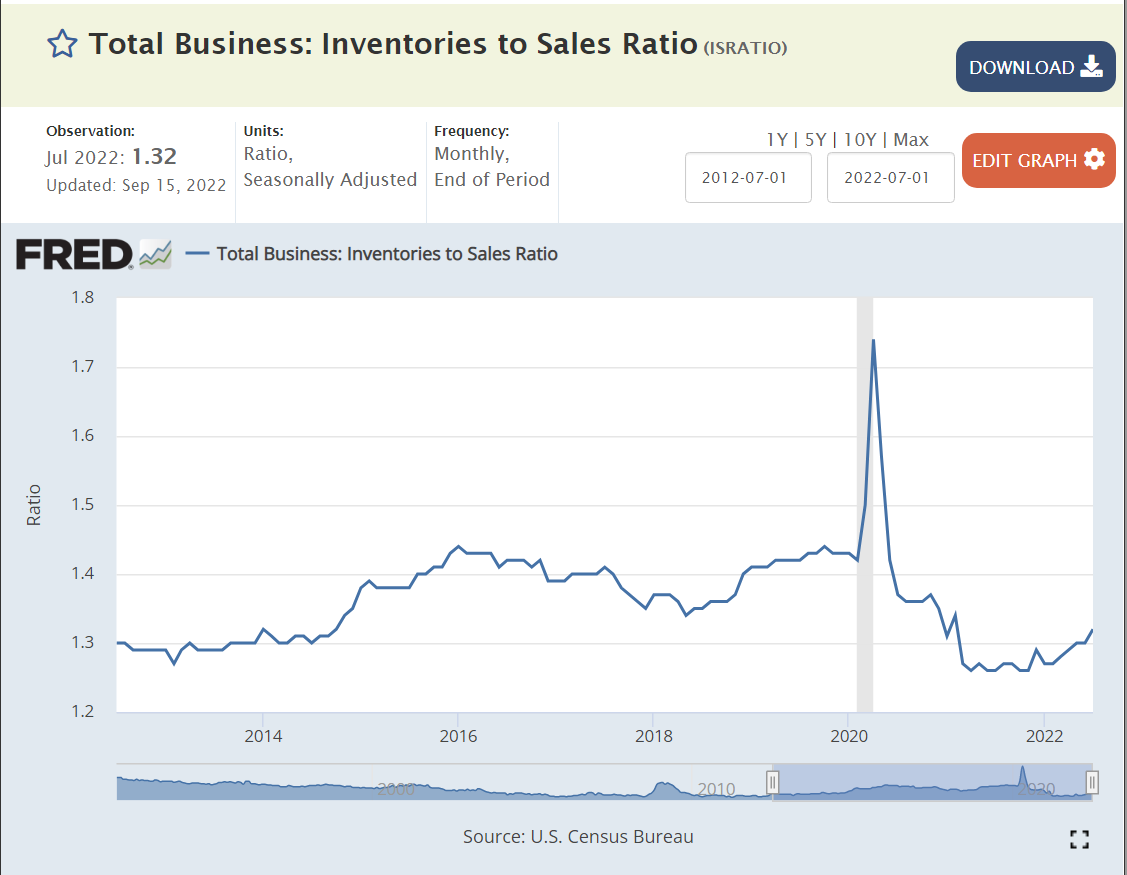
Most business cycle recessions show a clear build-up and subsequent liquidation of business inventories. Inventories were reduced (involuntarily) in the recovery from the pandemic and have increased a bit since then. There is no current indication of a pending “inventory recession”. In a “zero growth” retail holiday sales season, there will be some eternally optimistic retailers that have to cut prices to move goods, but this happens nearly every year.
The Fed increased the money supply by an historically unprecedented 25% in response to the pandemic. And then by another 10% during 2021. In hindsight, the 25% was too much and the extra 10% was irresponsible. Fortunately, the money supply growth ended by the fourth quarter of 2021 and has remained flat.
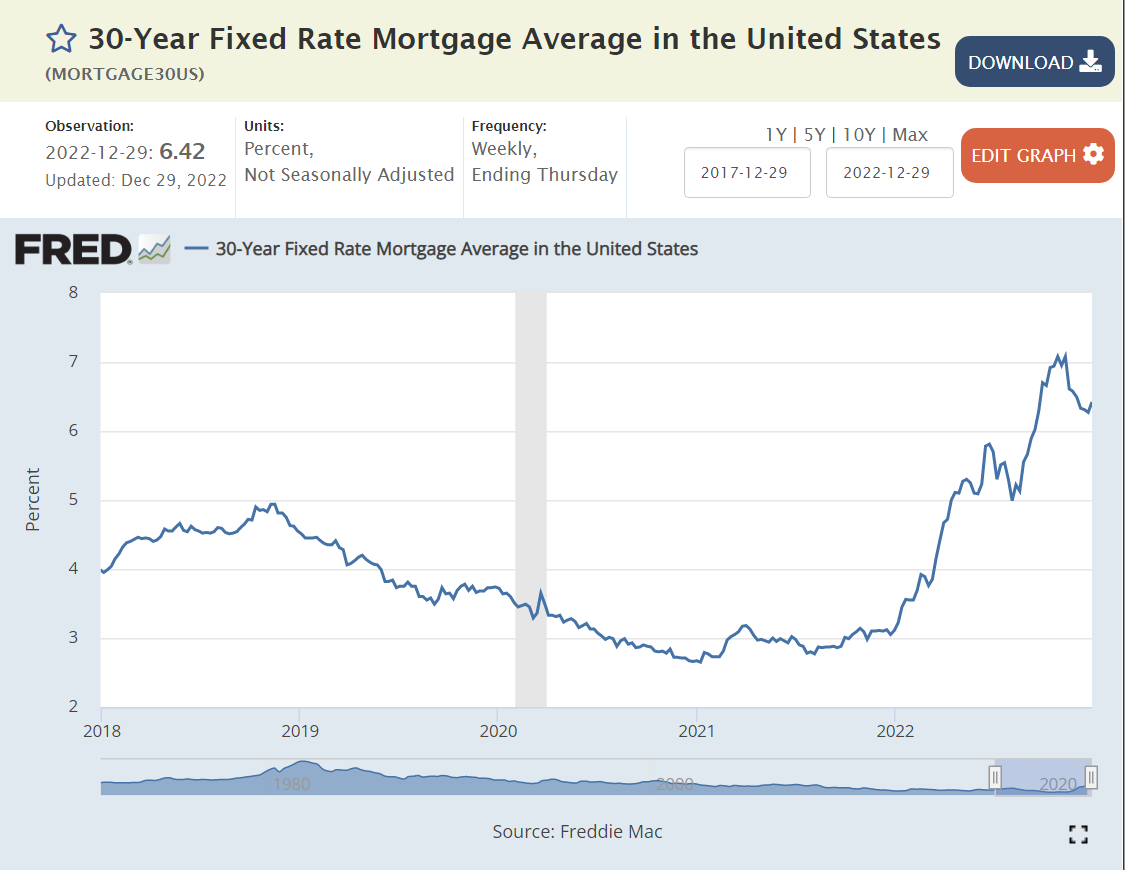
Mortgage rates were held to less than 3% for 2 years to support the recovering economy. They have now more than doubled, in excess of 6%. These higher interest rates will slow economic activity in many dimensions: lending, home buying, consumer credit, consumer spending, business investment, risk taking, stock prices, etc. Higher interest rates work with a lag to slow economic activity. They were still at “crazy low” rates at the end of 2021. The impact of higher rates is now being felt.
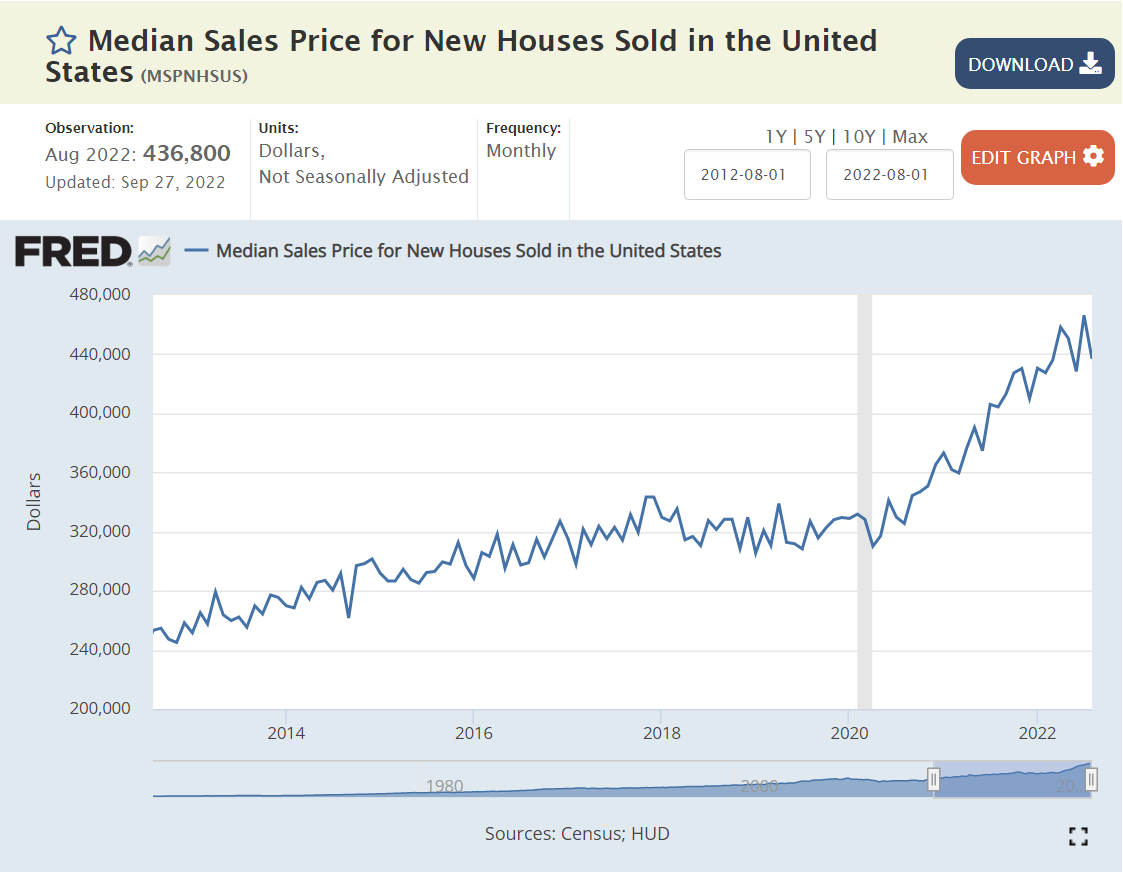
With extra savings, higher earnings, lower unemployment, restricted services available and historically low mortgage rates, consumer demand for housing grew rapidly while supply increased marginally. Housing prices (and rents) grew by 30%. Demand has now slowed. Housing inflation has slowed, perhaps to zero. This is a major channel through which GDP is decreased and inflation is reduced. Home purchases usually trigger thousands of dollars of additional move-in and fix-up expenditures.
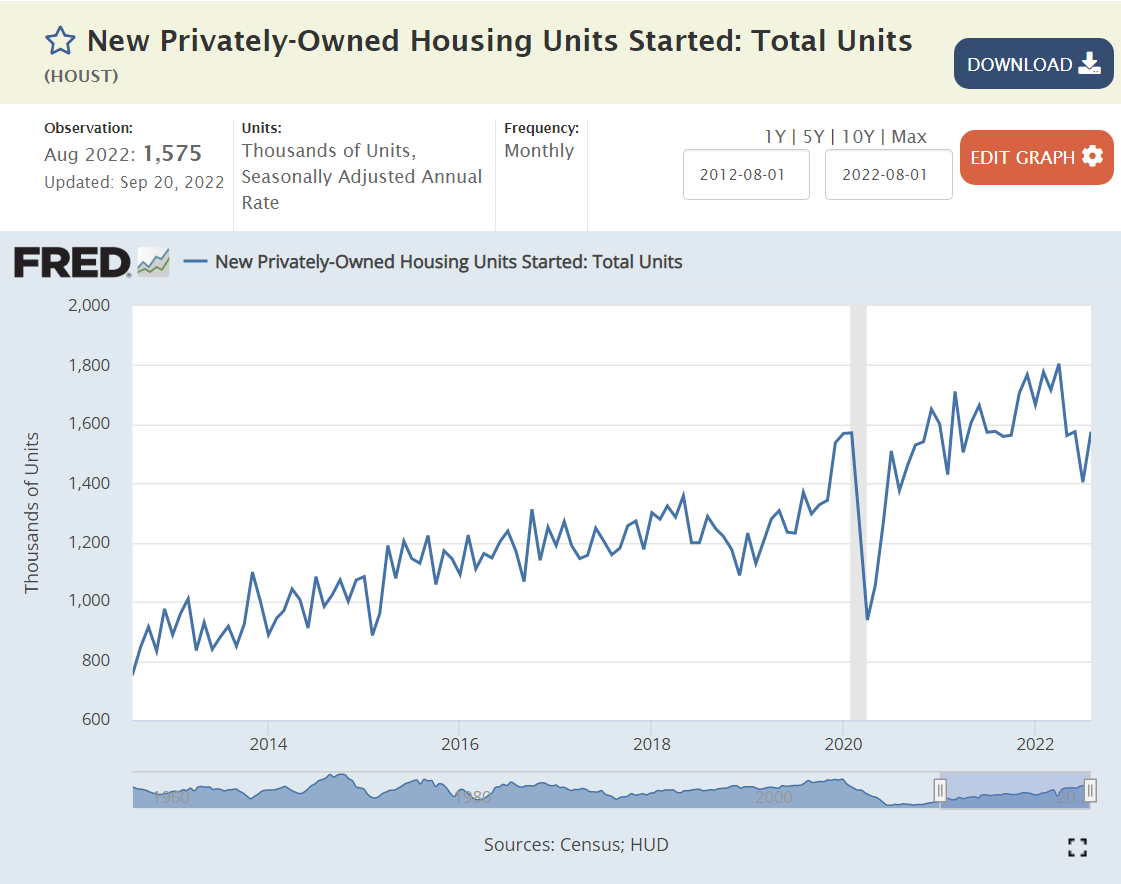
Housing sales and new housing starts have adjusted to the new interest rate environment. Note that the level of new housing starts remains above the pre-pandemic level, so some further decline is possible in the second half of 2022.
The US and global stock markets very quickly rebounded from the initial pandemic fear levels (-25%) back to the pre-pandemic levels which were more than 10% above the 2018-19 trend line. Stock markets increased after the initial pandemic recovery by 50% in line with growing profits. They have since dropped by one-quarter, a combination of lower expected future profits and higher interest rates increasing corporate financing costs and the cost of equity investors’ funds. Lower stock market prices usually have a negative “wealth” effect, with nominally poorer investors spending less in the current economy.
By the second quarter of 2021 we started to see 7-10% annual inflation rates. Increases finally slowed (or stopped) in the last 2 months. Reported inflation on a 12 months apart basis will remain above the 2% target level for the next 9 months, as high monthly inflation during the end of 2021 and the first half of 2022 remains in the measurements. Experts have a wide range of inflation forecasts for the first half of 2023, ranging from 3% to 8%. Most expect inflation to be close to the 2% target by the second half of 2023.
Producer price increases followed the same general pattern as consumer prices. They appear to have reached their peak. Producer prices better reflect global prices, especially the higher price of most commodities. Note the 30% increase in US demand for durable goods.
Global energy prices played a significant role in recent inflation. The last few months displayed an easing of prices, but recent OPEC+ decisions to reduce output indicate oil prices rising some again.
Job openings were at a historical high before the pandemic and quickly returned to that level by the end of 2020 and then nearly doubled in the next year+ as businesses saw opportunities to profit from the expanding economy, but could not find workers at the somewhat elevated prevailing wage rates. The number of unfilled jobs has dropped by nearly 2 million recently, from 12 to 10 million. The labor market is returning towards “normal”, but with 10 million open positions, the number of net new positions added is likely to increase throughout the fourth quarter, even as the Fed attempts to slow the overall economy.
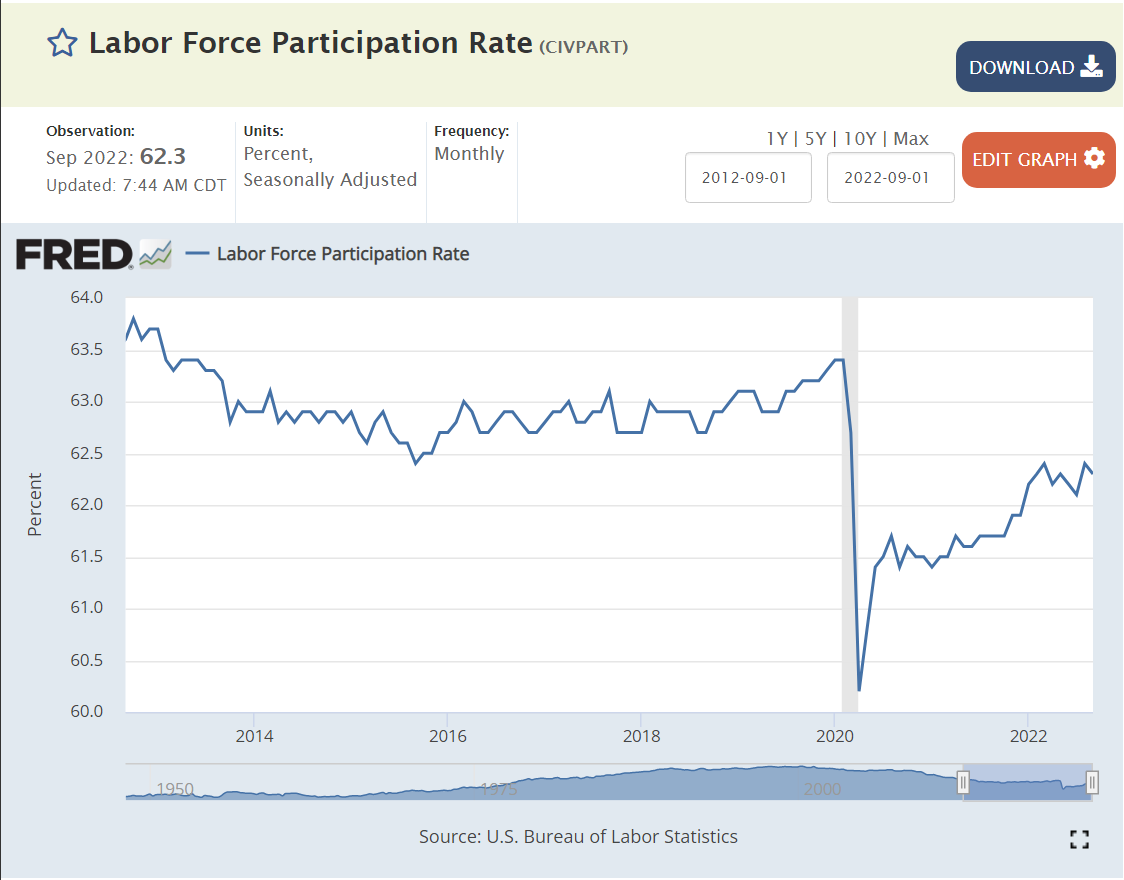
The US labor force participation rate slid from 67% to 66% to 63% from 2000 to 2009 to 2015. It dropped by 1.5% due to the pandemic (61.5%) and has since partially recovered to 62.3%, still a full 1% below the recent peak rate just before the pandemic. The labor market recovery has been good, but not great.
The core, 25-54 year old labor force participation rate has increased by 1.5% since the pandemic to more than 82.5%, less than one-half percent below the recent high of 83% before the pandemic. By this measure, the labor market is recovering nicely, but not completely.
Retirement age workers have not returned to the work force, with more than 1.5% of potential workers choosing to not join the labor market. Employers will need to be more innovative to attract workers back into the labor market.
Summary
The economy is slowing down, inflationary pressures are easing, but the labor market still looks strong. Slow to zero growth for the prior (3rd) and next 3 quarters is likely as inflation falls from 7-8% to 2-4%. Unemployment rates may increase, but it appears that the total number of employees will increase slowly during this low/zero growth period.
Claims of election fraud have a long history in the US. They exist for 3 reasons. Losers hate to lose. Fraud claims support efforts to restrict voting by opponents. Fraud claims undermine the legitimacy of US democratic processes (Russia).
TRUTH
Historically, without “checks and balances” or other controls, political parties and machines had taken advantage to ensure that they won. We’re mostly talking about 1820-1900. Even in the 20th century, there were states and cities where one party had control and could “deliver” votes at the city, state or national level. This kind of fraud largely ended by the 1960’s based on journalists, lawyers, political opponents and activists overturning this corruption of democracy. Then and now, the numbers of fraudulent votes were very small as a percentage of the votes cast, less than 1%. Fraudulent votes are effective in a democracy only when their small share can tip the election. Most claims of voter fraud are based on a misunderstanding of voting, statistics or logic.
History
In 2007, before the partisan push for photo-ID’s and Trump’s 2016 and 2020 pre-emptive and post-emptive claims of fraud, the Brennan Institute consolidated the research and concluded that voter fraud was statistically irrelevant, 1 in 10,000 or 1 in 1,000 at the most.
We are blessed with an incredibly low level of election fraud in the US for the last 50 years. With a simple two-party system, partisans from both sides have ensured that fraudulent voting is difficult to do, highly punished if discovered and easy to discover (and therefor highly disincentivized). US voting is largely managed at the lowest levels: counties, cities, precincts, where citizens know their neighbors. It is effective because enough Americans of various political beliefs today believe in this process and volunteer their time to make it effective.
Analysis
Republicans generally take a negative view of human nature, expecting individuals to actively pursue their self-interest. Hence, they expect that Democrats, with influence over the election process in some venues, will take steps to optimize their results. In an earlier age this was partially true. But, in the modern world (post 1920’s), several factors work against this direct pursuit of self-interest. The country’s laws make voting fraud a felony with significant penalties. Local election officials are elected. In a two-party system it is relatively easy to engage both parties to monitor the election process. The US has very many lawyers ready to assist their preferred party. Election results are public. Statistically improbable results are very easy to identify today. Each precinct has a historical preference which is unlikely to change materially in any single election, so any fraudulent voting is easily identified.