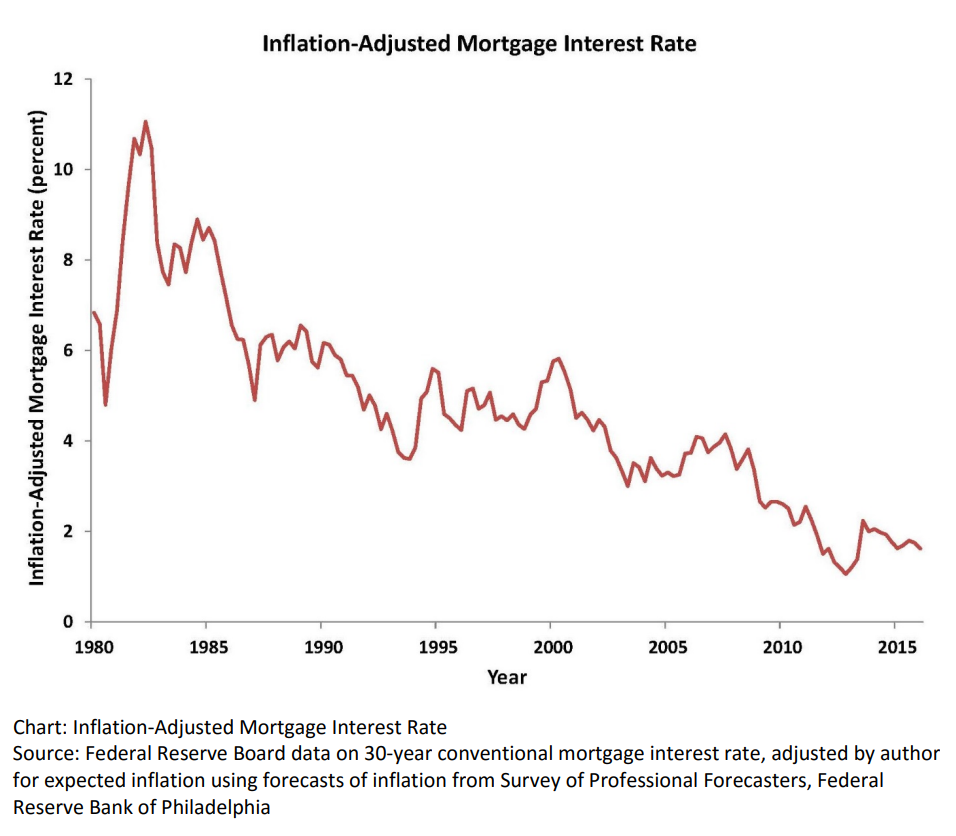
Real, inflation-adjusted, interest rates have declined greatly since 1980. At that time, with the risks of variable inflation and surging oil prices, the real mortgage interest rate was 8%. It declined to 5% in the 1990’s and 4% in the 2000’s before falling to 2% in the 2010’s. The financial cost of owning property has rarely been lower.
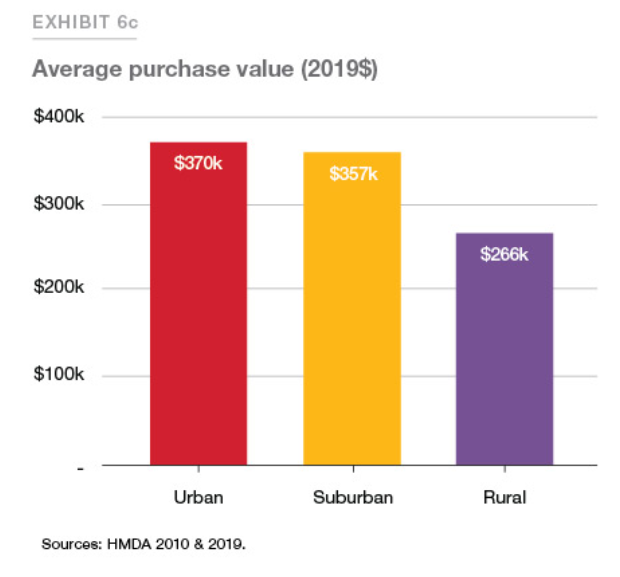
House Values are Up, Way Up
House prices grew relatively consistently from 1970 through 2000, with a spike in 2005-9 and a return to trend values in 2010-12. In the last 10 years, house prices have increased by 6% annually in nominal terms, or 4% annually in real terms.
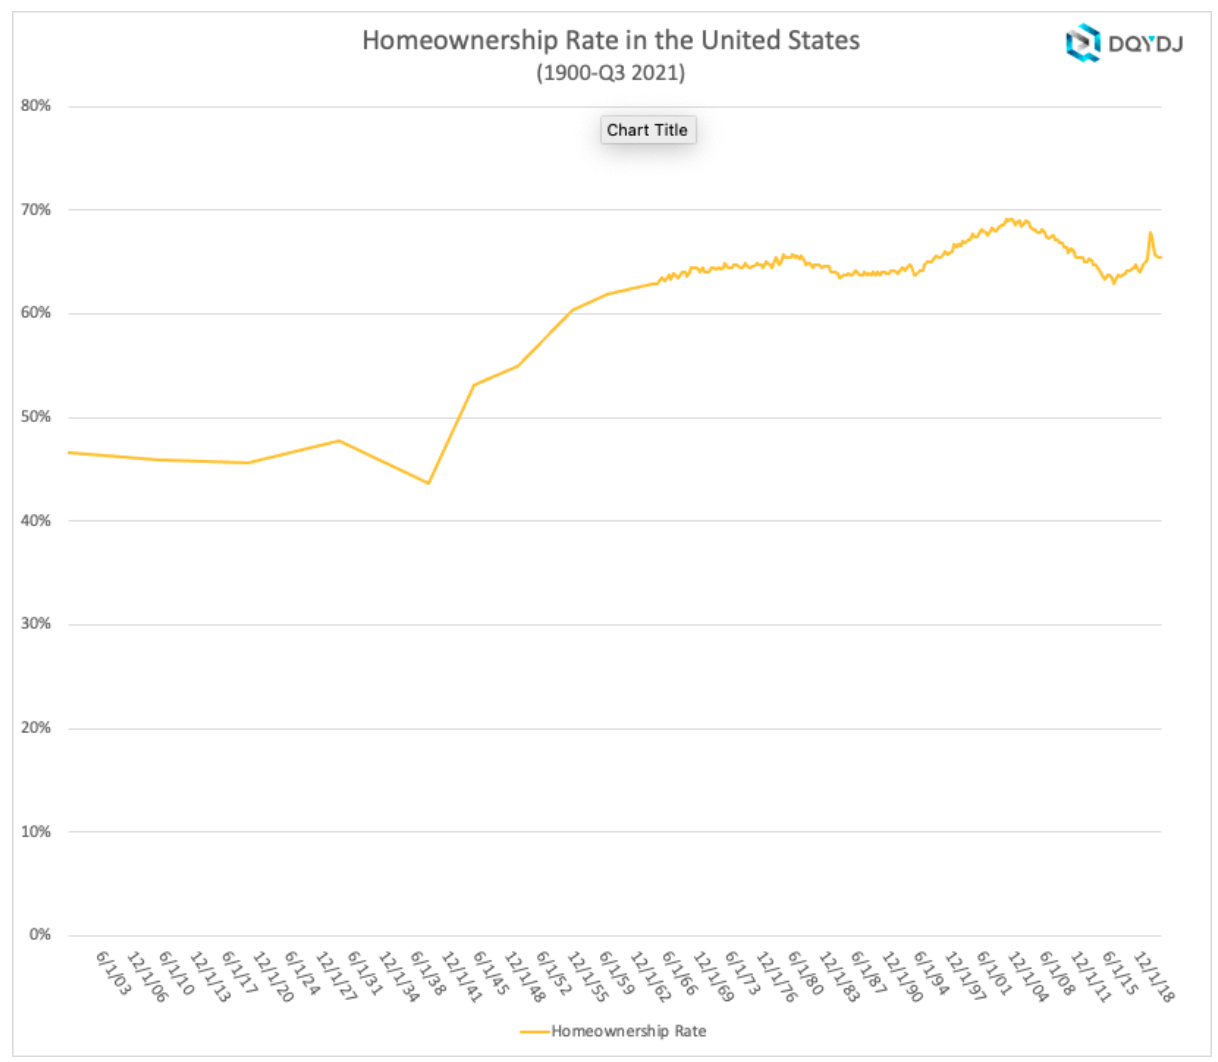
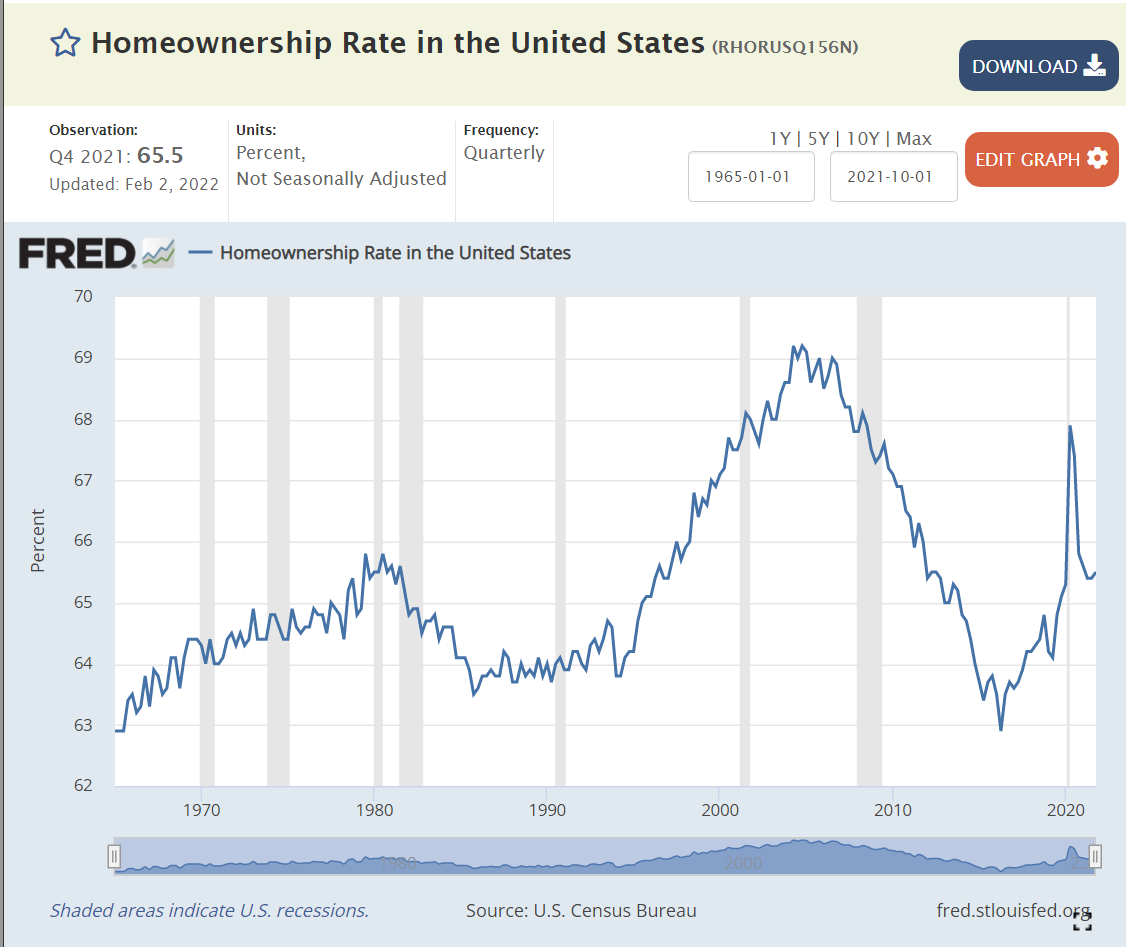
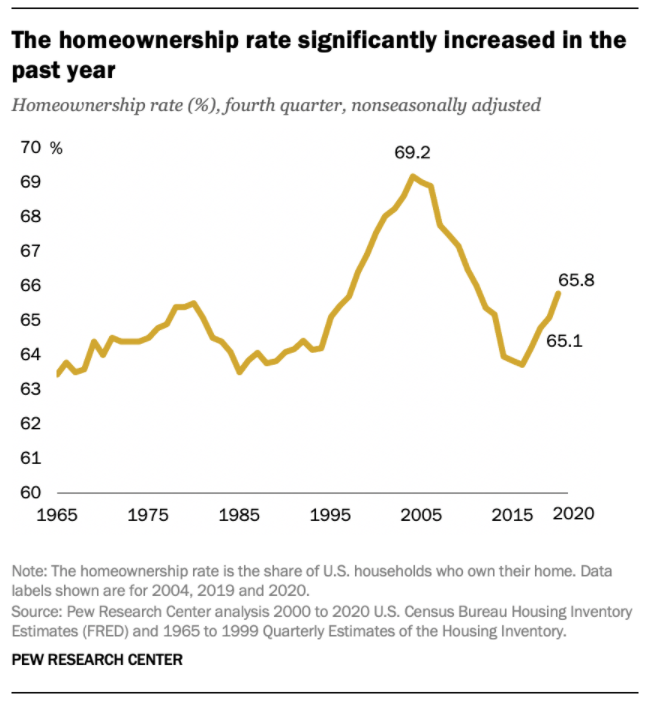
Home Ownership Rate is Rebounding, Up 2%
The US homeownership rate averaged 47% from 1900-40. It increased smartly in post WWII times to 60% by 1955 and 64% by 1965. Homeownership averaged 64%+ for the decade of 1969-78. It increased by 1% during 1979-81. In the midst of a difficult depression, homeownership rates dropped back to 64% by 1985, about the same for the last 20 years, setting a “normal” level. Homeownership rates stayed at 64% for the next decade. Ownership rates increased from 64% to 69% in the next decade before declining right back to 63% by 2015. In the last 7 years, despite many headwinds, the home ownership rate has increased by 2%.
Number of Homeowners has Jumped by 7 Million
In 2000, there were 69M owner-occupied homes in the US. This increased by a solid 7M to 76M by 2005. The housing market hit a lull and the number of owner-occupied homes essentially stayed flat for a dozen years, through 2017. The supply of owner-occupied homes then rose by a strong 7M in the next 4 years to 83M!
The housing market is inherently volatile, typically rising by 2 times the trend and then falling to one-half of the trend. Annual housing starts averaged 1.6M from 1960-2008. They declined by a severe 75% to just 0.5M in 2009. Housing starts have subsequently grown 3-fold to 1.6M annual housing starts, but the accumulated lack of new supply is impacting housing markets today.
The period from 1982-2000 showed homeownership rates by the 5 age segments remaining relatively constant; 65+ 78%, 55-64 80%, 45-54 76%, 35-44 67% and <35 40%. The 65+ group increased homeownership from 75% to 80%. During this time, the overall US homeownership rate increased from 65% to 69%, mostly due to the aging of the population, now more heavily weighted towards the groups with 76-80% homeownership versus the 40-67% younger groups.
Homeownership rates grew from 2000 to peak rates in 2004, before declining significantly for all groups except for the 65+ cohort which essentially held it’s own. The adjacent 55-64 class fell 4%. The middle 45-54 group dropped 7%. The typically homeownership growing 35-44 group cratered by 9%. The young <35 group fell by 5%. Hence, the overall rate fell dramatically during this time.
There is a 30 point gap between married couples and other groups, with 84% of married couples owning homes versus about 55% for other family structures.
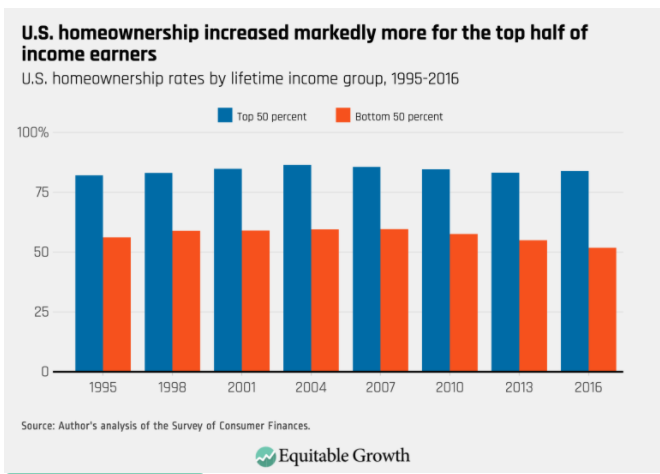
The US shows dramatically different homeownership rates by racial category. The differences between the 1995 non-Hispanic White rate (70%) and Others/Asians (50%), Hispanics (42%) and Blacks (42%) remain large in 2021 where we see White (74%), Other (57%), Hispanic (48%) and Black (44%). The groups homeownership share gain from 1995 to 2005 were similar, ranging from 6-10%, but the decline from 2005-2015 was only 3-4% for Whites and Hispanics, but 7% for Blacks and Others. The improvement from 2015 to 2021 has been 2% for 3 groups and 4% for the Other/Asian group.
Summary
The Great Recession flattened the housing market. The number of owner-occupied homes in the US remained level at 76 million from 2006 – 2017. The number of housing starts plummeted from 2.0M to 0.5M per year, compared with an historic average of 1.6M. New home construction first exceeded 1.2M units (75% of historic average) again only in 2020, a dozen years later. New home-owning households have increased by 7M units in the last 4 years! The homeownership rate is up 2 points, from 63.5% to 65.5%. Supply is responding to increased demand and higher home prices. Homeownership rates will increase with the economic recovery, but be constrained by higher home prices.
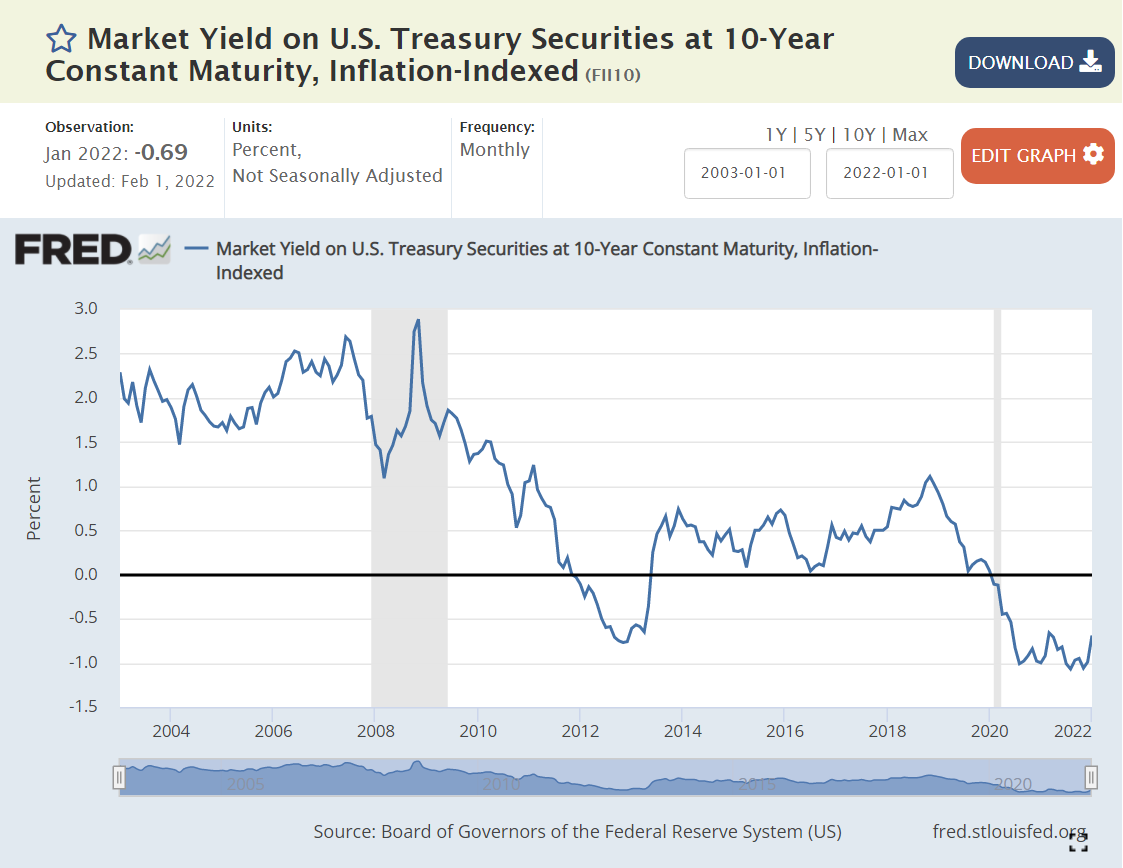
The “real” interest rate is the nominal interest rate minus the inflation rate. It reflects the “real” cost of borrowing. Prior to the “Great Recession”, 2% was a typical “real cost” of borrowing money. To entice lenders to lend, borrowers had to pay some “real” amount extra per year, 2%.
The Federal Reserve did what it could to “ease” monetary conditions and lower interest rates to offset the negative impact of the Great Recession in 2008-9.
By the end of 2011, real rates were ZERO or negative. In other words, the Fed went too far. By June, 2013, rates returned to positive territory, but only reached 0.5%, where they remained through the end of 2017, despite president Trump’s complaints that the Fed was constraining the Trump economy. Monetary policies were “easy” for a very long 7-year period.
By May, 2019, real interest rates were back to just 0.5%, having reached a peak of just 1% for 3 months at the end of 2018. With further “easy” money policy, real rates dropped back to ZERO percent by August, 2019. The economy was now 9 years into recovery. Interest rates should have been higher.
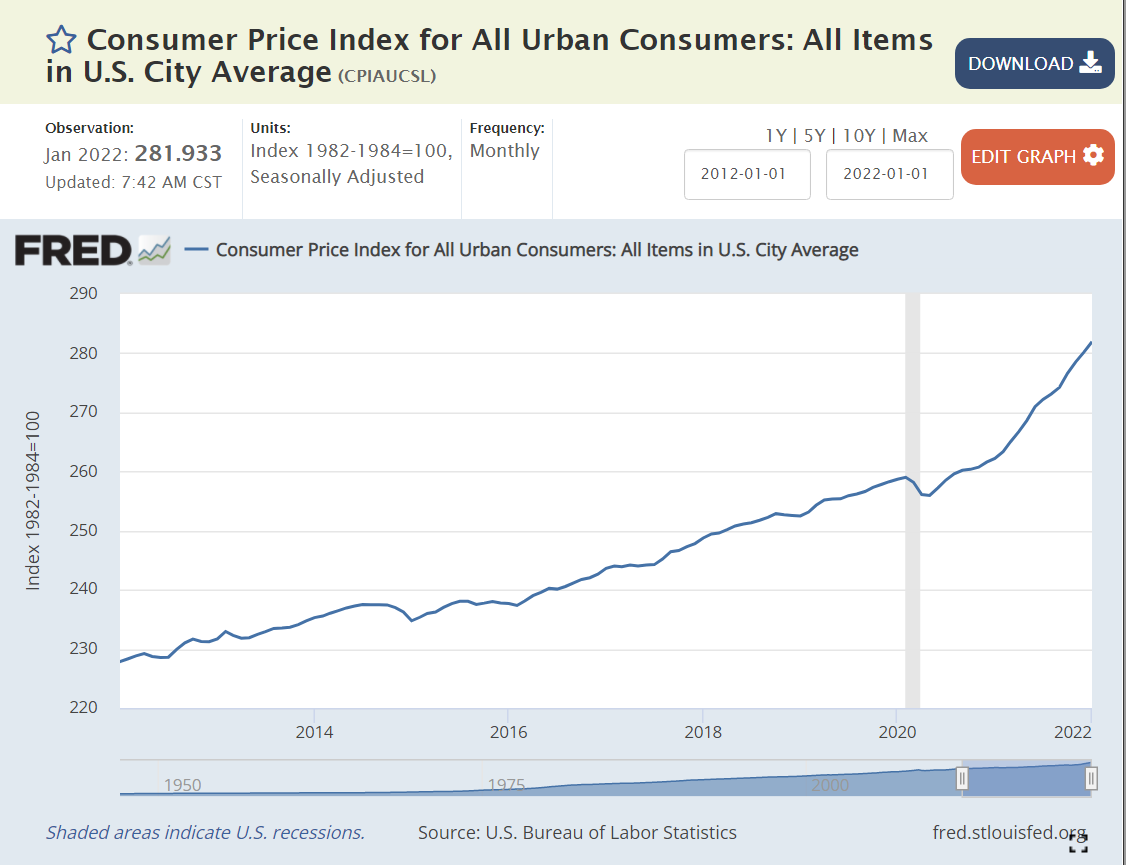
The Fed found new ways to “ease” monetary policy as the pandemic struck in 2020. Real interest rates dropped to -1% and stayed there. Monetary policy has been “easy” for more than a decade. Time for inflation. “Too much money chasing too few goods”. “Inflation is always and everywhere a monetary phenomenon”.
Supply Chain Disruption
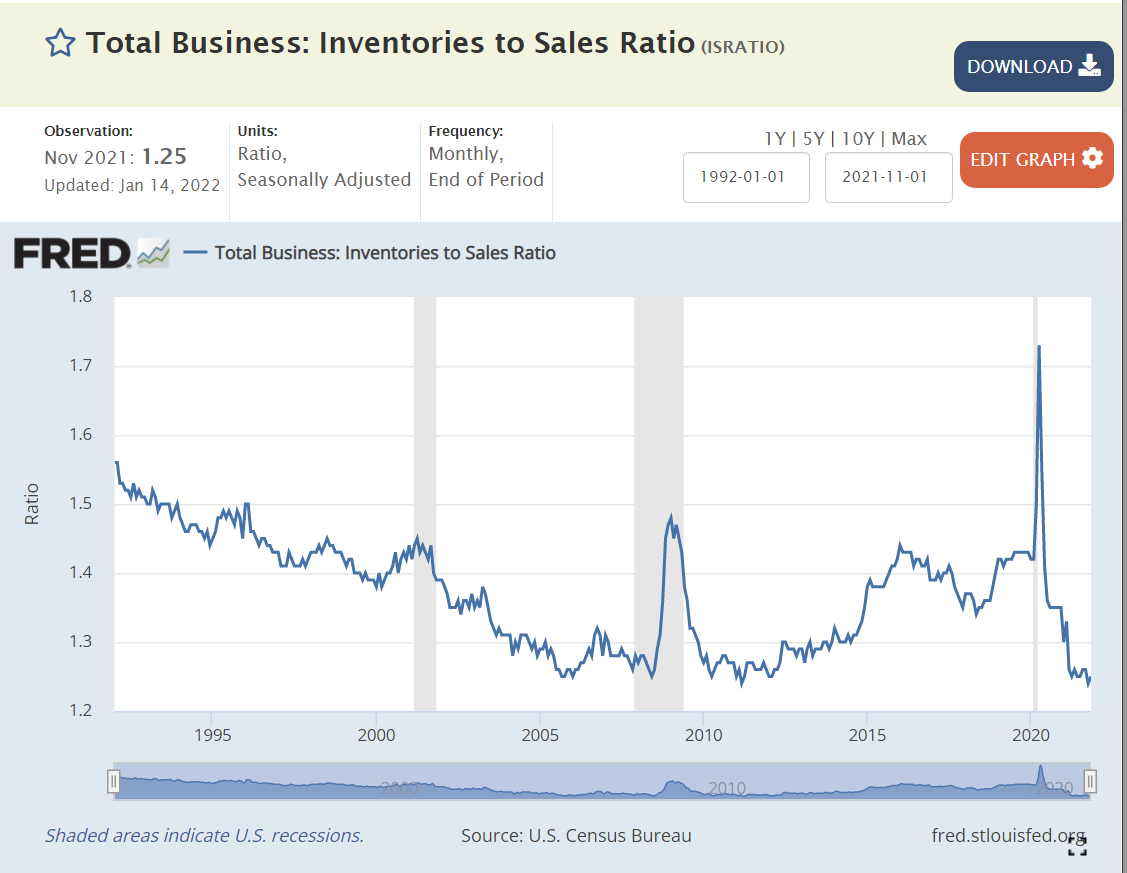
The recovery has been faster than anyone expected, but most critically, with consumers less eager to buy “in-person” services, they have greatly increased their purchases of goods. The modern US economy relies on imports and modern manufacturers and retailers hold lower inventories to buffer changes.
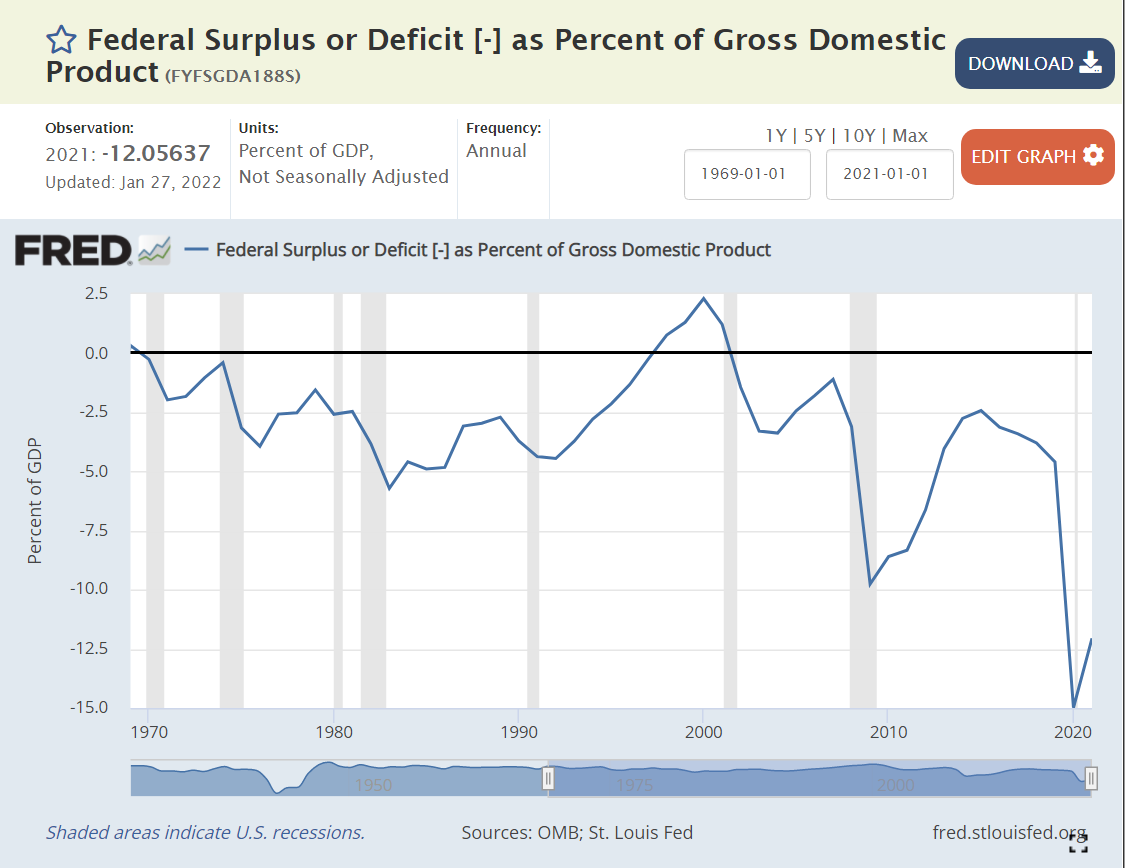
Standard macroeconomic theory focuses on aggregate demand versus aggregate supply as the key driver of output, unemployment and inflation. When total demand grows faster than remaining excess capacity of total supply, inflation results. The biggest driver of changes in aggregate demand is the level of government spending (demand) minus government taxation (reduces demand).
Historically, various pressures have kept the federal budget deficit between -3% and +3% of GDP, allowing the government to buffer change in private demand through the business cycle. The large drop from -2.5% to -5% in 1979-82 was a factor that contributed to the last major round of US inflation. A similar decline from -2.5% to -4% in 1989-91 increased inflation, but not on such a large scale. It also served to convince President Clinton and congress to reduce the deficit to ZERO by 1997 and run a surplus for a few years.
The 2001 recession caused a 2.5% decrease in this ratio, from a surplus to a deficit. Bush tax cuts, foreign wars and congressional agreement lead to deeper deficits at 3.3% in 2003-4, before some recovery to -1% in 2007, prior to the Great Recession.
Bush, Obama and congress agreed to spend more to fight the Great Recession, pushing the deficit to a worryingly low -9.8% in 2009. There was no agreement on a second major round of spending, so the deficit improved a bit to -6.6% by 2012 and then to a more reasonable -2.5% in 2014-15. Instead of continuing to improve with the economic recovery, it fell a little, to 3.1% in the last year of the Obama economy.
President Trump’s first order of business was to enact “job creating” tax cuts. Unfortunately, the desired boost to economic growth to fund these tax cuts did not occur. The budget deficit increased from 3.1% to 4.6% of GDP, as the economy reached a record long recovery period of a full decade.
To address the pandemic, congress and Trump agreed to spend money to protect the economy and workers, leading to very large budget deficits of 15% and 12% in 2020 and 2021, respectively. Too much aggregate demand for the level of aggregate supply, so we have major inflation.
Summary
Easy money, easy fiscal policy and a 20% increase in demand for goods leads to major inflation. Like a frog getting boiled as a pot slowly warms up, we became complacent based on the apparently “just right” conditions of the late teens (2012-19). The federal budget deficit needs to get back above -5%, real interest rates need to become positive and consumers need to rebalance to consume more services and less goods. I don’t think we’ll see 7% inflation for 2022, but it looks like 4-5% is a good bet. Hold on.
Politics
Biden deserves a good share of responsibility for the government spending budget deficit, as he was seeking to make it even larger. I give him a “pass” on consumer demand for durable goods since it mostly occurred before he started. I also give him a “pass” for the loose Fed monetary policy which has been going on for a decade or so. He was wise to reappoint the Fed chairman, who I believe will raise interest rates as needed to get the real interest rate back to a proper level. In the meantime, Biden will pay politically for higher inflation, which has a “real” impact on the wallets of voters.
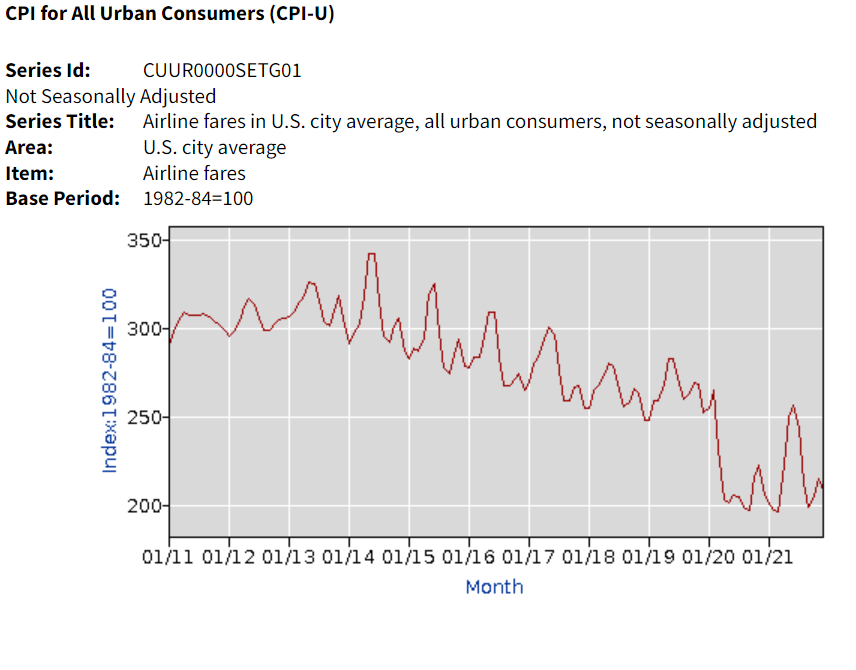
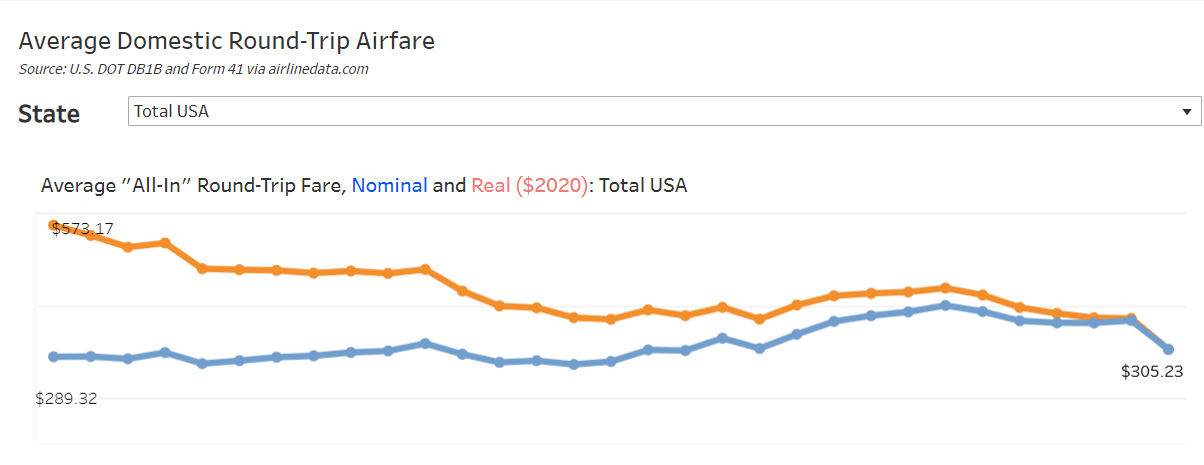
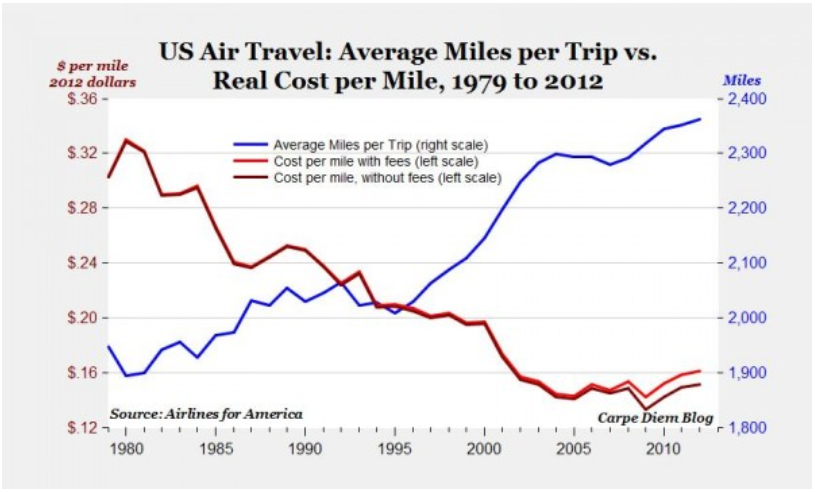
This article combines data from 4 sources with slightly different data. Airfares were flat at the end of the 20th century, but then dropped by 19% by 2004. They remained flat, in real terms, through 2009. Airlines pushed through 8% higher prices in 2010-11 and maintained real fares at the same level through 2014. After 19 years, real airfares were 14% lower than in 1995.
Fares then dropped year after year through 2019, reaching 26% below the 1995 baseline. They have fallen further in the pandemic years to 43% below the level of 25 years ago.
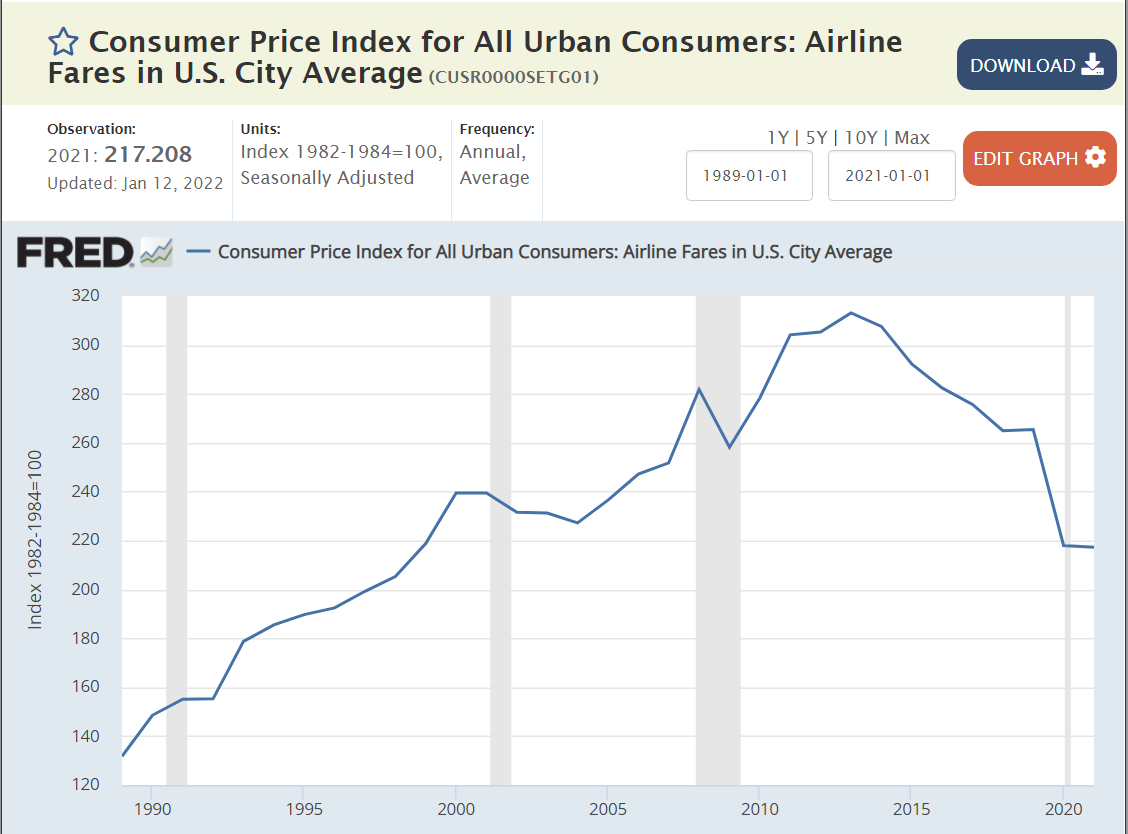
Bureau of Labor Statistics / CPI
The Bureau of Labor Statistics compiles a consumer price index for air travel as part of the overall CPI. It compiles average prices and tries to adjust for changes in the quality of the product.
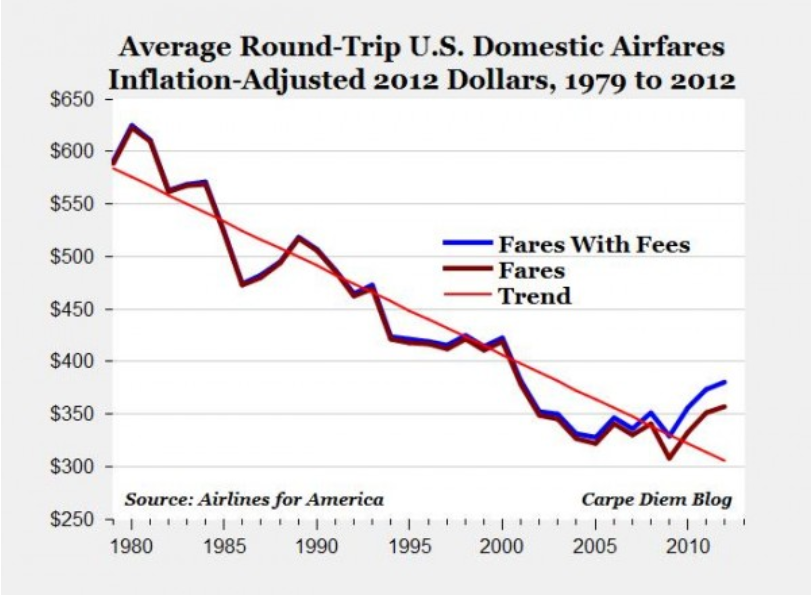
Real airfares declined consistently throughout the period, but no data source is fully compatible with the 4 summarized above. It appears that the real cost of flying declined by about one-third between 1979 and 1995 as the airline industry was deregulated.
Political views are rationalizations of moral intuitions. They are demonstrably not the result of dispassionate analysis by individuals.
A small number of moral intuitions are broadly held across time and cultures and can be “explained” on the basis of evolutionary pressures on mankind.
The prevalence of the six logically defined and statistically confirmed dimensions differ markedly between liberal and conservative minded people in various cultures.
1. Care/Harm
Desire to protect children and weaker others from harm. Caring, kindness, gentleness, nurturance, compassion, feelings, empathy. Liberals and conservatives both show an interest in this dimension of morality. Liberals value this dimension most highly. Conservative men and libertarians, on average, show much less interest in this dimension.
2. Fairness/Reciprocity/Cheating
In a social setting, there is a need to rely upon others keeping their word, being honest, doing their share of work, etc. Justice, rights, cooperation, deception, trust. Liberals tend to interpret this in terms of equality. Equal rights, equal opportunity and equal results. Conservatives are closer to the evolutionary basis as seen in game theory / the prisoners dilemma / “tit for tat” winning strategy. They highly value proportionality, closely linking results to inputs or effort.
3. Liberty/Oppression
No one wants the “alpha dog” to take advantage of their position. Individual and group opposition to domination, tyranny, restrictions, bullies and cruelty. Liberals and conservatives both value this dimension in modern, western, secular, commercial societies. They define the oppressor differently, with liberals focusing on business and institutional sources of power and conservatives focusing on government and regulators. Libertarians value this dimension most highly. These first 3 sources of morality are more individual oriented, mediating the tensions between individuals and groups.
4. Group Loyalty
Clear commitment to the group. More than “limited liability”. Betrayal, in-group attachment, patriotism, nationalism, betrayal, self-sacrifice, us vs. them, tribe, religion, party, flag, clan, neighbors, family. Conservatives value this dimension very highly, with felt loyalties to several groups. Liberals value this dimension, but not nearly as highly; with a tendency to value the largest groups: nation, humanity, nature. The liberal focus on “diversity” and valuing others, outgroups and the “oppressed” is very different from the conservative worldview. Western, secular, commercial societies value this dimension less.
5. Authority/Respect
Larger groups require some degree of hierarchy. Leader and follower. This is a complement to the liberty/oppressor value. Respect for authority, leader, institution, rules, history. Safety, order, predictability. Obedience, deference, submission. Against subversion, revolution. This is the classic conservative value, supporting the known value/benefits of a given system against the potential value/risks of change. Modern, individualistic liberals tend to not value this dimension highly, instead choosing to “challenge authority”.
6. Purity/Sanctity
The sixth dimension differs from the first 5. It is not so clearly about managing the “individual to group” challenges. It focuses on the disgust/gag reflex to things or situations that are so threatening as to be beyond consideration. This takes place at both the practical and the abstract levels. Degradation, disgust, disease, infection, dirt, germs, contamination, carnality, body, sex. Piety, chastity, temperance, compliance, burning, cleanliness, food rules. Everyone has some sensitivity to this dimension, but conservatives have much higher concern. Research says that conservatives, on average, have a lower interest in new (unsafe, novel) activities or experiences. Moral values 4-6 retain higher priority outside of western, commercial, secular societies. Liberal references to purity may focus on things like the environment.
Haidt is a self-professed “liberal” who intuitively/instinctively rejected the “rational” morality theories he learned in graduate school in the 1980’s. During his early research on alternate approaches, he had the “aha” insights that 1) other cultures have very different moral values and that 2) moral/political views are intuitive and rationalized. He hoped/hopes that liberals can see that their more limited moral palate (3 items) is not the only one and that this difference between including or not including the other 3 bases is a huge insight, even if liberals choose to not value the other 3 dimensions. He analyzed national politics in each election cycle from 2000, highlighting the large advantage that Republican politicians have in monopolizing the 3 other dimensions. In 2016, he advised the Dems to fight against Trump on the “conservative” moral dimensions of loyalty (Putin?), authority/order (Trump chaos/revolution/policy changes), and purity (sex allegations) instead of policy positions or personal character.
Haidt collaborated with a CATO scholar to analyze the 2016 Democratic and Republican candidates for the presidency, analyzing their supporters in terms of the Moral Foundations Theory.
The basic conclusions are supported, but all details are not. The 1 Care / 2 Fairness versus other dimensions emphasis between liberals and conservatives is supported. But, statistically, there may just be individual versus group moral foundations (2 dimensions versus 5-6).
Group? Which group? Small or large? In-group or out-group? Research is now focused on defining questions that clarify in-group versus out-group attraction and then, the difference between liberals versus conservatives, if any.
Academics have been busy working on the details. One criticism is that the 5 or 6 dimensions were defined in an ad hoc manner, rather than part of an overall theory of how man evolved. One group has stepped up to propose a theory that is solely based upon the various forms of cooperation, resulting in 7 dimensions.
On the academic left, Haidt’s “moral equivalence” approach to the 3 modern, secular, liberal values and the 3 historic, religious, conservative values has been sharply criticized. An alternate view that highlights bias/bigotry, social dominance, right-wing authoritarianism, Schwartz Value Theory and Evolutionary/Coalitional Theory (ECT) has been proposed.
Haidt and his colleagues have defined 6 dimensions of moral thinking which underly modern political views that make sense based on evolution. The “west” could clearly learn something about the moral/political views of other societies that did not have the same historical evolution into a commercial/largely secular situation. Politicians could seek to more effectively target their messages to trigger all of these 6 values in their target audiences. Civic minded individuals could promote greater understanding of these insights to lessen the Manichaean “good versus evil” polarization we see in politics today.
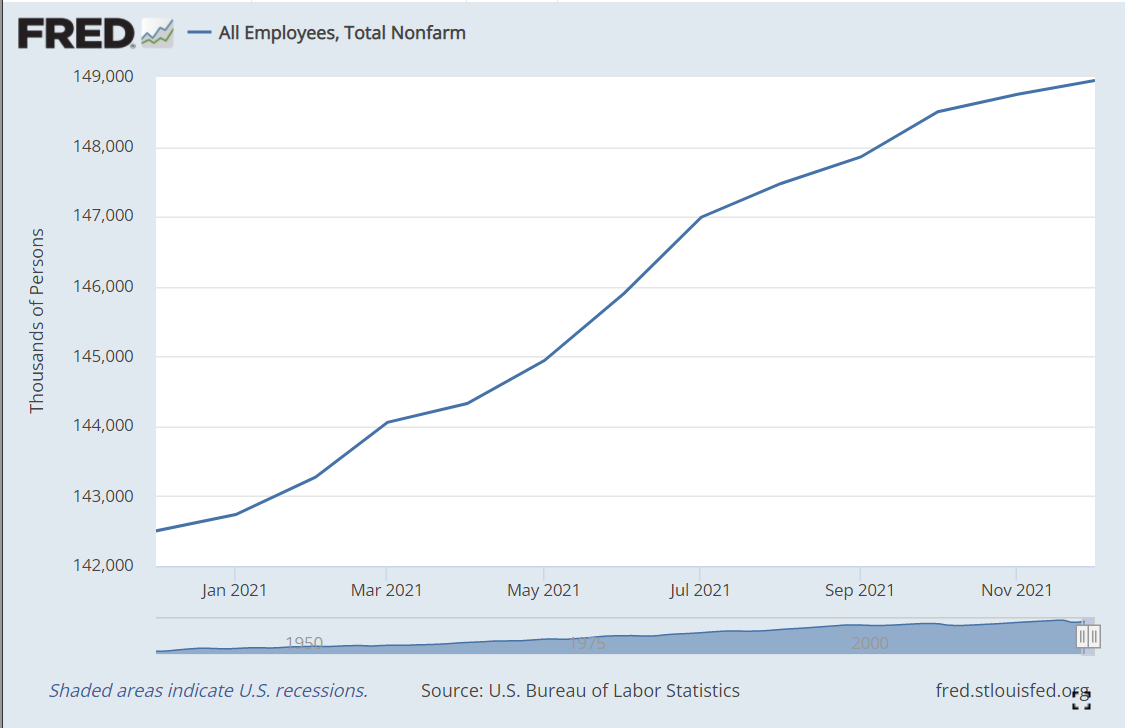
Today’s news releases show 6.0M jobs added during 2021 according to the household survey and 6.5M jobs added according to the employer survey. The ADP employer jobs survey released this week showed 6.2M jobs added. The employer reported number of open jobs increased from 6.8M to 10.6M this year. Hence the total filled plus open jobs increased by 10.6M, from 149.3M to 159.6M, a truly incredible expansion of the US economy’s production potential and demand for labor. This is 1M more filled plus open jobs than the December, 2019 peak of 158.6M. Employers are clearly struggling to work this backlog down from the 10-11M range back to the pre-pandemic 6-7M level. This provides the demand side for another 8-12 months’ worth of 500K filled jobs added per month.
The 3 underlying measures use different definitions and survey methods, but in the long-run they generally agree.
The monthly changes are much less consistent. Much of the media highlighted that the employer survey data showed just 200K jobs added in December. The household survey indicated 600K jobs added, while ADP reported 900K jobs.
It’s best to look at all 3 measures to try to get a best estimate of the most recent changes. I see roughly 500K new jobs added each month from July through December. A flat number, not an increasing one. The first half of the year was probably adding a few more jobs each month, closer to 600K each.
From 2000-2009, the dynamic US labor market laid off workers at a consistent 2M per year rate. This declined a bit to 1.8M per year in the next decade. After the pandemic, the economy quickly returned to this 1.8M per year rate from July to December, 2020.
It has dropped and remained at a 1.4M per year rate at the end of 2021, fully 30% lower than its normal level. Good news, indeed.
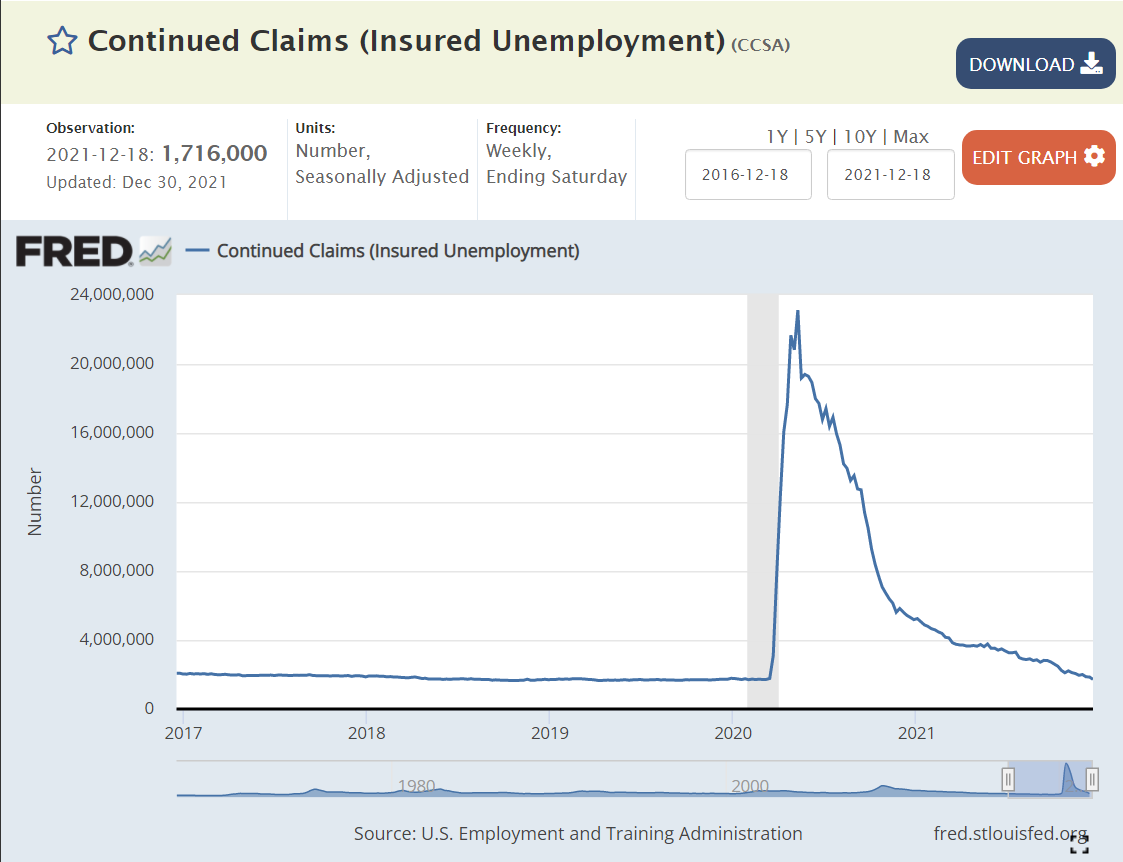
Unemployment Claims
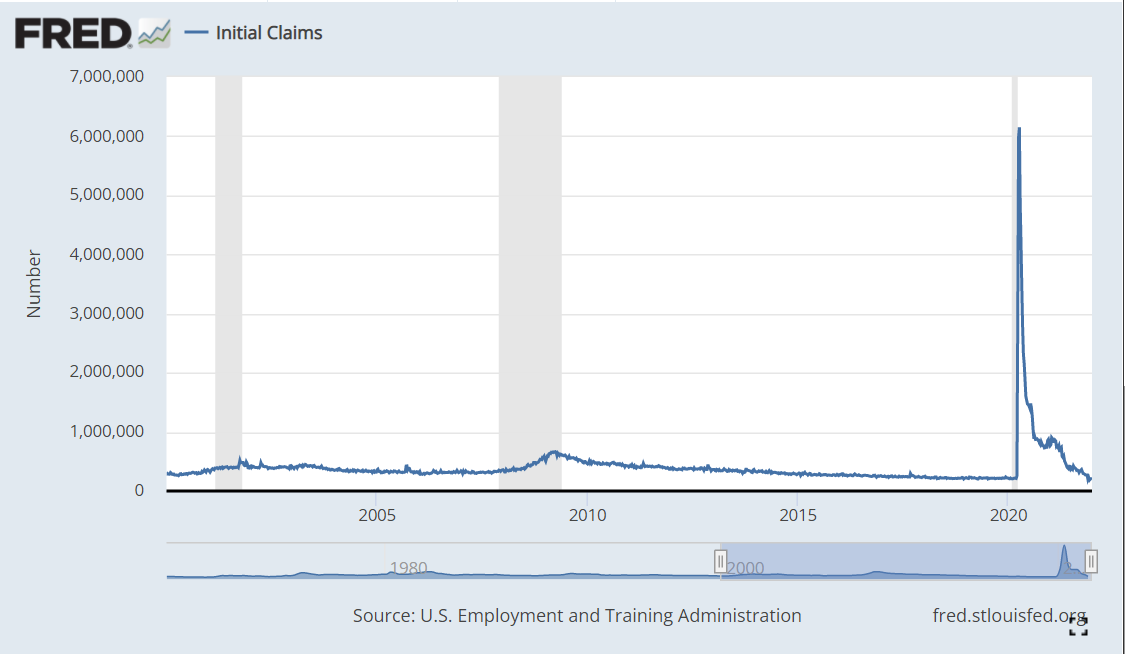
Historically, the US economy generated 350,000 new unemployment claims each week. This measure declined slowly after the Great Recession, reaching a nice 300,000 level in 2014. It slowly declined to a record low of 205,000 in Feb, 2020. The disruption rate dropped back down to the very high but stable 800,000 level from Aug, 2020 through Apr, 2021. In the last 8 months the rate has dropped very quickly back down to the record low 200,000 level!
Cumulative individuals claiming unemployment benefits has historically varied with the business cycle. We can see the increase from 2M to 4M at the turn of the century. The “Great Recession” had a greater negative impact, driving this number from 2M – 4M – 7M. This number fell throughout the extended business cycle recovery period, breaching 2M in Feb, 2017 and reaching a low of 1.7M in Feb, 2020. The unemployed number reached a full order of magnitude higher at 23M during the pandemic, then dropping to 13M in Sep, 2020 and 4M in Mar, 2021 and 2M in Nov, 2021 and finally equaling the record low in December, 2021 at 1.7M. This is great news!
Unemployment Rate
The unemployment rate has reached 4.2% and will return to its historical low of 3.5% in the next 4-6 months.
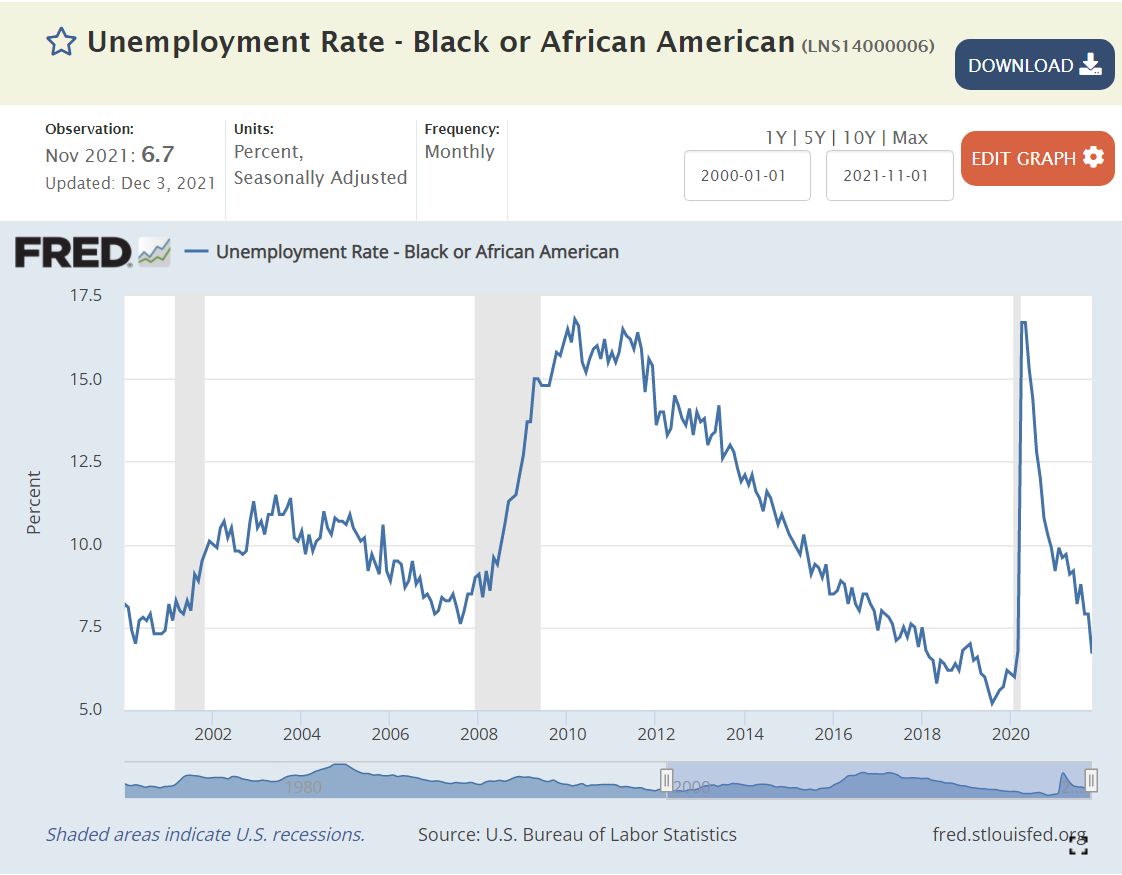
African-American unemployment was typically in the 8-10% range. It was driven down to the 5-6% level after the Great Recession during the extended business cycle expansion period. The rate is now below 7% and falling.
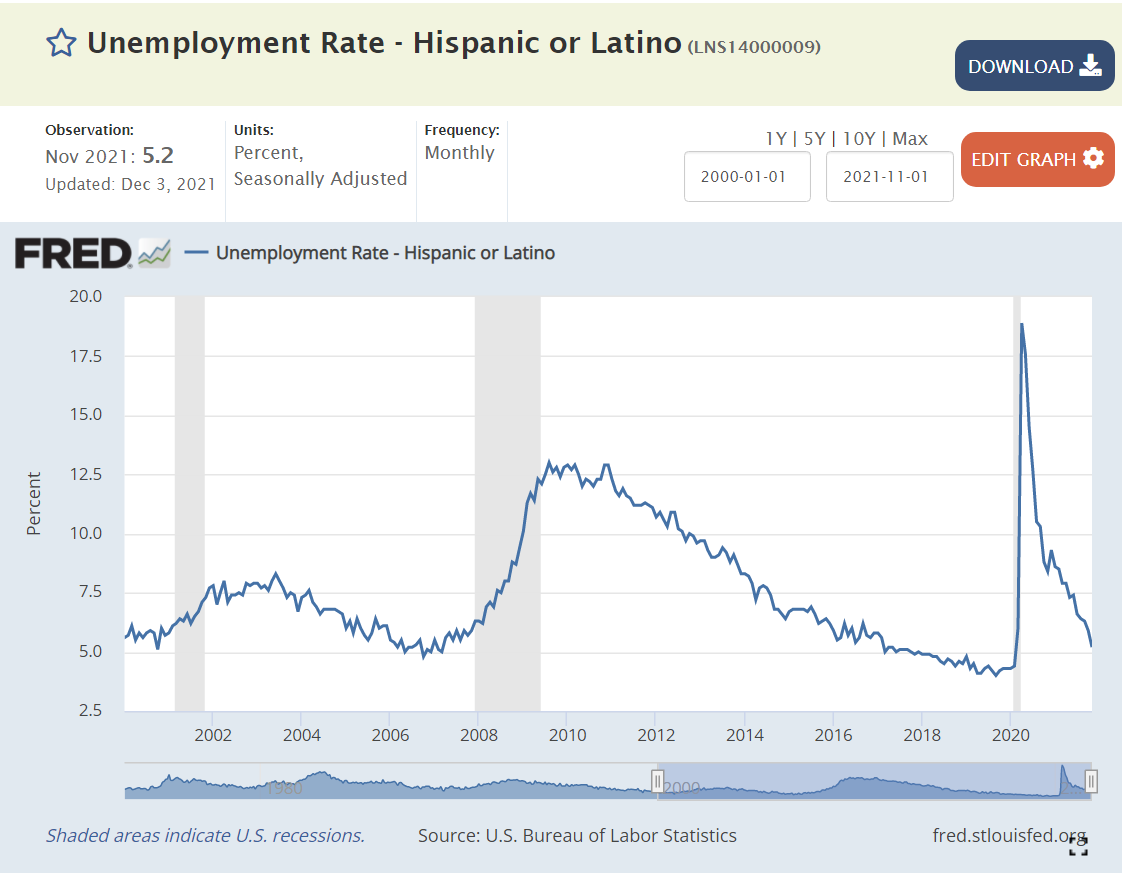
Hispanic American unemployment averaged 5-7% in the 2000’s. It spiked after the Great Recession to 13%, then slowly declined to 4.3%. It has since recovered to 5.2% and is dropping quickly.
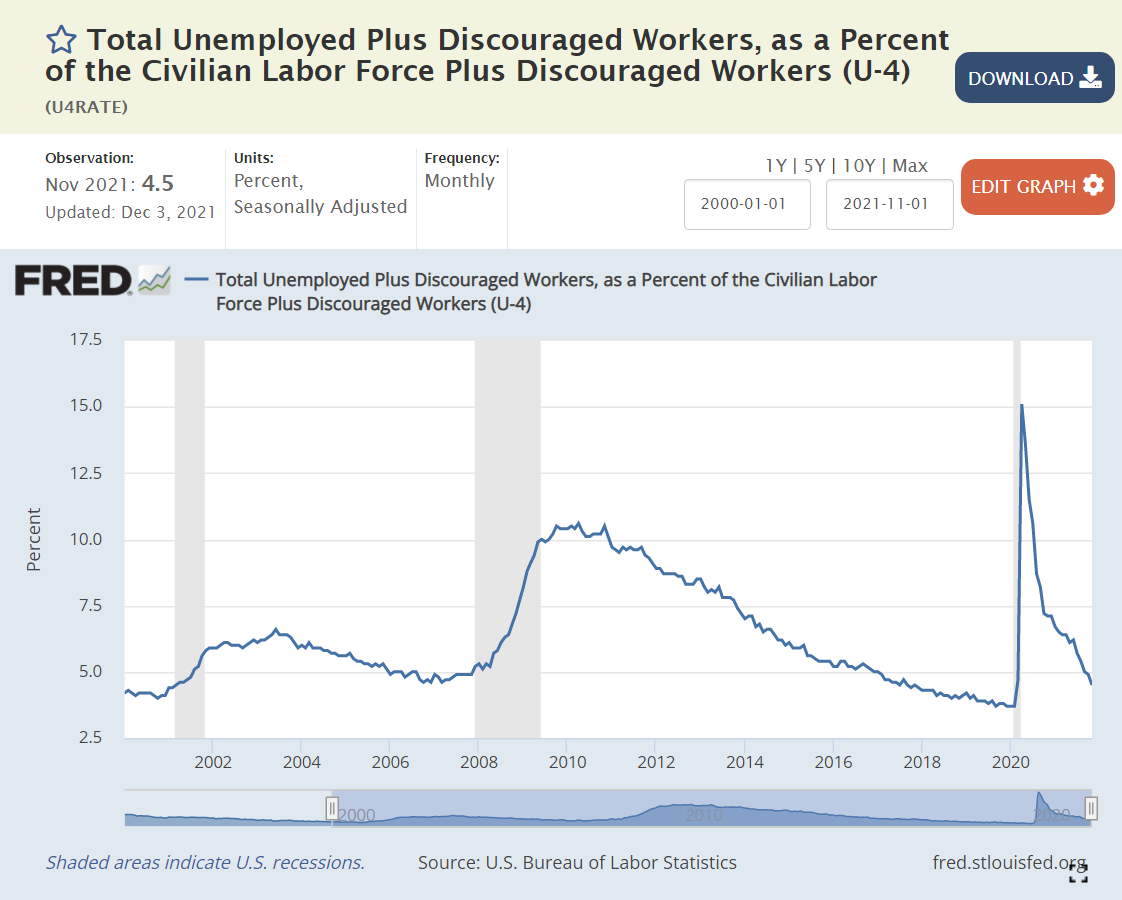
Broadly Defined Unemployment
Broader definitions of unemployment show the same swift recovery from the pandemic situation.
Labor Force Participation
Labor force participation among the core 25-55 year age group reached an historic, and possibly unsustainable high of 83% in late 2019. It stayed around 81% at the end of 2020 and has since improved to 81.8%. This is one of the few labor market indicators that clearly shows that we have NOT “fully recovered”. There is 1% of the population waiting to be attracted back into the labor force.
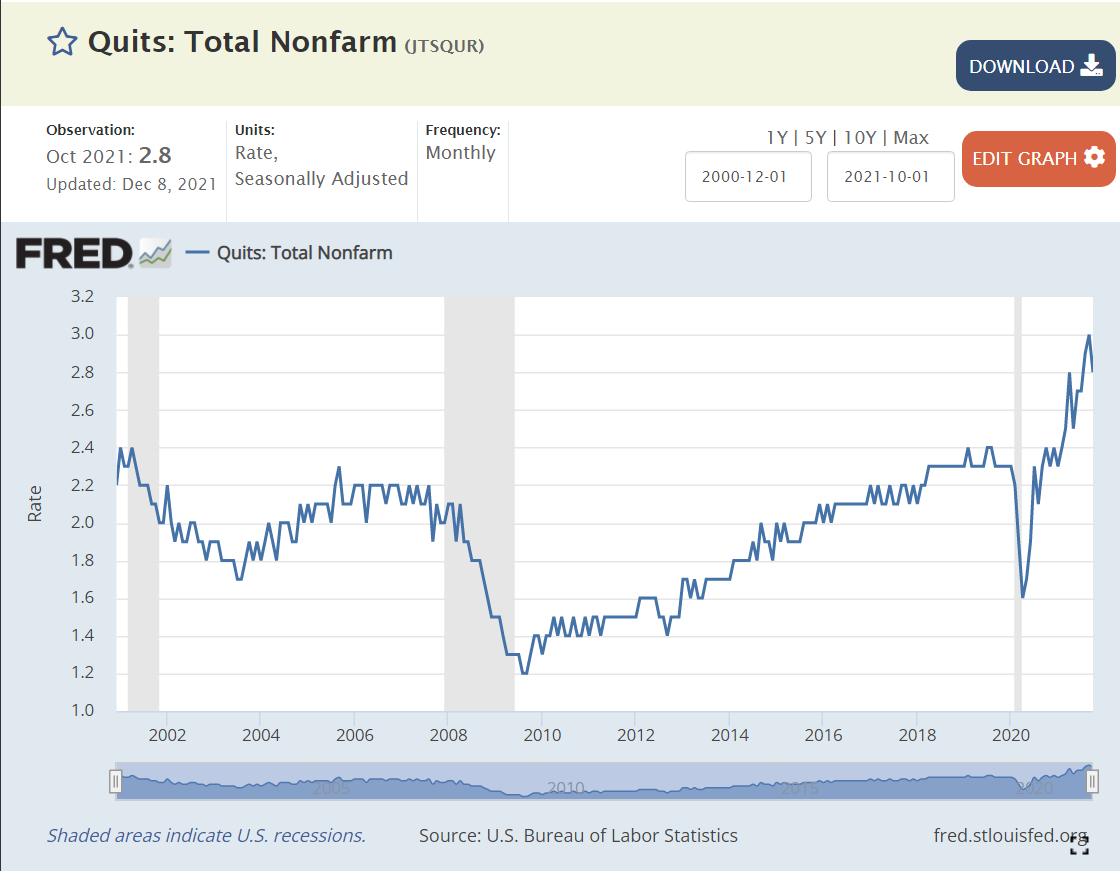
The voluntary “quit” rate has doubled since the good side of the “Great Recession”. It is 50% higher than during the very favorable labor market of 2018-2020. Employees are confident that they can leave their current employer and find another position quickly.
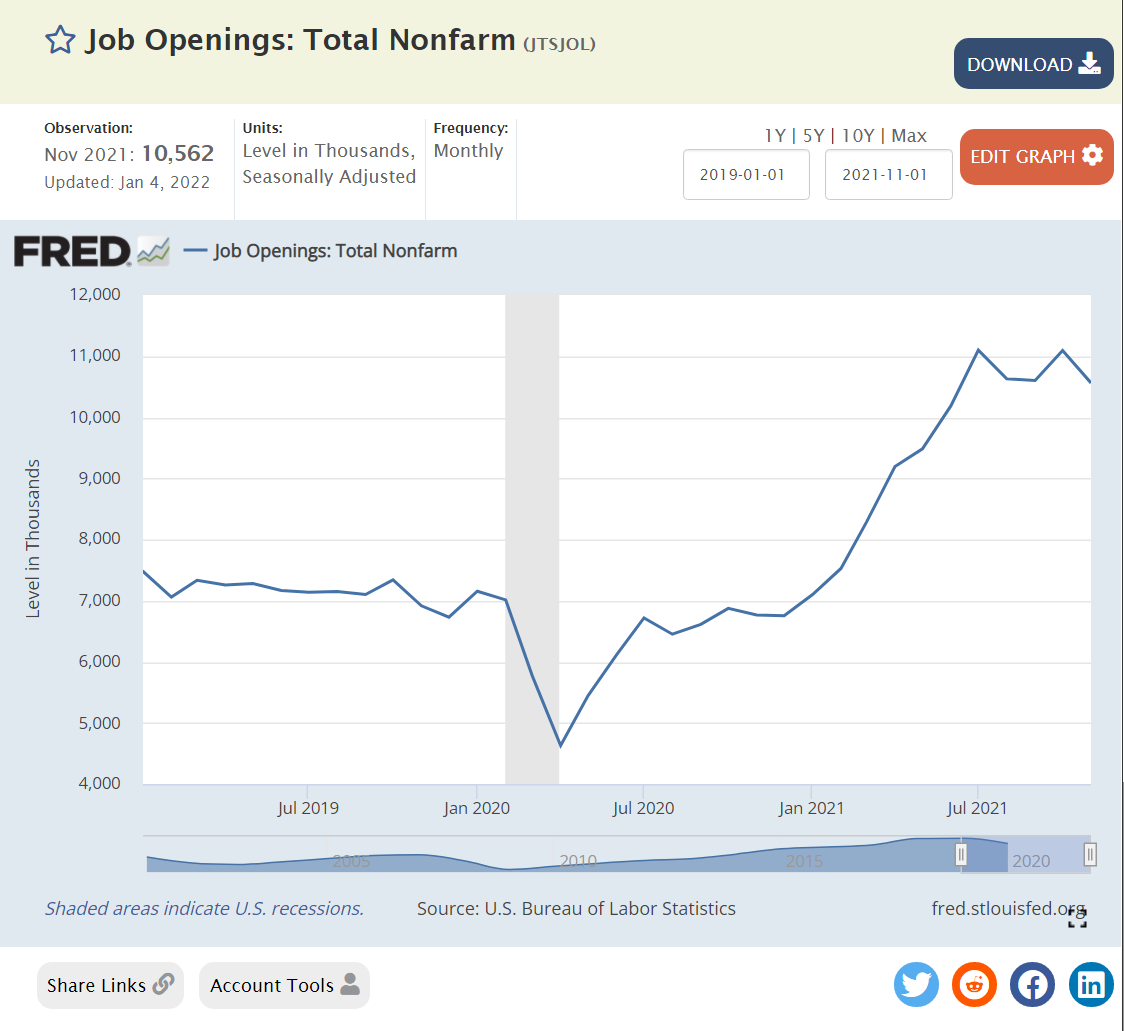
This is the CRAZY positive labor market chart. Historically, we see 3-5M job openings. Expansion to 6M in 2016-17 as the post Great Recession recovery faced its “end”. But, the expansion continued even further, with 7M open positions available in 2018-20. The economy recovered to 6.8M open positions in Dec, 2020. This figure has since climbed to an incredible 11M open positions, more than double the historic norm.
Historically, economists generally emphasized the negative short-term and long-term impacts of significantly higher, broadly applied minimum wage increases. Studies in the 1990’s indicated that the negative effects of moderate minimum wage increases could be relatively small, so economists’ articles have been more balanced in the past 3 decades.
Some more liberal leaning economists have been actively suppporting minimum wage increases as the US minimum wage has continued to decline on a real, after inflation basis, US minimums have fallen compared with other developed countries and the US distribution of income has become more unequal and poverty rates have not fallen despite US economic progress.
Some economists even point to the self-serving benefits of higher minimum wages for corporations, including greater productivity, innovation and retention.
But, large corporations are increasing their own minimum wages and trying to position themselves as supportive of “common sense” public policy changes that do not impact themselves very much. Some critics say that this is because large corporations can absorb higher minimum wages through their economies of scale and pricing power, while smaller businesses cannot and will go out of business, resulting in further growth of power for large businesses.
Perhaps more importantly, large corporations in a variety of industries have voluntarily increased their minimum wages from the $12/hour to the $15/hour plus range in the last 2 years. (Out of self interest).
Wages for less skilled and less experienced positions are increasing – dramatically – in the USA – in the last 5 years, especially since the pandemic reduced the supply of labor, and going forward. Larger companies have seen the costs of higher turnover and decided that they are going to offer relatively higher wages and find ways to generate enough economic value added to justify these marginal (incremental) investments. Politicians in left-leaning and centrist areas have pushed through higher minimum wages. Lower experience and lower skilled workers are able to take advantage of this situation. This is “good news” for these individuals. It is also “good news” for the economy because it has prompted firms to find ways to restructure work, processes, tools, technology, etc. to add more value from each employee.
The US population has doubled from 1960-2020, so the share of new lawyers remains roughly at the same percentage, despite the greatly increased complexity of modern business, communications, intellectual property and society. This ratio is now way down from the 2000’s when it was unusually elevated.
Supply and demand drove lower salaries and higher unemployment after 2010.
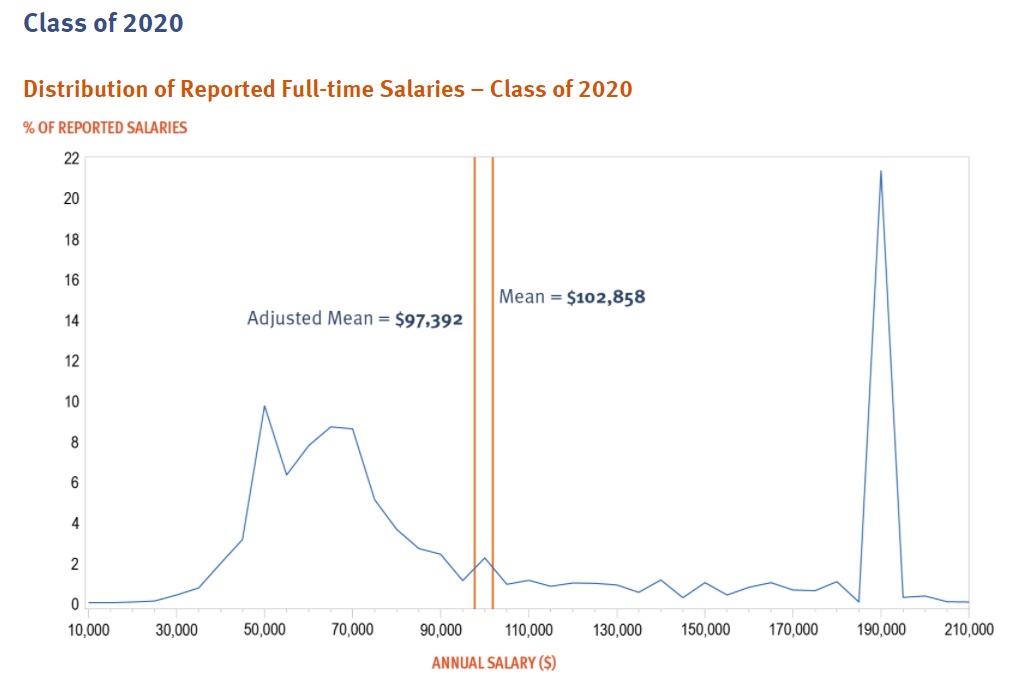
Starting salaries at major law firms have always been attractive to undergraduates. The distribution of starting salaries shows that the legal profession is divided between those in the top one-fourth and all of the rest. The median starting salary at $100K for 7 years of college education looks more like an engineer, pharmacist, actuary, data scientist, financial analyst or market researcher than a world changing persuader.
The percentage of US congress reps with a legal background has declined decade after decade.
Lawyers occupy 9% of CEO roles; far less than their MBA competitors.
The highest skilled lawyers remain in high demand in the US, earning $120-180K for starting salaries. They are typically not “changing the world”. But, they are helping the owners of great wealth to maintain and improve their positions. As an accountant, engaged to measure and advise, I appreciate this value-added role in society.