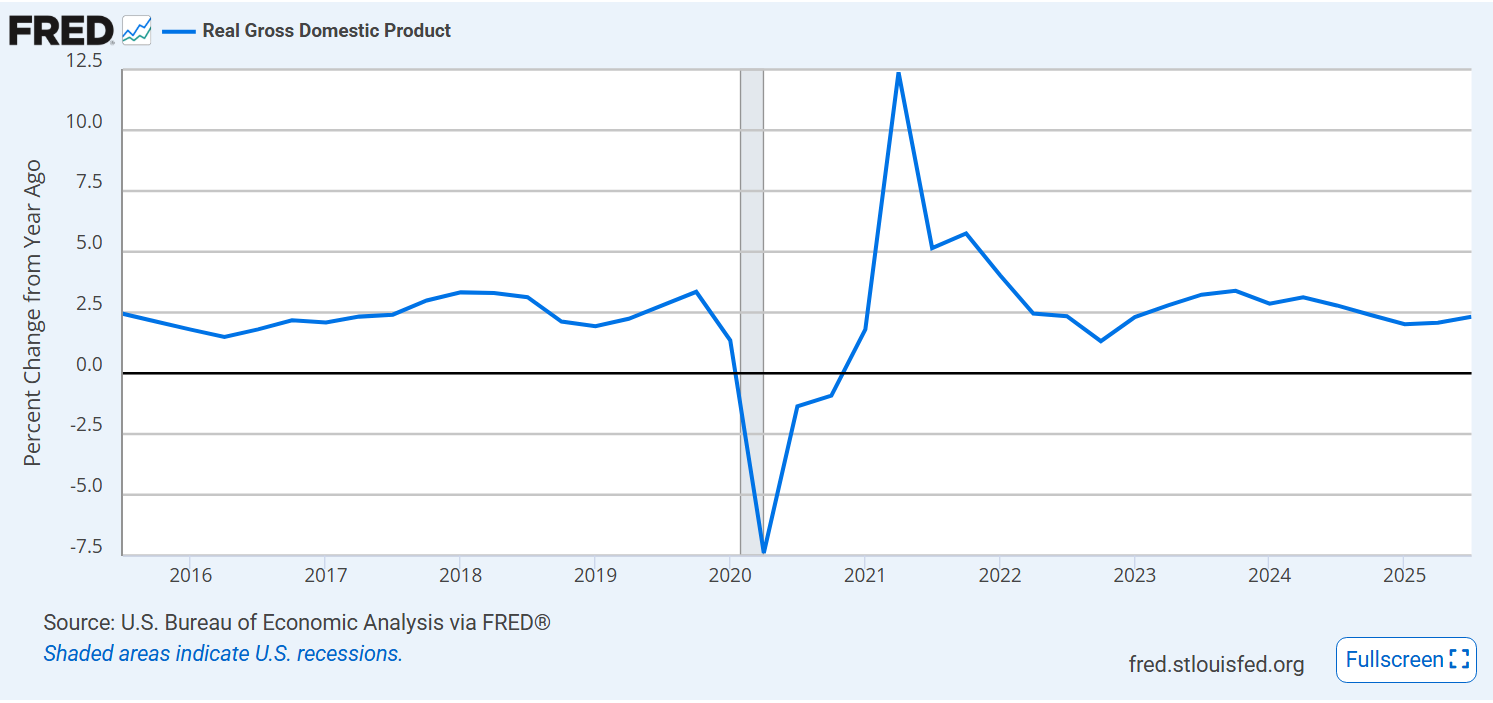
Overall, at the same core 2.5% growth rate seen for the last decade.
Labor productivity growth down a bit from the pandemic recovery bump.
Median wage growth remains at 2%, down a bit from pre-pandemic 2.5%.
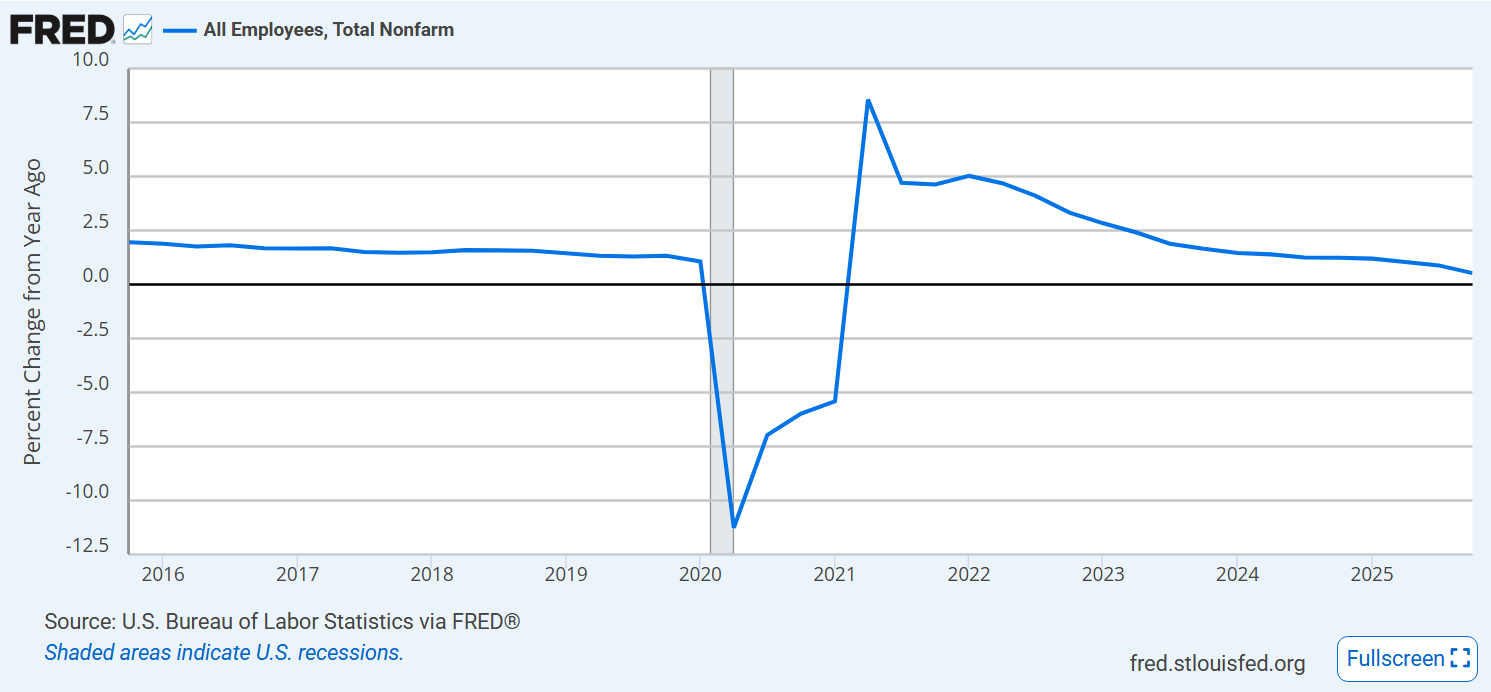
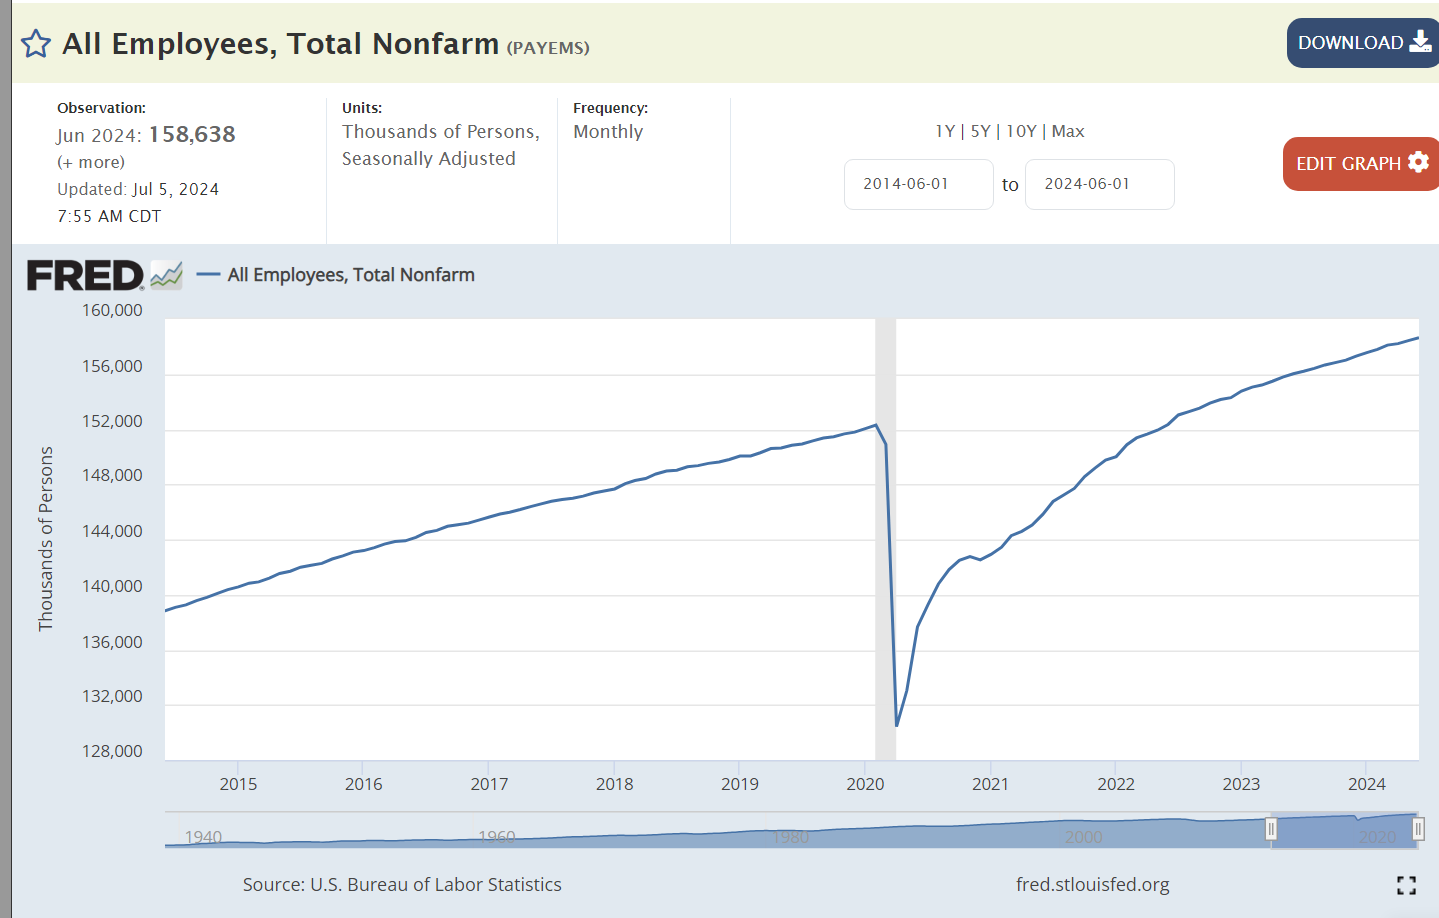
Job growth is very weak. Typically, this indicates a coming recession, but the reduction of the immigration labor supply makes historical comparisons difficult.
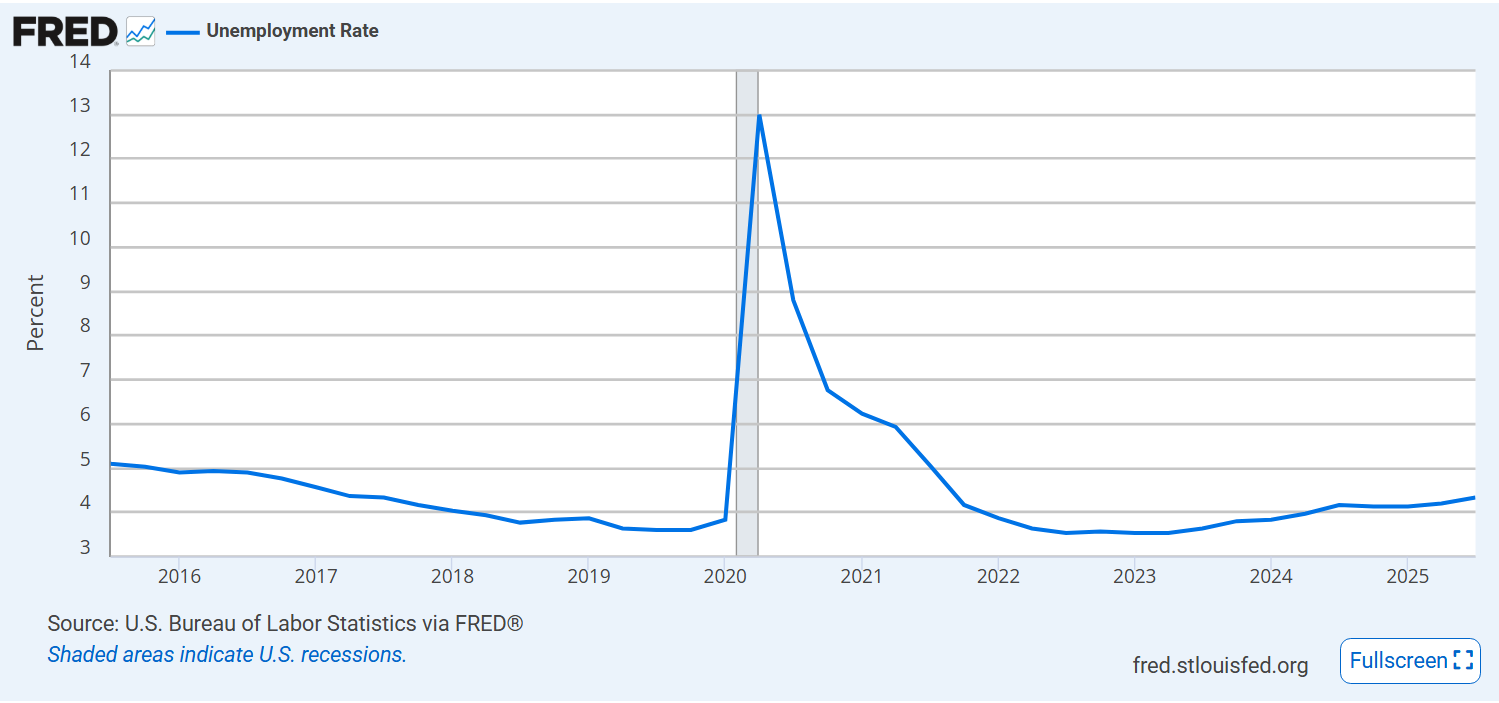
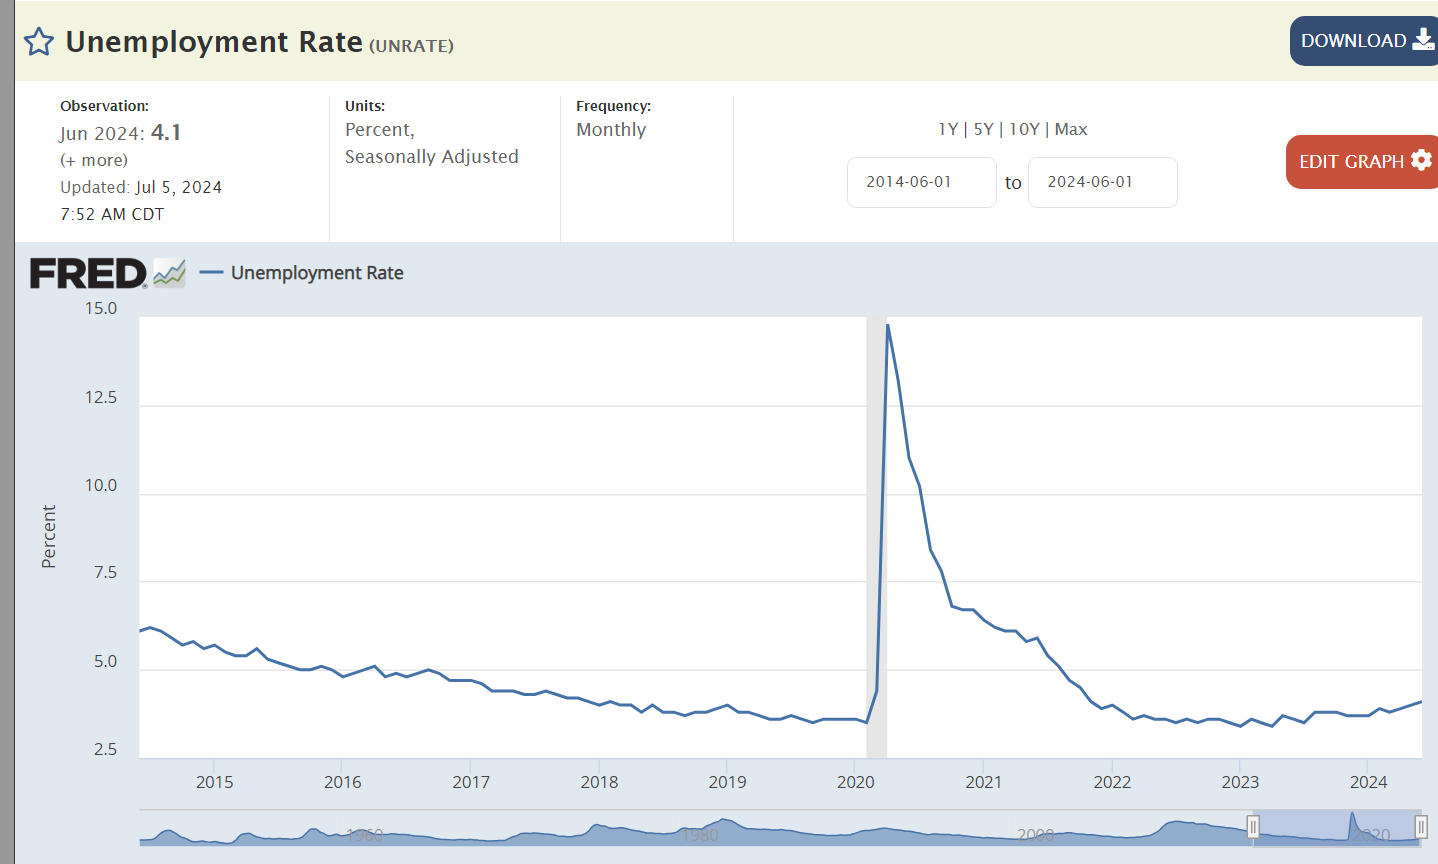
Unemployment rate remains at historically low 4.5% but it has been increasing for more than 2 years.
The “underemployed” rate shows the same relative level and trend.
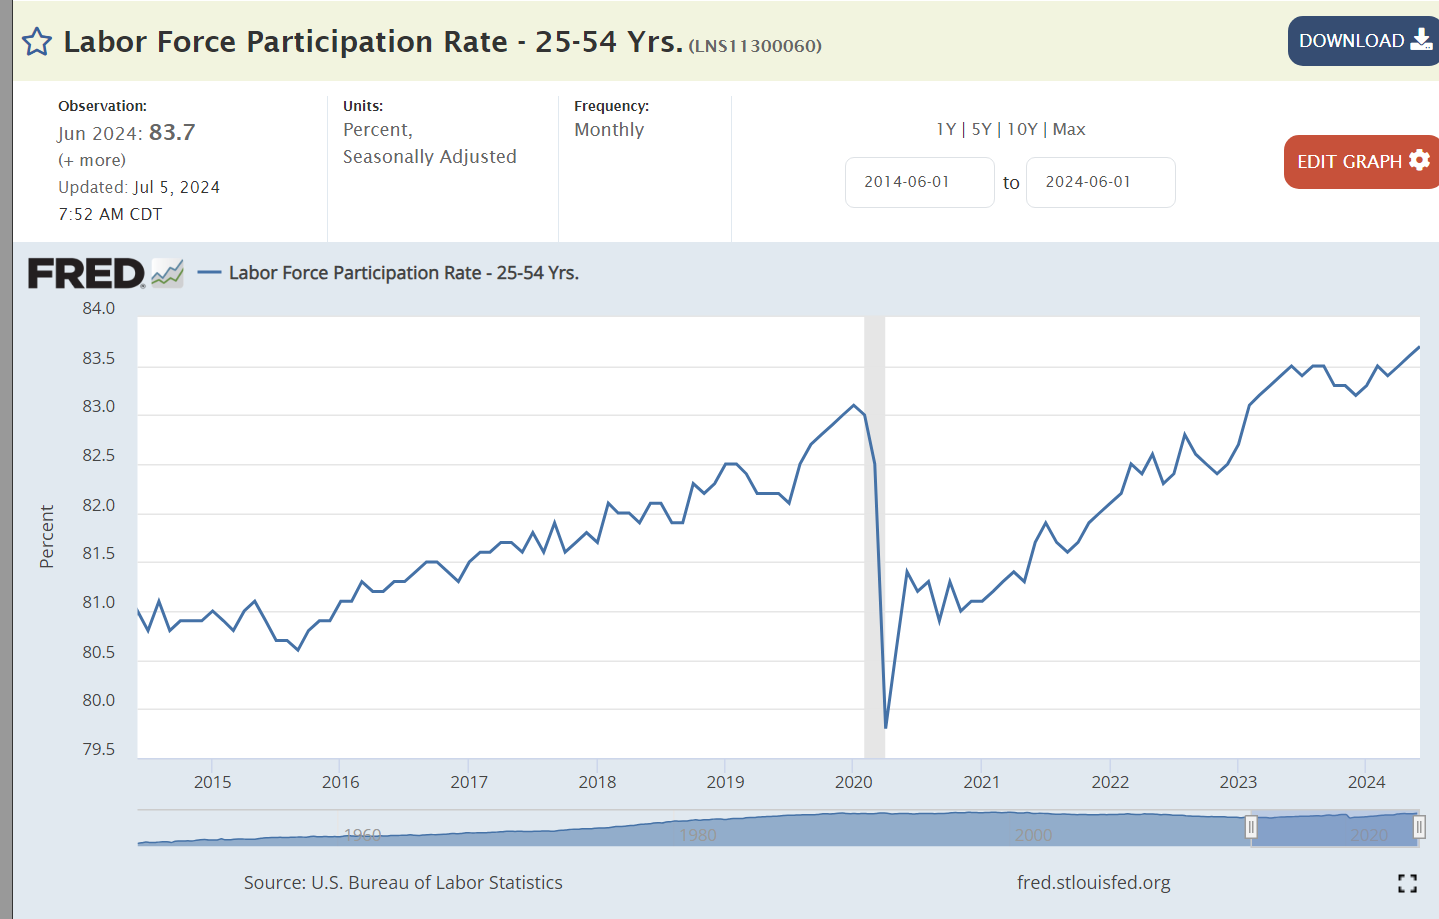
Labor force participation hit record levels after the pandemic and has remained there.
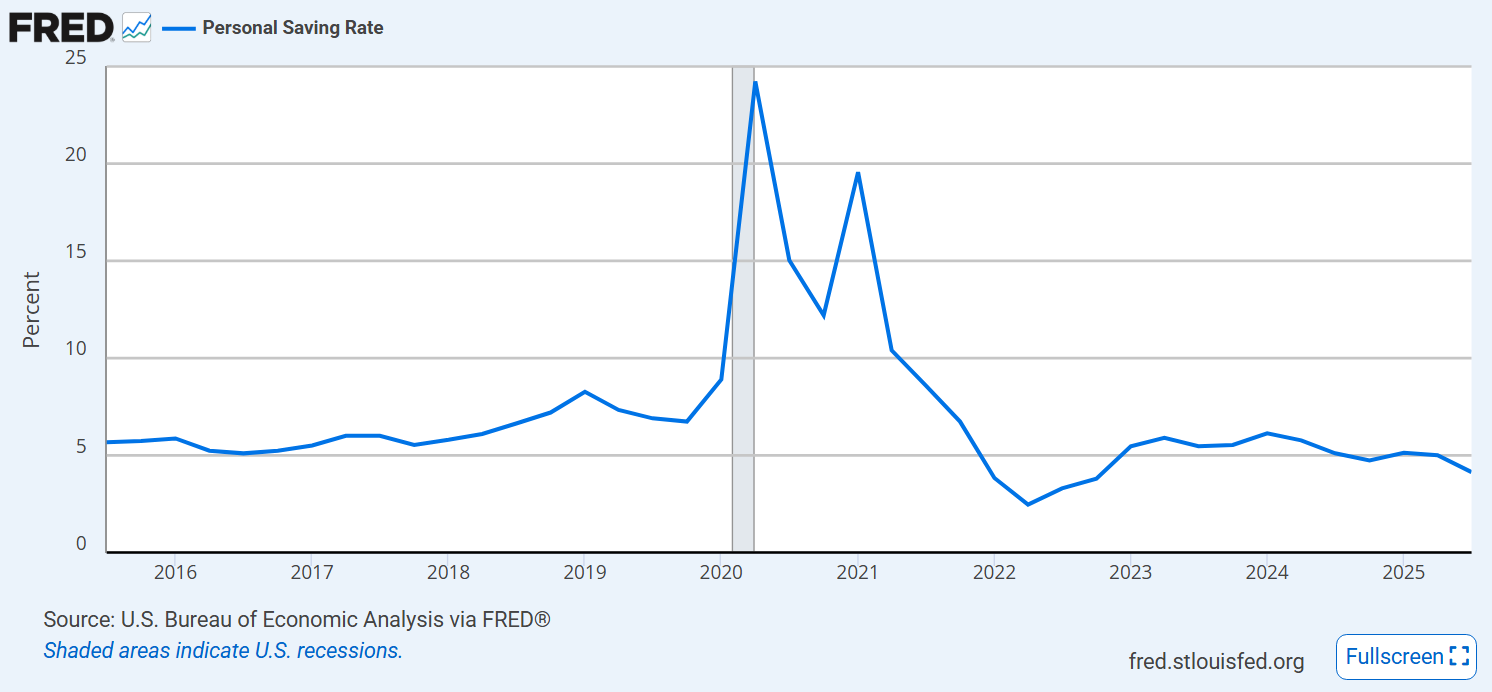
The personal savings rate is low, a bit below the pandemic and trending slightly downward.
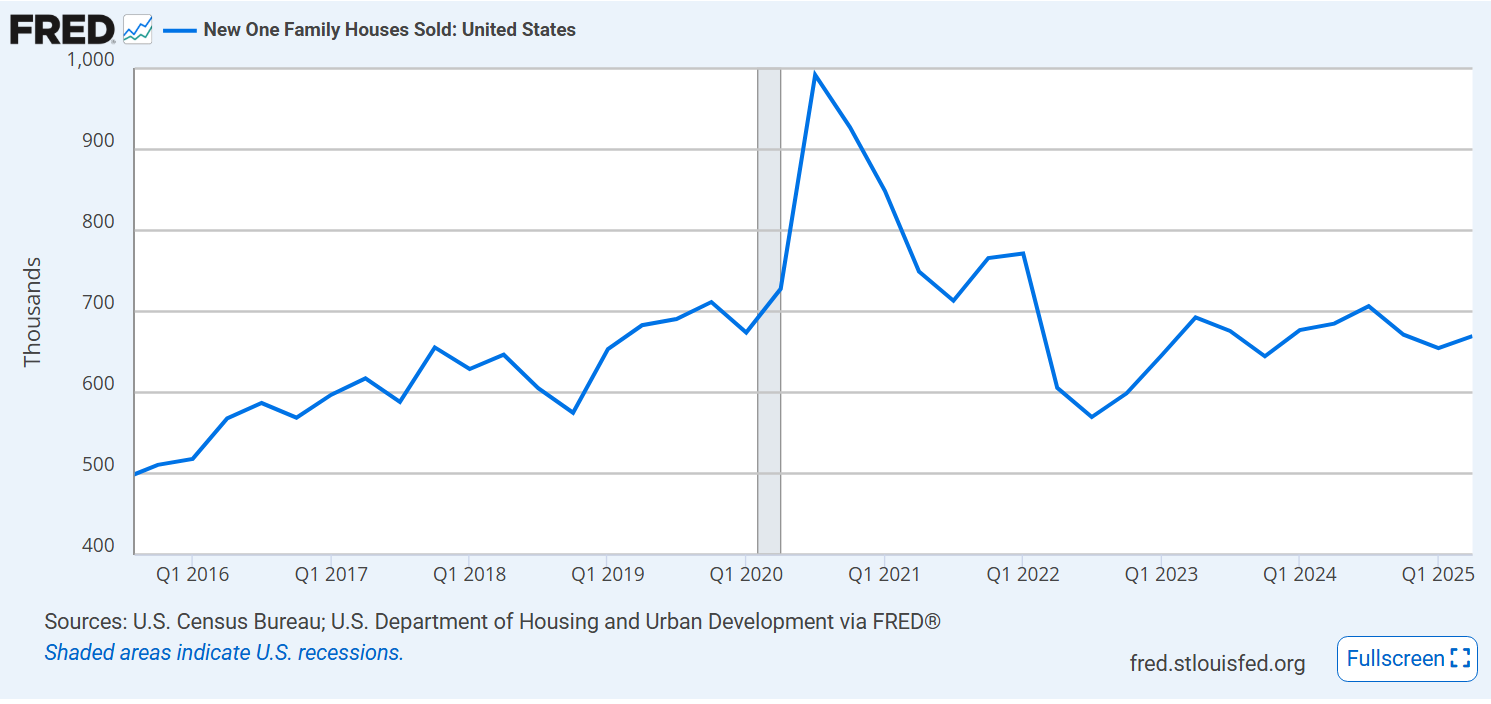
Mortgage rates remain elevated, around 6.5%.
New home sales are pretty stable, at pre-pandemic level.
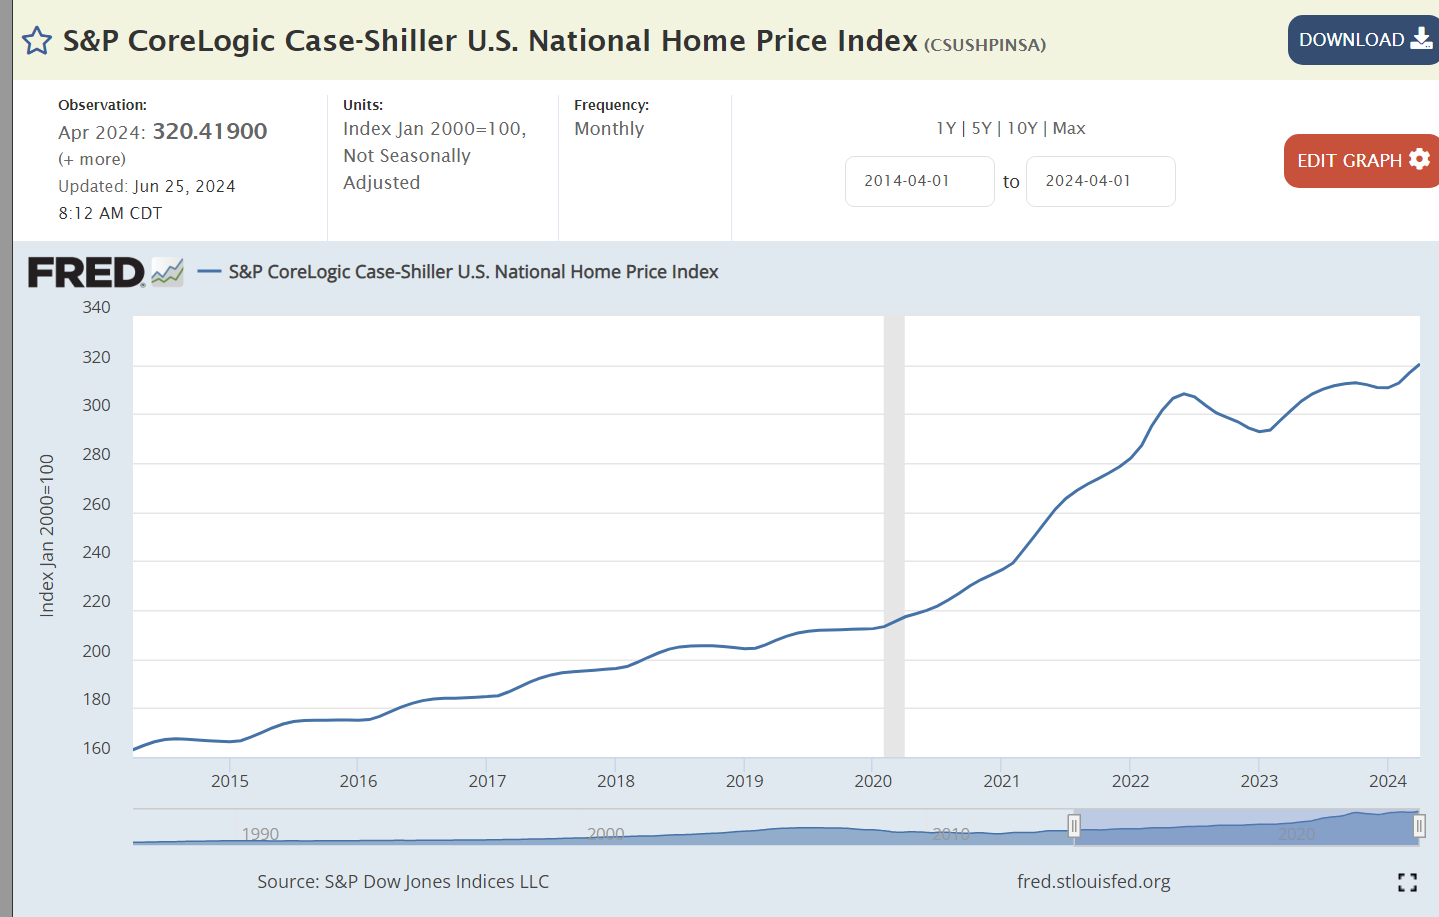
Housing prices jumped from $320,000 to $440,000 after the pandemic. They have fallen back by 5% in 4 years.
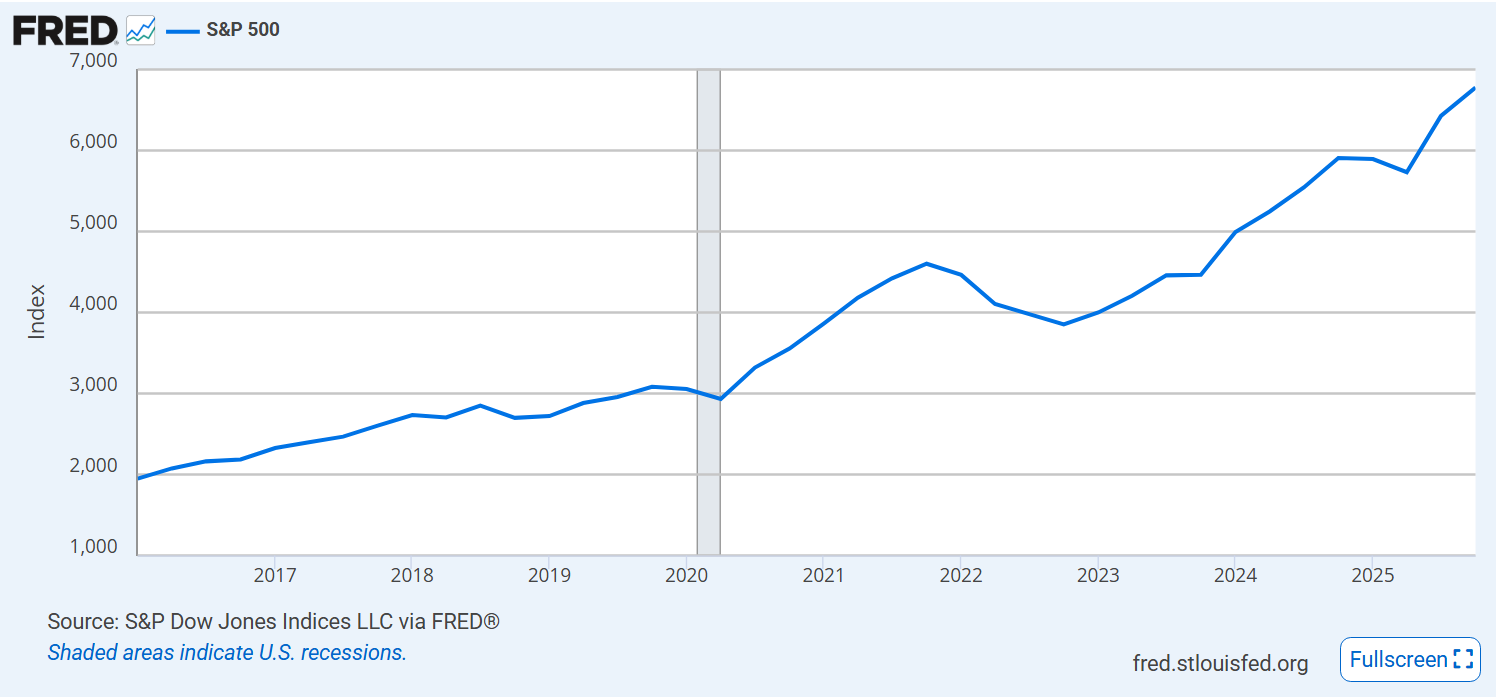
The US stock market continues to climb.
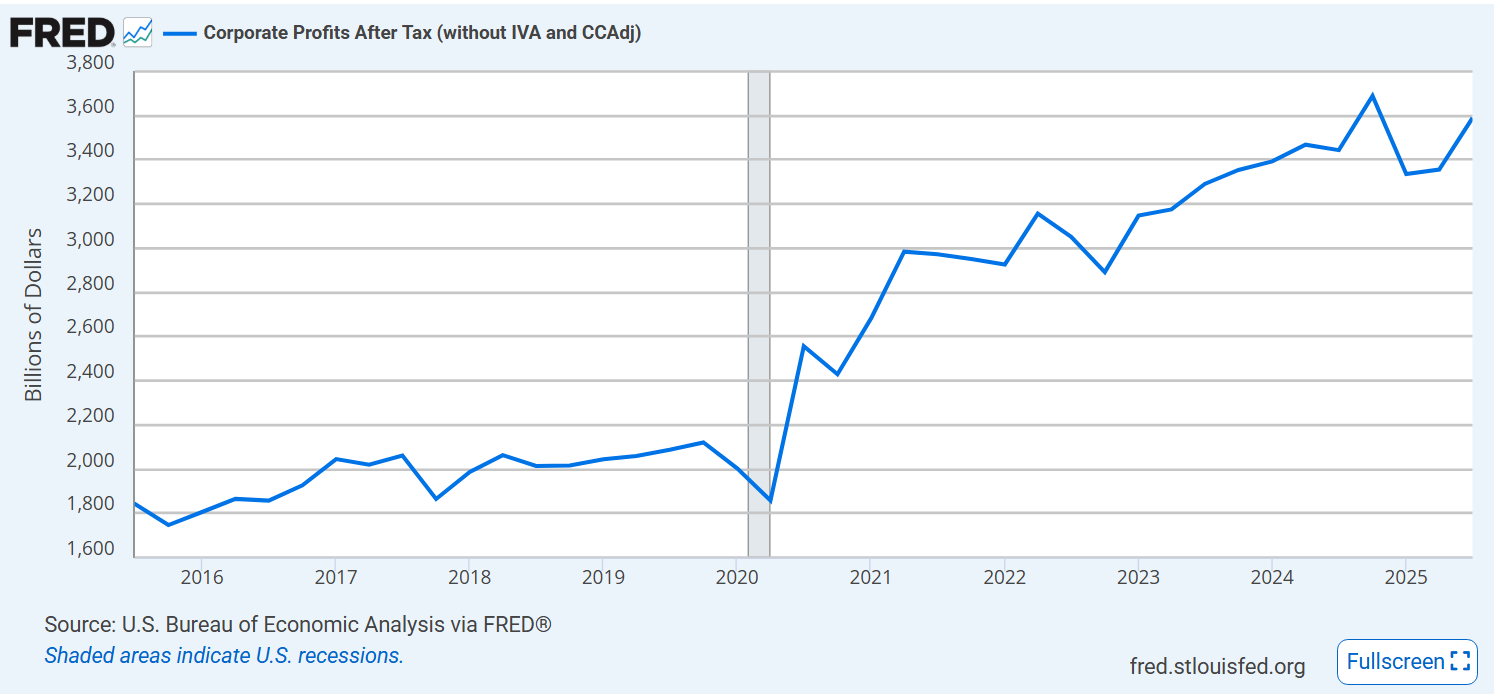
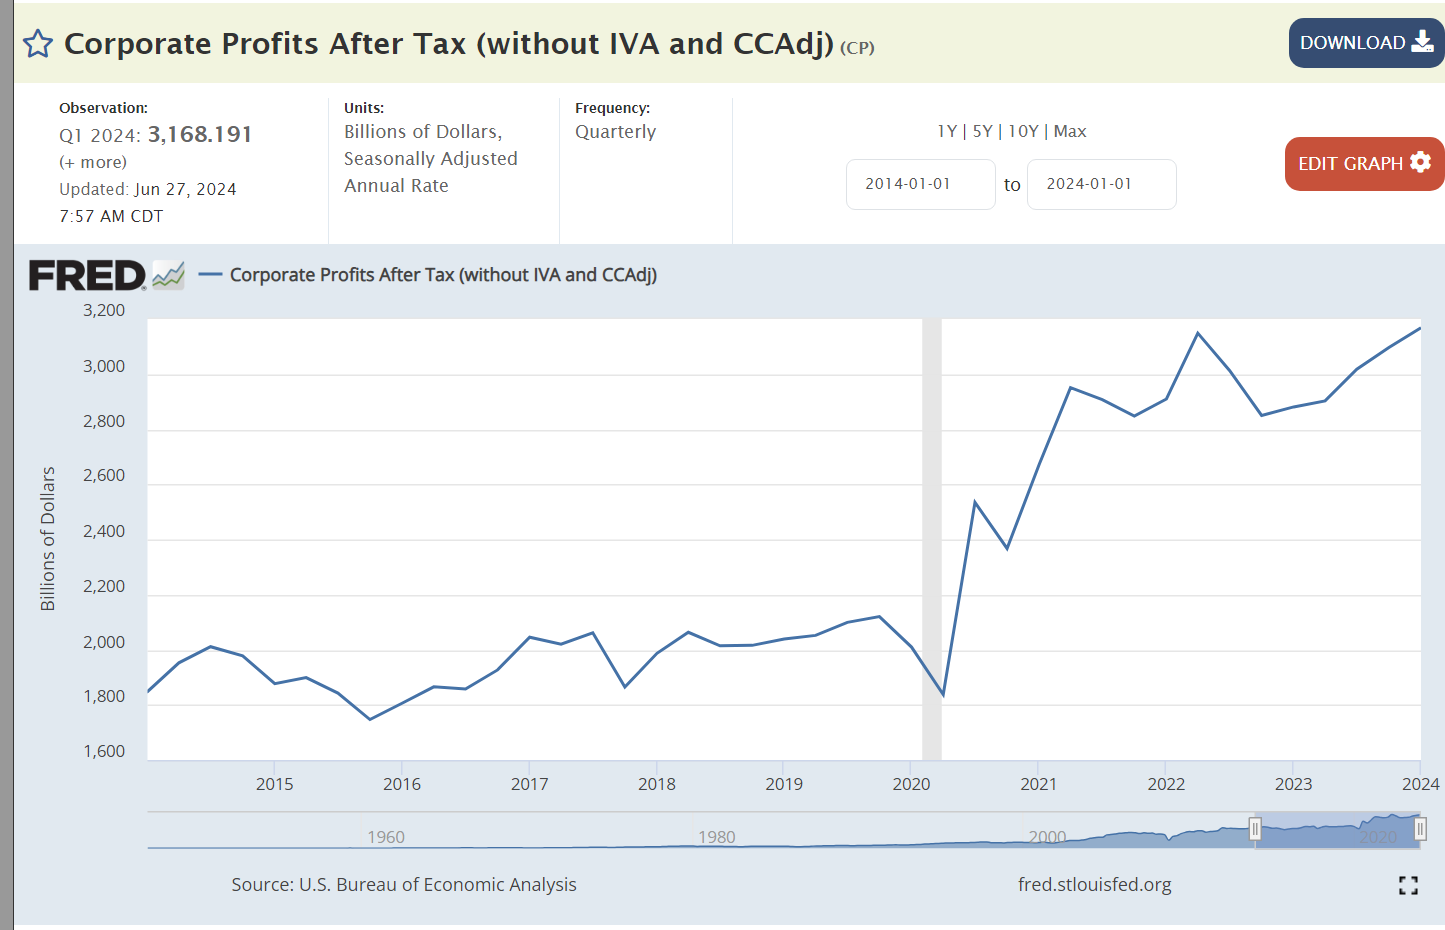
Corporate profits have roughly doubled since before the pandemic.
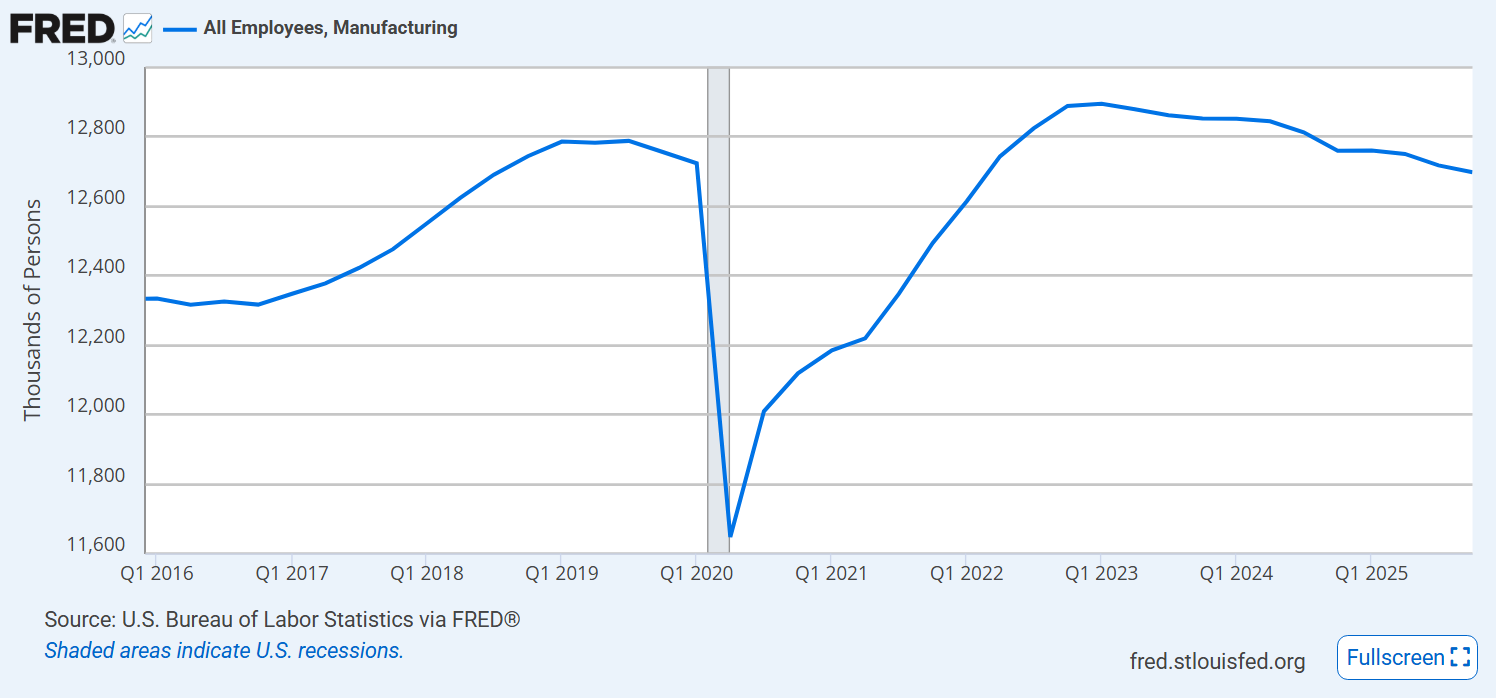
Manufacturing employment continues to decline.
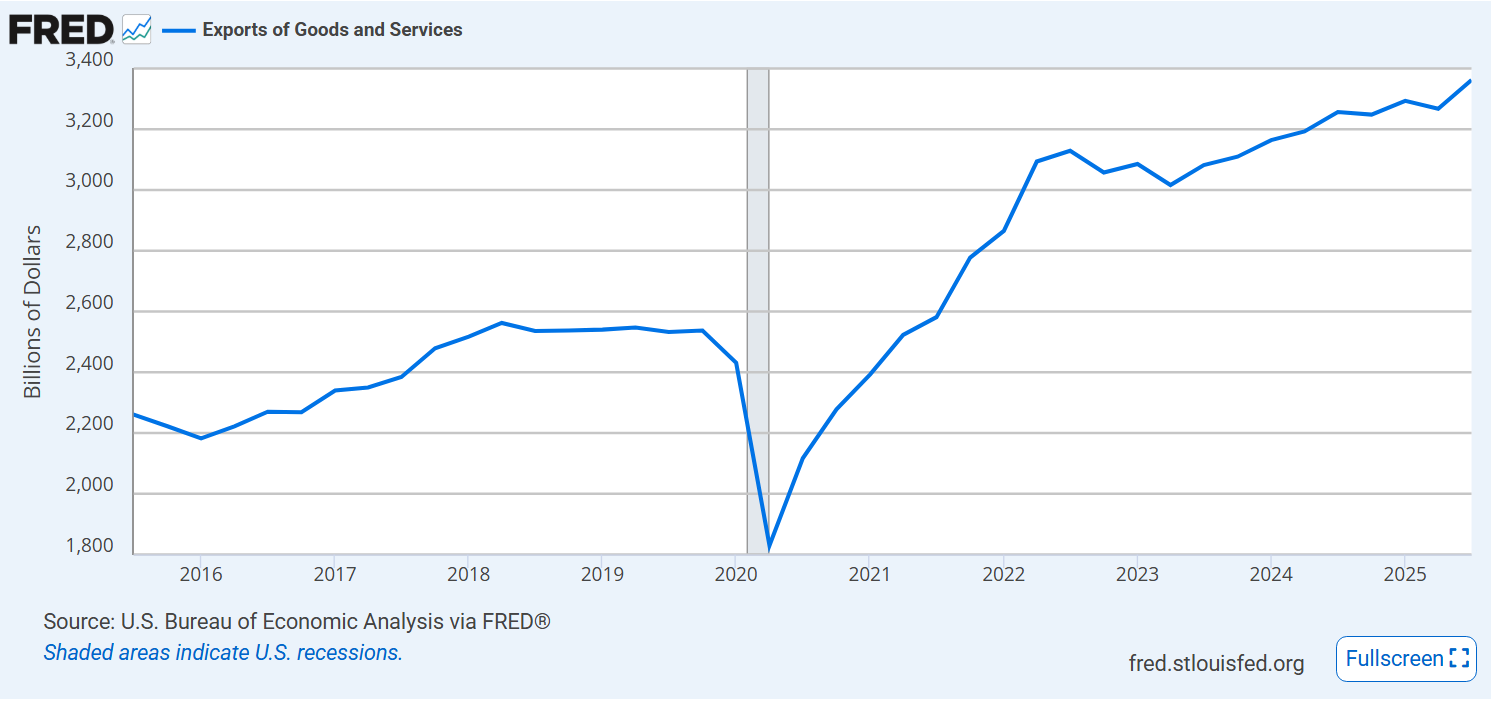
Exports are up 50% and still growing slowly.
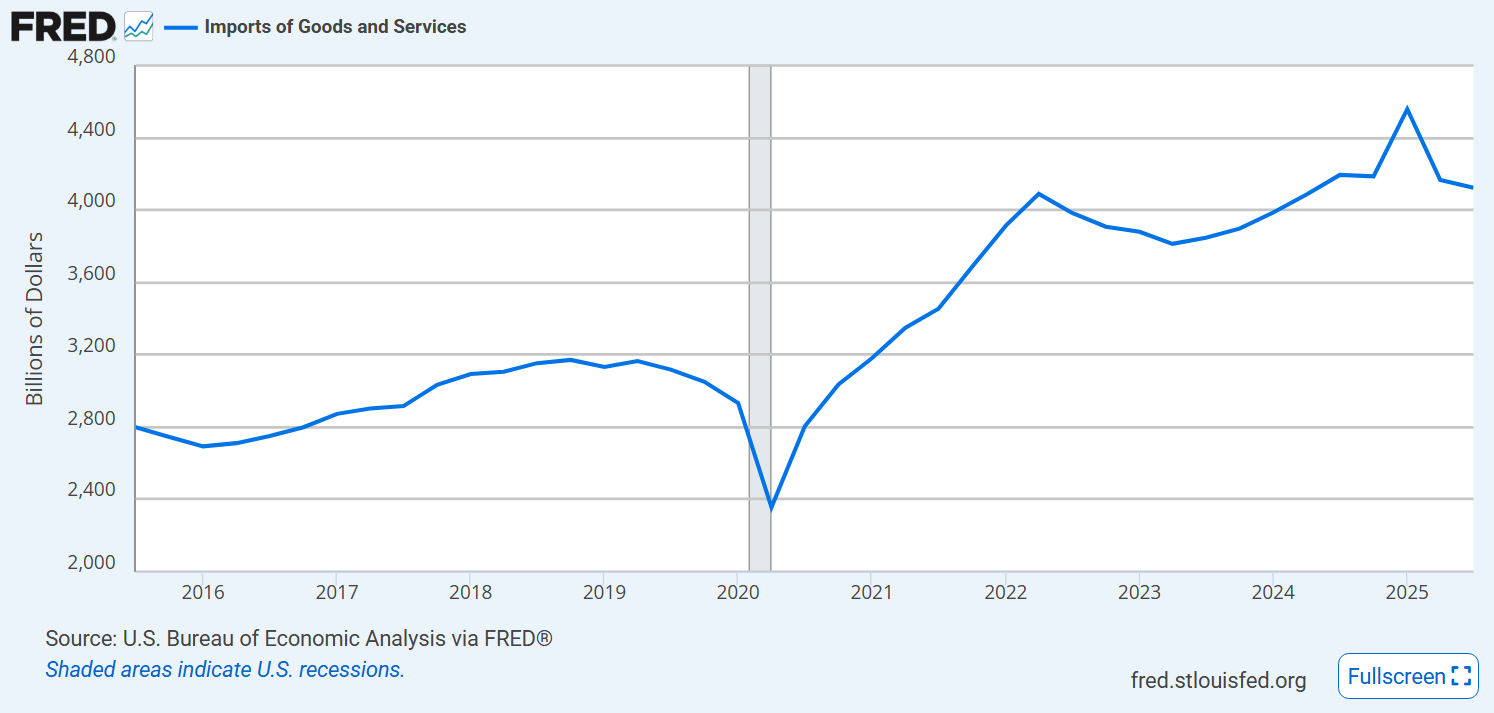
Imports also increased by 50%.
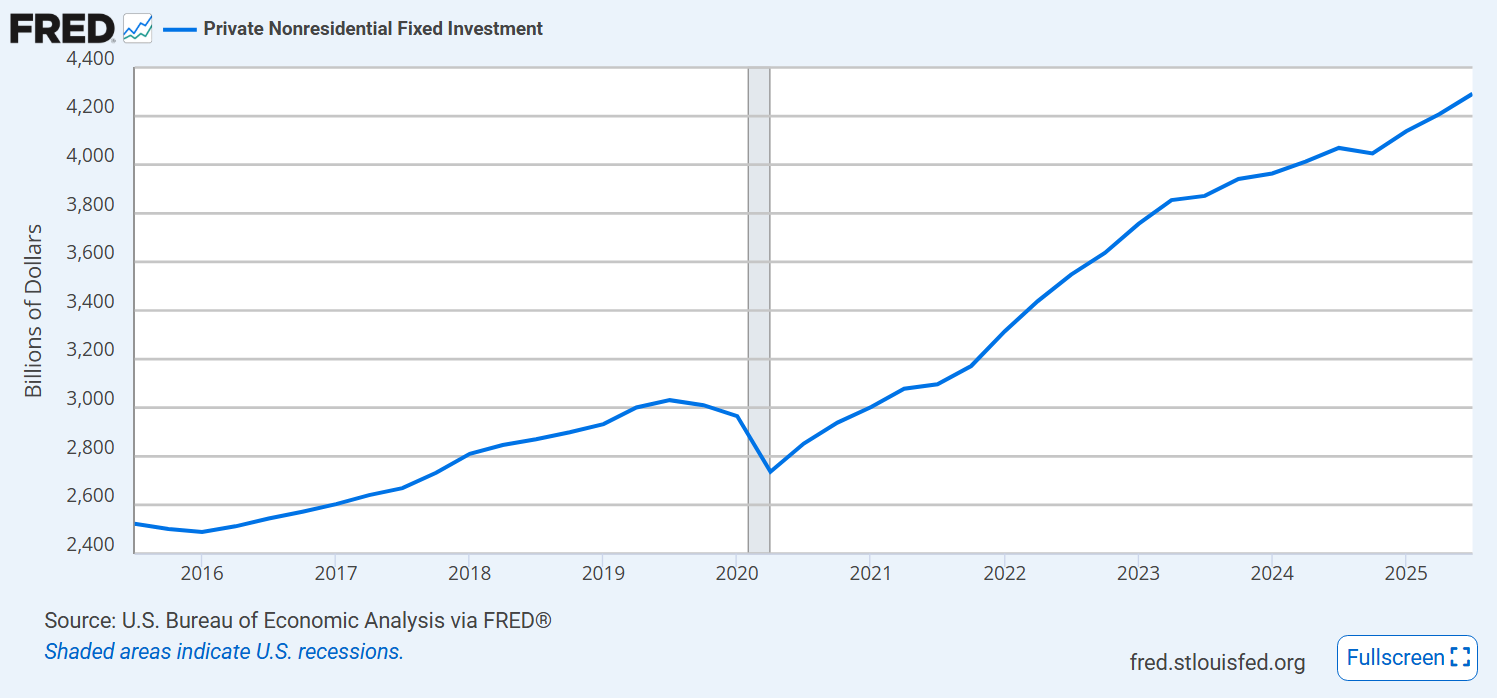
Businesses continue to invest.
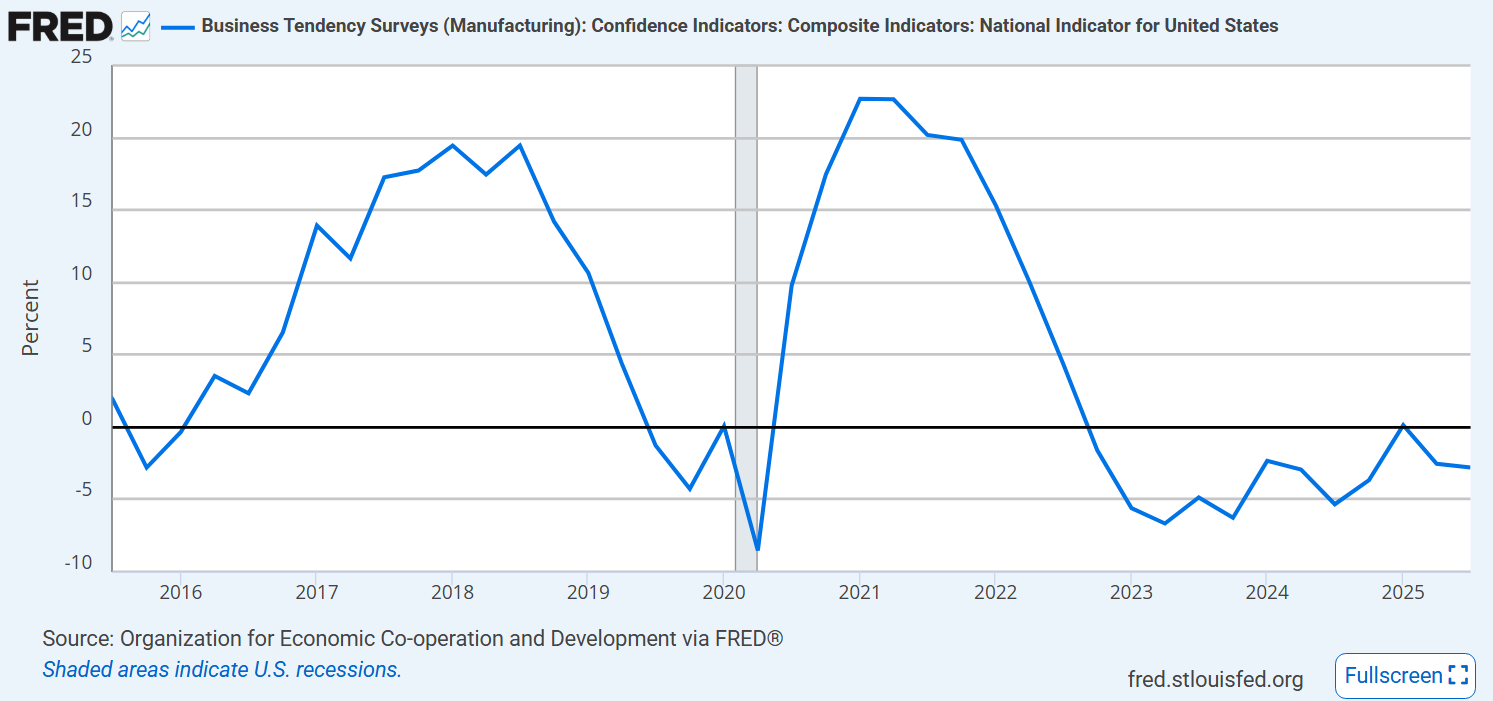
Business confidence remains weak.
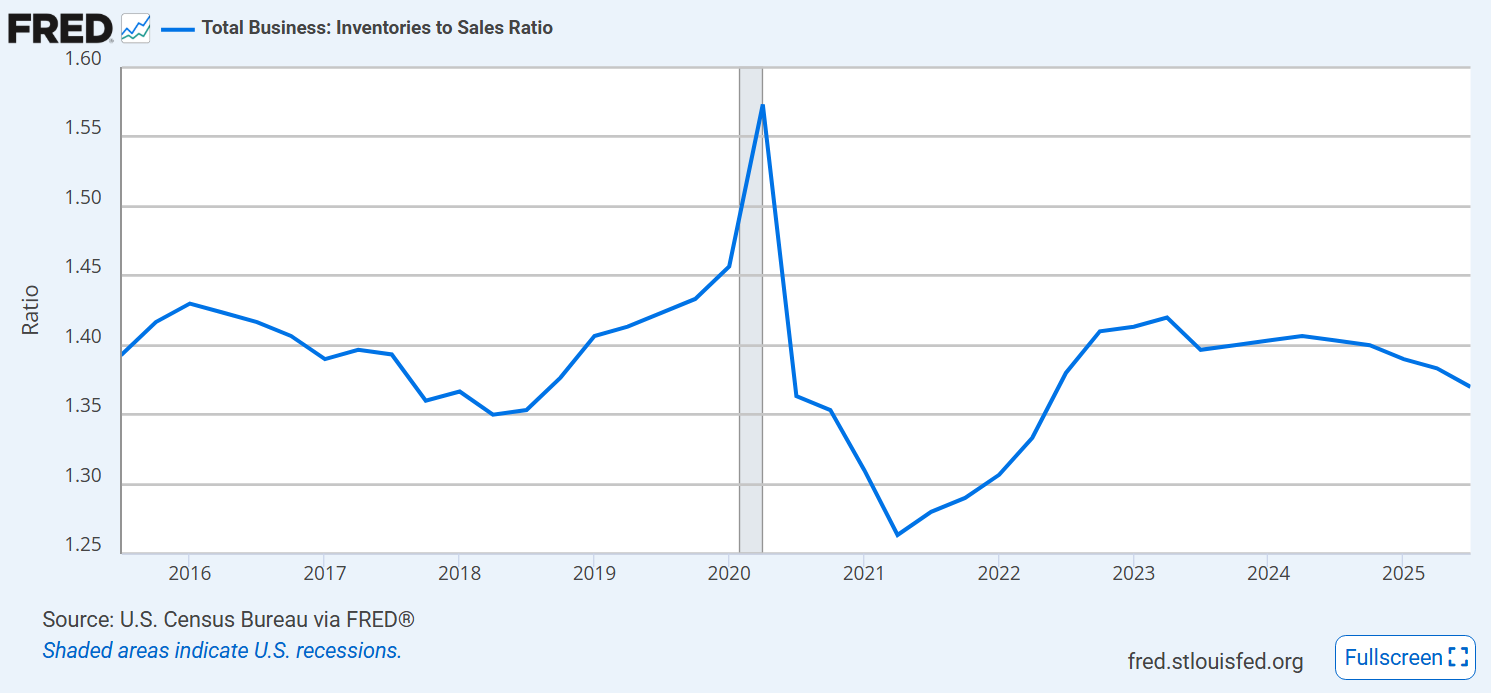
Businesses have maintained their target inventory to sales ratios.
Consumer confidence is down and weak.
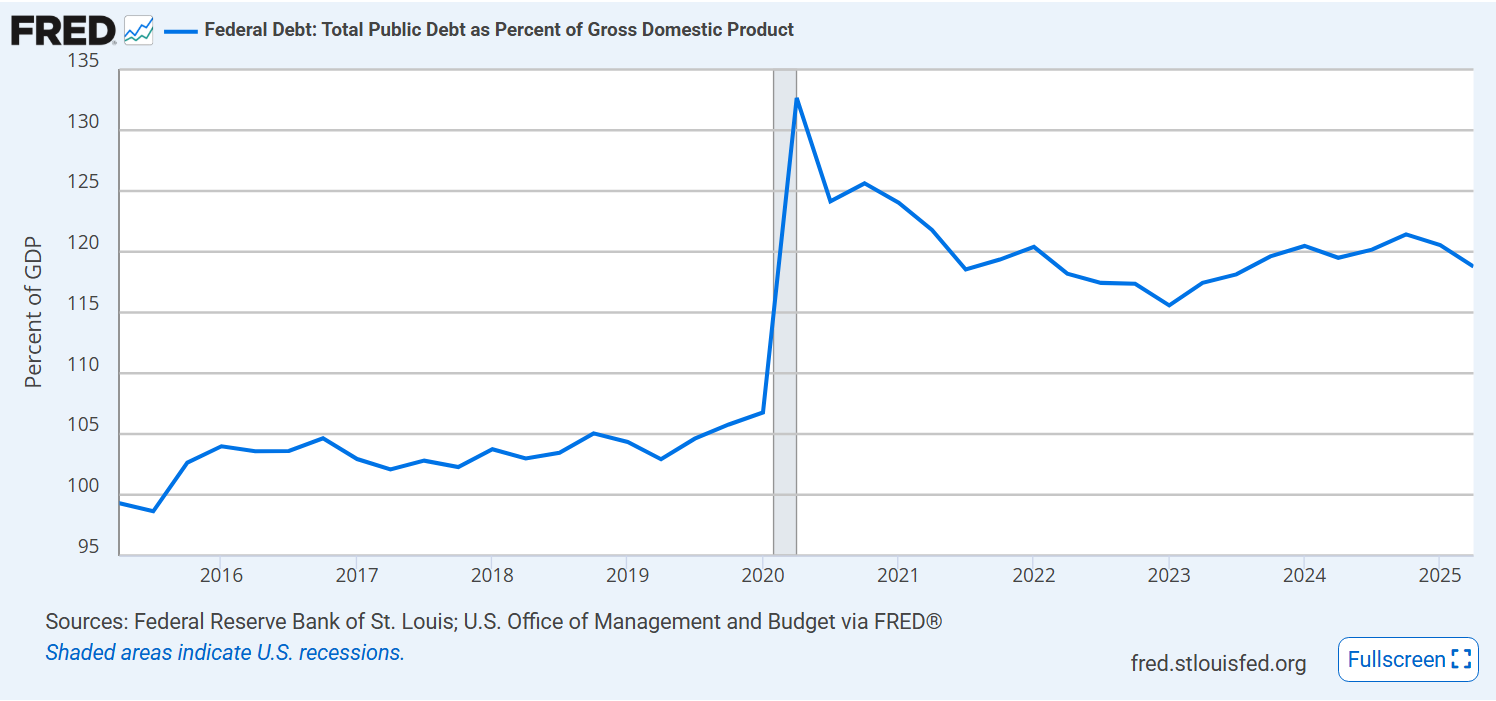
Federal debt % of GDP remains at 120%, up from 105%.
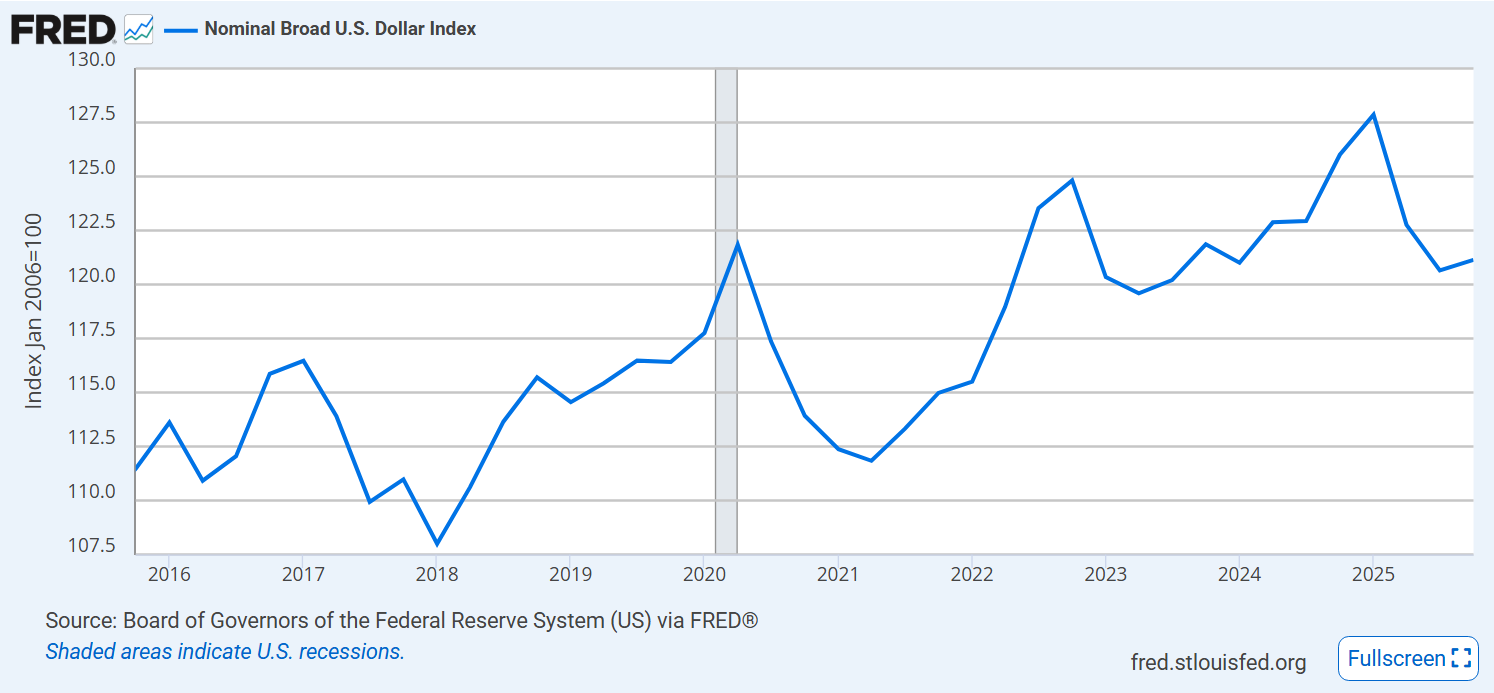
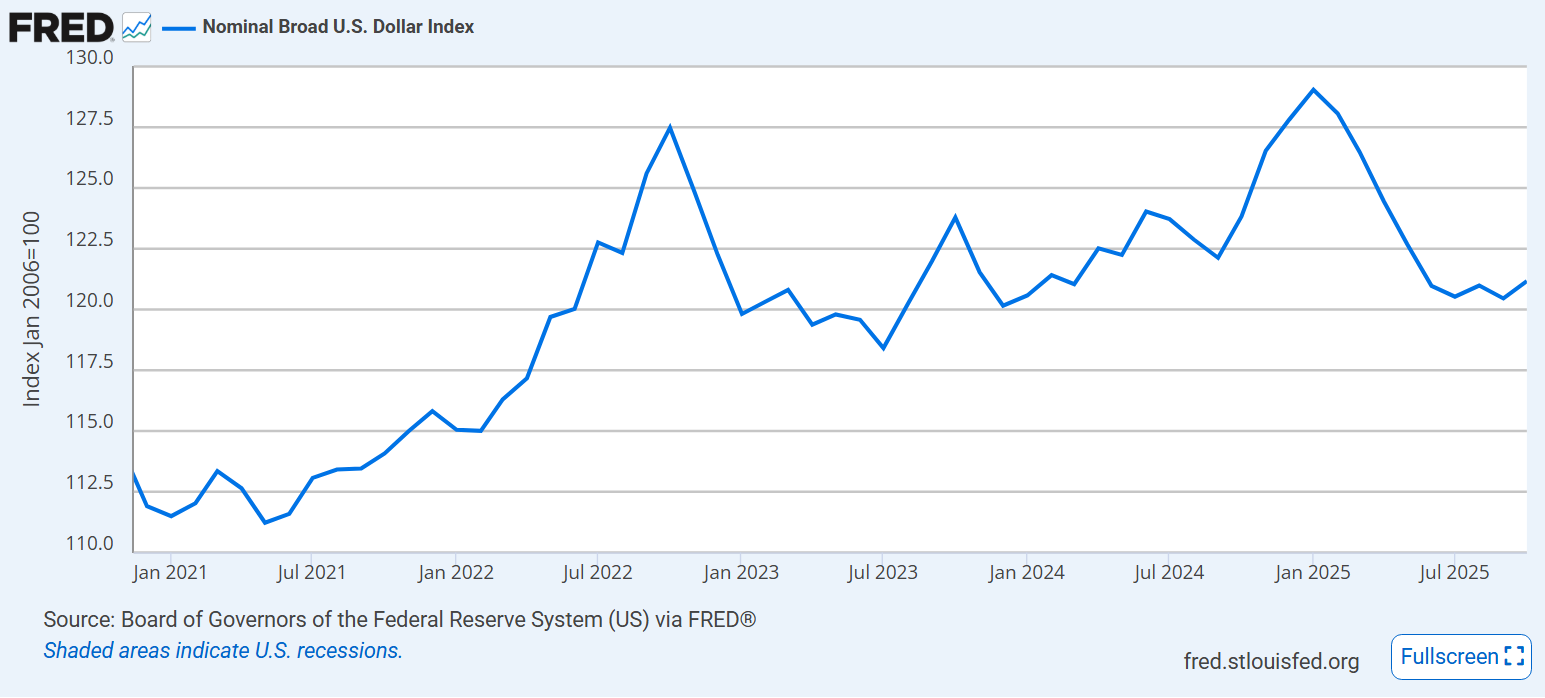
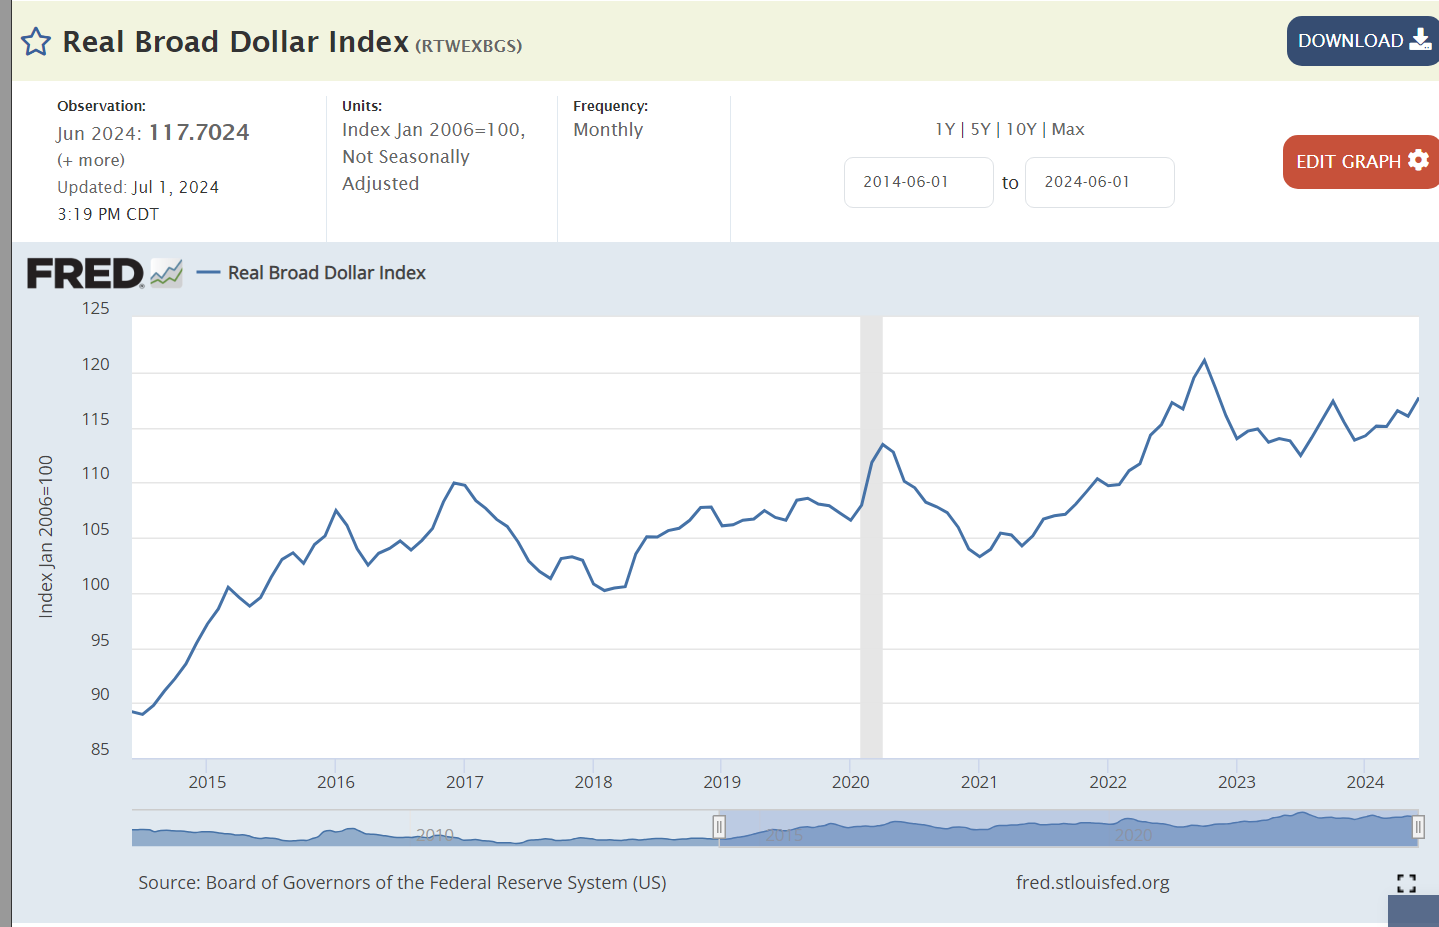
Value of the US dollar increased by 10-12% after the pandemic, but has retreated by 6%.
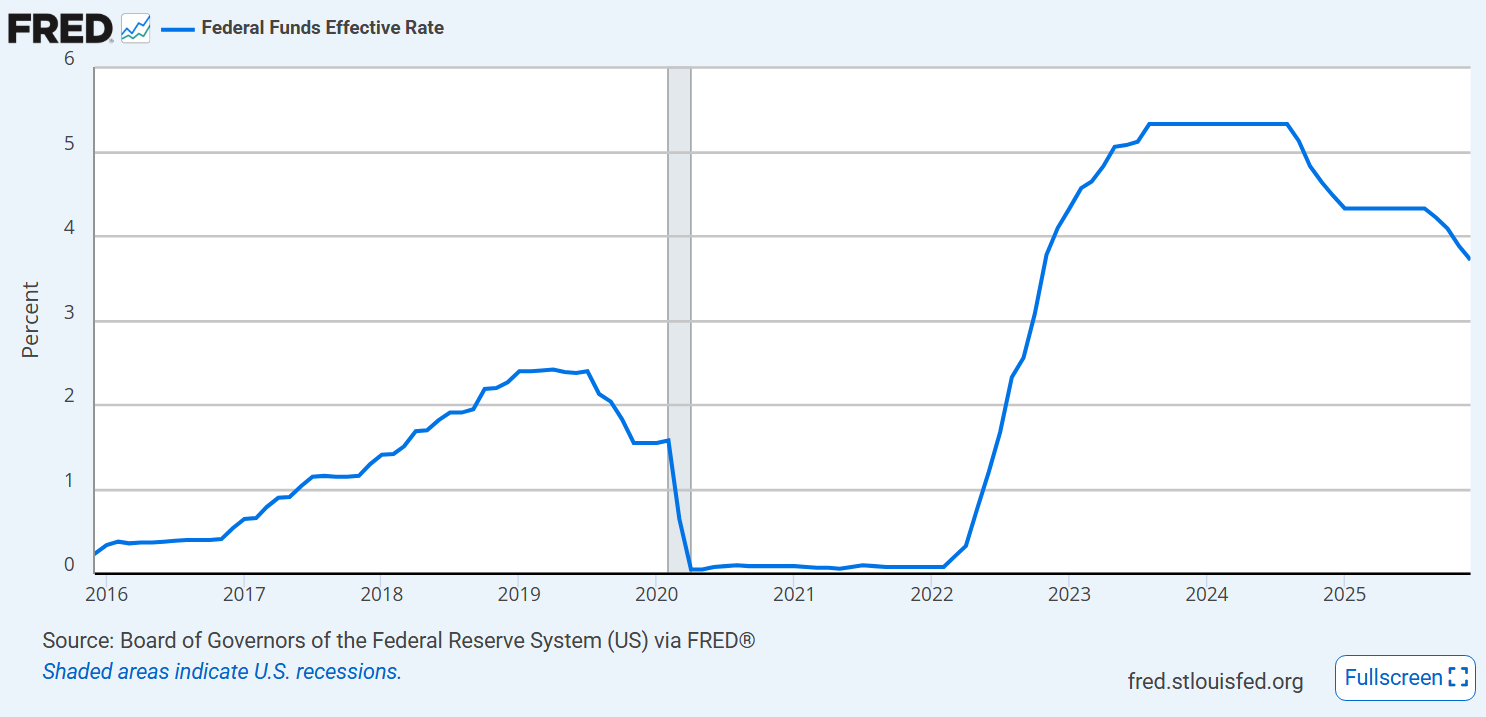
The Federal Reserve Board has reduced interest rates by 1.5%.
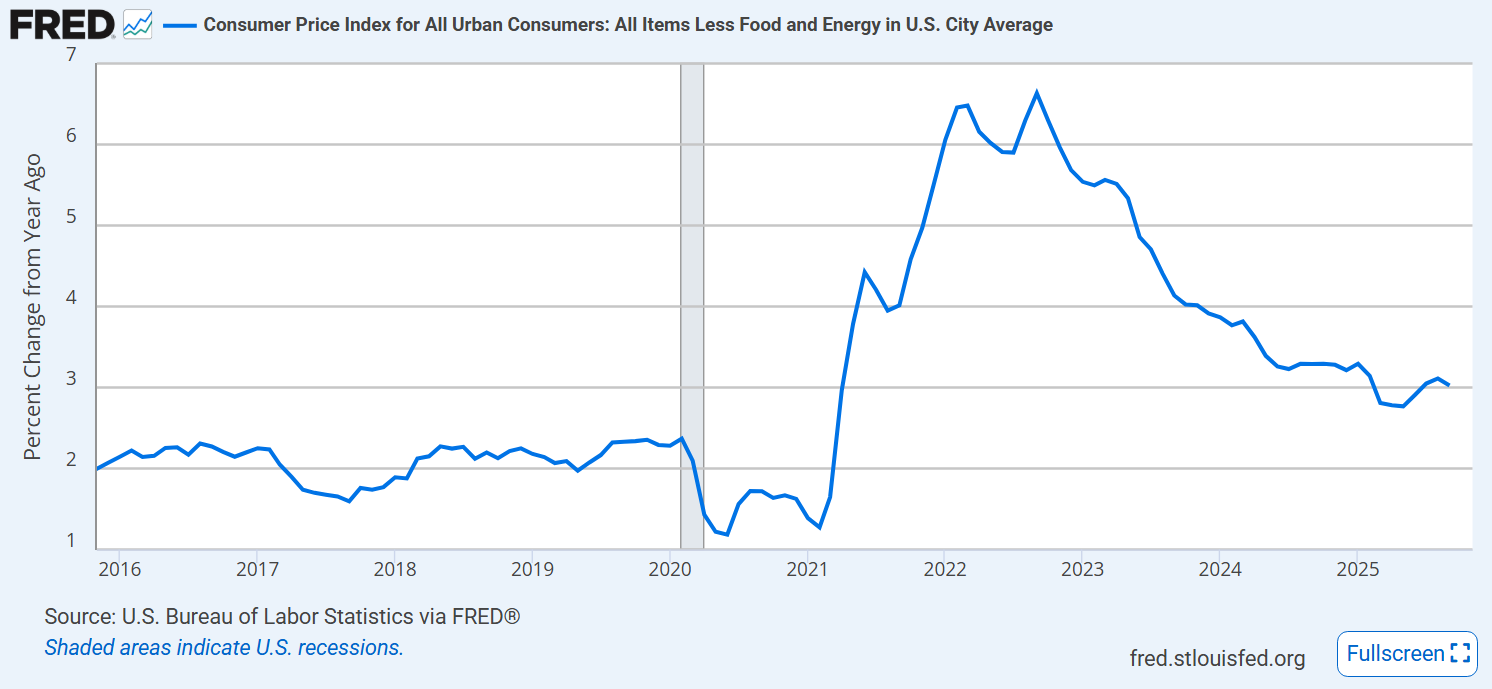
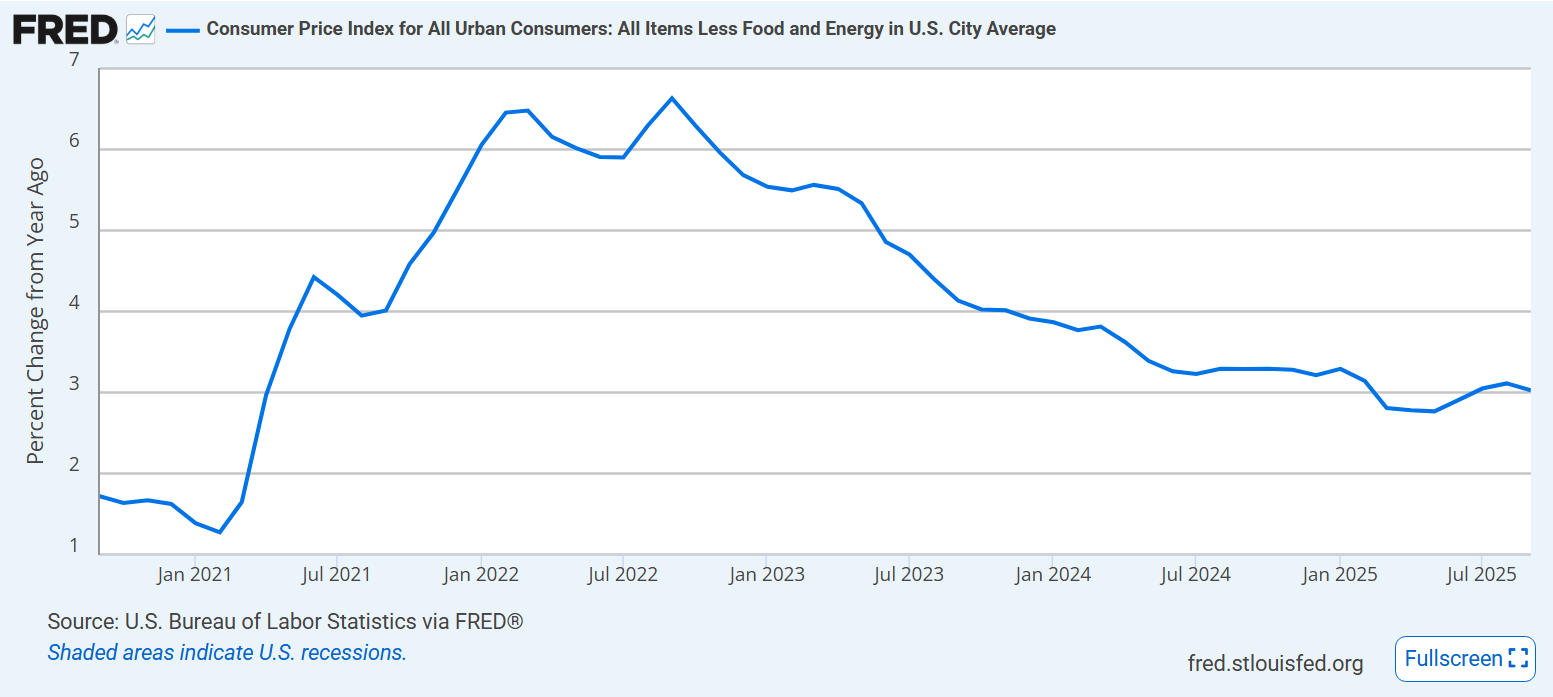
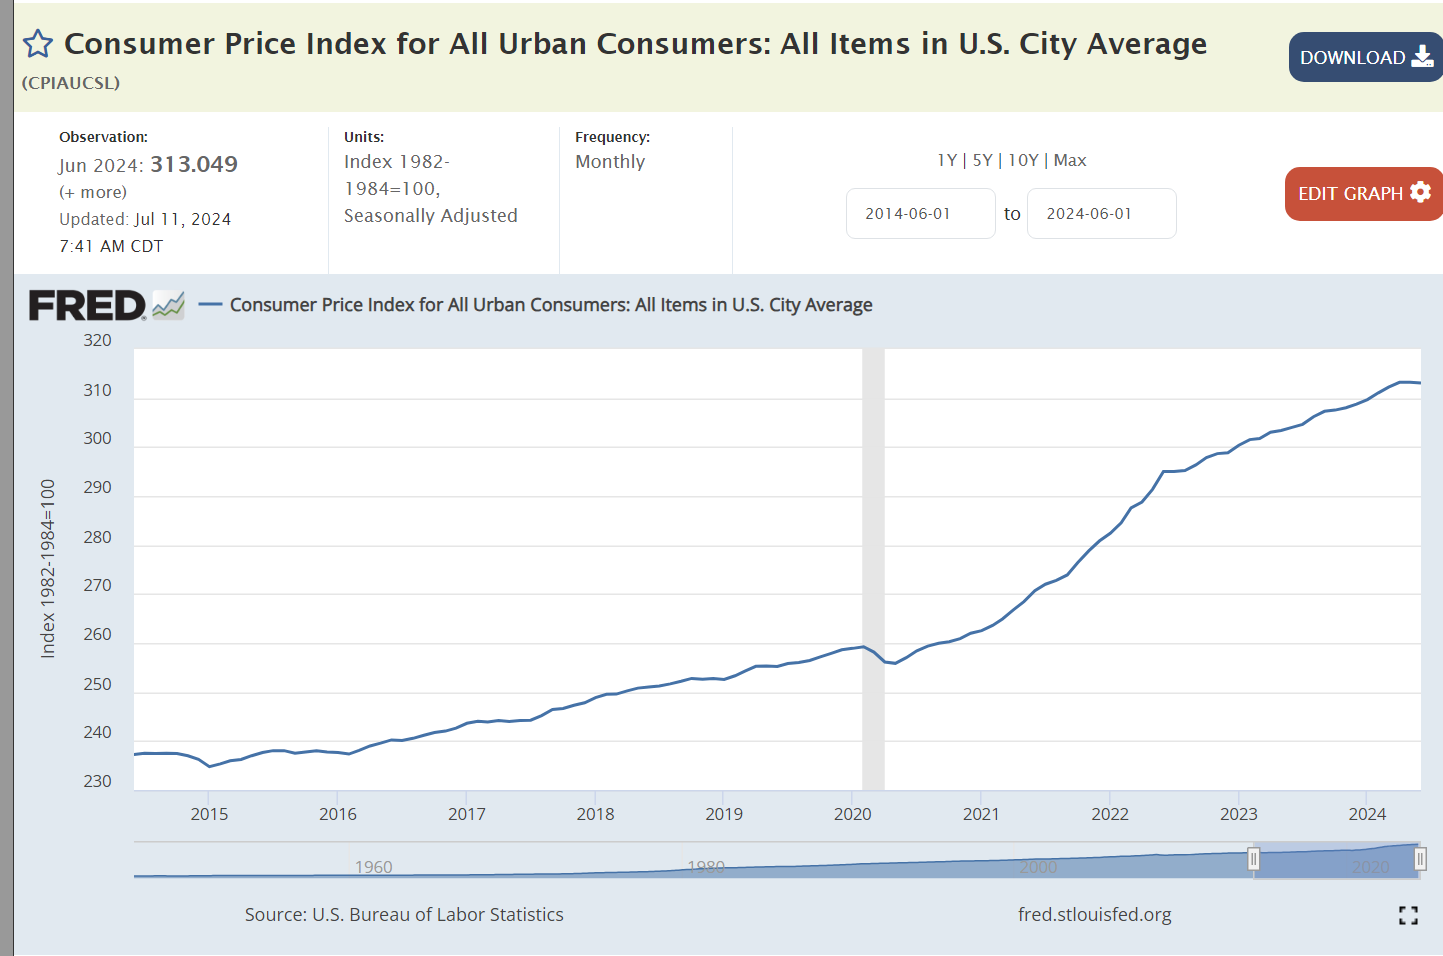
Core inflation rate has levelled off near 3%.
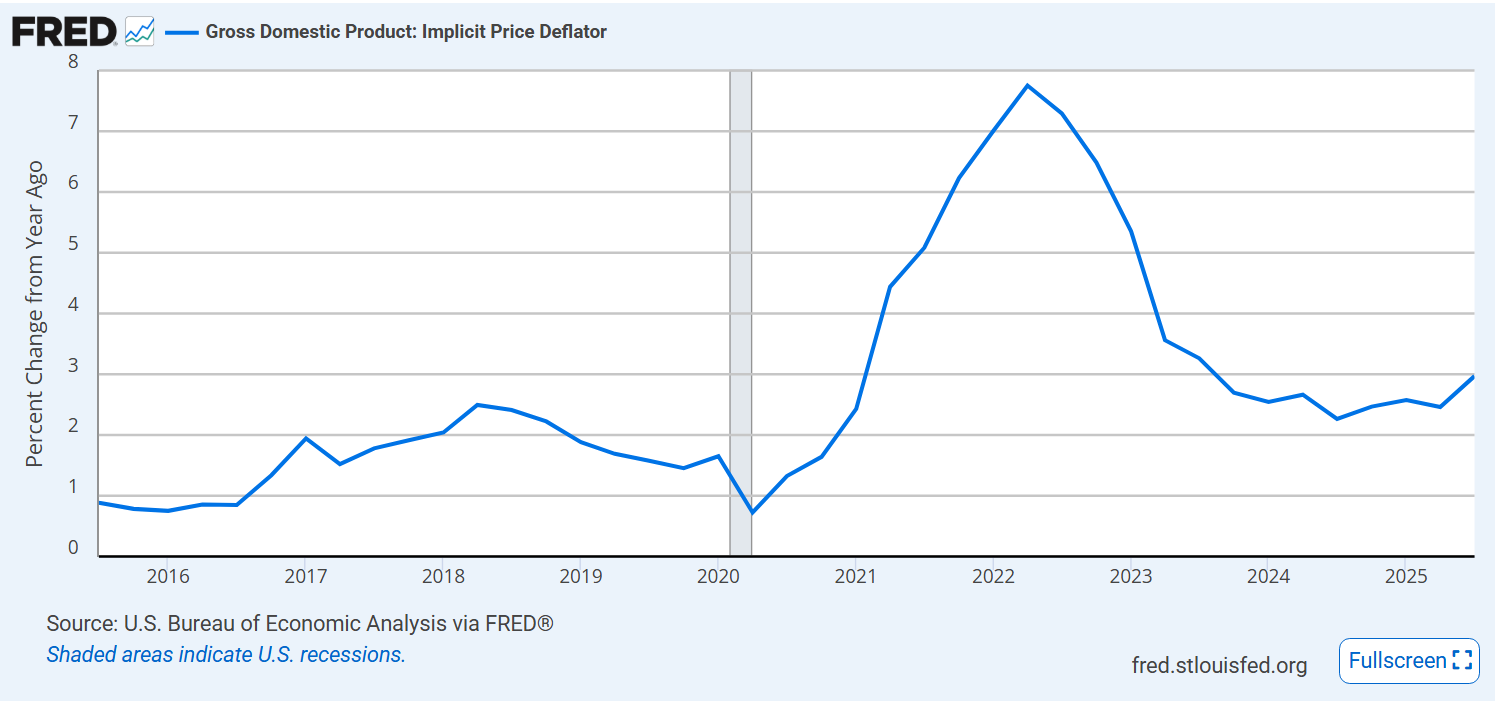
The GDP Price deflator measure of inflation is a little better, approaching 2.5%, but also level or growing.
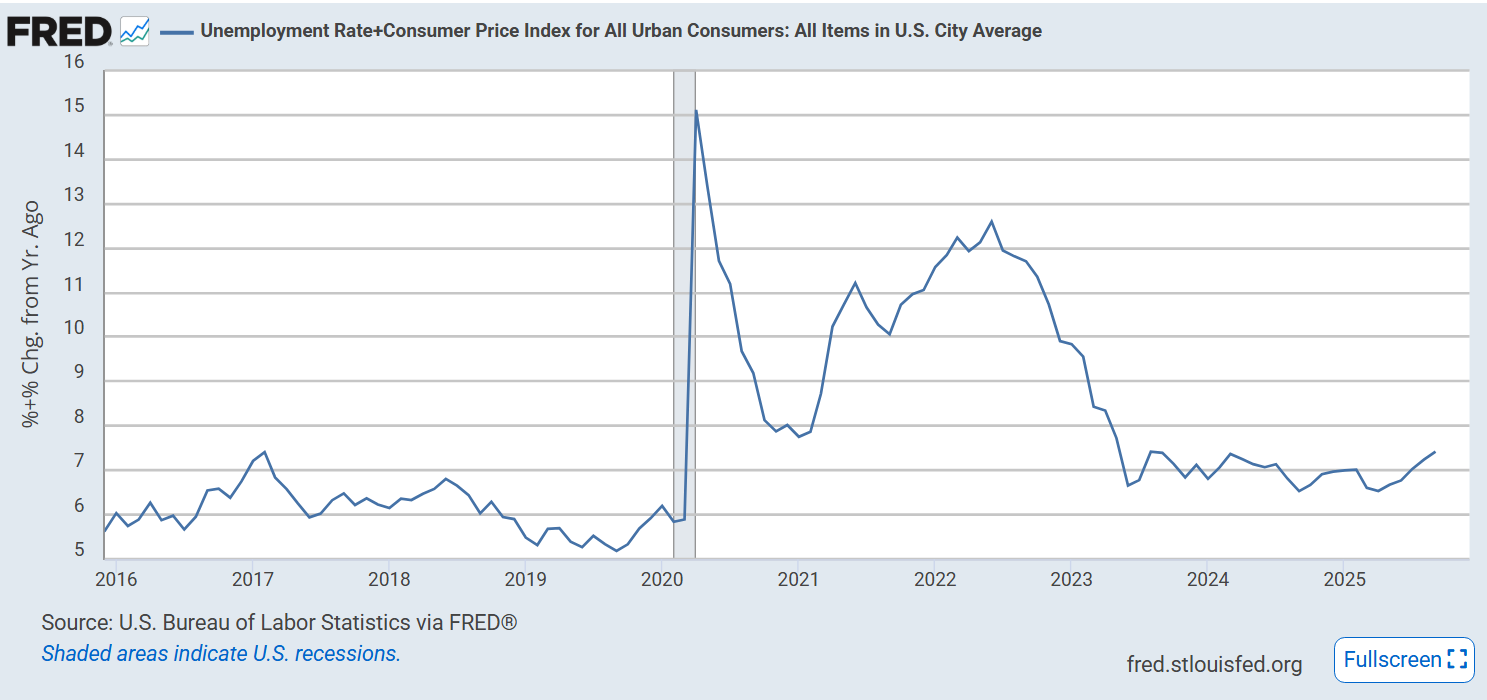
Misery index is up a bit at 7.5%.
Summary
Stock market is solidly up together with corporate profits and business investment.
Inflation and unemployment are up. Budget deficits and debt remain high. Dollar value is down. Manufacturing employment is down. Business and consumer confidence is down.
Other measures are comparable to the 2023-2024 Biden economy base; not improving as often claimed.
The US economy is increasingly resilient and not easily changed by small policy choices or “jawboning”.
I wrote many posts during the Biden administration to counteract the recurring false claims about “runaway inflation”. Biden was certainly guilty of spending too much taxpayers’ money for economic recovery, infrastructure, green projects and student loan forgiveness. This aggravated the inflation rate, made it slower to fall and established expectations of higher long-term inflation. However, the primary drivers of inflation were the pandemic driven demand for physical goods after factories closed, loose monetary policy and bipartisan government spending to offset the pandemic. We all enjoyed 20 years of price stability before this. A little bumpiness after a pandemic driven global shutdown was not surprising.
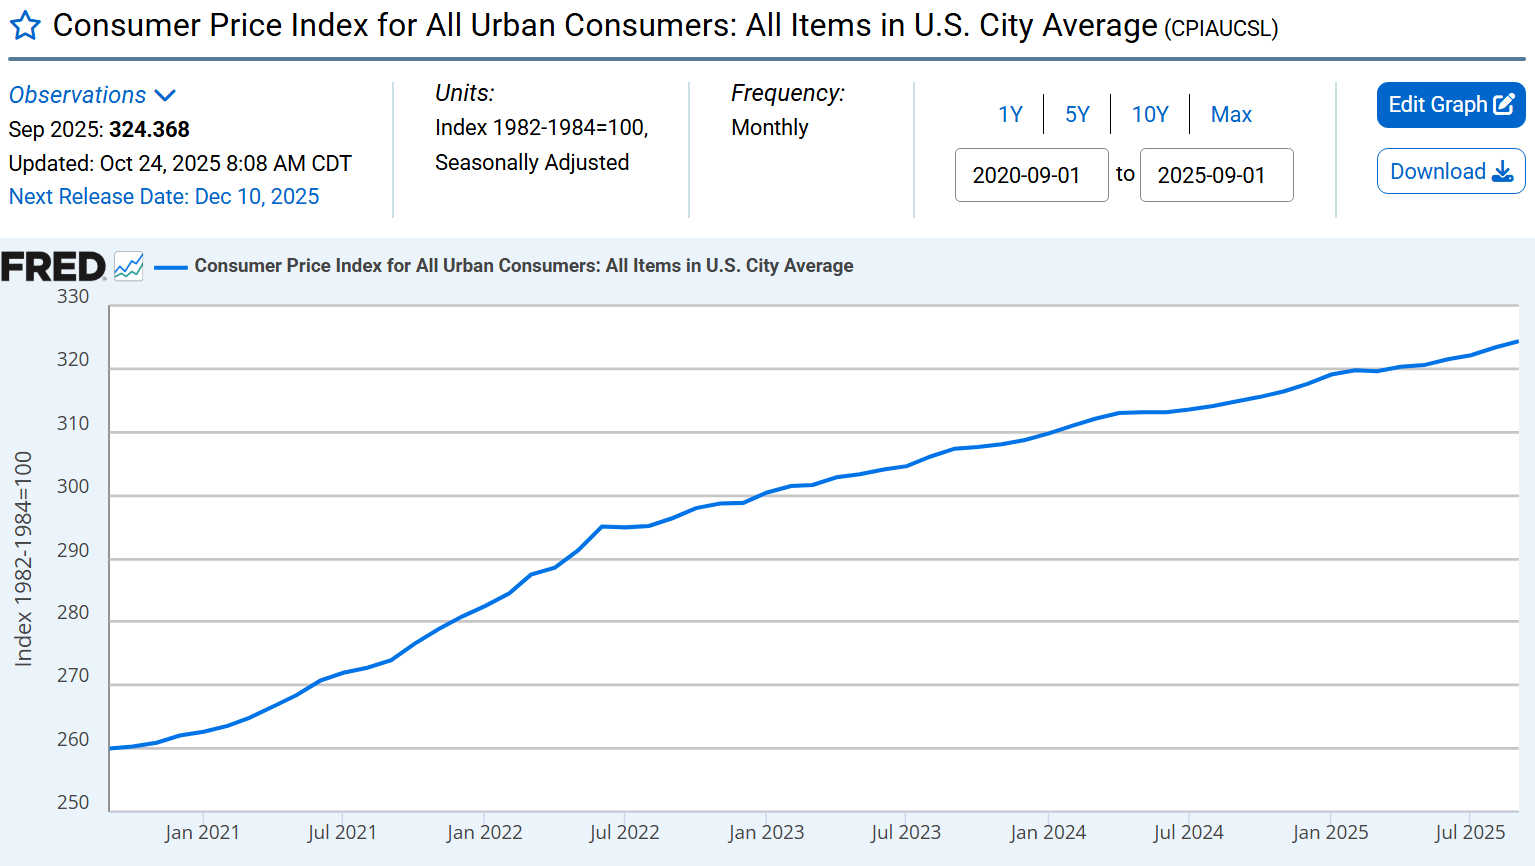
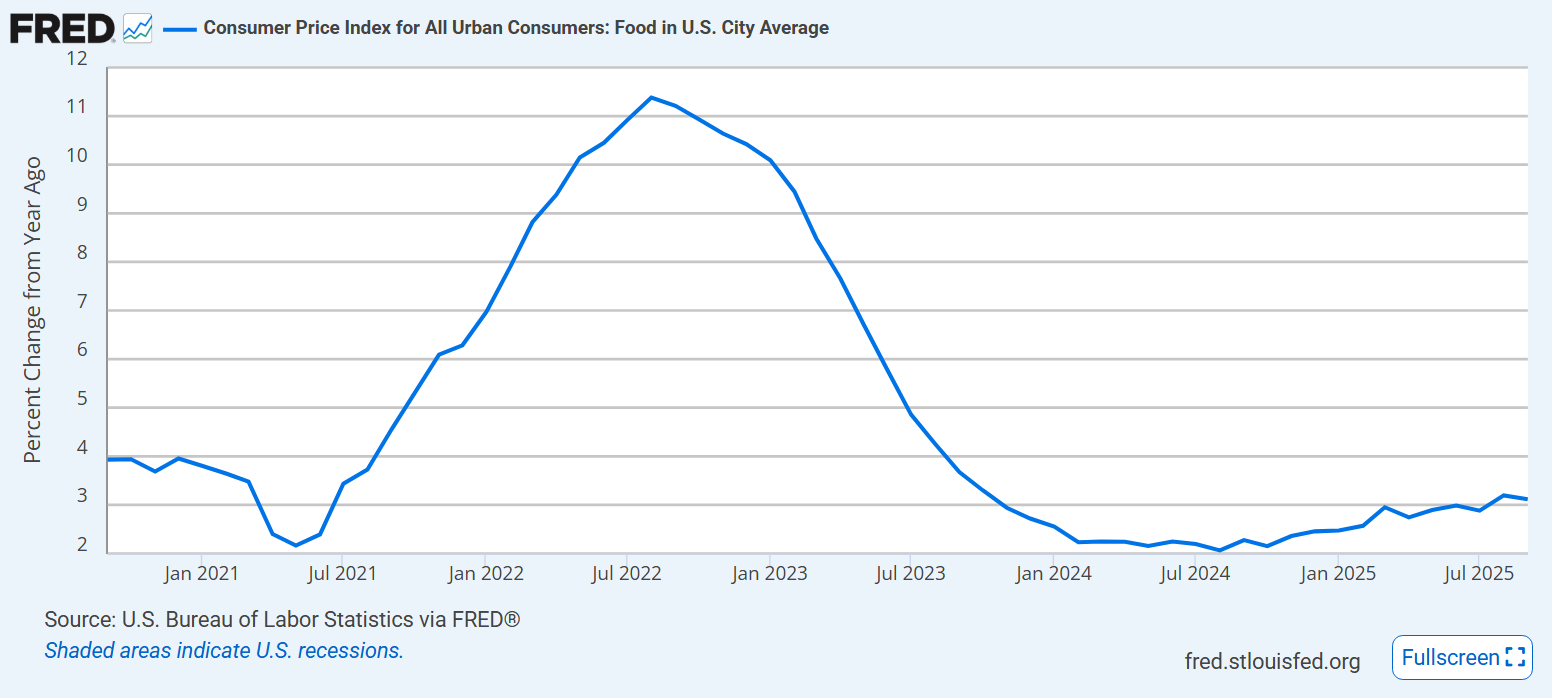
The climbing inflation rate broke in June, 2022 more than 3 years ago. It has not slowed under Trump’s stewardship.
The inflation rate has been in the 3% +/- range for the last 2 years. That means that prices, on average, continue to increase each year. 2% inflation was the normal rate for the prior 20 years. It (3%) seems to be a rate that is “non-accelerating”. Economic agents, including consumers, are able to ignore 2% inflation. It is immaterial, too small to really notice. 3% inflation is on the border of being “concerning”. Inflation can more easily accelerate from 3% to a concerning 5% or higher. President Trump can claim that he has maintained the Biden inflation reduction from 9% to 3% but he cannot claim that he has reduced prices, reduced inflation or made the cost of living more affordable.
The core inflation rate, excluding the more volatile food and energy prices, has shown the same pattern. It peaked at 6.5% and declined to “about 3%” by June, 2024. It has moved down by one-quarter percent since then. Unfortunately, it seems to be flat. Trump has not moved it down.
President Trump has pursued 2 of these 12 areas but worked in the opposite way to increase inflation on most. He has pressured drug prices down. He has encouraged increased supply of traditional fossil fuels energy.
Fiscal Policy
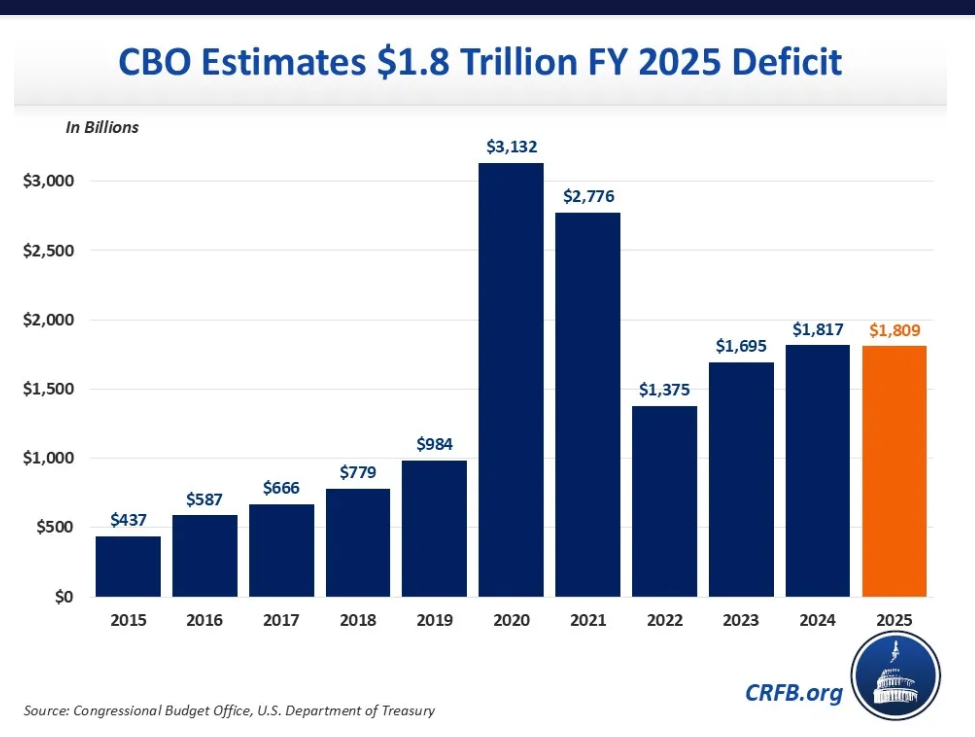
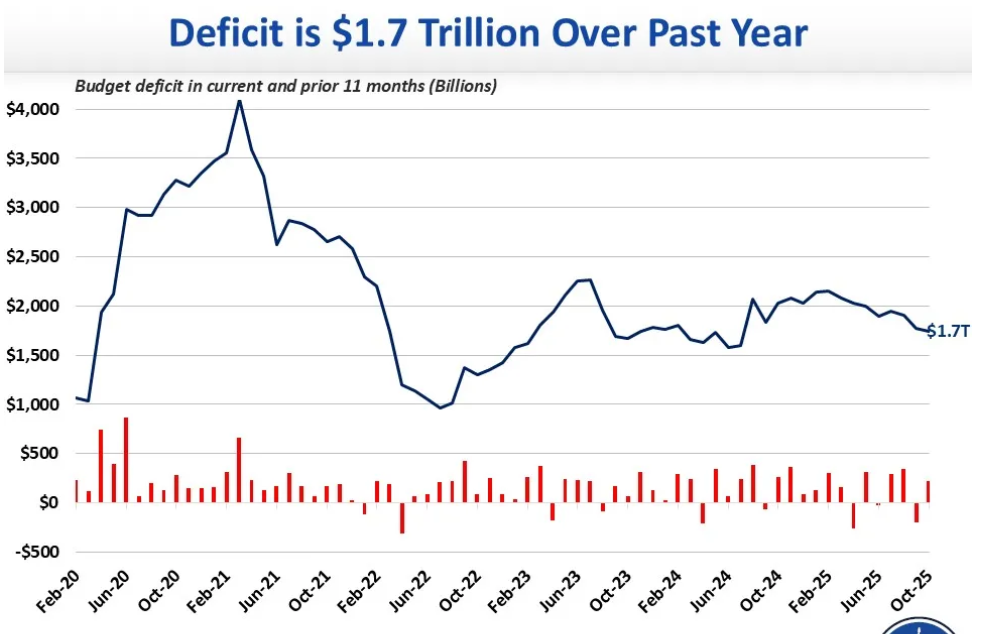
Federal budget deficit remains at an unsustainable $1.7T per year. Too much demand, not enough supply.
Monetary Policy
President Trump has been harassing Fed Chair Jerome Powell (who he appointed) to cut interest rates. The real, inflation adjusted, interest rate is currently 1%. Monetary policy is neutral or a little tight. President Trump encourages looser monetary policy which increases inflation. Not an inflation fighter.
US Dollar
The US dollar has declined in value since Trump took office, making foreign purchases more expensive.
Housing Costs
Housing prices peaked in 2022, drifted down by 5% in 2022 and have remained flat for the last two and a half years. Trump policies have no impact here.
Health Care
3% medical inflation continues despite efforts to reduce drug prices.
Food prices are more volatile than most. Inflation reached 11% in 2022. It approached 2% in 2024 but has since increased to 3% annually.
Energy
Energy prices jumped in the first 2 years of recovery from the pandemic. They have been flat since then. Trump has cancelled $8B worth of previously authorized energy projects.
Gas prices averaged $2.50/gallon before the pandemic, spiked up to $4.50/gallon during the recovery and settled back to $3.00/gallon for the last 3 years.
Tariffs
US consumers enjoyed immaterial average import tariff rates for the last 50 years. Trump has levied an 18% tax on imports, increasing costs for American consumers of the 14% of their consumption that is imported. The inflationary impact of the Trump tariffs has not yet been passed along to consumers. The frequent changes in tariff rates have led businesses to absorb costs in the short run. This will not continue.
This recent tax change benefits individuals with enough income to pay federal income taxes, so improves affordability for an estimated 4 million people.
This provision of OBBA benefits low to moderate income households aged 65 and older. Many experts criticize its structure, but it clearly makes life more affordable for those who benefit from the change.
Higher Limit for State and Local Tax (SALT) Deductions
Higher income taxpayers who itemize deductions received a significant federal tax reduction. This change does not benefit most low to moderate income households.
Increased Cost and Reduced Availability of Child Care
The OBBBA increased tax credits to partially offset childcare costs. Critics considered these changes to be inadequate, noting that a “pro-family” political party should do better.
Greatly reduced net immigration will tighten the labor supply in some industries, leading to higher compensation for some workers and higher prices for consumers. Economists have not reached a consensus on the net impact to the typical American.
Inflation continues at 3% annually. Real wages are keeping up with inflation. The memory of large price increases in 2022 that were never reversed seems to have reset inflation expectations from 1-2% to 3-4% per year. Some tax law changes in the One Big Beautiful Bill meaningfully cut taxes. Fiscal policy remains very loose and drives inflation. Monetary policy is considered neutral by most economists, but Trump is trying to loosen it, which risks further inflation. Trump’s “on/off” tariff negotiations have not yet driven large consumer price increases but have slowed business investments. Trump’s claims to have improved “affordability” rest on his specific actions that point in that direction, not on the economy wide statistics or large-scale policies that might significantly improve affordability for the “average” family.
1 Reduced quarterly inflation rate (CPI) from peak 8.6% in 2Q, 2022 to 2.7% in 4Q, 2024. 2 Doubled the federal budget deficit from $0.75T to $1.5T per year. 3 Inflation grew to 9%, partly reflecting excess government spending initiated by the president. 4 Added 15M jobs; added jobs every month!!!!!!! 5 Cut the Black unemployment rate from 10.0% to 6.1%. Cut the Hispanic unemployment rate from 9.3% to 5.1%. 6 Increased per capita real disposable income by 5.6%. 7 Increased prime age labor force participation to near record 83.9%, last seen in 2001. 8 Reached pre-Covid employment in 28 months. Great Recession recovery took 3 times as long (77 months). 9 Real wages grew significantly in each year. 10 Record low unemployment rates quickly achieved and maintained after pandemic. 11 Reduced unemployment rate from starting 6.7% to 3.7% average for 2022-24. Pre-Covid 2017-19 was 4.0%. 12 Increased real GDP by $2.8T, 13.1% total, 3.2% annual. Trump pre-Covid gain was $1.7T, 2.8% annual. 13 Bloomberg reported a 26% increase in net household wealth between December 2020 and 2024. 14 Increased household wealth by 20%. 15 Recorded 24% increase in median home sales price from December 2020 to 2024. 16 Stockmarket value increased by 50% from December 2020 to 2024, building upon 50%+ rise in prior 4 years.
Outstanding economic results. The majority of inflation was due to pandemic and supply chain issues. Nonetheless, the growing budget deficits were an “own goal” that should have been avoided for economic and political reasons.
Governing
17 Appointed record number of federal judges, including record share of women and minority judges. 18 Postal Service Reform Act – reset reasonable debts, compensation and service levels. 19 Misevaluated and misresponded to declining personal health risks. 20 Democratic party exceeded expectations in 2022 midterm elections. 21 Negotiated spending limits in order to increase debt ceiling and avoid government shutdown. 22 Failed to overhaul Democratic party position as leaders of states and cities. 23 Failed to take advantage of the January 6, 2021 insurrection to remove Trump from politics. 24 Oversaw continued weakening of Democratic Party appeal to working class, minorities, men and independents. 25 Oversaw continued weakening of Democratic Party power, brand and results. 26 Promised to govern for all of the people but slipped into anti-MAGA politics. 27 Ran for second term and failed to withdraw in time for the party to field an effective platform and candidate. 28 Republicans were able to make DEI and wokeness a winning issue at all levels, without counter-leadership. 29 Unable to offer a new framework to reset politics outside of the win/lose polarization approach. 30 Increased IRS budget to reduce tax evasion and increase revenues. 31 Inflation Reduction Act – set minimum 15% corporate tax rate. 32 Electoral Count Reform Act – clarify presidential election processes. 33 Speech and legislation on threats to democracy, voting rights. 34 Support Voting Rights and Freedom to Vote legislation, enforced laws, opposed new state restrictions. 35 President and Democrats were unable to make progress on voting reforms despite opportunities. 36 American Rescue Plan – extra funding to cut child poverty in half. 37 Increased Pell Grant funding for lower income college attendees. 38 PACT Act – covers veterans exposure to toxic chemicals. 39 Provided new or lower cost internet access to 5M. 40 Provided student loan debt relief to 5 million borrowers. 41 American Rescue Plan – reduced medical insurance premiums
Some “good government” initiatives and results. Biden was unable to address the basic challenges of polarization, skepticism, social media, rule of law and personal integrity. He was elected as a “placeholder” to avoid Trump in 2020 and filled the “placeholder” role. He was unable to reframe the debates.
Public Health
42 Inflation Reduction Act – allows Medicare to negotiate top 10 drug prices, 43 Inflation Reduction Act – capped annual drug costs, reduces insurance costs 44 Negotiated agreement with pharmaceutical companies to reduce drug prices. 45 Doubled number enrolled in Affordable Health Care from 12M to 25M. 8% uninsured is record low. 46 Inflation Reduction Act – increases Affordable Care Act access to medical insurance. 47 American Rescue Plan – 500M covid vaccinations 48 American Rescue Plan – funding for individuals, businesses, governments and NFPs to survive pandemic. 49 Management of Covid-19 pandemic health care, communications and economic recovery strategy. 50 Failed to capitalize on his pandemic recovery and economic successes in the public eye. 51 Some pandemic decisions were overly restrictive, not based upon science, cost/benefit or value of freedoms. 52 Legislative, funding and regulatory changes to energize the Cancer Moonshot initiatives. 53 Rejoined the World Health Organization.
The pandemic mitigation and recovery should have been celebrated as a once in a century victory for the American people, science, business and government. And for the world! The results were amazing, if imperfect. Biden’s team was unable to stake out the high ground and frame the real results in this manner, allowing partisan politics to infect and undermine even this situation.
International Relations
54 Created QUAD security relations with Australia, India and Japan. 55 Facilitated improved relations between Japan and South Korea. 56 Increased support from citizens and leaders in NATO nations to the US. 57 Recommitted the US to NATO, encouraged defense investments, welcomed Finland and Sweden. 58 Signed AUKUS deal with the United Kingdom and Australia for Indo-Pacific security. 59 Unable to renegotiate new bargain with allies to pay for US defense, police, trade, shipping, legal umbrella. 60 Was unable to delivered principle leadership for the liberal international model on trade and global affairs. 61 Failed to reset US-China relations despite shared interests in global commerce, climate, security and health. 62 Supported Trump’s anti-free trade and anti-China actions without proposing effective alternatives. 63 Reduced US reliance of Chinese imports by 10%, increased US exports to China by 15%. 64 US dollar increased in value by 15%. 65 US inbound foreign investment averaged twice as high from 2021-24 versus 2020. 66 US outperformed other nations in achieiving pre-Covid levels of GDP and employment. 67 US stocks increased in value by 50%, more than in other markets. 68 Supported the bipartisan 2024 immigration reform bill that was rejected by candidate Trump and Republicans 69 Failed to take emergency action to secure the US-Mexico border, protect and process immigrants. 70 Responsible for 3 years of 175,000 monthly migrant apprehensions versus 25,000 baseline. 71 Ended Afghanistan war within negotiated plan. 72 Protected the US from terrorist attacks, authorized surgical anti-terrorist attacks. 73 Recorded zero domestic deaths from international terrorist activities during 2021-24. 74 Support for Israel after Hamas attack, ceasefires, prisoner exchanges and hostage releases. 75 Afghanistan withdrawal was poorly planned and executed, costing lives, equipment and US stature. 76 Hamas attacked Israel, killing 1,200 citizens and taking 300 hostages, confident of Israel/US limits. 77 Israel invasion of Gaza has continued without resolution, highlighting the US’s lack of influence/leadership. 78 Economic, intelligence and military support to Ukraine, which has stopped Russia’s invasion progress. 79 US and allies imposed sanctions on Russia for Ukraine war. 80 Russia invaded Ukraine, confident that the US and allies would not respond effectively. 81 Russia’s invasion of Ukraine has continued, without effective opposition or a negotiated solution.
Biden was able to mend relations with our allies and improve the strength of these alliances and the global power of the US economy. His team fumbled the Afghanistan withdrawal, failed to prevent the Russian and Hamas invasions and was unable to drive these situations to better solutions. US power has been undermined by these failures. The spike in illegal immigrants also portrayed the US and the Biden administration as a weak protector of our essential interests.
Resources
82 Inflation Reduction Act – $369B clean/green energy investment incentives. 83 Invested in wind, solar, battery and electical vehicle technologies. 84 US increased position as world’s largest oil producer and LNG exporter. 85 Expanded the US portfolio of national monuments. 86 Invested $4B in superfund environmental cleanup. 87 Rejoined Paris Agreement to address climate change. 88 Infrastructure Investment and Jobs Act – $1.2T. 89 New investments in domestic manufacturing, adding 750,000 jobs. 90 CHIPS and Science Act – incentives for domestic semi-conductor production. 91 Executive order on Artificial Intelligence outlines potential risks.
Big wins in managing energy, infrastructure and the environment.
Social Issues
92 20% reduction in violent crime rate after pandemic increases. 93 Renewed the Violence Against Women Act. 94 Repositioned marijuana classified substance rating, reduced federal criminal enforcement. 95 Respect for Marriage Act – required states to recognize the decisions of other states. 96 Responded to Supreme Court reversal of Roe v. Wade with Executive Orders on reproductive health services. 97 Revised asylum seeker options, added green card options for spouses of US citizens. 98 Safer Communities Act – gun controls, screenings, red flags.
Some small wins for the left.
Wins and Pinches
3 wins for every pinch! A decent number of achievements for a one-term president in a very polarized age.
Overall
Public Health A
Economy A-
Resources B+
International C+
Social Issues C
Govern/Politics C-
Biden did an outstanding job on the “blocking and tackling” in a very difficult situation. He “treaded water” in the international arena. He did not advance liberal social causes effectively. He failed to effectively address the Trump/populist threat to our democracy. For this, the overall grade is a D. 😦
Left, Right and Center
Biden was a moderate. He only tilted far left on 4 of the 98 items. Student loan relief was for the university crowd. The failure to address border security administratively was due to minority and progressive politics. Doubling the budget deficit undercut 30 years of Democratic Party “fiscal discipline” following Clinton’s “third way”. Not trying to reposition Democratic politics as centrist, moderate, adult, opportunity, American, scientific, effective, growing, universal, creative, tolerant, professional, metropolitan, ecumenical, big tent, majority, community, emerging, aspirational, progressive, etc. for fear of displeasing the postmodernist crowd and/or special interests was a huge lost opportunity in a time that called for leadership.
His greatest success was in managing the pandemic threat and growing the economy. He managed crime and terrorists. He enhanced American global power. He was a moderate president, just like Obama and Clinton.
Trump
I’m not a fan of Trump. His first term delivered more results than expected, but his existential threat to our system was already very clear.
1984 – Eli Goldratt offers a “theory of constraints” as a way to understand and manage complex systems effectively, leading to true “lean manufacturing” and “lean operations”.
Process standardization. Financial innovation. Highly focused strategies. New business forms. Markets and international trade deliver desired products, lower prices and competition. A role for government regulation remains. The macroeconomy can be managed to reduce the impact of business cycles and shocks.
The US economy continues its evolution from agriculture to manufacturing to services to information. President Trump was responsible for the US economy from February, 2017 through January, 2020. President Biden assumed responsibility in February, 2020. In order to compare the two presidents, let’s look at Trump for the 3 years of sustained growth deep in the business cycle before the pandemic. For Biden, let’s look at a comparable 3-year period from June 2021 through June 2024, after the post-Covid rebound. Trump benefitted from an 8-year long business cycle expansion. Biden had to deal with a once in a century pandemic driven economic depression.
Inflation: Advantage Trump
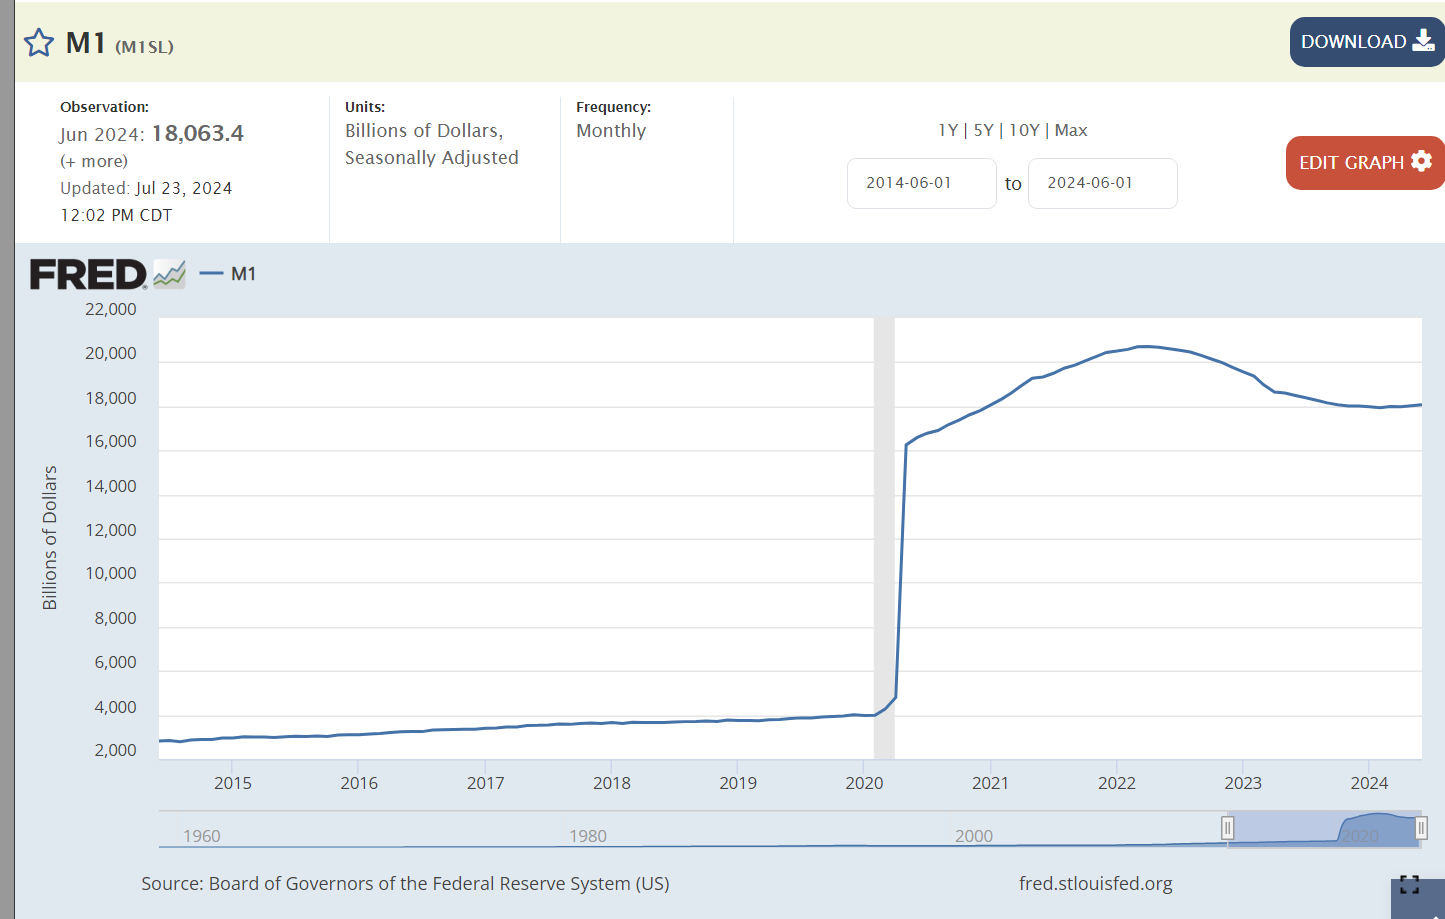
The independent Federal Reserve Board responded to the pandemic by greatly increasing the money supply to ensure that profitable, well-run financial institutions would be able to survive the temporary disruptions in the real economy. The Fed increased the money supply by 4-5 times its prior level to ensure the economy did not collapse! The extra money supply had to end up somewhere. It drove up consumer prices and increased asset values in the stock market and for home prices.
Inflation grew by 2% per year with Trump. It grew by 5% per year, on average, with Biden. Overall prices are 9% higher with Biden. Trump’s economic policies extended the Obama recovery for 3 years without triggering an increase in inflation, despite a low unemployment labor market.
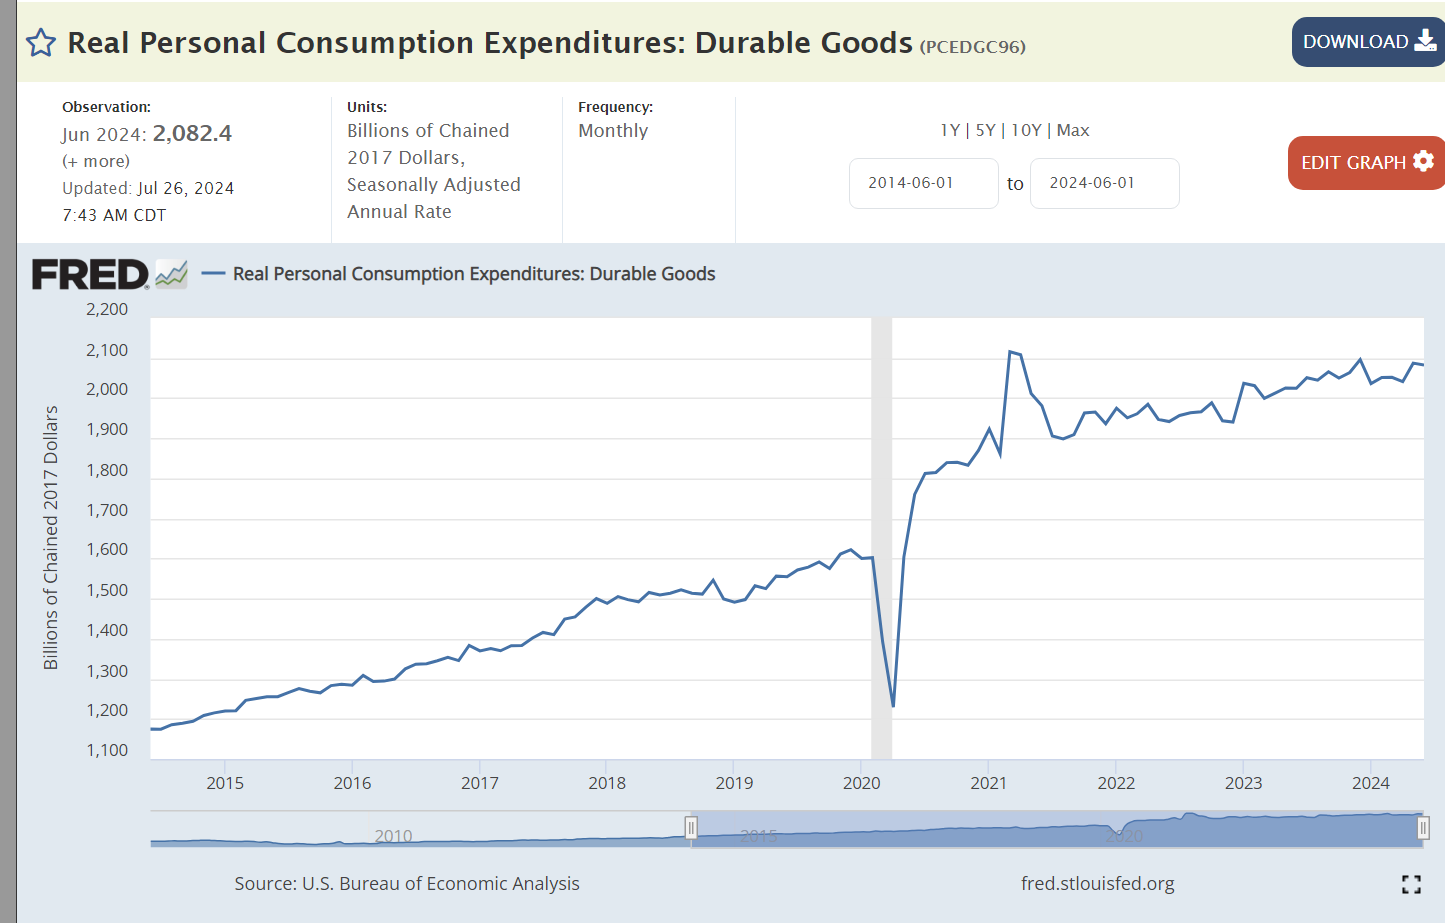
The largest cause of higher than usual inflation in Biden’s term was the 20% spike in US and global demand for durable goods. Factories shut down during the pandemic. Demand rebounded within 6 months as consumers chose to spend money on goods rather than in-person services. Consumer demand at the end of the Biden period is 50% higher than at the start of Trump’s term in office.
Corporations were able to capture and maintain a 50% profit increases due to market disruptions of the pandemic. Experts mostly reject Biden’s claims that corporate profits were the main driver of inflation, but they clearly aggravated the impact of the supply chain disruptions.
Obama was able to reduce federal budget deficits by two-thirds by the end of his presidency. Deficits doubled on Trump’s watch before the pandemic arrived. Biden cut deficits from their record highs during the pandemic, but they have been 50% higher than the pre-pandemic Trump era. Most economists consider the budget deficits to be the main cause of the continued higher than typical rates of inflation, accounting for 3%, 2% and 1% extra inflation in the 3-year Biden time we’re considering.
High profile gas prices remined flat during Trump’s period. Global supply and demand caused prices to increase from $2.50 per gallon to $3.50/gallon where they have remained for the last 3 years.
Trump enjoyed historically low 4% mortgage interest rates, a thin 2% above the inflation rate. The expansion of the money supply drive rates down to 3% during 2020 and 2021. They rose to 7% as inflation rose sharply and has stayed there. Inflation has fallen but markets typically require years of data to reset expectations of long-term inflation which drive mortgage rates. The Federal Reserve Bank has hesitated to cut its benchmark interest rates until inflation is clearly approaching its 2% target.
Labor Market: Advantage Biden
Trump reduced unemployment by 1%. Biden reduced it by 2%. Both presided over best in 50 years overall labor markets.
Layoffs have remained at historic lows, with Biden enjoying slightly lower rates.
Job openings in the Biden market have been 50% higher than the Trump market, reflecting a strong economy with growing labor demand, despite the impact of the pandemic.
The Biden economy recovered all 20 million jobs lost in the pandemic within 2 years, much faster than expected. Total employment has continued to grow at the trend rate to a record 159 million.
Core labor force participation is 1% higher with Biden than Trump. The current participation rate was last achieved in 2001.
Median real wages have been slightly higher during Biden’s tenure.
Asset Values: Advantage Biden
Despite the pandemic disruptions and losses, US firms are worth 70% more today than before the pandemic. This reflects the 50% profits increase and continued positive future prospects.
Home prices have nearly doubled since before the pandemic, reflecting the post Great Recession decline in home building, construction issues during the pandemic and general asset inflation caused by the rapid expansion of the money supply.
The US enjoyed a solid 7% savings rate before the pandemic, an extraordinary high 10% after the pandemic, falling to just 4% for the last 3 years.
Human assets increased during Trump’s presidency and resumed growth after the pandemic. As college graduation rates have increased throughout the post WWII years, the cumulative number of college educated individuals continues to rise each year. The growth in masters and professional degrees is noteworthy.
The Economy – Advantage Biden
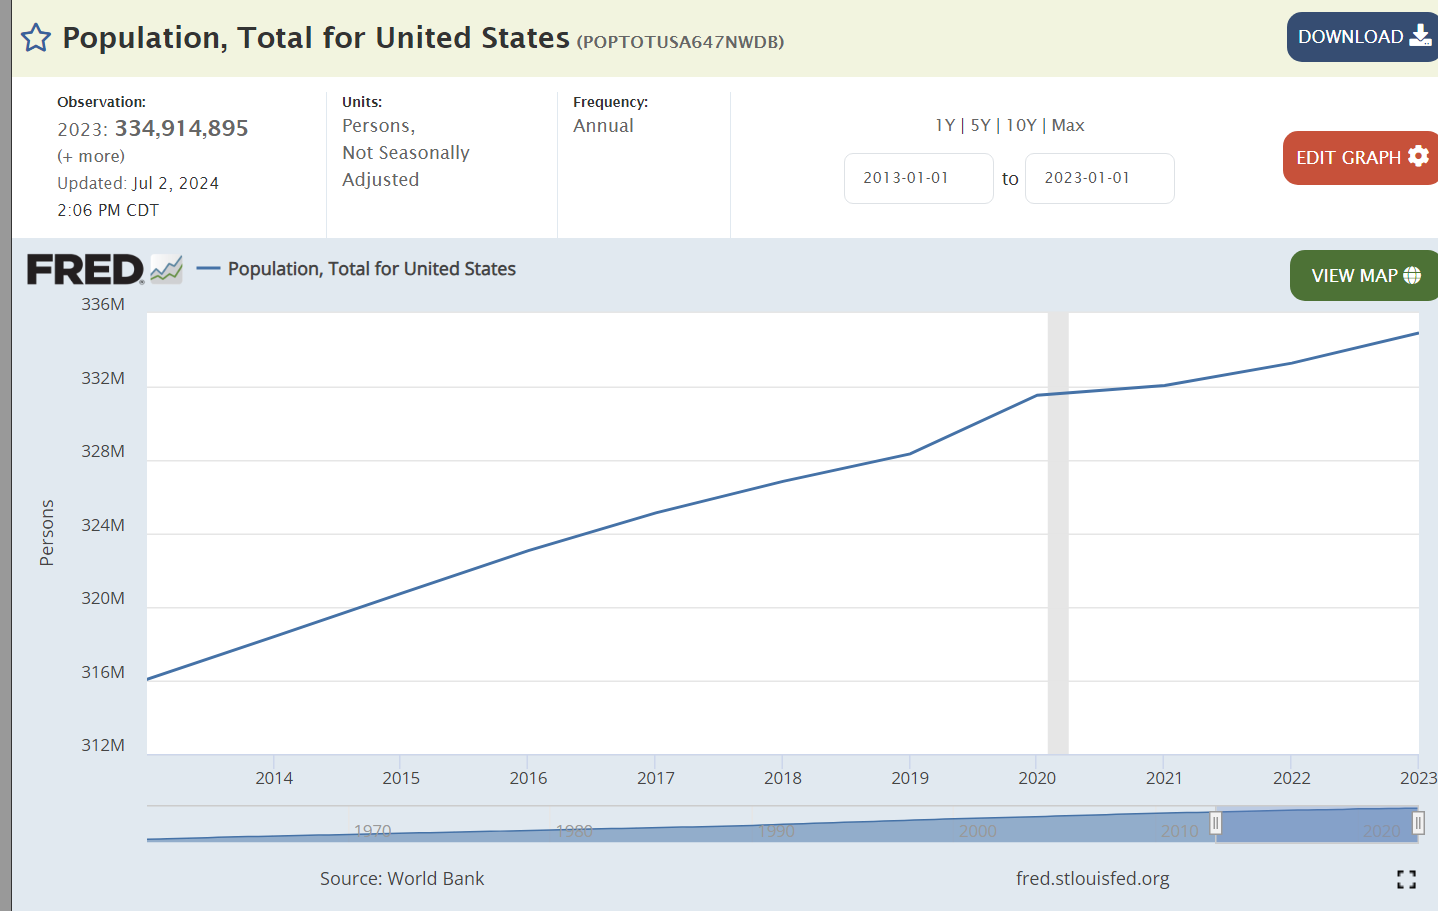
Population growth has resumed after the pandemic.
The healthy US economy is able to support 3 million more retirees after the pandemic.
Real dollar GDP is 2 trillion dollars larger than before the pandemic disruption. That increase is the same size as the total GDP of Russia, Canada or Mexico. We added the Canada economy during Trump’s time and the Mexican economy during Biden’s time.
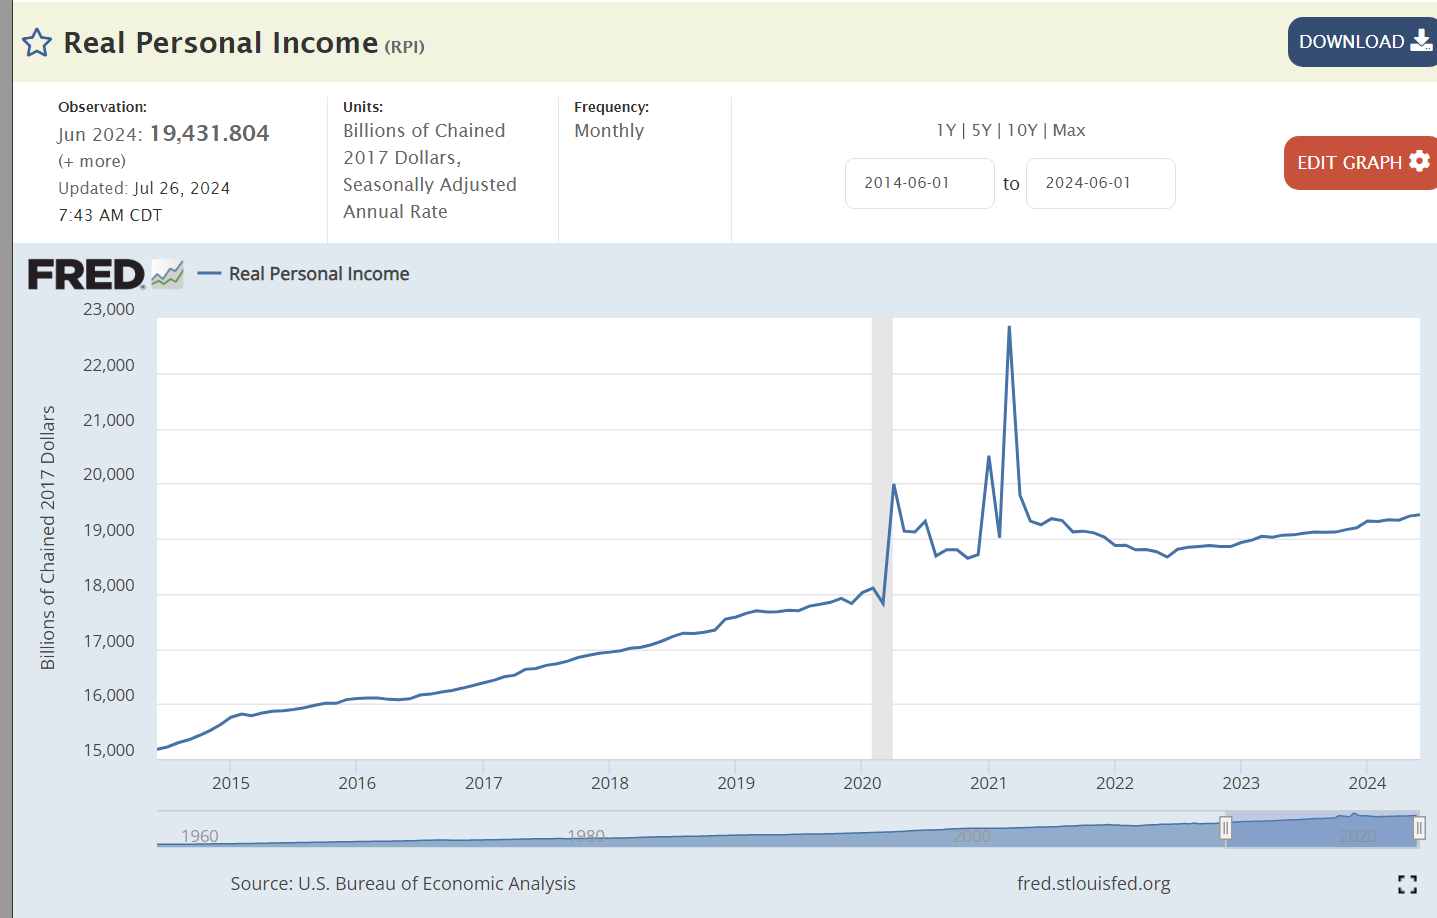
Real personal income grew a little bit faster during Trump’s time and more smoothly. Personal incomes jumped up during the pandemic but have been flat since that time with corporations capturing a greater share of the economy’s returns.
Workers have been 8-10% more productive in the Biden economy.
Farm income has doubled in the Biden economy.
Manufacturing employment grew by a surprising 3% in Trump’s term. It is slightly higher in the Biden era.
Real dollar exports increased during the Trump presidency and then again during Biden’s time despite a greatly stronger US dollar which hampers exports.
The world is willing to pay 10% more to hold US dollars in the Biden period, reflecting strong economic realities and prospects despite the risks of higher US inflation and budget deficits.
Summary
The US economy is very strong. Trump was able to extend the Obama recovery for longer than most expected, keeping inflation, interest rates and unemployment at low levels. Biden managed the recovery from the pandemic induced recession better than expected. The economy, asset prices and labor market have recovered very nicely. Inflation has remained the weak part of the Biden economy. It is lower than in comparable global economies and trending towards the 2% target in 2025. Critics point to excess government spending as an avoidable source of high inflation.
The Trump economy built upon the success of his predecessor. The Biden economy overcame the disruption of the pandemic to produce equal or greater results. Both presidents delivered solid results.
I’ve read 2 books this week by conservative and progressive authors outlining the consolidation of working-class voters of all racial/ethnic groups into the modern Republican party.
I recently outlined some steps that either party could take to address the challenges that working- and middle-class families face in a meritocratic world.
I’ve outlined other policy steps below that might convince the two-thirds of the electorate that are working and middle class that they are the priority. My rough-cut estimate is that these changes would improve the federal budget deficit by 2% of GDP.
Government Structure
Sunset laws requiring reapproval of substantive changes after the first 10 years.
Bipartisan staff recommended simplification and clean-up laws, one functional area per year, package approval, no amendments.
Independent staff recommendation of lowest 10% benefit/cost ratios for regulations by agency every 10 years, package approval, no amendments.
Implement balanced budget across the business cycle law that considers unemployment rate and debt to GDP levels.
Require spending cuts or funding sources for new spending programs.
Require federal programs to have a minimum 20-year payback from investments.
Migrate to minimum 80% federal funding of all federal programs assigned to states.
Outsource the USPS by region, maintaining 3 day per week delivery minimums.
Government Services
Determine paternity for all births, set and enforce child support agreements, provide basic level support from the state as required.
Provide home childcare volunteer refundable tax credit up to $100 per week.
Greatly expand availability of 1-2 year National Service programs for young adults and senior citizens.
Invest in nominal co-pay front-line mental health screening, intervention, listening, training, group sessions and counseling services for less critical conditions.
Expand veterans hiring preferences to state and local governments, government suppliers and large employers.
Invest in prison to work transition programs.
Allow large employers to setup new employees with default 1% contribution to local United Way/Community Chest umbrella funding services.
Allow any group of 10 states to create a “medicare for all” health care program as a substitute for the Affordable Care Act.
Allow any group of 10 states to create a private insurance-based (qualify in 2 states, qualifies for all states to ensure competition) health care program as a substitute for the Affordable Care Act.
Housing and Transportation
Restrict issuance of new building permits in counties that do not have one-third of permits proposed for units below the existing median unit property value.
Auction regional licenses for private firms or states to offer low annual milage limit used car leases low to medium credit score individuals using federal funding for the inventory.
Create voluntary 5% of income home down payment savings program that accumulates to $50,000 after 10 years of full-time employment contributions.
Retirement
Make social security employee tax payments optional after age 62.
Remove social security payment offsets from earned income after age 65.
Auction to private firms the right to offer standard 401(k) financial advisory services for 0.5% of asset value with 100% federal match below $50,000 and 50% federal match below $100,000.
Education and Labor Market
Make any overtime or shift premium pay non-taxable (alternative to 10% rate in original proposal). Reduce taxable wages by 10% for hours worked between 6pm and 6a.
Tax university tuition income above $15,000 at 25% rate to fund public colleges.
Create German-style public-private partnerships for broad range of vocational training opportunities.
Offer career and technical training grants for up to 2 years equal to state subsidy of college education.
Offer workers up to $5,000 for relocation or temporary housing as an alternative to up to 2 years of unemployment benefits. (alternative to tax credit for moving expenses)
Provide alternate sets of courses and experience to meet minimum requirements for standard level high school diploma, rather than requiring gateway courses like Algebra II.
Offer an all-industries state administered “career skills” certification program that can be earned in 3 years of employment and classes, including some classes for academic credit in high school.
Require governments and large employers to justify any strict “BA needed” job requirements versus “education and experience” options.
Safety Net
Create a self-funded unemployment lump-sum payment system based on prior 5 years earnings. 4 months award available after 10 years. 6 months after 15 years. 8 months after 20 years. (Alternative to higher benefits and bridging option)
Maintain a present value of future social security benefits asset balance for each participant. After age 35, allow once per decade 10-year term loan at 10-year T-bill plus 2% for up to 20% of balance, maximum of $50,000 loan balance. Repayment through social security system earnings.
Provide payroll contribution funded ($200,000 max) annual income catastrophic family medical insurance (>$100,000/year) to all citizens. (alternative to $25K government provided fund)
Eliminate all specific import tariffs, but levy a 3% tariff on all goods to “protect” domestic producers and help fund government programs. (alternative to 0%)
Pay-off all student loan debt for professional degree medical professionals serving 5 years in non-metropolitan county or metropolitan county with less than 300,000 population.
Subsidize high-speed internet for rural counties.
Offer 10 year T-bill interest rate financing for qualified “low cost” retailers to build stores more than 15 miles away from any existing qualified store.
Levy a $500 per employee annual “closing costs” fee on large employers (250+) for a maximum 20 years to fund local redevelopment programs starting with $5,000 per discontinued employee.
Levy a 0.5% of annual rentals fee on landlords to fund local redevelopment of abandoned properties and areas.
Professions
Staff state professional licensing boards with a minority of regulated active professionals. Reduce licensing requirements to meet public safety standards.
Require states to provide tuition free medical care and residency spots for one doctor per 10,000 citizens each year.
Reduce medical school preparation requirement to 3 years.
Offer reciprocal medical licensing arrangements with 30 leading countries and expedited review and specific qualifications training and experience requirement defined for all others within 90 days of application.
Set a national cap on individual and class-action lawsuits at $2 million per person, adjusted for inflation.
States contract for metro and area multiple listing services and limit total real estate commissions to 4% of transaction value.
Require financial advisors to meet the fiduciary standard of professional care, putting the client’s interests first.
Set maximum prices per service and per hour for home and auto repair firms.
Certify public advisors to provide general advice on consumer economics, budgeting, banking, investing, real estate, insurance and health insurance for $100/hour to citizens, with a $50/hour, 8-hour maximum annual refundable tax credit.
Taxes
Starting with the 35% tax bracket ($462,501 married filing jointly), reduce allowable itemized tax deductions to 0 at $2 million of income.
Add a 40% tax bracket at $2 million of income.
Levy a 5% of excess price paid on personal vehicles sold for more than $50,000, boats for more than $100,000 and recreational vehicles for more than $100,000. (alternative to 10% above $1M)
Add a 10% surcharge to tax rates for residential properties larger than 5,000 square feet. (alternative to surtax above $2 million)
Hamilton County municipalities, townships and districts had $2.3 billion dollars of debt outstanding at the end of 2022. That amounts to $6,300 per resident. Carmel entities accounted for $1.05 billion, or $10,300 per resident. The other 8 townships owed $1.26 billion, or $4,800 per resident. The other 91 Indiana counties’ 6.5 million citizens owed $30.5 billion, or $4,700 per resident.
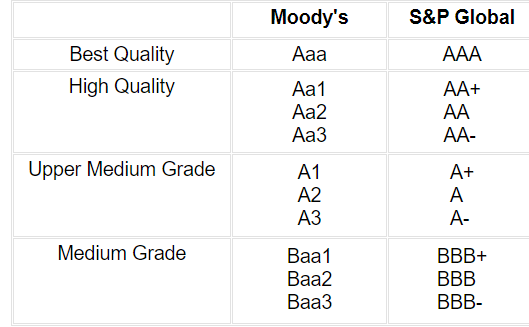
Municipalities have significantly less resources and taxing authority than states. Hence their bond ratings are lower. 16 states have AAA ratings, 9 have AA+, 5 AA-, 15 AA and 5 lower ratings.
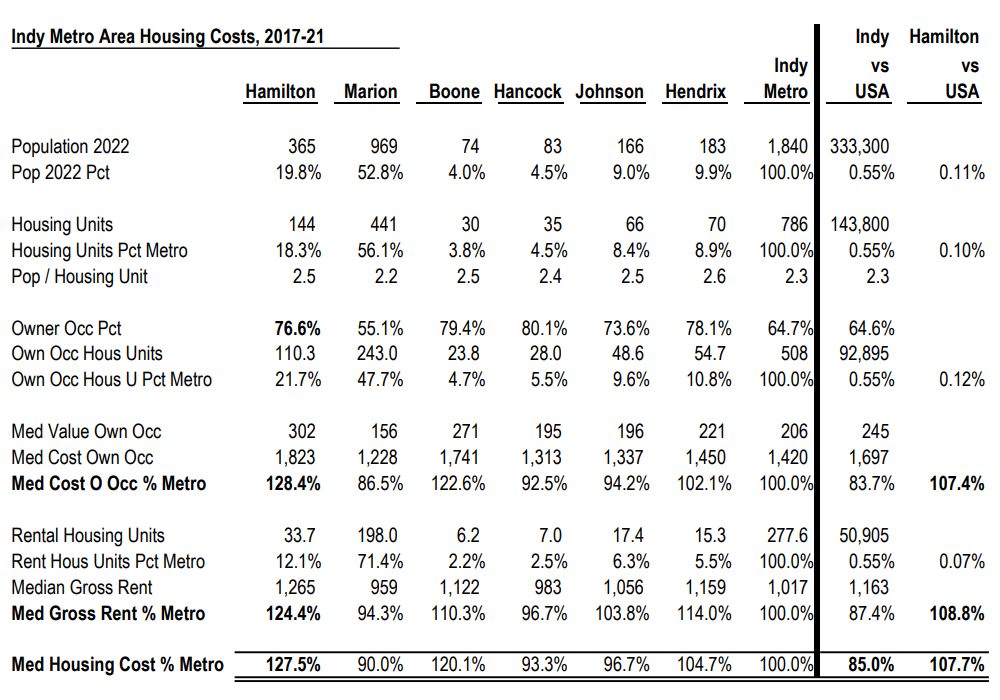
In general, Hamilton County’s costs are similar to those of the Indy metro area. It’s 357,000 residents account for just 17% (1 in 6) of the formal Indy metro area’s 2,075,000.
Solid county level data is not available for all areas, but limited comparisons helped to identify goods and services that might differ between Hamilton County and the Indy average.
Hamilton County’s housing is 8% more expensive than the national average rather than 15-17% lower as seen in metro Indianapolis. The housing stock is also newer, larger and higher quality. The full housing price difference would increase the total cost of living measure by 7%. Considering one-half being due to age/quality and one-half due to prices adds 3.5% to 93.1% to yield a revised 96.6% cost of living ratio.
Indiana local taxes average 9.3% of income versus 10.2% nationally. This 10% savings on a 10% cost factor reduces the overall cost of living measure back down to 95.6%. State sales and income taxes do not vary by county. Hamilton County’s property and income taxes are lower than its large population peer group in Indiana.
Food Prices
Historically, Indianapolis has been a competitive grocery market. Kroger has a leading market share. Cub Foods and Marsh have left the market, but Meijer’s, Trader Joe’s, Whole Foods, Fresh Thyme, Fresh Market and Market District now compete with the others.
Hamilton County’s retail sales per capita figure is 14% above the national average, despite the very high concentration of retail stores in Marion County along 82nd/86th Street. The county is well served by retailers of all kinds.
Food away from home makes up almost 5% of the consumer price index. No restaurant food index is publicly available. However, the Big Mac price in Hamilton County is $4.59 versus the $4.39 national average price, a 5% premium. If this applied to all restaurant prices, the overall cost of living index would be 0.3 higher, 95.9. The average Indiana Big Mac price was just $4.11.
The Economic Policy Institute provides “modest income” food prices that are 19% higher in Hamilton County than in Marion County. Given the proximity of the counties and the long-standing coverage of “food deserts” in Indianapolis contrasted with nearly none in Hamilton County, this indicator is suspect.
Hamilton County has 1.8 hospital beds compared with the national average of 1.9 and the Indiana average of 3.3. It has 1.5 primary care physicians versus 1.0 nationally and 1.3 in Indiana. 10% of Hamilton County households have medical bills in collections compared with 17% nationally and 19% in Indiana. Access to health care is adequate.
The Best Places website uses a simple index of a standard hospital bed night, a doctor’s visit and a dentist’s visit indicating that Hamilton County health care costs are equal to the national average (100).
A Rand Corporation study indicates that Indy metro hospital rates are 25% higher than the national average. This is driving Indiana statehouse political battles with claims and counterclaims. Professional services fees were 25% below the national average.
Although health care is as much as 18% of GDP in the US, the share in the consumer price index is only 5%. If Hamilton County consumer costs are the same as the nation, this would increase the cost-of-living index by 0.6 points to 96.5.
Utilities
Best Places pegs Hamilton County’s utility costs at 93 rather than 107.
Indiana natural gas prices are more than 20% below the 50 state median.
Local utilities are probably at least 10% lower than in the summary statistics, so the COL index should be reduced by 0.9 points based on their share of spending, reducing the index to 95.6.
Transportation
Indiana used car prices are the lowest in the nation, 11% below the average.
The Economic Policy Institute and Indiana Family and Social Services Administration indicate that Hamilton County childcare costs are 13% higher than in Marion. Because childcare accounts for just 0.6% of spending, no adjustment is indicated.
Summary: Hamilton County Costs are 4% Lower than the National Average
County level housing, health care and grocery costs added more than 4% while lower taxes and utility costs subtracted almost 2% for a final score of 95.6, more than 4% below the national average.
State and local taxes are mostly driven by the state. In Indiana, state sales and income taxes account for 63% of the total. Local taxes account for 37% of the total.
Indiana is a lower tax state. Various sources rank it 11th to 18th lowest, with a median ranking of 14th. Hoosiers pay 9.3% of their income for taxes.
Indiana’s 9.3% paid is a little higher than 10th rated Oklahoma’s 9.0% and a little less than 25th rated New Mexico’s 10.2%. It is significantly lower than 40th rated Utah’s 12.1%.
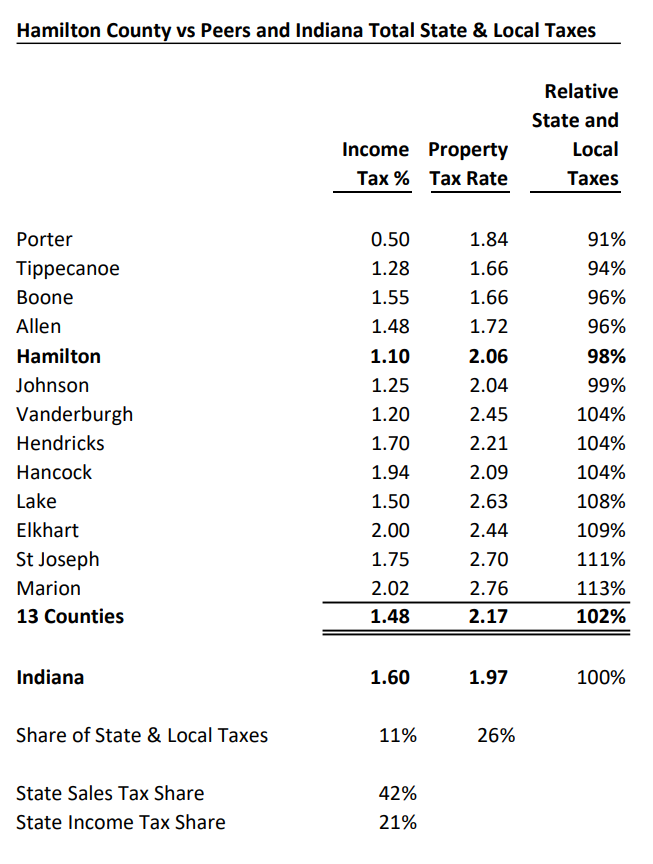
Hamilton County’s 1.1% income tax rate is the 12th lowest of 92 counties in Indiana, 31% lower than the average of 1.6%. The median is 1.75%. Its median property tax rate is 5% higher than the state average. The weighted average total state and local tax rate for Hamilton County is 2% lower than the state average. The Hamilton County total taxes paid as a percent of income is comparable to 12th ranked Louisiana and Florida at 9.1%.
Hamilton County has lower taxes compared with its Indiana peer counties, the top 10 in population plus Indy metro Johnson, Boone and Hancock counties. Its 1.1% income tax rate is lower than all except Porter County; significantly (26%) below the 1.48% average. Its median property tax rate is 5th lowest of the 13, 5% below the peer average. The peer counties’ total tax rate is 2% above the Indiana average. Hamilton County is 2% below the Indiana average.