One of the “control centers” at MISO Energy in Hamilton County.
Hamilton County’s unemployment rate has averaged 3.1% since 1990, a little more than one-half of the nation’s 5.8% average. The Indy metro area has averaged 4.6%. In the last decade, Hamilton County has still averaged 2.0% lower than the national average of 5.3%.
The US population has grown from 2.5 million in 1776 to 76.3 million in 1900 to 158.8 million in 1950 to 329.5 million in 2020. More than a 100-fold increase, 2+ orders of magnitude.
28 individual metro areas today EACH have a population (2020) equal to or greater than the WHOLE USA in 1776. Pittsburgh, Portland, San Antonio, Austin and Sacramento each have the same 2.5 million residents. Charlotte, Orlando, Baltimore and St. Louis each have a slightly greater 2.8 million citizens. 19 other metro areas today have a significantly larger population.
Declining Rural Population
The US began as 100% rural. By 1900, cities (2,500+) accounted for 40% of the total population. By 1950, city populations were the majority at 60%. In 2020, cities contained 80% of the US population.
Urbanization
In 1776, the US had 5 cities of 10,000 people, led by Philadelphia with 30,000.
By 1900 the nation had 11 major cities with a half-million people or more, led by New York with 5 million and Chicago, Philadelphia and Boston near 2 million. Baltimore on the east coast and San Francisco on the west coast were joined by the Midwest cities of Pittsburgh, St. Louis, Cleveland, Cincinnati and Buffalo to round out this group of early leaders. These 11 exceptions to the still largely rural landscape accounted for one-half of the urban population, 20% of the national population.
By 1950 there were 15 metro areas with a million people or more, up from just 5 in 1900. San Francisco, St. Louis, Cleveland, Baltimore and Buffalo exceeded 1 million as did newcomers to the major city list: Los Angeles (4.4M), Detroit (3.0M), DC, Seattle and Dallas-Ft. Worth. Kansas City, Minneapolis-St. Paul and Houston joined Cincinnati as “major cities” defined as greater than 750K residents. These 19 metro areas contained 50 million people, 31% of the nation’s total and a little more than half of all urban residents. Led by New York’s 13M, the east coast metros totaled 22 million people. Led by Chicago’s 5M, the Midwest metros were close behind with 18 million people. The 3 west coast cities combined for 8 million while the Sunbelt’s 3 cities amounted to just 2.5 million people.
For 2020, we use 2 million as the minimum size for a major metropolitan area. New York (20M), Los Angeles (12M) and Chicago (9M) led the way. Dallas-Fort Worth, Houston, Washington, DC, Philadelphia, Atlanta and Miami all had at least 5 million citizens. 15 new metro areas joined the list, beginning with 6 on the west coast: Phoenix, Riverside-San Bernardino, San Diego, Portland, Sacramento and Las Vegas. The others are widely distributed across the country: Tampa, Orlando, San Antonio, Austin, Columbus, Indianapolis, Charlotte, Nashville and Denver. These 35 metro areas account for nearly one-half of the country’s total population of 330 million. The 4 major regions were relatively evenly balanced: east coast (40M), Midwest (37M), west coast (45M) and sunbelt (43M).
One-half of Americans now live in one of the 35 major metropolitan areas, amounting to 162 million people. That compares with 50 million people in 19 areas in 1950 and 15 million people in 11 areas in 1900. The character of American life has shifted from rural to urban to metropolitan.
The White, non-Hispanic population has typically been 80-89% of the total. It has fallen rapidly to 58% as Hispanic, Asian and multi-race claimers have increased their shares of the population.
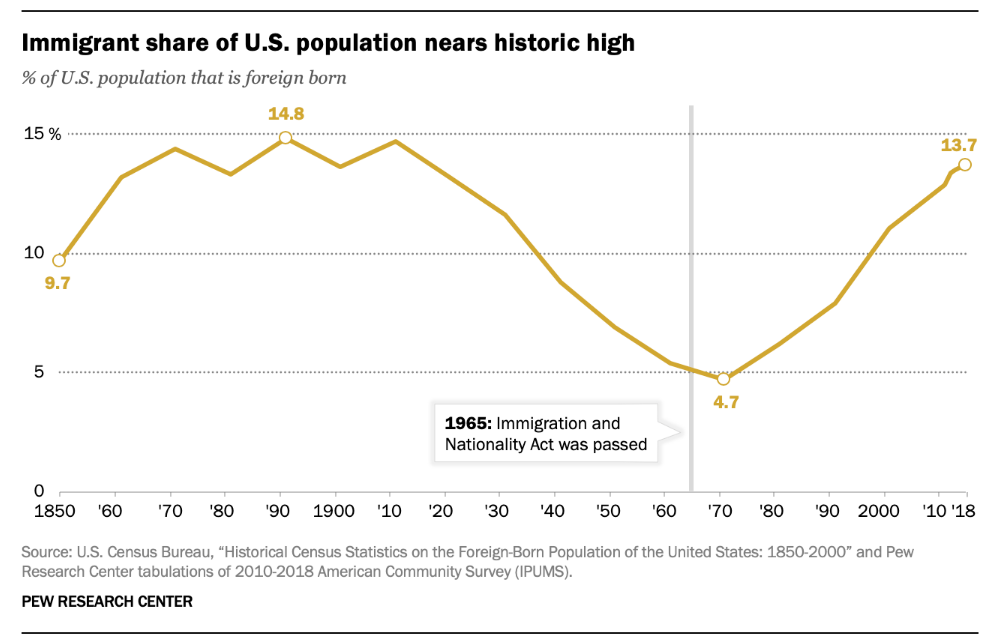
The share of immigrants reached a high of 15% from 1870-1910, dropped to 5% in 1960-1970 before reclimbing back to 15% recently.
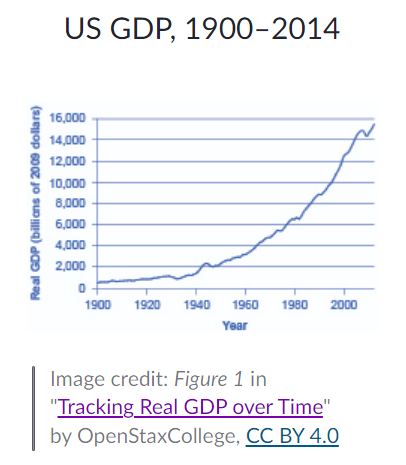
Amazing Real Economic Growth
The growth in the size of the US Gross Domestic Product (GDP), the value of goods and services produced in the country, from 1776 to today is essentially incomprehensible at 19,000 times its original size. The population has grown 132-fold, from 2.5M to 330M. Real, inflation-adjusted GDP per person has averaged 2.0% per year across long periods of time. Due to compounding, this 2% becomes 2.7 times in 50 years, 7.25 times in 100 years, 52.5 times in 200 years and 141 times in 250 years.
In 1955 the 11 corporations at the middle of the newly created Fortune 500 listing averaged $123 million of annual revenue. Adjusting for inflation (GDP deflator), they would have revenues of $939 million today. Comparable revenues in the latest Fortune 500 listing are $15.6 billion, a 16.6X increase.
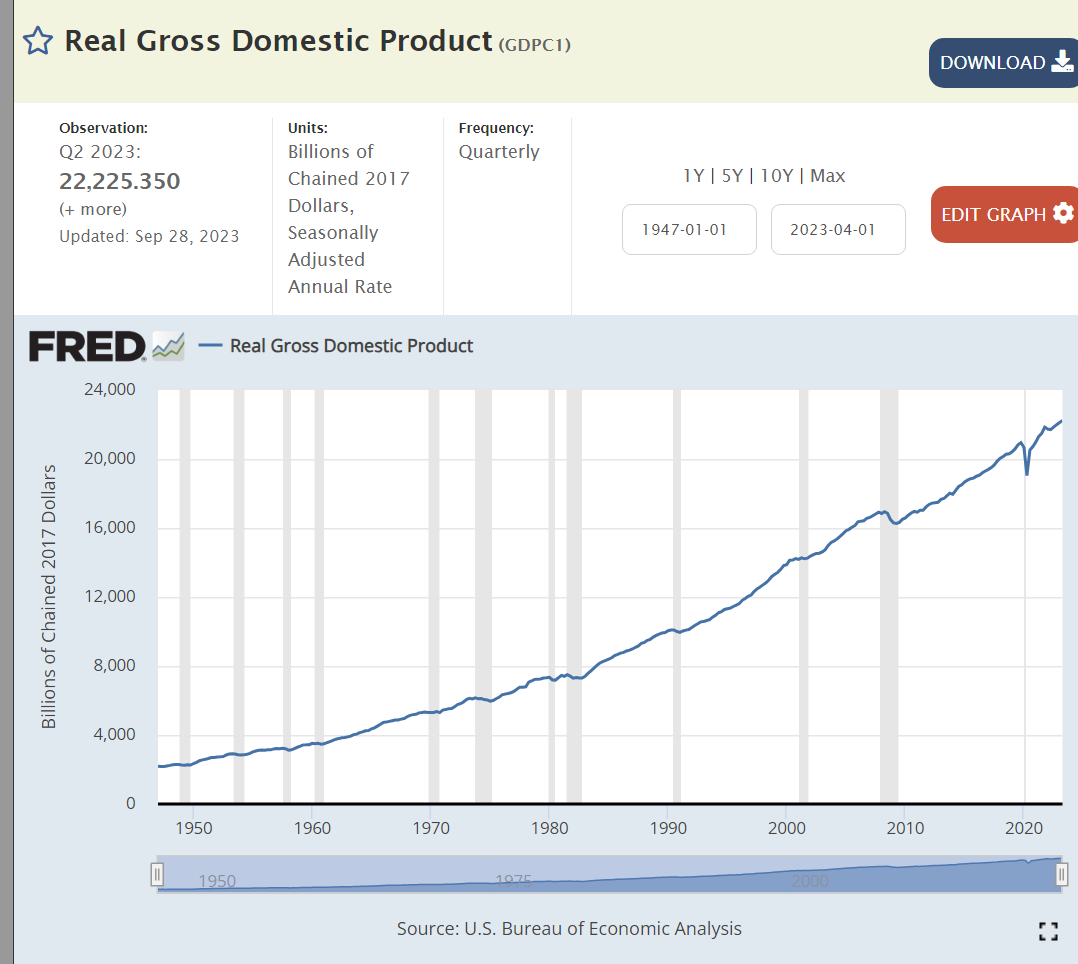
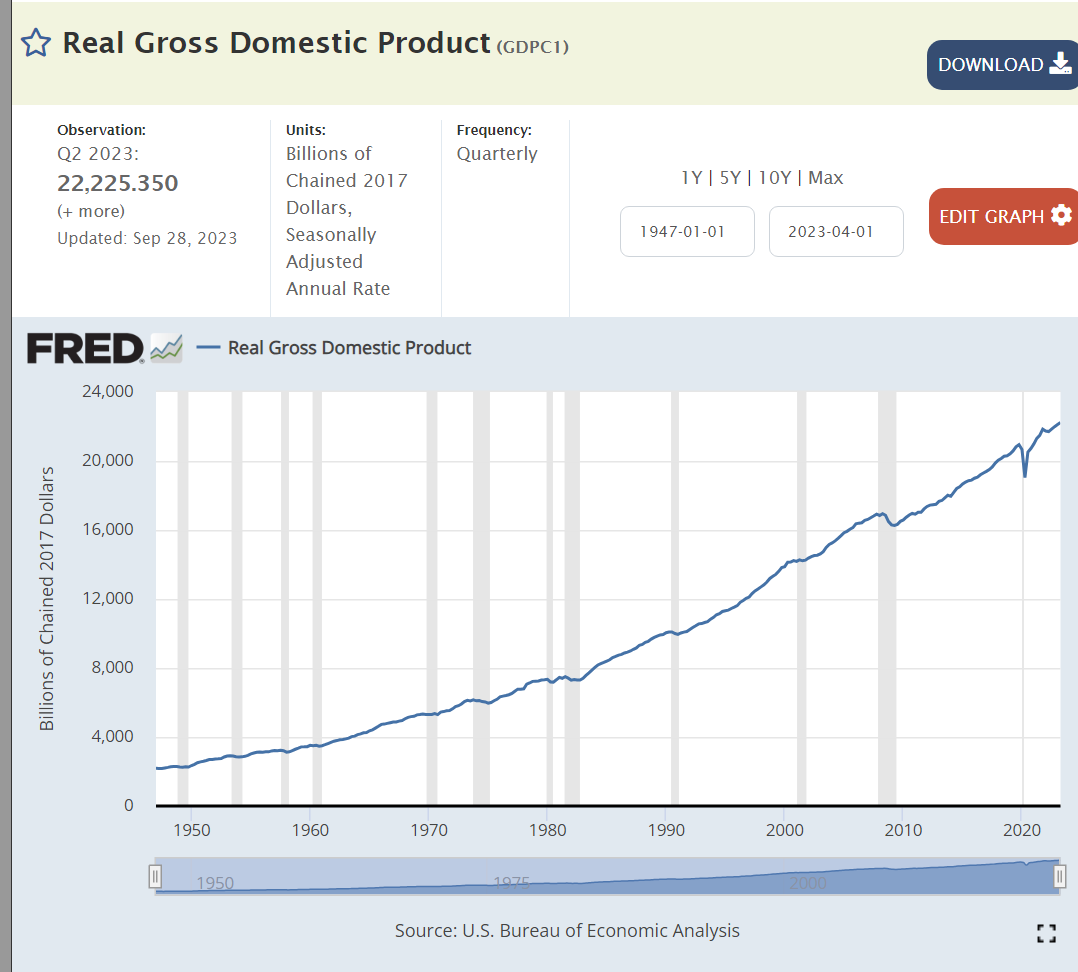
Over this same period total national real GDP has increased from $3.1 trillion to $21.8 trillion; 7.1 times as large. Large US-based corporations have grown twice as fast as real US GDP.
Summary
Small annual percentage changes add up to become transformations through time.
We see this in population, race, immigration, occupations, industries, urbanization, productivity, output and concentration of businesses.
The population and production scale, complexity, trade, product innovation and diversity of the US is beyond any expectations of the founders of the country. The country and its social, political and economic institutions have survived and adapted to allow the country to thrive for almost 250 years. Further adaptations may be needed to support such continued growth and success.
The United States’ political founders understood the nature of man and the risks of direct democracy (rule of the mob). They designed a system of “checks and balances” to ensure that a system of representative government would not aggregate power at the center or allow the whims of the majority or any minority to be served.
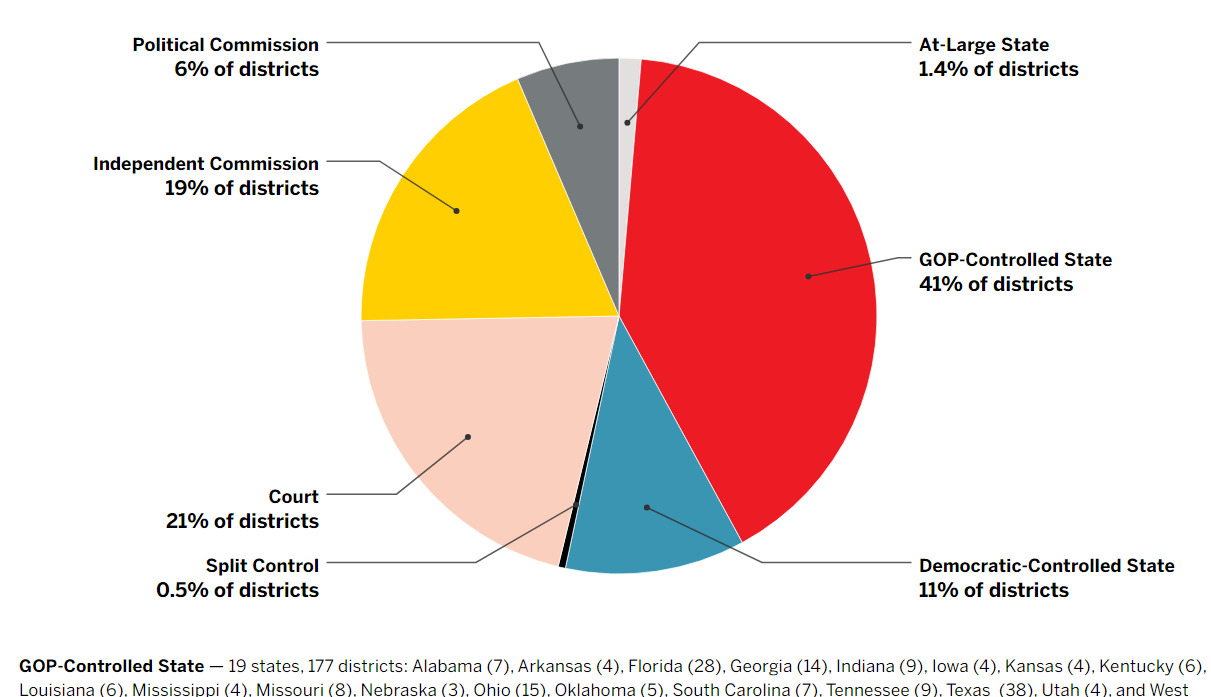
Yet today we live in a time where the “cult of individualism” rules. Senators are directly elected, not by state legislatures. National political candidates are chosen by popular vote in primaries, with limited political party filtering or influence. Earmarks are considered “dirty business”, so they cannot be used to influence the votes of individual legislators. Representatives and candidates create individual brands and raise funds independent of political parties. A majority of political districts at the state and national levels are gerrymandered to ensure that incumbents are re-elected without credible opponents in the general election. There are effectively no limits to political fundraising by individual candidates. Only a small share of highly motivated, largely extremist individuals vote in the primaries where most elections are won.
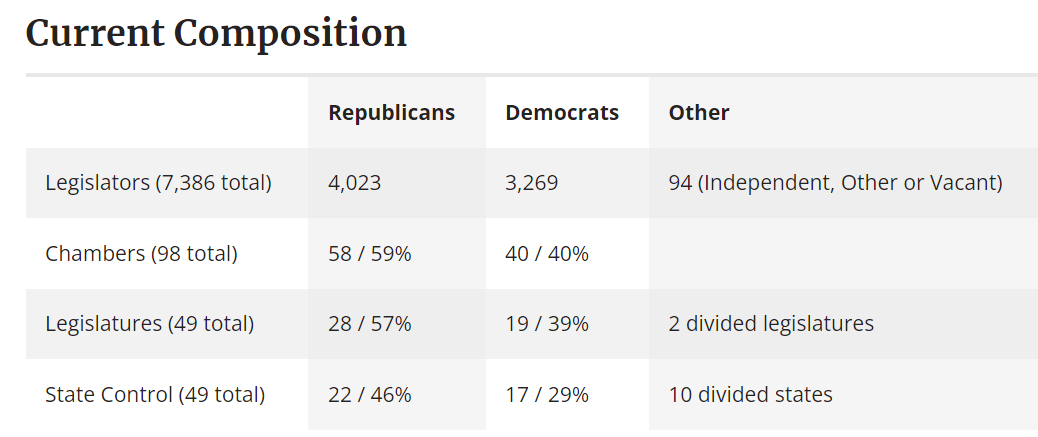
As a result, we have either partisan monopolies or polarized governments. Almost 80% of states endure one party rule.
The Senate Does Not Advocate for the Whole or the Center Today
The US Senate was intended to play the role of offsetting or delaying the demands of popular government in the House of Representatives. The House could propose and the cozy, experienced, independent Senate could “dispose” of legislation. In our current polarized system, with disproportionate representation to rural and Republican leaning states, the Senate is as politicized as the House. Bipartisanship is rare. Seeking the public good is rare. Fighting to win for your party is the only goal.
Any number of reforms could make the Senate more effective in serving its intended function. Campaign financing reform. More senators for very high population states. Increased rules and committee power for the minority party. A 60-vote filibuster rule with time limits.
A Solution: A Council of Advisors
Congress should create a “Council of Advisors” to advocate for the country as a whole, highlighting representatives and legislation that are supported by a significant majority of the country rather than by one political party or the other.
Former governors or US Senators could choose to run in a biannual referendum where they would be required to earn 60% of the popular vote in order to be appointed to a single 10-year term as an advisor, elder or guardian. The body would have a minimum of 10 and a maximum of 30 members. The body would be qualified to offer opinions only when each of the two major parties had at least one-third of the representatives.
The Council of Advisors would have two functions. First, it would consider whether Senators who are seeking re-election have “generally acted on behalf of the American public in a bipartisan fashion during their last term of office”. Senators who earned 60% of the vote of the Council of Advisors who be designated as “approved” by the Council. Others would not have this seal of approval.
Second, the Senate could refer any single bill to this body each month and seek its approval as “generally supported by the American people as a whole” on the basis of a 60% affirmative vote.
The Council would be a solely advisory body. It would be composed of individuals who were approved by the people as representing the country as a whole. It would have moral authority to make judgments about Senators and legislation. This moral authority would help to pressure both parties to produce legislation that serves the majority of the public and that is supported by the majority of the public. In essence, it would be a counterweight to the many pressures for polarization and “winner take all” politics that is practiced today.
I believe that we have unintentionally arrived at the current state of affairs where political pandering to the lowest common denominator drives our political decisions. There ARE important political judgments that cannot be compromised in the long run. But most of our political issues do NOT require a one side wins and the other side loses result. Our elected officials are intended to represent our views and to provide results. Political results that involve creative solutions, imperfect processes and administration (sausage making), negotiations and compromise. Every for profit and not-for-profit organization lives by these same rules. They have owners, customers, employees and stakeholders with competing claims. Yet, the organization’s leaders must produce acceptable results and be held accountable. We need to have these same expectations and processes for elected officials.
Just as a president or CEO is faced with the judgment of a board of directors, our US Senators need to have a Council of Advisors review their performance.
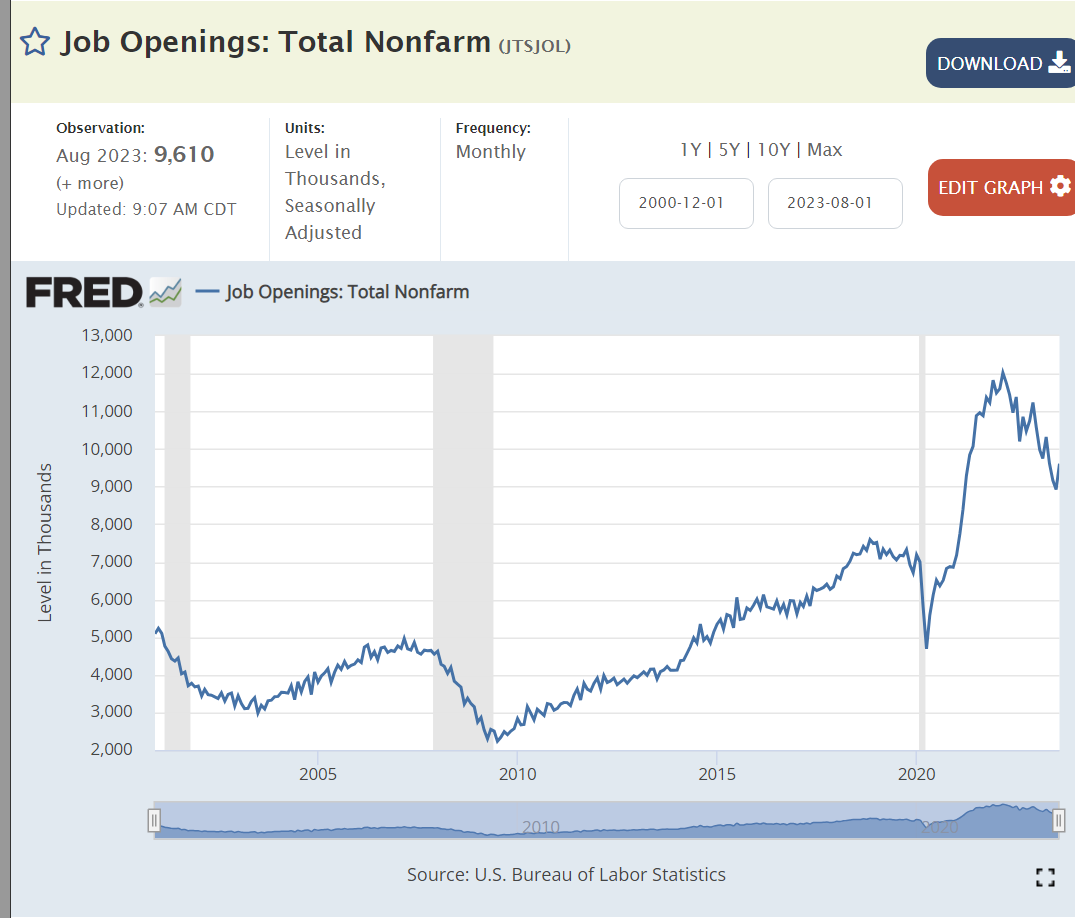
The stock market overreacted today. Job openings increased by 700,000 between July and August. Oh no! The labor market is too strong! Wages will increase! Cost-push inflation will build. The Fed will increase interest rates. We’ll be in recession soon! Boo!
Job openings are clearly falling. From an all-time high of 11.5 million to about 9.5 million in 18 months. With another 18 months of a “cooling” labor market, there will still be an historically high 8 million open positions in February, 2025. The labor market is slowly returning to “normal” after the Pandemic disruption.
This is a solid labor market, not an overheated labor market. Real wages finally grew during 2016-2020, by 7%. They spiked during the pandemic but have been flat for the last 18 months.
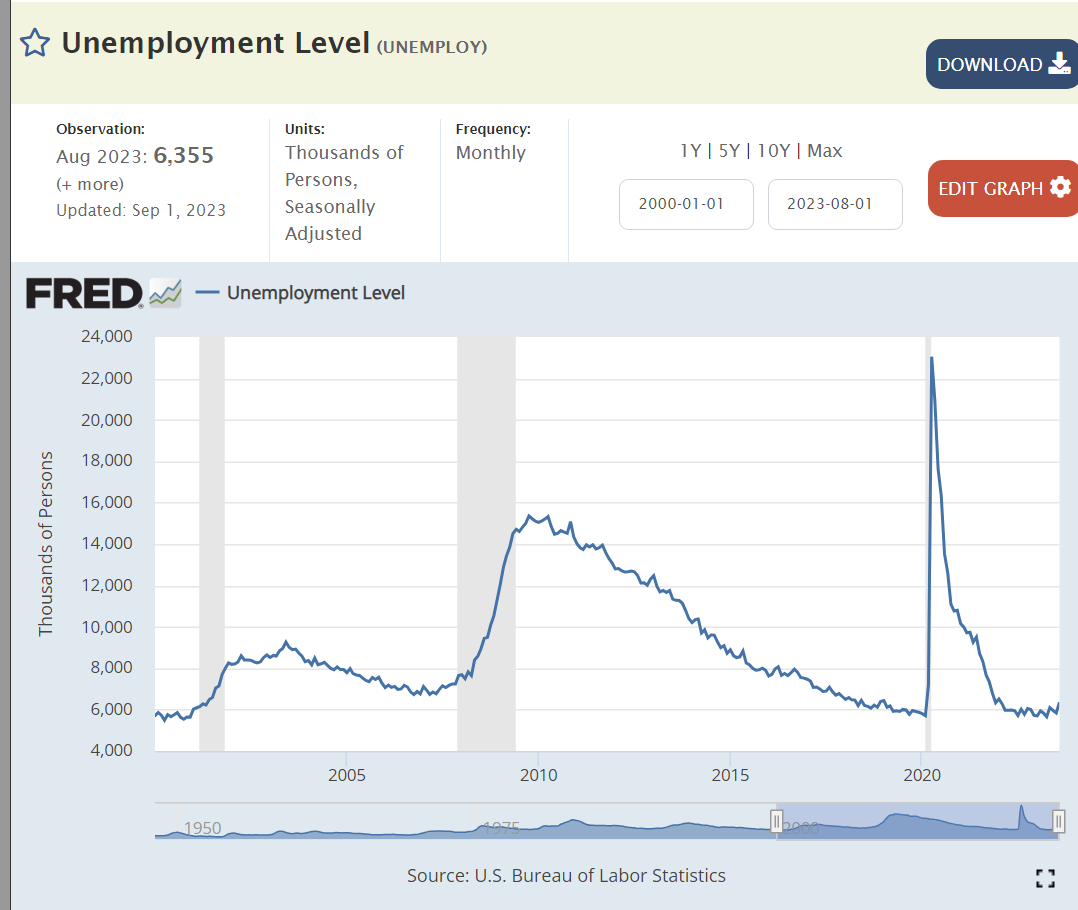
The number of unemployed people remains at 6 million, low by history, but not declining to unsustainable levels. 6 million is better than 8 or 15 or 23 million.
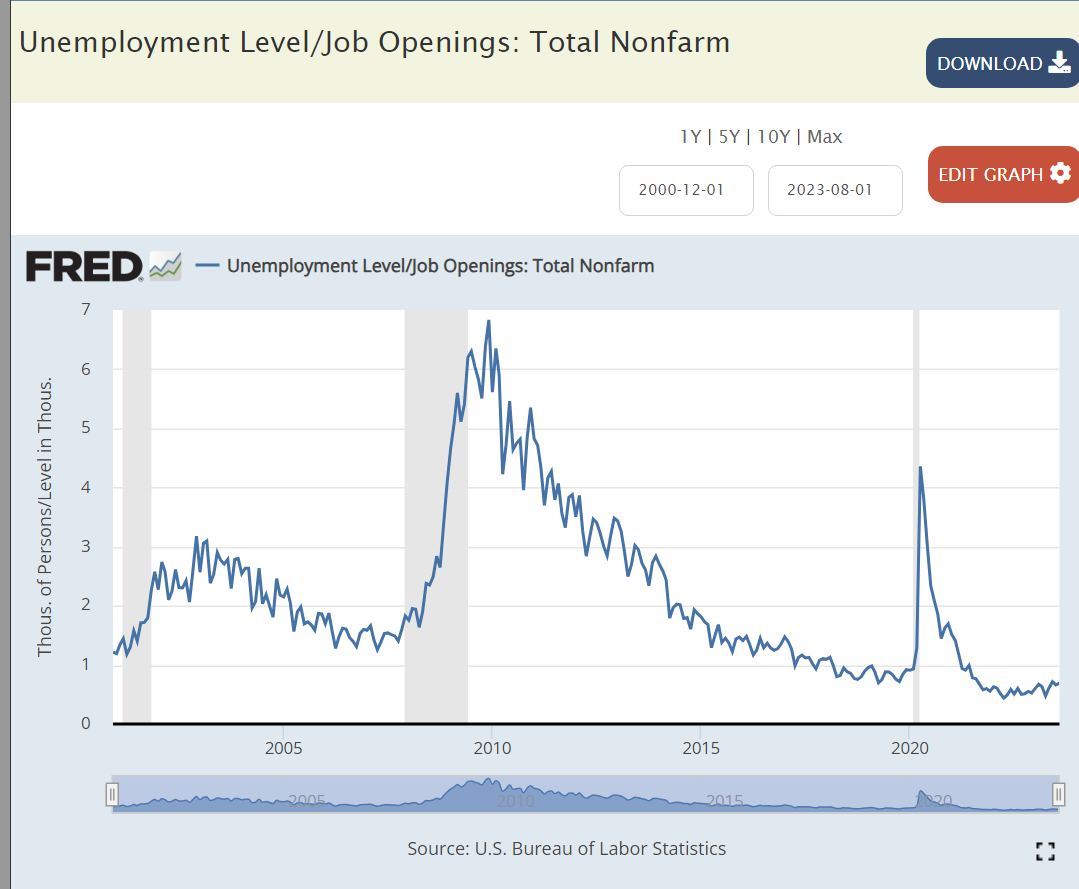
It’s a great time to be a job seeker, 3 jobs for every 2 job seekers. This is an historically positive ratio. It has been maintained for 2 years.
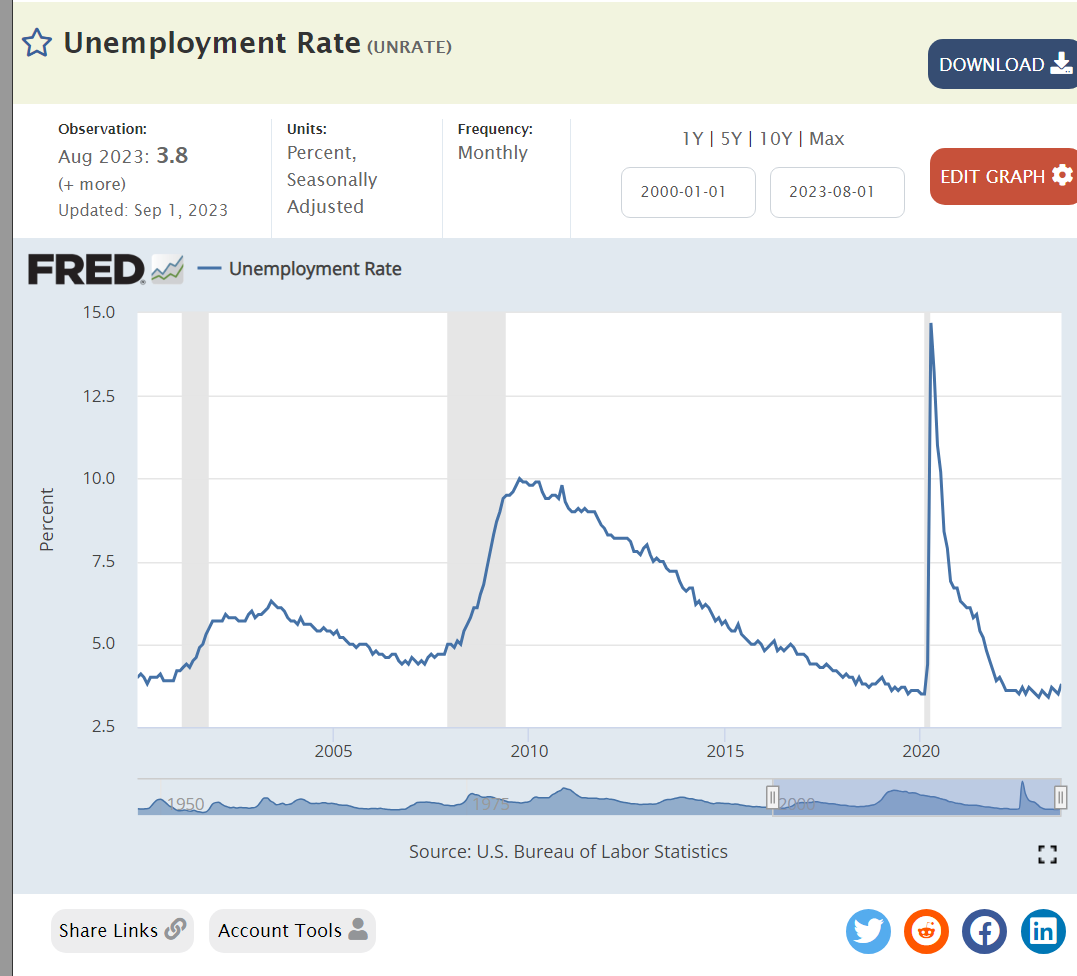
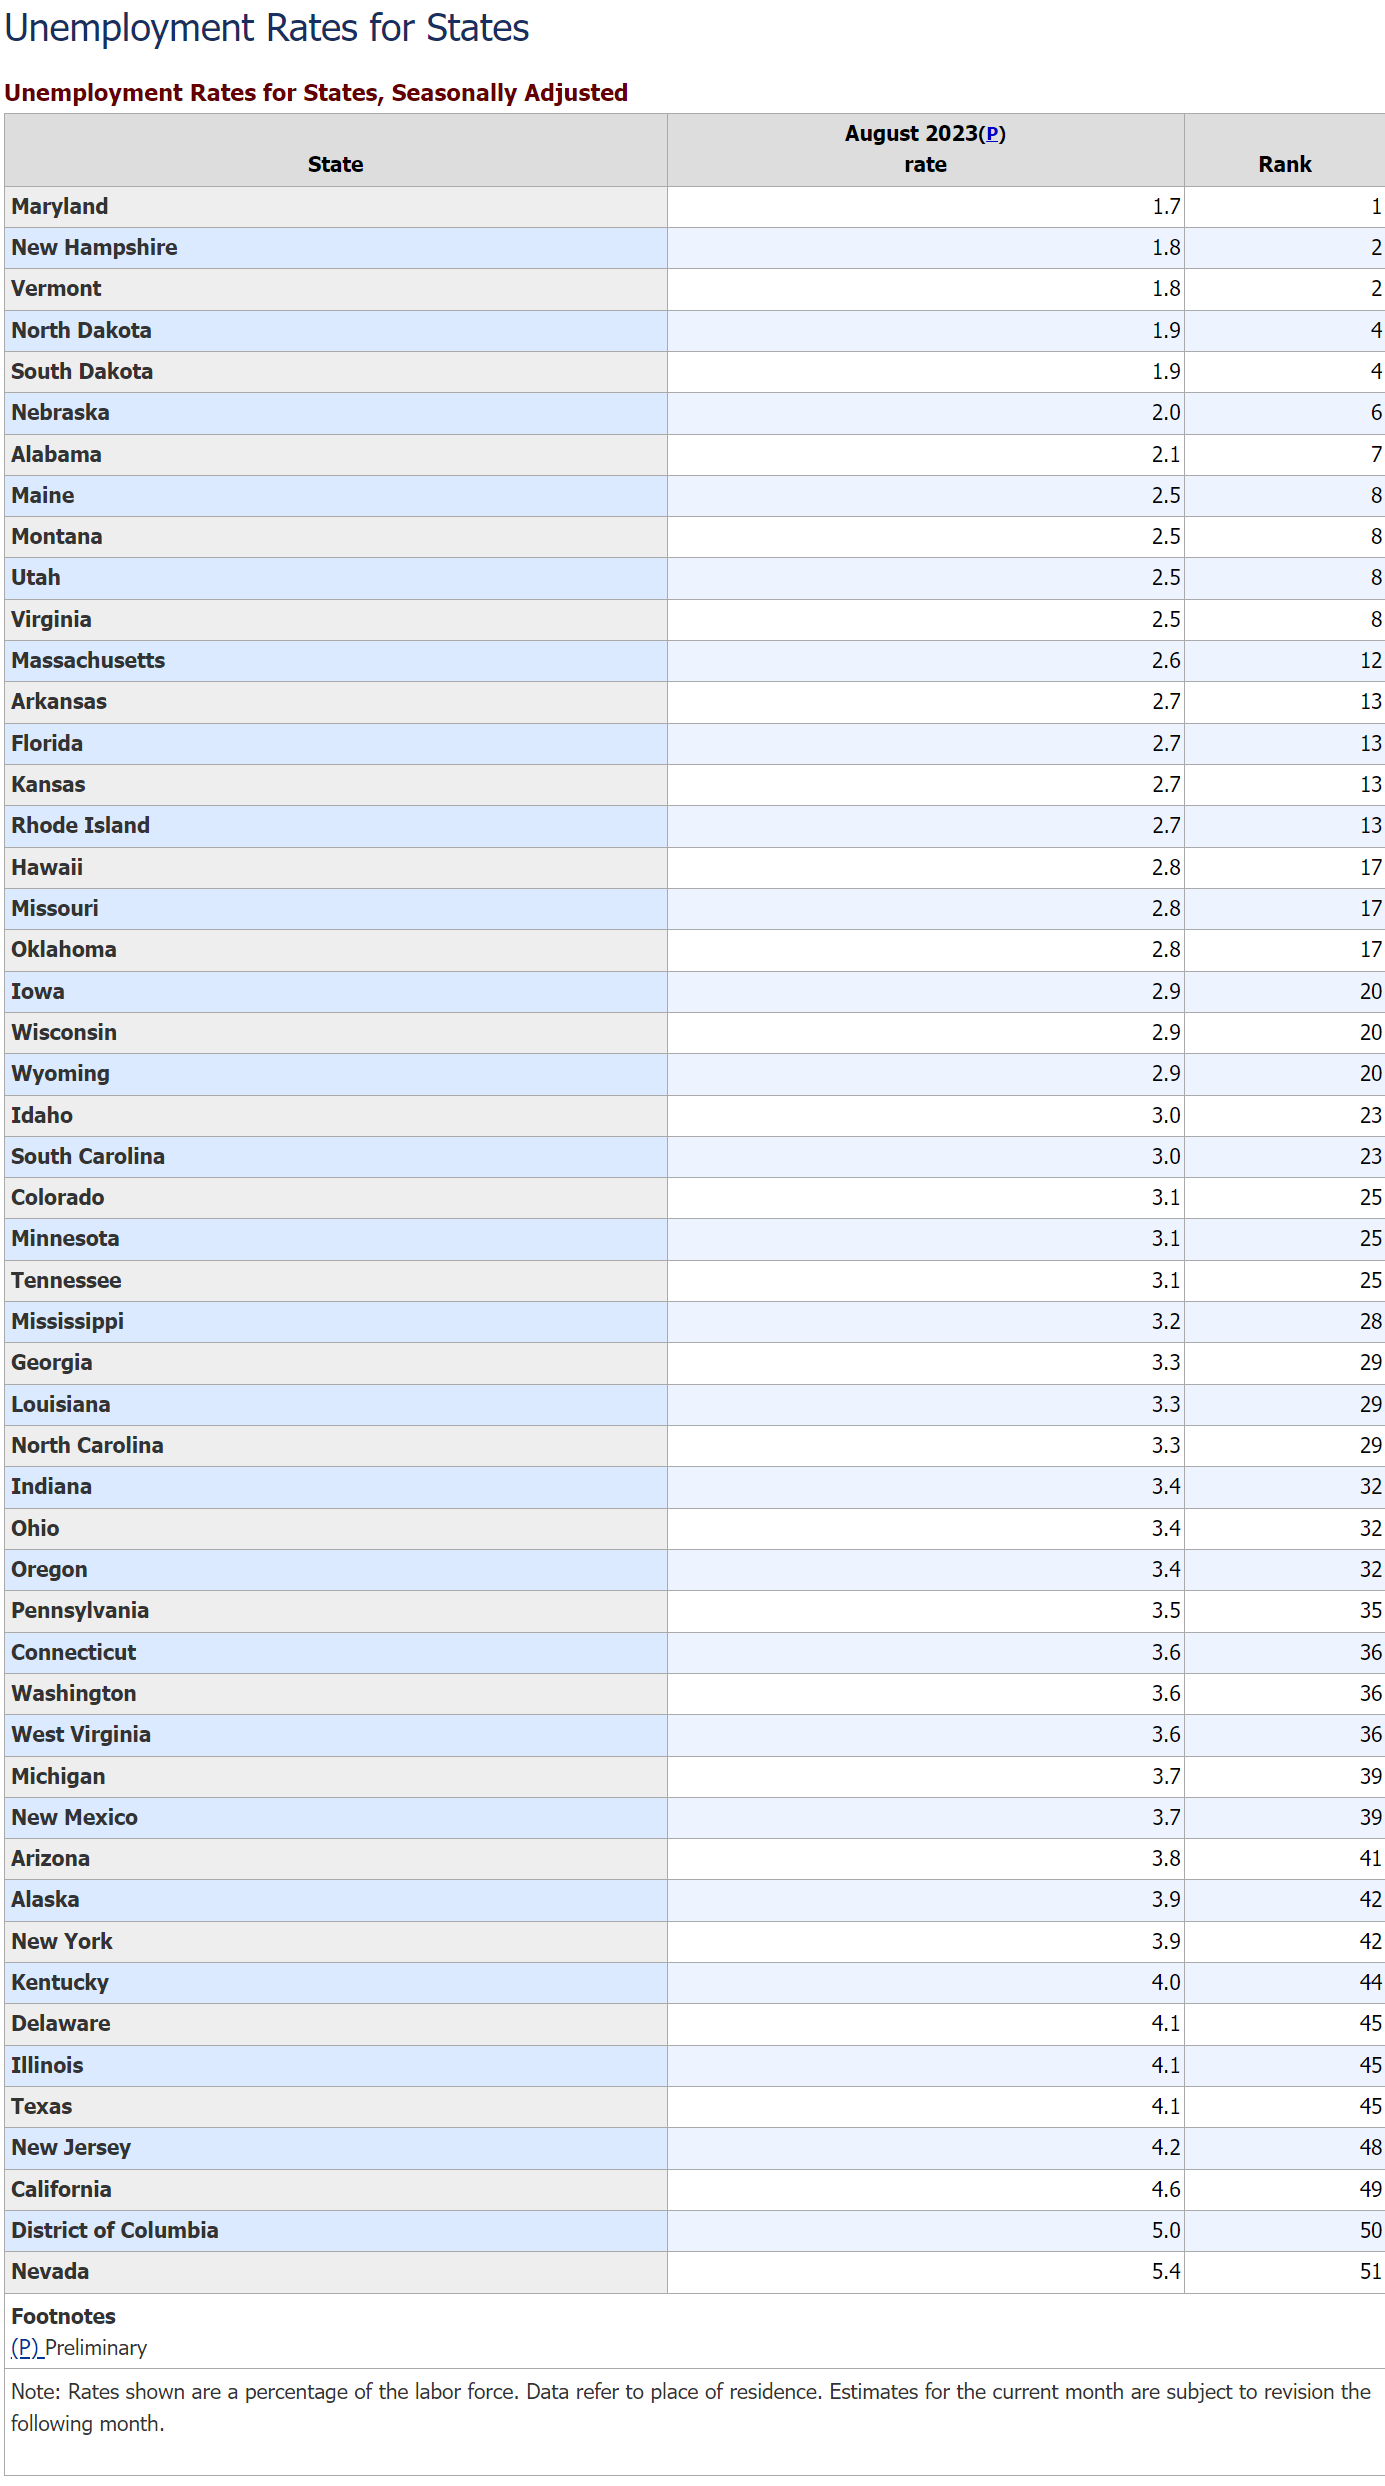
The unemployment rate remains at an historical low of 3.5% but is not falling.
Low unemployment is a widespread phenomenon. 22 states are below 3%. Only California, Nevada and DC are above 4.1%.
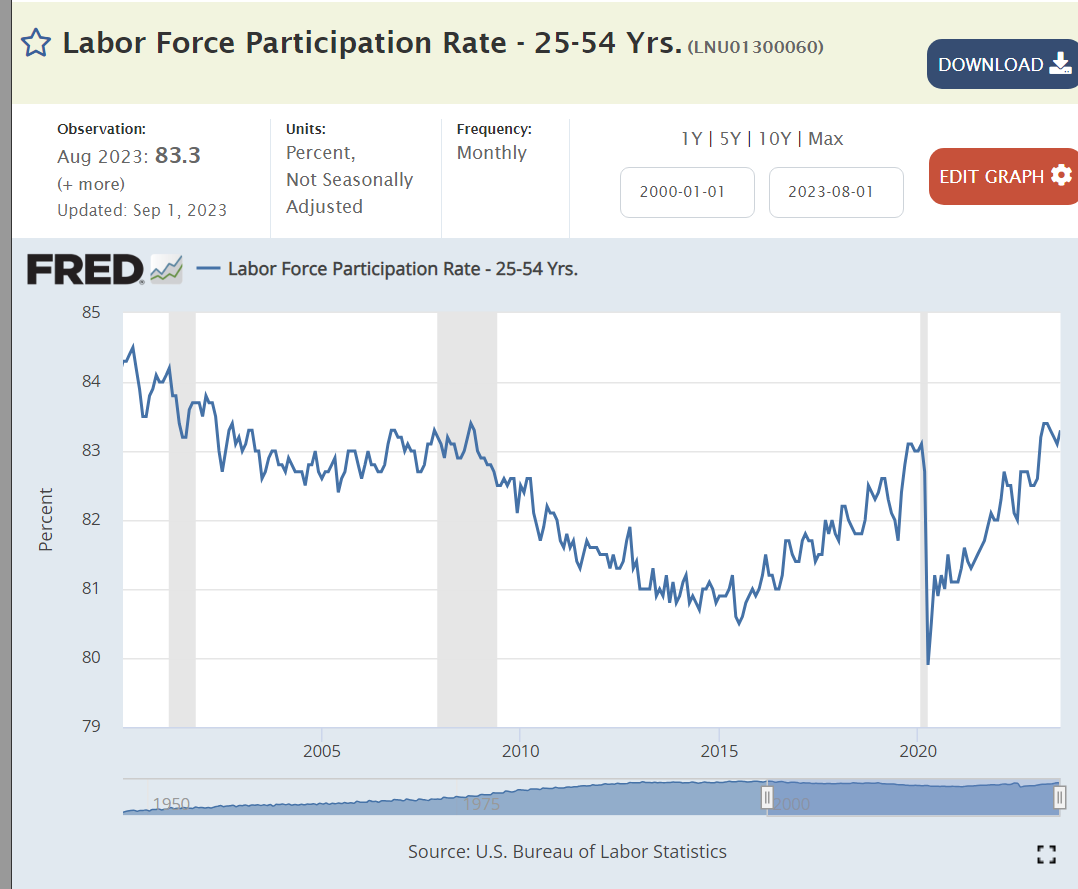
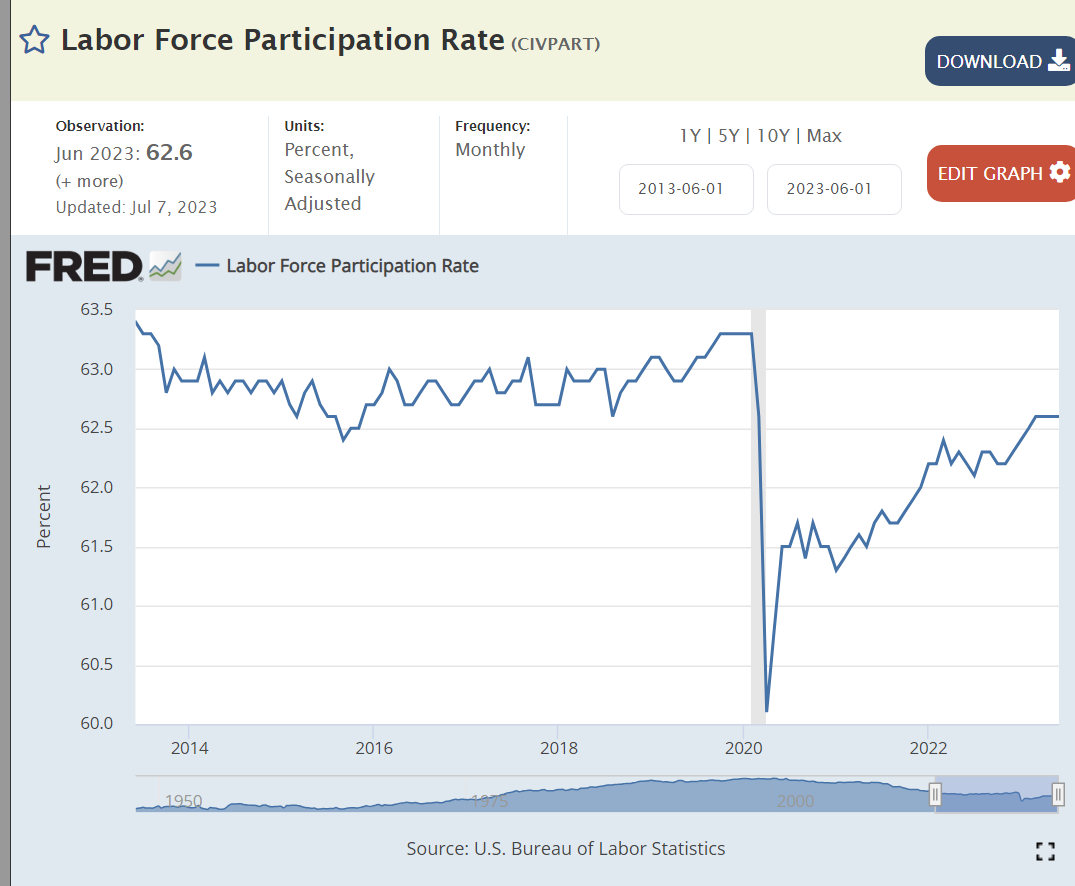
The labor force participation rate is at a 15 year high, with positive hiring and wage conditions attracting greater participation.
The quit rate remains above the pre-pandemic high, indicating that employees still see a positive labor market, but not an exploding market.
Total employment was flat for the first 11 years of the new millennium, parked at 132 million. Job growth accelerated for the next 8- and one-half years, adding a very solid 20 million new jobs. Post-pandemic, the economy has added another 4 million jobs.
Summary
This remains a Goldilocks labor market, neither too weak nor too strong. The Millennium pause, Great Recession and Pandemic have made us gun-shy. We don’t want to claim victory for fear of disturbing the labor market gods. But we are enjoying victory. 156 million employed versus 132 million employed a dozen years ago. An 18% increase.
The national average for municipal and state offices is reported at about 32%. Hamilton County elects 25% more women to office than the national average.
Indiana ranks below average on the somewhat inconsistent summary data available. In general, municipal elections are similar to state legislature results.
This source rates neighboring states as follows: Michigan 5th highest, Illinois 14th, Indiana 32nd, Ohio 43rd and Kentucky 47th.
Individual sources point to Indiana (27%), Ohio (29%), Kentucky (30%), Michigan (35%) and Illinois (41%) as the percentage of women office holders. Indiana is relatively low for the Midwest. Hamilton County is relatively high.
Although Democrats have begun to stand up candidates for more offices and have won a small number of races, Hamilton County remains a Republican oriented county. Congresswoman Spartz won 54% and 58% of the vote in her 2 congressional races. Governor Holcomb won 61% in his 2020 re-election victory. President Trump received 52% of the local vote in his losing 2020 effort. US Senator Todd Young won 54% of the vote in his 2022 re-election campaign.
For a Republican leaning county, Hamilton County has a greater than expected share of women office holders. In Congress, women are one-third of Democratic seats and just one-sixth of Republican seats.
Many notable officeholders have set the example for women in leadership in Hamilton County. Patricia Logan and Mary Sue Rowland led Noblesville from 1980-1991. Jane Reiman and Dorothy Hancock led Carmel from 1980-1995.
Hamilton County has been a Republican stalwart. Although women have been underrepresented by Republicans nationally, Hamilton County has elected many more Republican women to office than the overall national average.
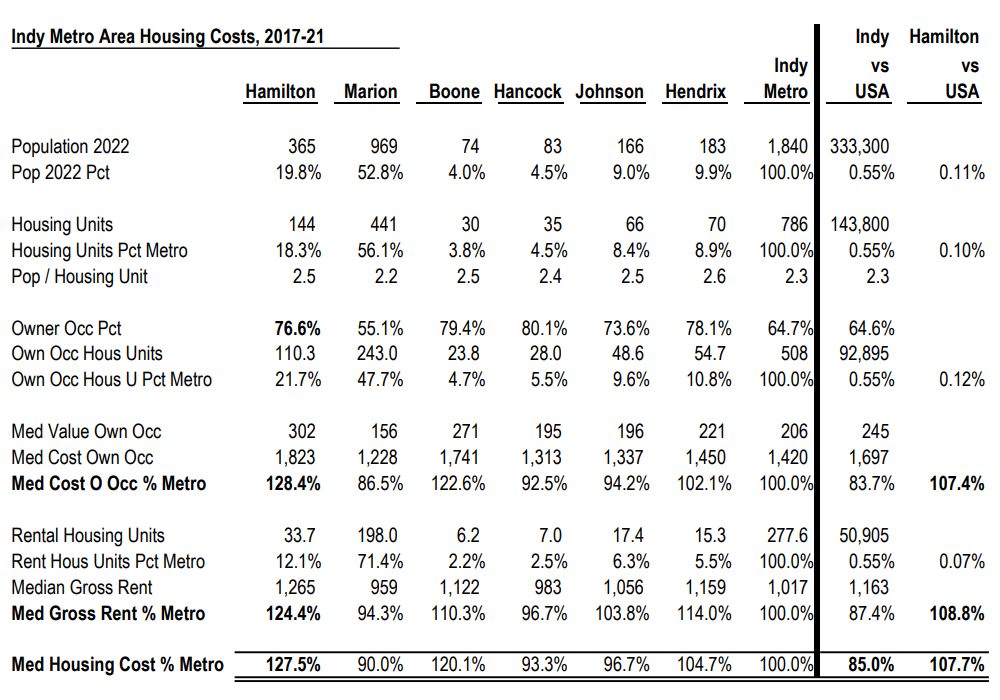
In general, Hamilton County’s costs are similar to those of the Indy metro area. It’s 357,000 residents account for just 17% (1 in 6) of the formal Indy metro area’s 2,075,000.
Solid county level data is not available for all areas, but limited comparisons helped to identify goods and services that might differ between Hamilton County and the Indy average.
Hamilton County’s housing is 8% more expensive than the national average rather than 15-17% lower as seen in metro Indianapolis. The housing stock is also newer, larger and higher quality. The full housing price difference would increase the total cost of living measure by 7%. Considering one-half being due to age/quality and one-half due to prices adds 3.5% to 93.1% to yield a revised 96.6% cost of living ratio.
Indiana local taxes average 9.3% of income versus 10.2% nationally. This 10% savings on a 10% cost factor reduces the overall cost of living measure back down to 95.6%. State sales and income taxes do not vary by county. Hamilton County’s property and income taxes are lower than its large population peer group in Indiana.
Food Prices
Historically, Indianapolis has been a competitive grocery market. Kroger has a leading market share. Cub Foods and Marsh have left the market, but Meijer’s, Trader Joe’s, Whole Foods, Fresh Thyme, Fresh Market and Market District now compete with the others.
Hamilton County’s retail sales per capita figure is 14% above the national average, despite the very high concentration of retail stores in Marion County along 82nd/86th Street. The county is well served by retailers of all kinds.
Food away from home makes up almost 5% of the consumer price index. No restaurant food index is publicly available. However, the Big Mac price in Hamilton County is $4.59 versus the $4.39 national average price, a 5% premium. If this applied to all restaurant prices, the overall cost of living index would be 0.3 higher, 95.9. The average Indiana Big Mac price was just $4.11.
The Economic Policy Institute provides “modest income” food prices that are 19% higher in Hamilton County than in Marion County. Given the proximity of the counties and the long-standing coverage of “food deserts” in Indianapolis contrasted with nearly none in Hamilton County, this indicator is suspect.
Hamilton County has 1.8 hospital beds compared with the national average of 1.9 and the Indiana average of 3.3. It has 1.5 primary care physicians versus 1.0 nationally and 1.3 in Indiana. 10% of Hamilton County households have medical bills in collections compared with 17% nationally and 19% in Indiana. Access to health care is adequate.
The Best Places website uses a simple index of a standard hospital bed night, a doctor’s visit and a dentist’s visit indicating that Hamilton County health care costs are equal to the national average (100).
A Rand Corporation study indicates that Indy metro hospital rates are 25% higher than the national average. This is driving Indiana statehouse political battles with claims and counterclaims. Professional services fees were 25% below the national average.
Although health care is as much as 18% of GDP in the US, the share in the consumer price index is only 5%. If Hamilton County consumer costs are the same as the nation, this would increase the cost-of-living index by 0.6 points to 96.5.
Utilities
Best Places pegs Hamilton County’s utility costs at 93 rather than 107.
Indiana natural gas prices are more than 20% below the 50 state median.
Local utilities are probably at least 10% lower than in the summary statistics, so the COL index should be reduced by 0.9 points based on their share of spending, reducing the index to 95.6.
Transportation
Indiana used car prices are the lowest in the nation, 11% below the average.
The Economic Policy Institute and Indiana Family and Social Services Administration indicate that Hamilton County childcare costs are 13% higher than in Marion. Because childcare accounts for just 0.6% of spending, no adjustment is indicated.
Summary: Hamilton County Costs are 4% Lower than the National Average
County level housing, health care and grocery costs added more than 4% while lower taxes and utility costs subtracted almost 2% for a final score of 95.6, more than 4% below the national average.
Kindly set Joe Biden aside. As of today, he is clearly most likely to be nominated.
Four others show up on the pundits’ “most likely” lists but will probably not be nominated. New Orleans’ mayor Mitch Landrieu is a career politician from a red state. Kamala Harris has not taken advantage of her VP post. Elizabeth Warren and Alexandria Ocasio-Cortez are too far left.
Like Joe Biden, Bernie Sanders, Michael Bloomberg and Jim Webb may have aged out of contention.
Robert Kennedy, Jr and John bel Edwards are too far right.
Sherrod Brown, Marianne Williamson, Phil Murphy and Tammy Baldwin are too far left.
Terry McAuliffe, Beto O’Rourke and Stacy Abrams have incurred political losses that require them to re-establish their bona fides.
Seven candidates floated “trial balloons” in 2016 or 2020 but failed to gain traction. They each need to define a “compelling reason” to return to the national spotlight. Michael Bennet and Jay Hickenlooper in Colorado. Martin O’Malley, Tom Steyer and Deval Patrick on the east coast. Jay Inslee on the west coast. Julian Castro in Texas.
Four candidates are branded with the liberal “red L” of Chicago or New York. Rahm Emmanuel and JB Pritzker. Kirstin Gillenbrand (perhaps unfairly) and Bill de Blasio. Tom Steyer and Michael Bloomberg are handicapped again.
I don’t see the national case for Gina Raimondo, Andrew Yang or Andy Bashear.
Mark Kelly, Josh Shapiro, Jared Polis and Wes Moore are relative newcomers to the national stage.
I present 4 “sleepers” who don’t have consensus national media support.
Booker, Buttigieg, Cooper, Klobuchar, Newsom and Whitmer are attractive presidential primary candidates for Democratic voters. Warner, Kaine, Hassan and Warnock could also become realistic candidates.
McAuliffe, O’Rourke, Abrams, Bennet, Hickenlooper, O’Malley, Steyer, Patrick, Inslee and Castro have political assets that could be appeal on the national primary stage.
Breaking away from the pack is difficult today. Ironically, the larger-than-life dimensions of Trump and Biden may prepare the way for competitive future primaries between relatively equal candidates.
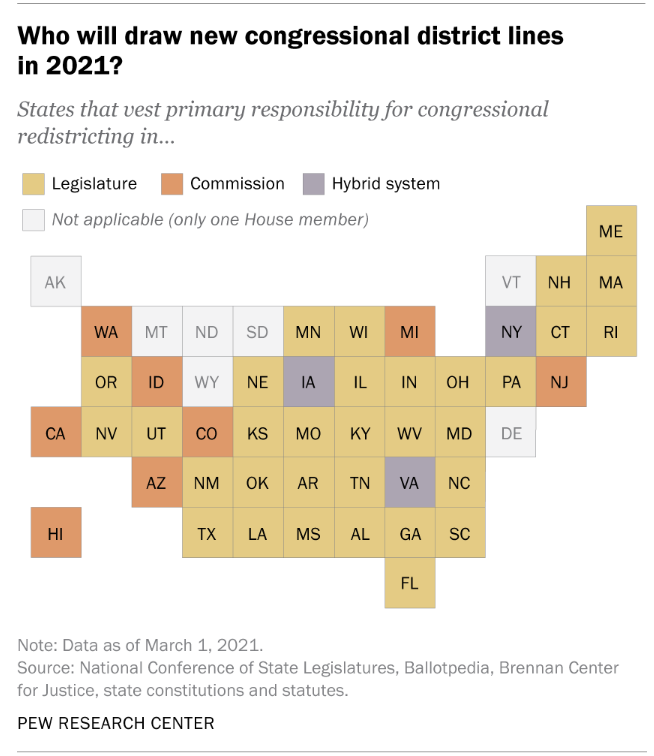
For most of the 20th century, states outside of the “Solid South” had a competitive two-party system and mixed party results for the three bodies of government. In President Obama’s first midterm election in 2010, Republicans added ten new state trifectas, managing all 3 elected branches of government. Democrats have fought back, increasing their count of trifectas in the last 5 years. Political analysts assert that this increased clustering of results at the state level is due to the increased polarization of the electorate and the “nationalization” of political issues at the state level. Proponents of a federalist delegation of powers to the state level hope that this will result in greater experimentation in state policy results and tests of the effectiveness of those partisan policies.
State level trifectas allow political parties to implement policies that they prefer, without regard to the opinions of the opposition. They also allow ruling parties to pass laws that signal their support for their constituents’ political preferences. They can deliver on their election promises. Many of these laws address partisan or “wedge” issues: abortion, gun control, marijuana, unions, wages, health care, education, the environment and infrastructure.
Democrats have a small advantage in the number of people represented by trifecta governments.
2022 Election Helped Democrats
The 2022 election was better than expected for Democrats. They were especially pleased to achieve trifecta status in Maryland, Massachusetts, Michigan and Minnesota (what are the M odds?).
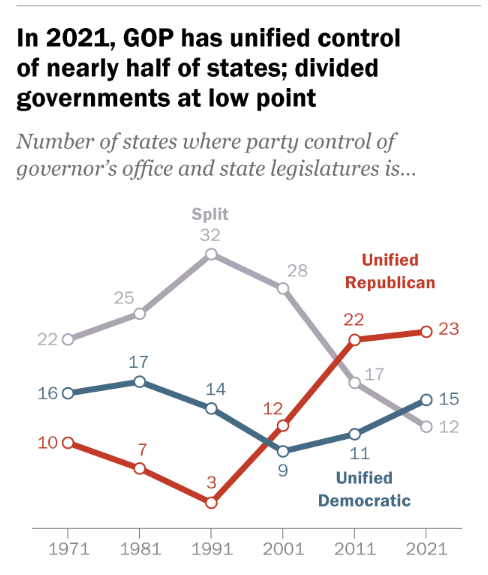
During the 1970’s and 1980’s, Democrats held 15 trifectas, mostly in the South, while Republicans held a little more than 5. In the 1994 midterm election during Bill Clinton’s first term, Republicans won handily at the national, state and local levels. Democrats lost 10 trifectas which they would not recover until 2008. Republicans added a dozen trifectas and led the Democrats by 16-8 for most of the next decade.
In George Bush, Sr.’s second mid-term election in 2006, Democrats recovered most of their losses at the state level, gaining a 15-10 lead in trifectas.
The Republican gains during Obama’s first midterm election in 2010 were historic, creating a 23-11 Republican lead in trifectas and setting patterns of state control that have largely continued since. Analysts pointed to the economy, health care, the tea party, immigration, race, scandals and Republican election investments at the state level.
Ballotopedia provides year by year trifecta data which allows us to show how the Republican party has built and maintained its dominance in the last 25 years and how the Democratic party has shown signs of strength in the last 5 years.
Republican State Trifectas Maintained Since Year …
1995- Utah, Idaho, North Dakota and South Dakota
1999- Nebraska and Florida (except 2010)
2003-5 – South Carolina, Georgia and Texas (9 cumulative)
The Republicans got started earlier and were more effective at “locking down” states, but the left versus right political alignment in the country has allowed Democrats to partially “catch up” recently.
The two parties have a similar number of states at risk of losing their trifecta status. Montana, New Hampshire and Arizona for the Republicans (3). Maryland, Massachusetts, Michigan and Minnesota for the Democrats (4). Based on history and trends, Democrats (2) hope to see Nevada and Vermont join their trifecta team. Republicans (5) have even more candidates in Kansas, Louisiana, Kentucky, Wisconsin and North Carolina.
Summary
39 of 50 state governments are controlled by a single party. This pattern is likely to continue. States are using this power to shape election rules and ensured continued local political party control and are making policy choices that make the differences between red and blue states more distinct.
A “centrist” organization he supports is actively working to be on the presidential ballot in all 50 states in 2024. “No Labels” has defined “centrist” political positions. It says that Democrats and Republicans have abandoned the center. It considers the Democrats and Joe Biden as extremists. It also considers the Republicans and Donald Trump as extremists and claims that it will withdraw its candidates if polling indicates that it will lead to a Trump election in 2024. It has not chosen presidential and vice-presidential candidates. Rumored candidates include Joe Manchin, Jon Huntsman, Kyrsten Sinema, Larry Hagan and Mark Cuban.
Trump and Biden are considered unattractive candidates by many due to their age and baggage. 60% of Americans hope that Trump will not run again and 70% hope that Biden will not run again. Yet, they appear to lead their parties for the nomination. One might think that now is the best time for a 3rd party candidate.
The Democrats, centrists and political analysts are all coming out against the “No Labels” third party. The congressional “problem solvers caucus” is opposed. “No Labels” co-founder Bill Galston has removed his support. The “Third Way” has blasted the movement. The “Lincoln Project” is opposed. Democrats see this as a way to elect Trump.
They argue that 3rd party candidates in the US have always failed to actually win any states since Wallace’s 1968 run. Even Ross Perot won no states. They mostly attract voters away from the incumbent party as in 68, 80, 92, 00 and 16.
Analysts (and Democrats) emphasize that true centrist, independents are less than 10% of the electorate. While self-identified “independents” are now more than 30% or the electorate, most strongly lean towards one party or the other. So-called moderates are 20-25% of the voting population. “No labels” has outlined an electoral college map in which a centrist candidate could be elected. Critics consider it wildly optimistic, with a centrist candidate winning Hawaii, Maryland, Massachusetts and Utah.
Democrats perceive this as a threat and are actively trying to undermine “No Labels” party registration.
538 argues that Democrats and Republicans are very comfortable with Biden and Trump as their candidates for 2024. Left and right leaning “independents” have similar views.
David Brooks welcomed “No Labels” in the NYTimes and then reversed his view.
The US has run a two-party system for hundreds of years. Polarization has increased. The two parties have adopted divergent policy positions. Nonetheless, there is not a clear path for a newly formed centrist party to consolidate disaffected Democrats, Republicans and moderates to win a presidential election. It may require some sort of discontinuity (another coup attempt) to prompt Americans to consider a revolutionary party with a radically nonpartisan bent to revise our political structure, supporting the existing “checks and balances” structure, making elections fairer, reducing the influence of funding sources, helping political parties to force candidates to the center, and inserting filtering mechanisms to prevent extremist politicians.
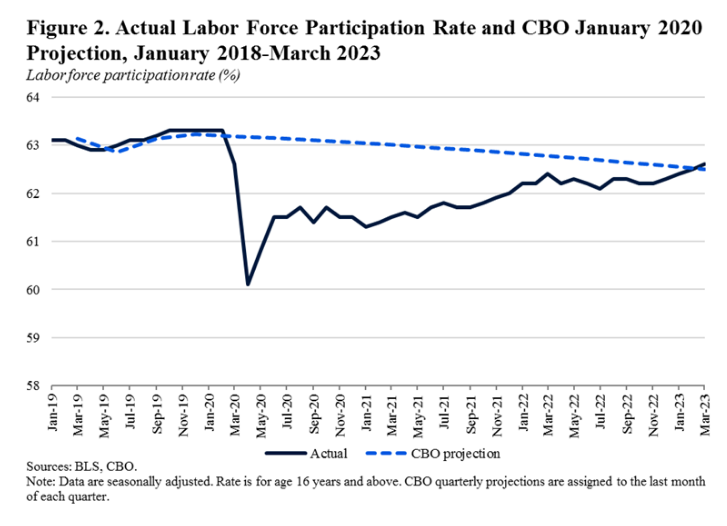
Overall labor force participation rate dropped by 1.5% in the pandemic and has recovered by 1%, still 0.5% below the recent history. However, the prime age category and several market segments no meet or exceed their pre-pandemic levels. Many details to consider.
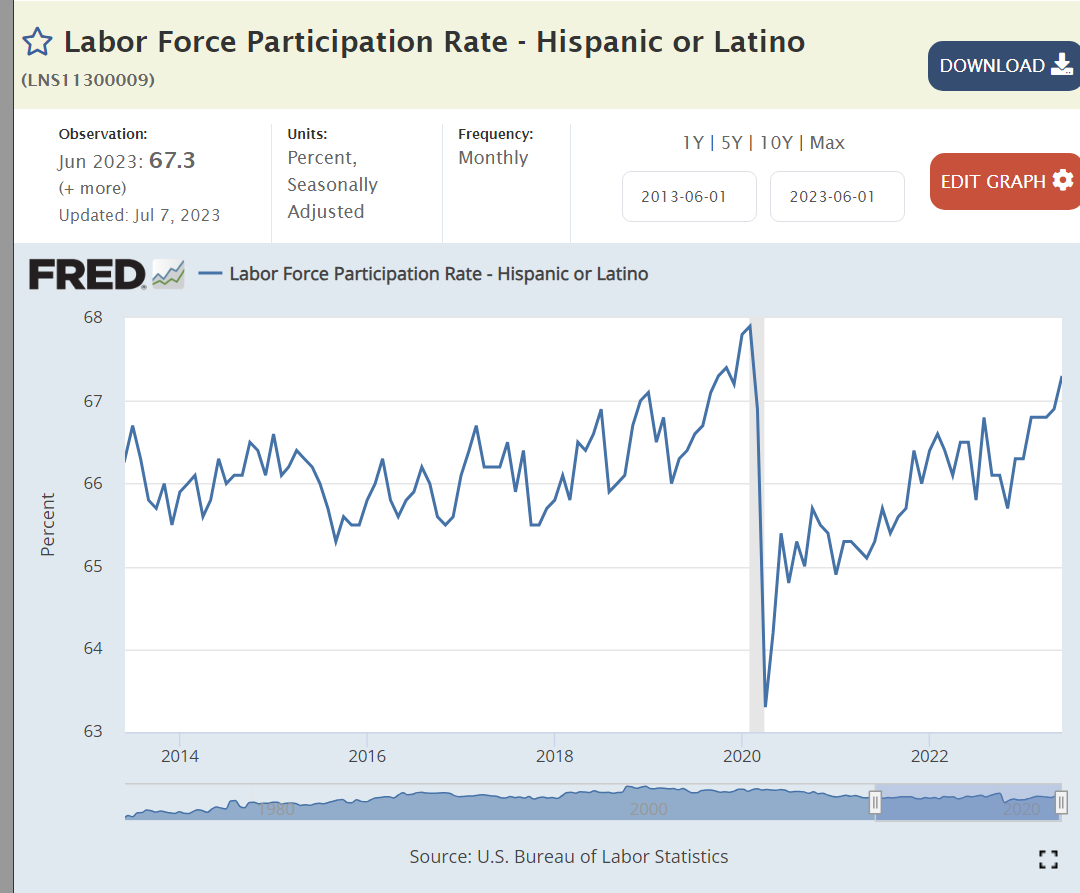
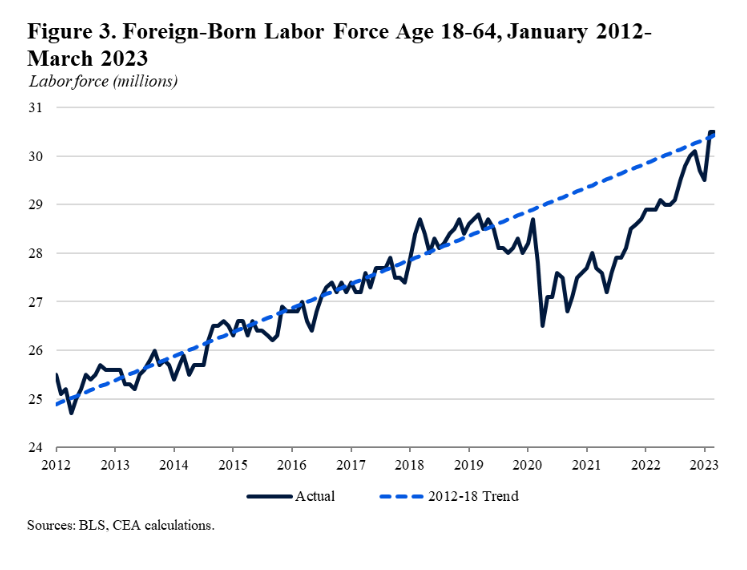
Hispanic participation is now 1% higher than the 2018-19 average before the pandemic.
The Asian participation rate is up 1%.
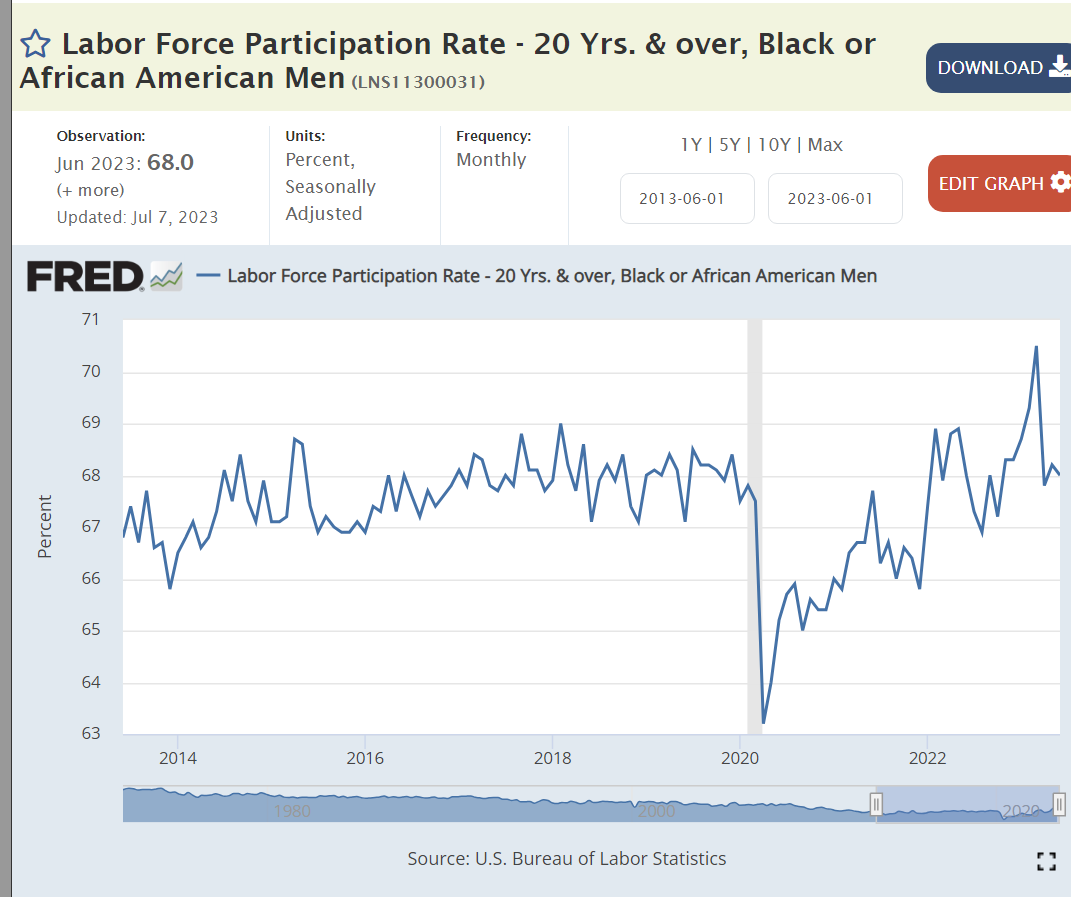
The Black participation rate is up 0.5%.
The White participation rate dropped by 1.5% and has recovered by half: 0.75% better but 0.75% below history.
The Women’s participation rate has essentially recovered to the 2018-19 average but is a half point lower than the peak levels seen just before the pandemic.
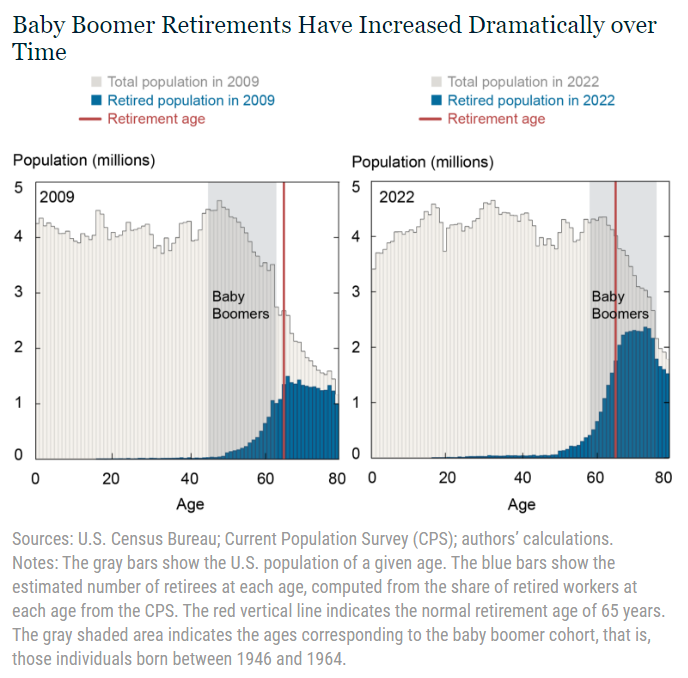
The male participation rate dropped by 1.5% but has only recovered by 0.5%, a major 1% below pre-pandemic times. Part of this is due to the long-term downward trend. Part of this is a “mix variance” driven by the very high number of “baby boomers” moving into normal retirement age or retiring early.
Black men are back to their pre-pandemic participation rate.
Black women are more active labor force participants.
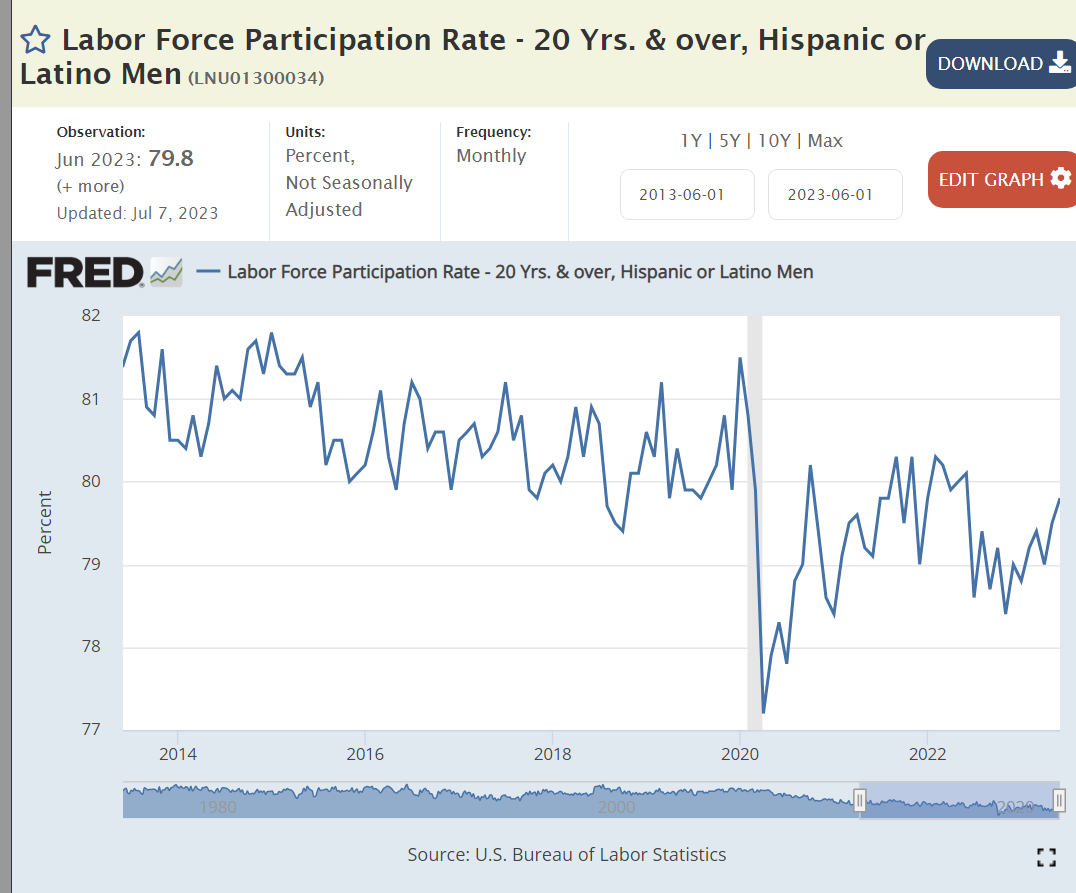
Hispanic men remain 1% below their pre-pandemic labor force participation rate.
Latino women have recovered to their historically high 61% participation ratio.
The White male participation rate dropped by 2% and has not recovered. Again, part is due to the long-run downward trend. Part is the aging of baby boomers into retirement. The remainder appears to be a response to the pandemic experience. “I’m not working unless you make it worth my while.”
White women remain a little below their 2018-19 average and three-quarters of a point behind their pre-pandemic peak level.
Teenage work participation has increased by 1.5% as entry level wages have risen.
College grad age participation rate has mostly recovered but remains 1% below the pre-pandemic high.
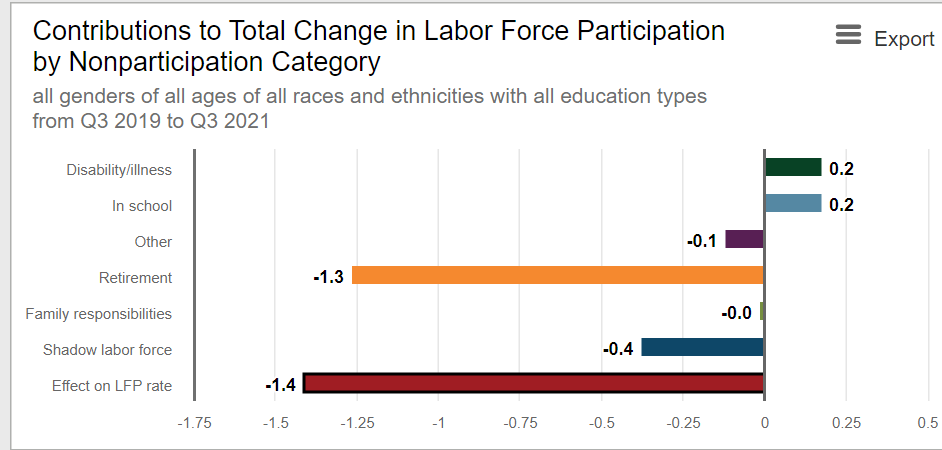
The retirement age workforce reduced its participation rate by 1.5% and has stayed there after a brief pseudo-recovery.
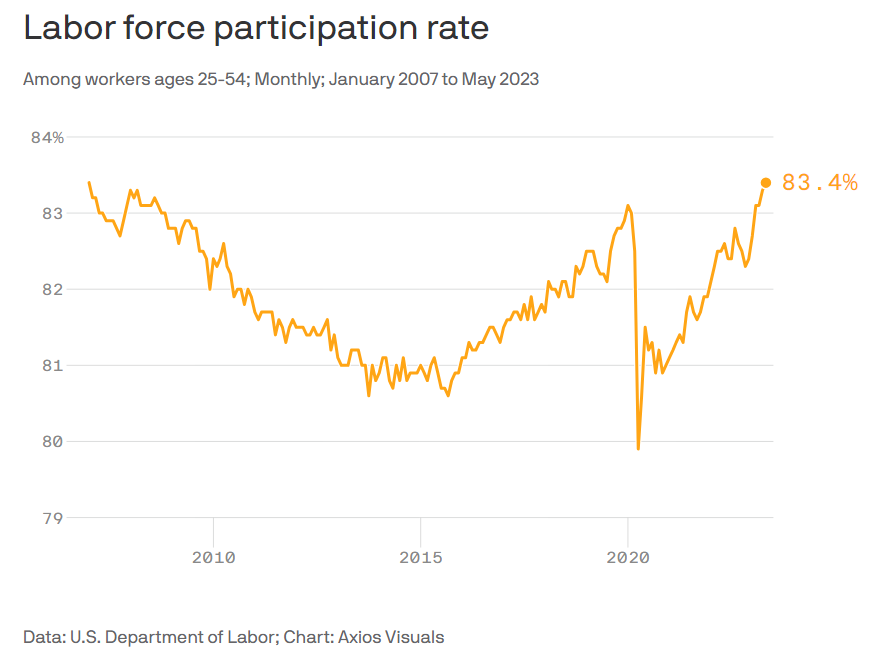
The prime age work force is now above even the elevated pre-pandemic level and a full one percent above the 2018-19 average. This is very good news, reflecting a strong economy an labor market.
Prime aged men have returned to the workforce.
Prime aged women are the “rock stars”, increasing their participation by 2% from 2019.
Brookings has combined all of the race and age data. Major declines for white men in all 3 age groups and for white women aged 65+. Major improvements for prime age white, black and other women and for prime age black men.
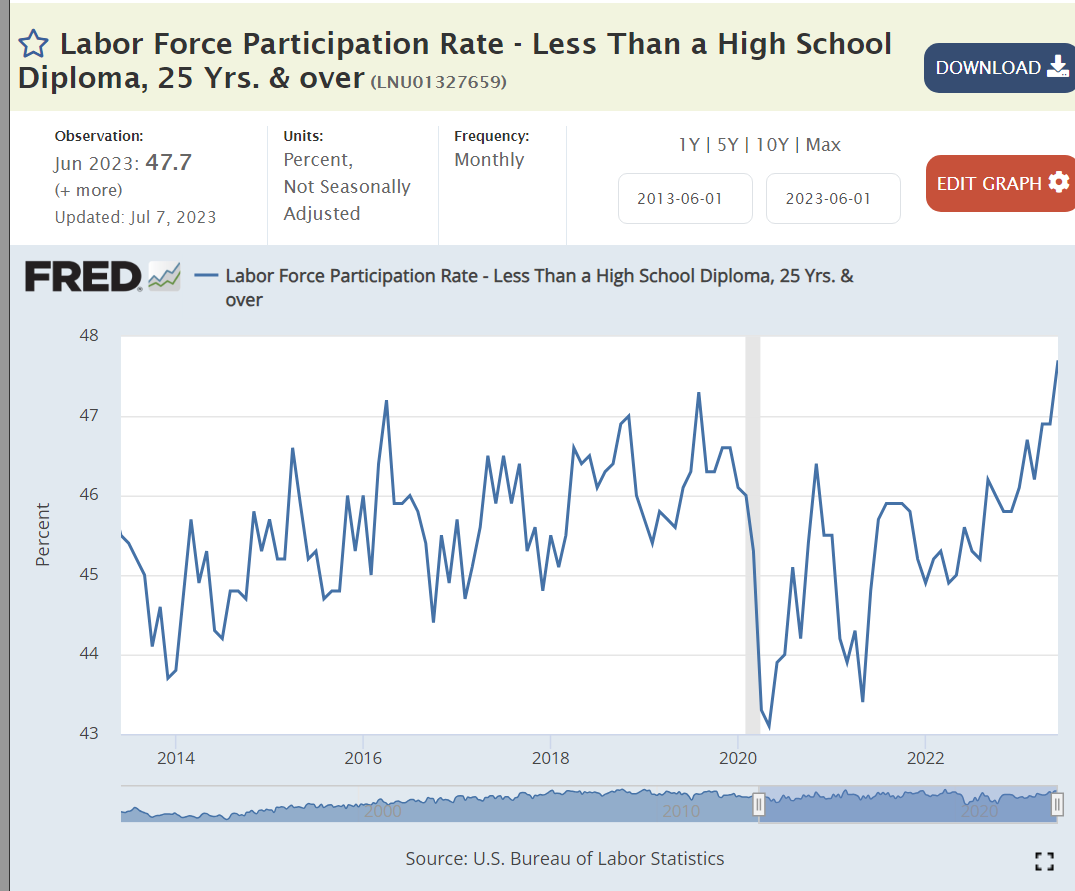
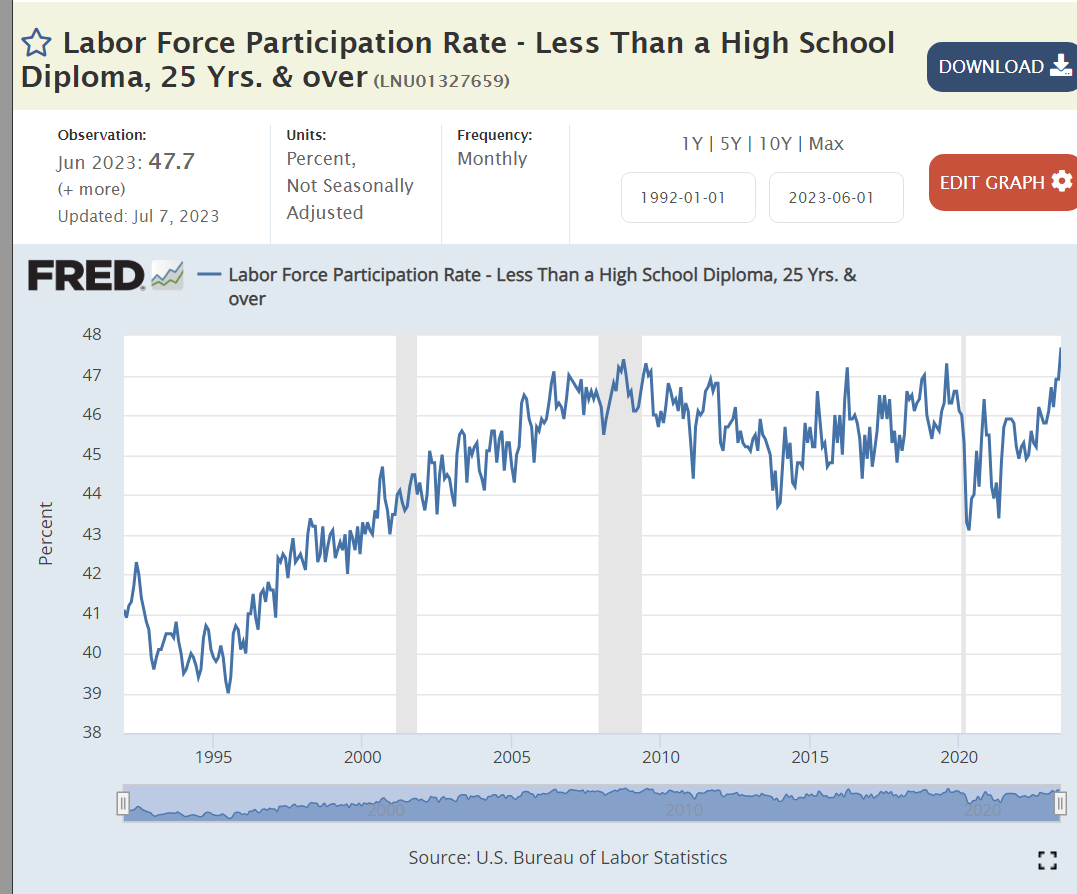
Non- high school graduates have added 1% to their labor force participation as real wages have increased.
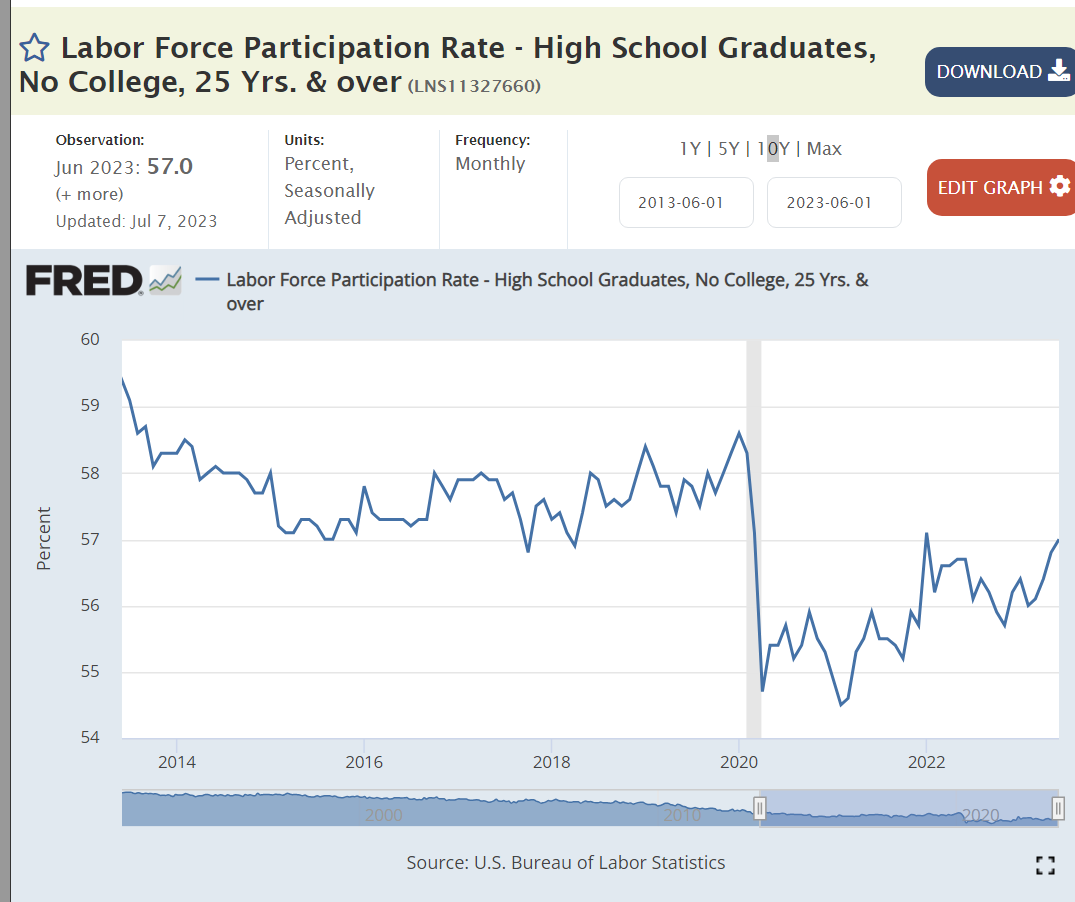
High school graduate participation dropped by three points before recovering by two points.
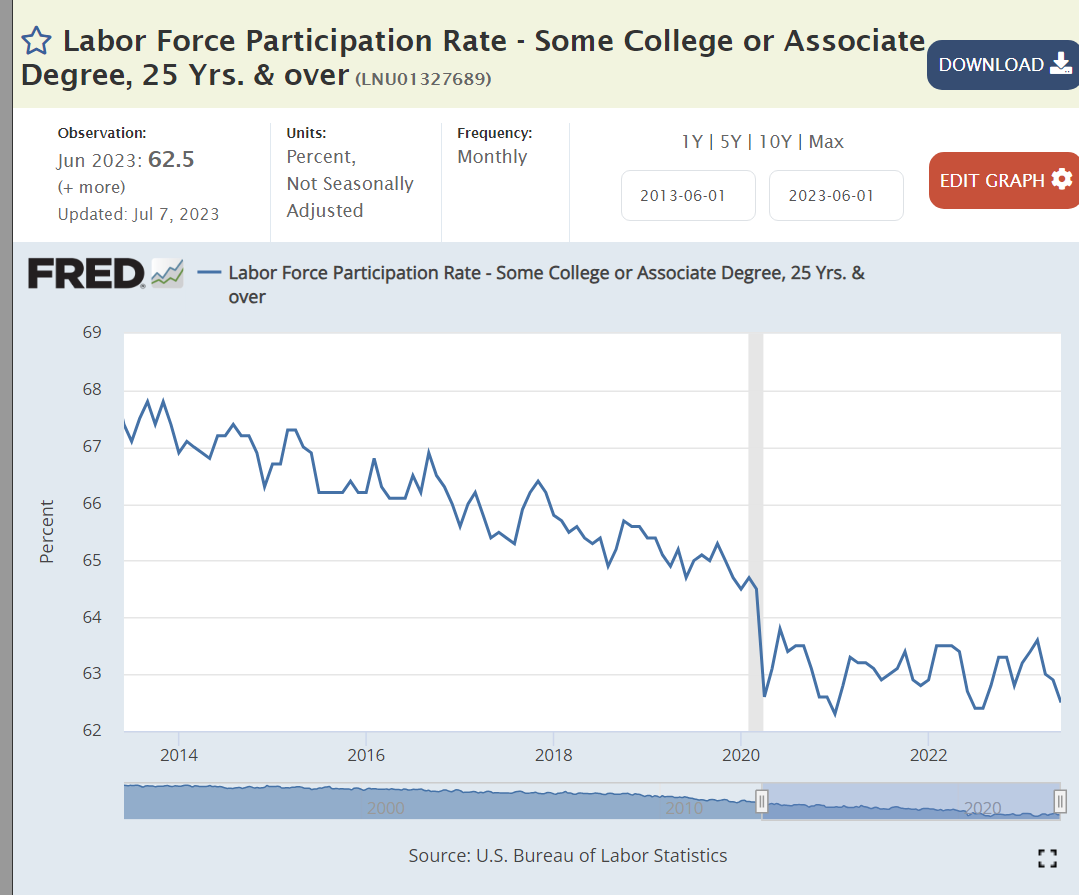
Individuals with some post-high school education, but not a bachelor’s degree, are in the middle range of US educational attainment. Their labor force participation rate had declined by almost 3 points in the 6 years before the pandemic, dropped by another 2 points during the pandemic and has not “recovered”.
Labor force participation by bachelor’s degree holders was stable before the pandemic, then dropped by 2 points and has since recovered by a little more than 1 point, remaining about one-half point below the prior average.
Individuals with a high school degree or higher have displayed drops of 10 points in labor force participation across the last 30 years. Most of this change is due to the “mix variance” of lower participation by an increasingly older and retired population, but some reflects other causes.
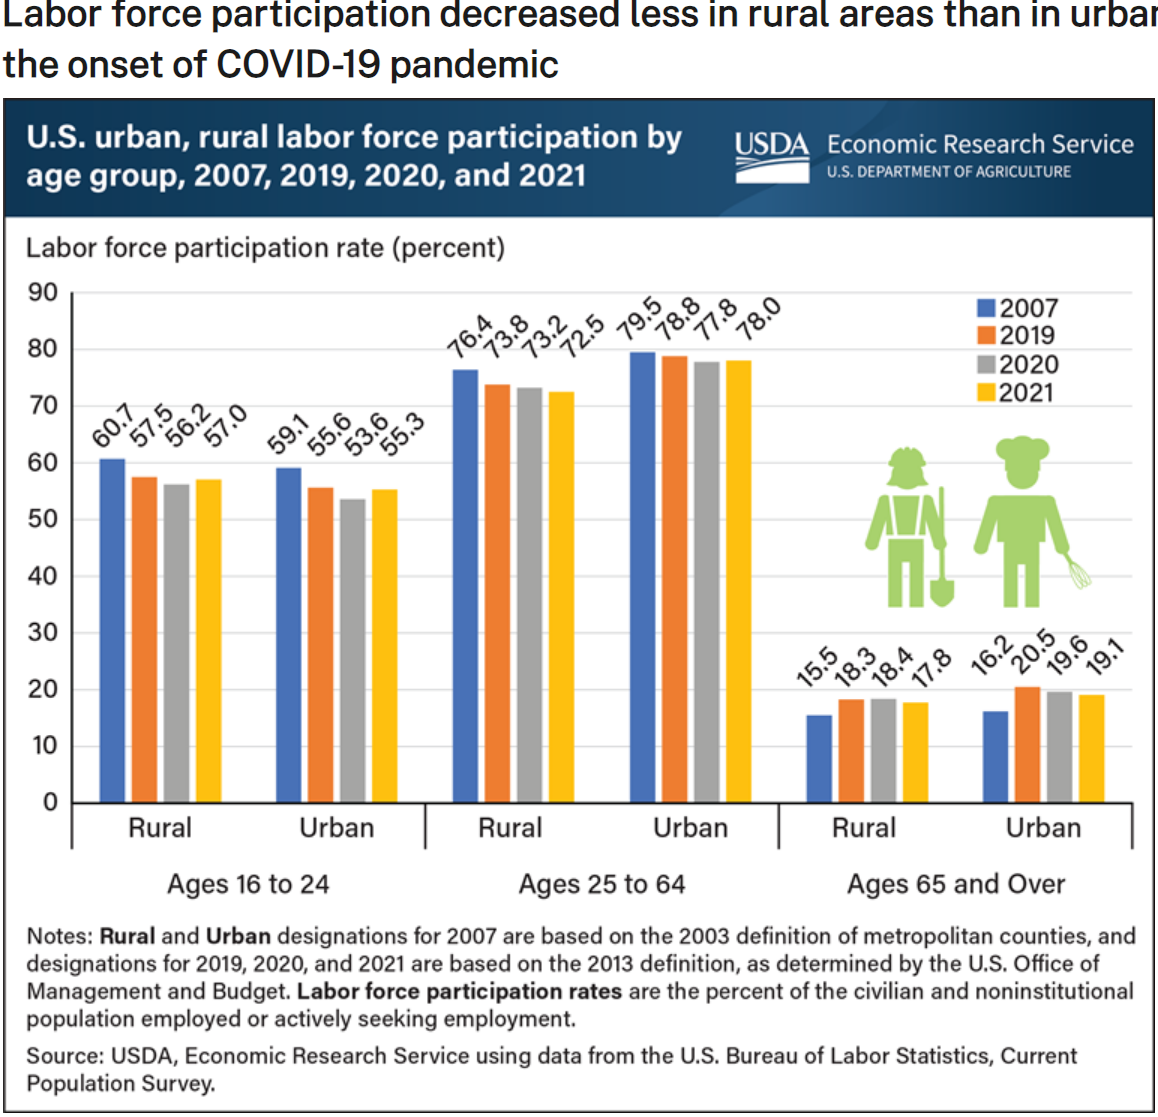
In general, rural labor markets have grown more slowly in the last 15 years and shown greater reductions in labor force participation. Some of the increased labor force participation in the last 2 years may reflect a recovery from these declines.
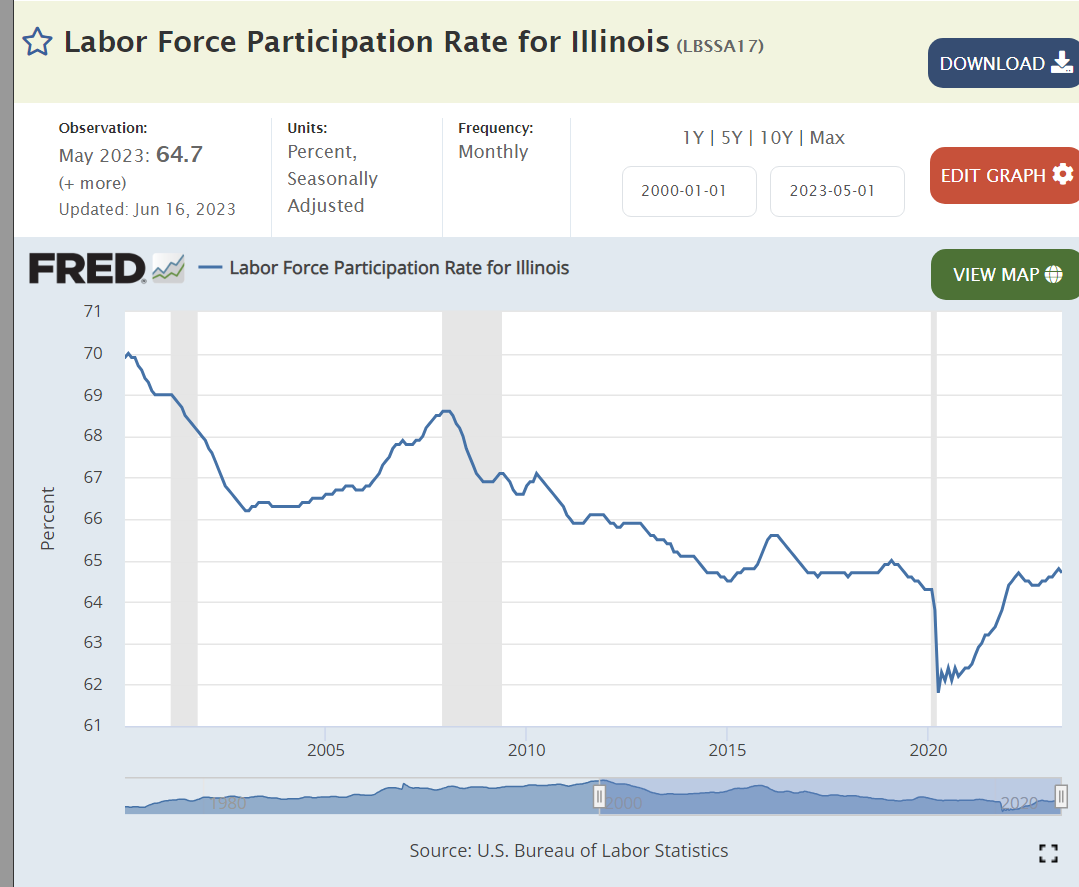
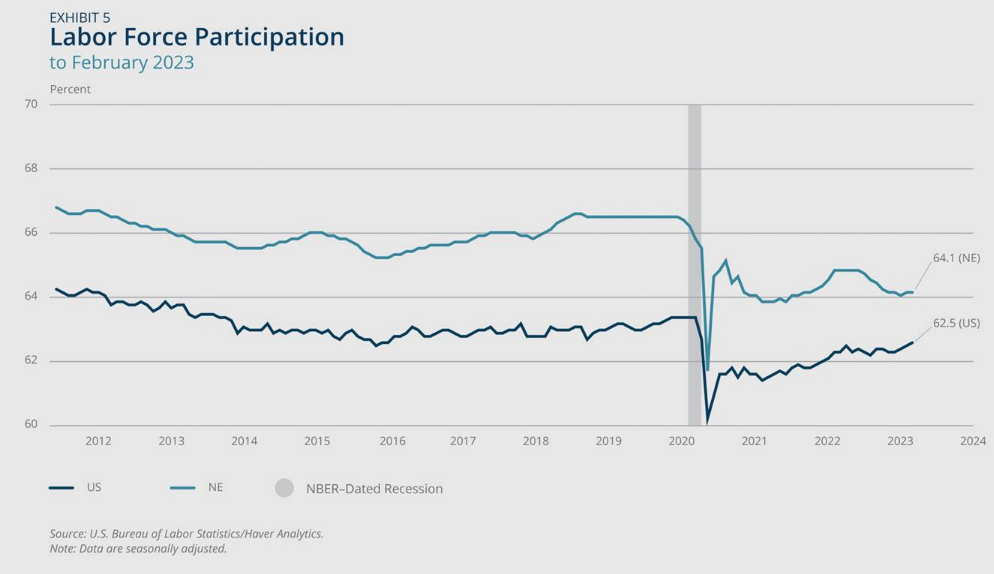
Most states show a similar pattern of labor force participation in the years before the pandemic, declining by 2-4% and afterwards recovering to their pre-pandemic level. California’s recovery has been slower. The New England states had an unusual increase in labor force participation before the pandemic and have not seen a major recovery after the pandemic.
Summary
Several sources decry the decline in the number of workers and the labor force participation rate, noting that it holds back the economic recovery and taints the 3.5% unemployment rate.
Other sources point to the long-term downward trends in participation as the biggest factor, mostly driven by an aging workforce and recent higher than normal retirement rates. Pre-pandemic forecasts showed a one-half point decline in participation, matching the actual 2023 data. Detailed analysis shows that the age adjusted participation rate is a little higher. The core group, aged 25-54 population, also shows labor force participation recovery to relatively high pre-pandemic levels. So … there are demographic, racial, education, birth country, rural/urban, location and state differences in participation. There are opportunities for higher participation in a strong economy and labor market. However, the recovery from the pandemic is complete, reflecting this strong economy and labor market.