The IndyStar reported on the final recommendations of the “Governor’s Taskforce” earlier this month. I didn’t see much response locally. I believe this is a HUGE opportunity to cooperatively invest in Indiana’s future, by both parties. Indiana’s governor and two houses have been governed by a single party for many years. The historical low-tax, low-service, selective investment strategy has delivered low taxes, responsible local government services, respectable education, solid infrastructure, a diversified economy but mostly growth in just the Indy metro area and lower average incomes for the other 80 counties. The current very low unemployment rates are further squeezing employers reliant upon abundant relatively low wage/skills employees.
Focus. 30 Items are Too Many.
Eliminate One-third of the Lowest Value Initiatives.
Digital development grants. Employers will invest in high ROI projects by themselves.
2. Indiana Talent Agency. No extra bureaucracy.
3. Career Network. No extra bureaucracy. Finding jobs on-line is easy today.
6. College retention incentives. Colleges already have incentives.
10. Immigration reform. Yes, but Indiana will not drive this nationally.
11. Miscellaneous student grants. These would help, but not critically.
12. Transportation funding. Helpful, but not critical.
21. High school diploma flexibility. Critical thinking skills or true CTE skills are essential, Don’t dilute them further.
23. Incentivize CTE credentials. Not needed. If credentials were clearly defined and understood, students and workers would pursue them out of self-interest.
24. STEM curriculum, courses, etc. Focus on schools and teachers first.
29. Scholarship for dual credit completers. These highly talented and motivated students are already moving in the right direction.
Digital Skills (1)
No need for #4 bureaucracy. Basic digital skills should be completed in junior high school. Is the state requirement clear? Advanced digital skills courses should be required in HS and community college for graduation. Make existing courses available for free to firms for remedial on-site training. Make relevant Western Governor’s University courses free. Digital skills should be like “breathing” for Indiana residents. No extra state overhead is required.
University STEM Degrees (2)
No incentives to universities required (5). Provide STEM degree completers with a $25K graduation cash rebate. IU/Purdue (7) should offer more diverse STEM degrees, but so should all Indiana publicly funded universities. Let the students drive the faculty levels.
Career and Technical Education Certifications (3)
Fine-tune the certification program to really recognize workplace, digital, team, industry and technical skills. If the program was recognized like a CPA, licensed plumber, six sigma blackbelt, PMP project manager, Microsoft IT skills, state licensed professional, etc., it would have great value, increasing employee pay and transferable value. (8, 9, 22, 30).
Early Childhood Education (4)
Fund pre-K and K for all. Fix the detailed regulatory limits (13). Defining pre-K detailed results is not essential (26).
Community College (5)
Clearly define “advanced manufacturing” curriculum and degree (1). Reduce community college tuition fees further with state subsidies to encourage universal participation in higher education (like Tennessee). Radically change community college to be local county (or county groups) funded and managed educational institution. Ivy Tech has failed repeatedly as a state-run organization to graduate students. Let local counties decide if they want to invest in education and actively manage this.
Reading (6)
Invest whatever it takes to ensure that all 3rd graders can read at grade level. This is the most essential gateway (28).
Administrative Improvements/Investments (7)
15. Offer employers a $1K fee per class to offer on-site classes.
16. Simplify criminal expungement.
17. Auto enroll eligible students in 21st C scholars.
18. Require HS seniors to file FAFSA.
19. Increase college funding grants for lower income students.
20. Increase credit for prior learning.
28. Fund Dolly Parton library to encourage reading.
High School STEM Classes (8)
25. Allow any person with a BS degree to teach any STEM class at HS and community college level. No need for more detailed subject matter or education course qualifications. They will “figure it out”.
Indiana is not winning the modern global competition for value added jobs and firms. Students and adults must have modern skills. Educational institutions must provide these skills. This requires focused investments and administrative changes.
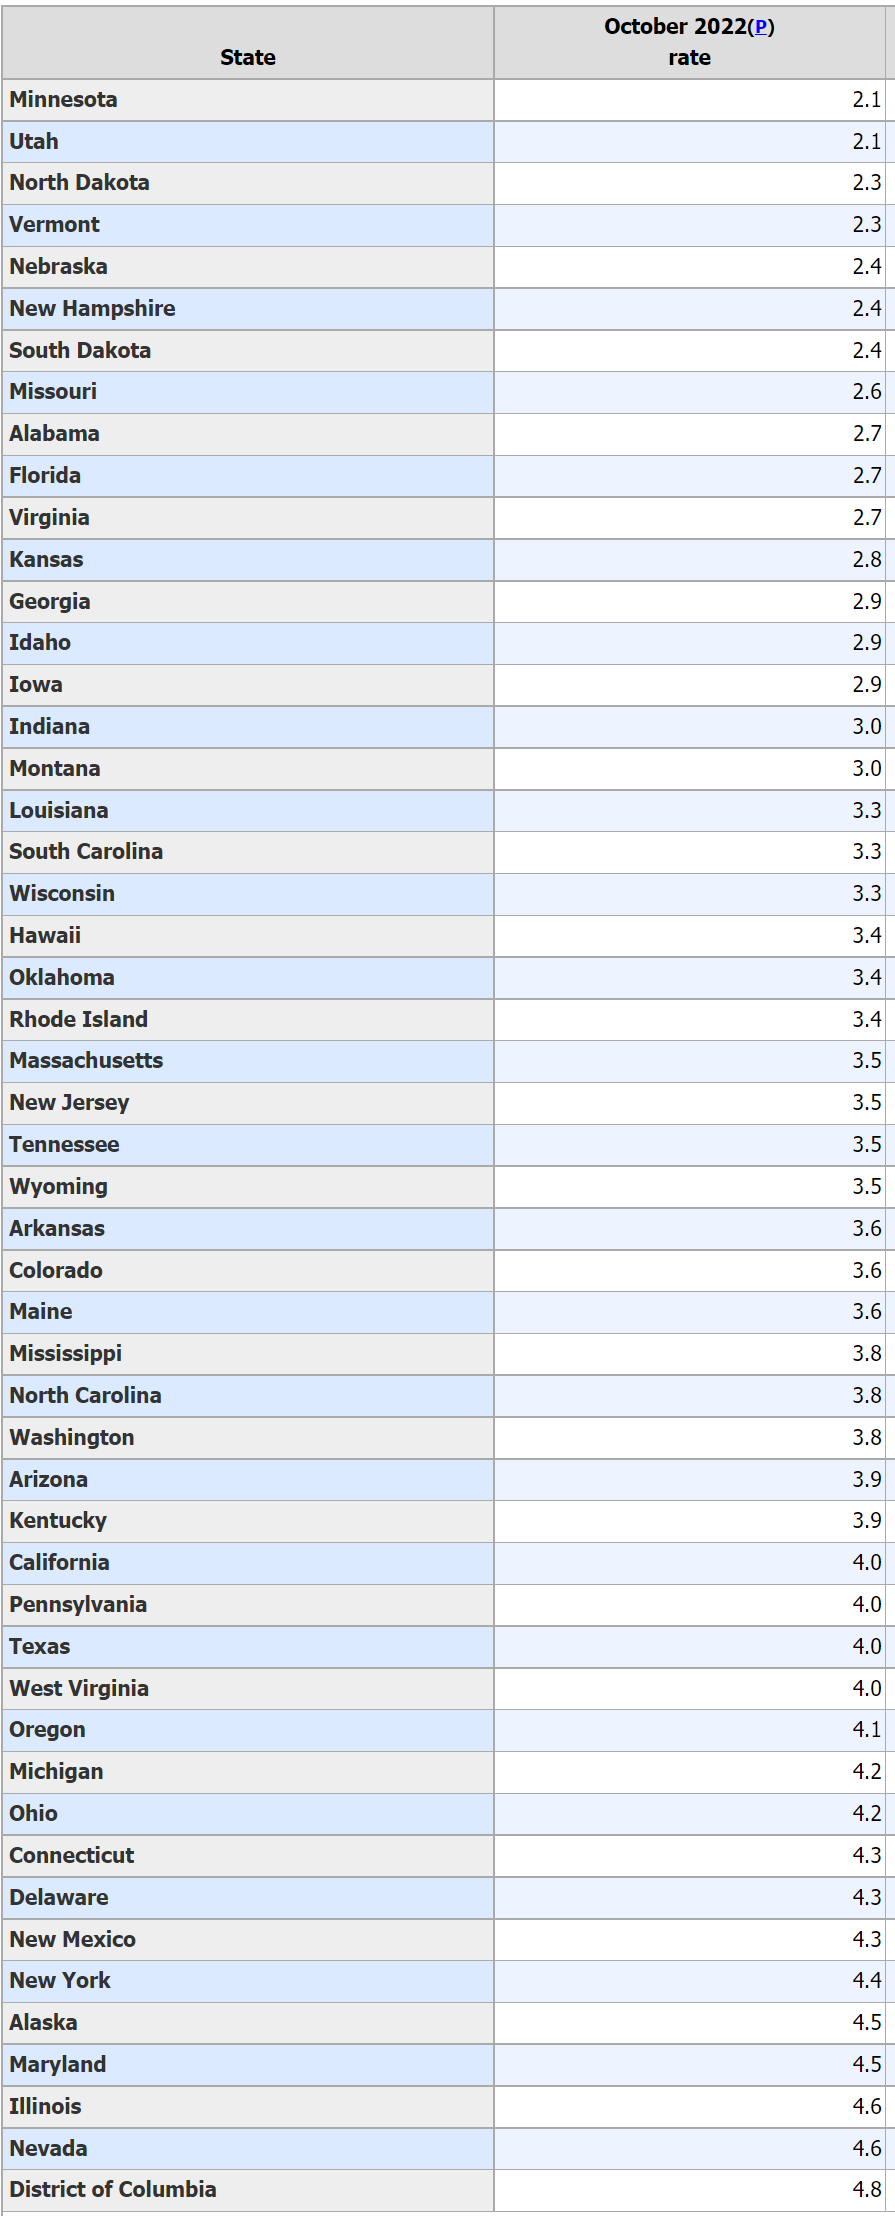
15 of the 50 states have unemployment rates in the TWO’s!
The Great Plains region has 7 states with 2% unemployment rates: MN, SD, ND, Mo, KS, NE and IA.
Utah (2.1%) and Idaho (2.9%) standout in the Rocky Mountain states.
In the Southeast, Alabama (2.6%), Florida (2.7%) and Georgia (2.9%) enjoy minimal unemployment.
New Hampshire (2.4%) and Vermont (2.3%) represent New England and Virginia leads the Middle Atlantic (2.7%).
Another 20 states report 3% unemployment rates, for a total of 35 (70%) at 2-3%.
The remaining 15 states and the District of Columbia (4.8%) enjoy 4% unemployment, historically considered better than “full employment”. Illinois (4.6%) and Nevada (4.6%) have the highest unemployment.
A plurality (40%, 149) of the 370 US metropolitan areas report employment rates of 3%, consistent with the 3.5% overall national rate.
More than one-third (34%, 124), enjoy rates in the 2% range!
About one in seven (14%, 51) reflect better than classic “full employment” rates in the 4% range.
24 metro areas (6%) enjoy astonishingly low 1% unemployment rates.
22 metro areas (6%) are outside of “full employment” at 4.9%. 17 are in the 5% range. 5 exhibit 6%+ unemployment rates.
The statistics for just the top 100 metro areas show the same pattern. The distribution of unemployment rates weighted by population shows less dispersion, with just 3% each in the 1% and 5%+ ranges and a heavier 47% in the central 3% range.
22/370 Metro Areas Not at Full Employment (5-7% Unemployment Rates)
California: Yuba City, Madera, Fresno, Hanford, Merced, Bakersfield, Visalia
Texas: Corpus Christi, Brownsville, Beaumont, McAllen
Illinois: Danville, Kankakee, Decatur, Rockford
Michigan: Muskegon, Saginaw, Flint
Pueblo, CO, Rocky Mount, NC, Farmington, NM and Las Vegas, NV
42 of the 50 states enjoy having all of their metro areas with full employment.
24 Metro Areas with Far Better than Full Employment (1% Unemployment Rates)
Missouri: Columbia, Jefferson City, Springfield, St Joseph, Joplin, Cape Girardeau
Lincoln, NE and Ames, IA
Minnesota: Mankato, Rochester, St Cloud, Minneapolis-St Paul
Dakotas: Fargo, Grand Forks, Bismark, Sioux Falls, Rapid City
Utah: Provo, Logan, Ogden, Salt Lake City
Burlington, VT, Columbus, IN and Bloomington, IN
Summary
The labor market stands out as a very positive measure of the health of the US economy in October, 2022. A general, prolonged, material decline in economic health is difficult to see on top of this broadly very positive economic base. A slow-down? Highly likely.
The stock market reacted quite positively yesterday to the slightly better than expected news regarding measured inflation. The total measure and the “core inflation” measure excluding more volatile food and energy prices were both a little lower than expected for the month and for the 12-month calculation.
I don’t think that trend inflation was ever as high as the markets and voters perceived (double digits) and I don’t think that today’s reaction/perception of a peak or recovery in the inflation rate is correct, as inflation totals and details have been slowing for seven months, since March. In hindsight, the business cycle tends to reflect a smooth “sine-wave” curve of increasing, flattening and then decreasing various measures. It is VERY difficult to separate the “signal from the noise” as the monthly data is released on GDP, employment, inflation, etc.
As usual, we need to look at nearly a dozen measures of inflation and its components and 2-3 views of each component to try to identify the “signal”.
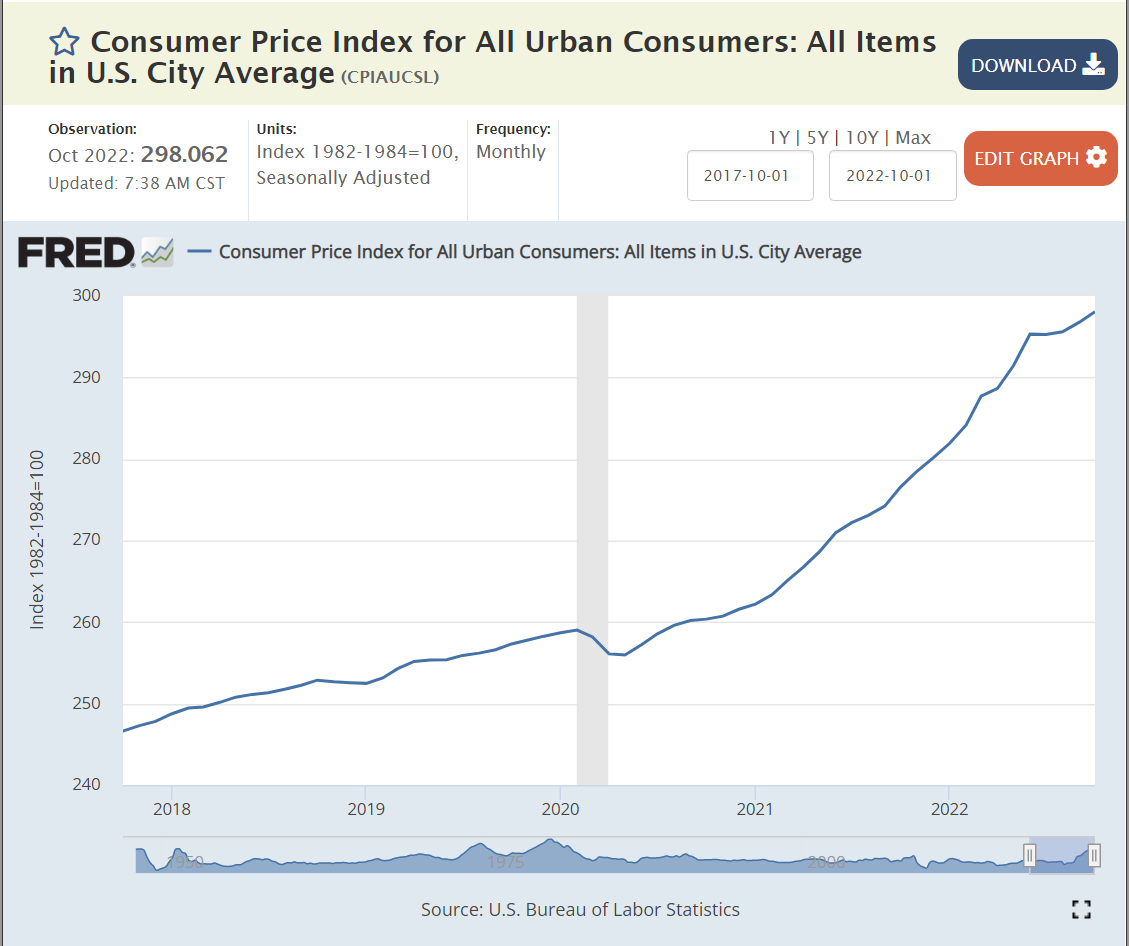
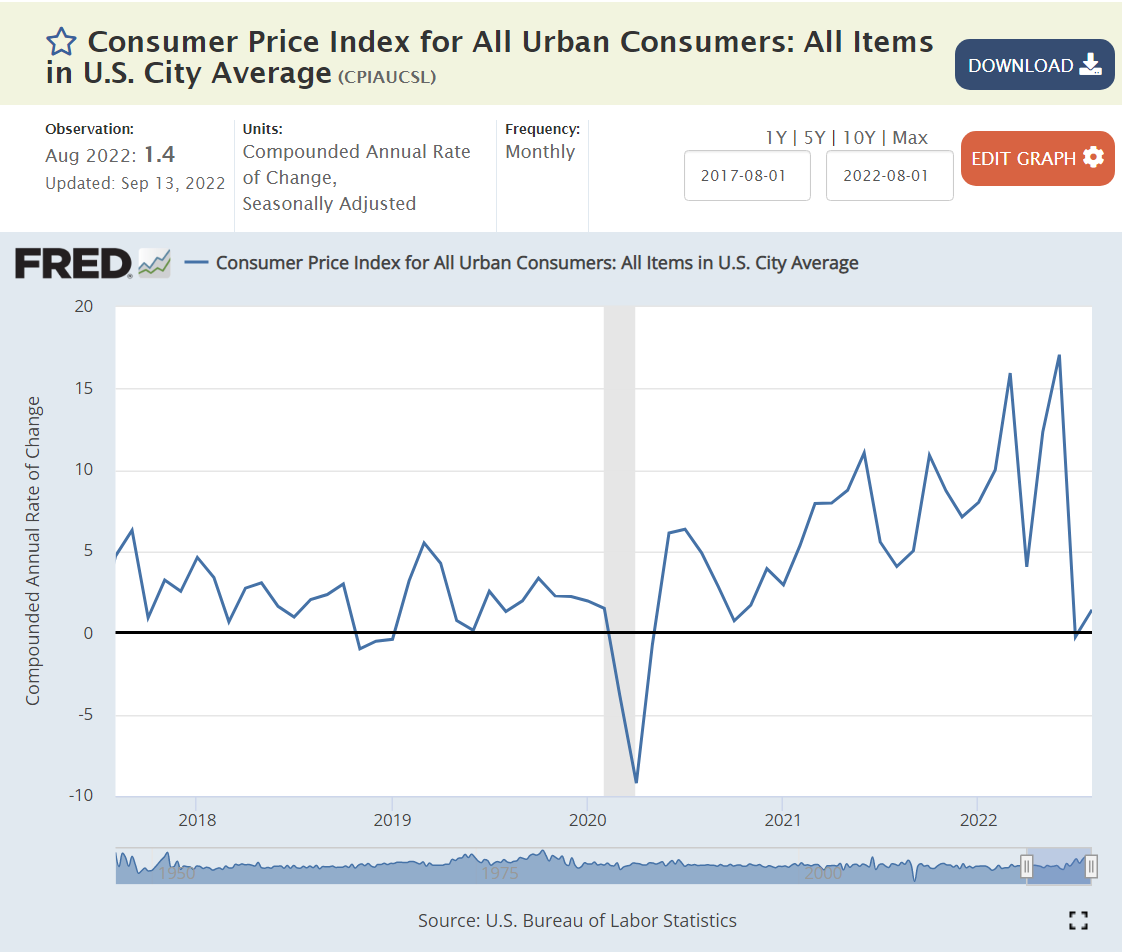
When I look at the consumer price index, I see an inflection point in March, 2022, when a quickly accelerating curve paused its growth rate. Inflation appeared to resume at its prior pace in April and May, not faster than in prior months, indicating that March was a fluke, but at about the same pace, indicating that, overall, there was the beginning of a slow-down in Feb-May. In June, I see a second inflection point, and the pace of price growth has clearly slowed for the next 4 months. The annual inflation rate from March to October was 6.2%
The inflation rate from September, 2021 to March, 2022 was 9.8%. This was the highest rate indicated by this data. 6.2% is a good one-third lower than 9.8%, strongly indicating that the inflation rate has peaked. It might not be declining, but it has clearly peaked.
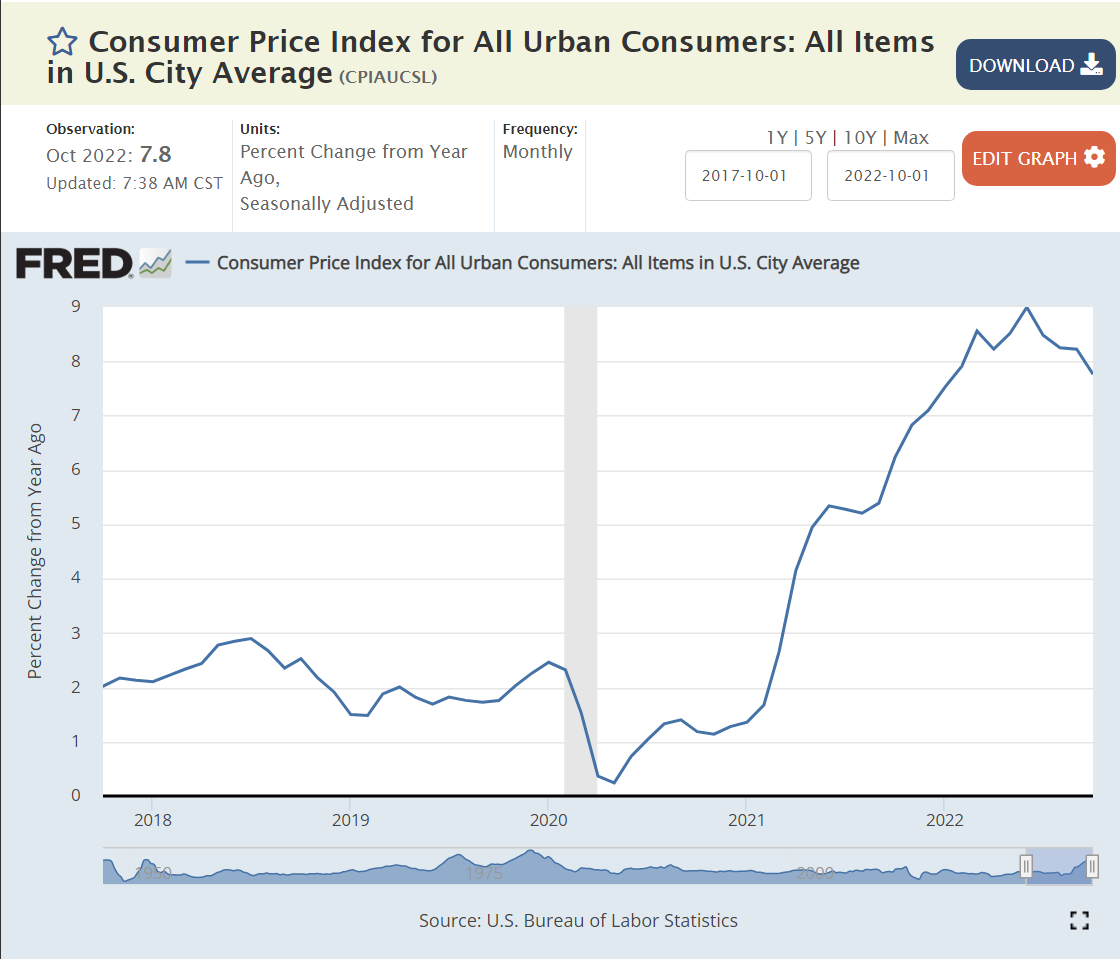
The annual, 12-month price change measure tells the same story. At September, 2021, the trailing annual inflation rate was 5.4%. At March, 2022, the rate had reached 8.6%. It appears to have peaked at that time, levelling off in the low 8% range. A peak was reached in June at 9%. The next 5 months have shown a declining trend to less than 8%.
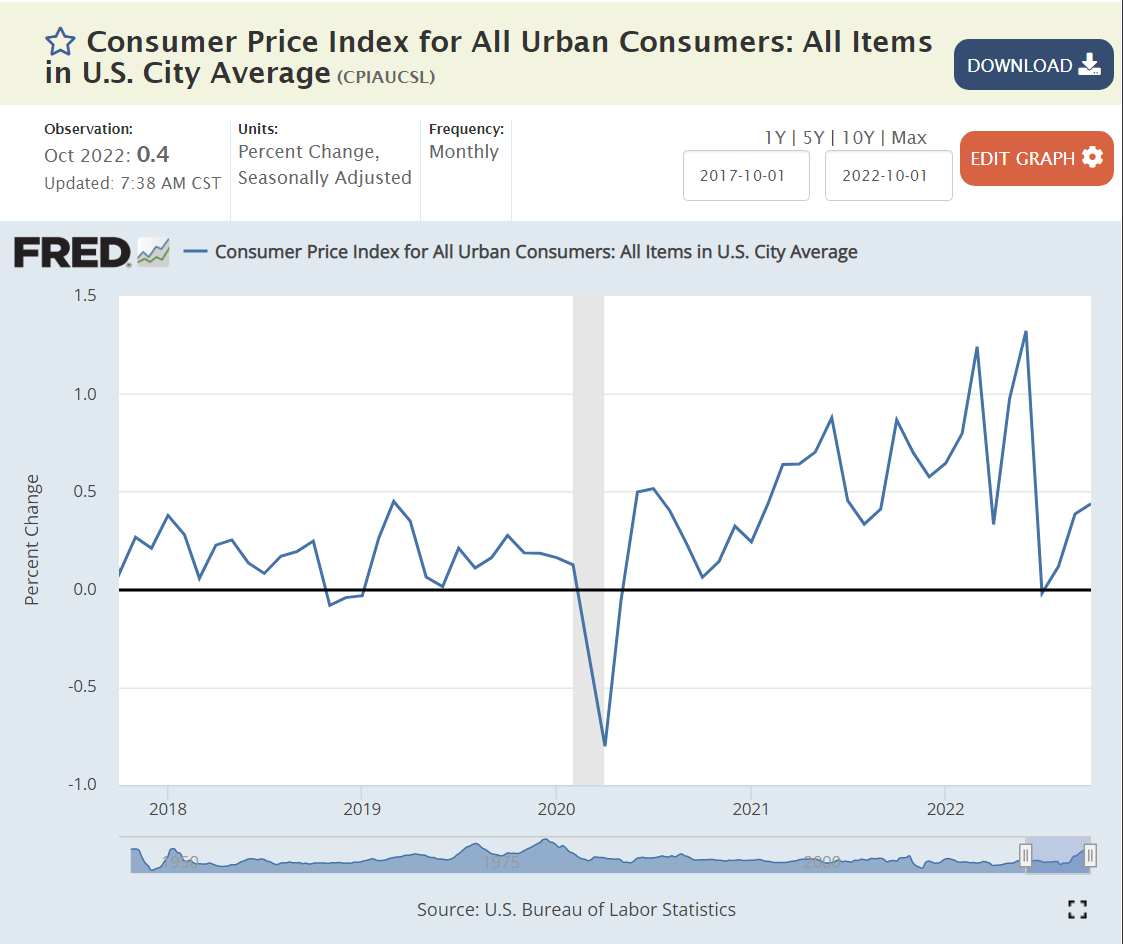
The monthly percentage change is much more volatile. Monthly changes reached 0.88% in Jun 21 and 1.32% in Jun 22. There were also lower monthly changes during this period, keeping the 12-month measure to 9% or less. The last 4 months have shown good news, with monthly inflation of 0%, 0.1%, 0.4% and 0.4%, a total of 0.9% for 4 months, or 2.7% annually. This measure is too volatile to claim victory, but it reinforces the notion that inflation has peaked and is beginning to decline significantly.
The “core” inflation index appears to have peaked at 6.4% of annual inflation in Feb, 2022. Most economists focus on this measure because the excluded food and energy components are much more volatile and tend to return to their low long-term inflation rates, so high monthly increases tend to be followed by offsetting declines. The core inflation index appears to have levelled off at 6.5%, but evidence of a future decline is not obvious in this measure.
The monthly core inflation measure fluctuates between 0.4% and 0.6% for the last 18 months, indicating annual inflation of 5-7%. A lasting decline is not obvious, but the October measure is encouraging.
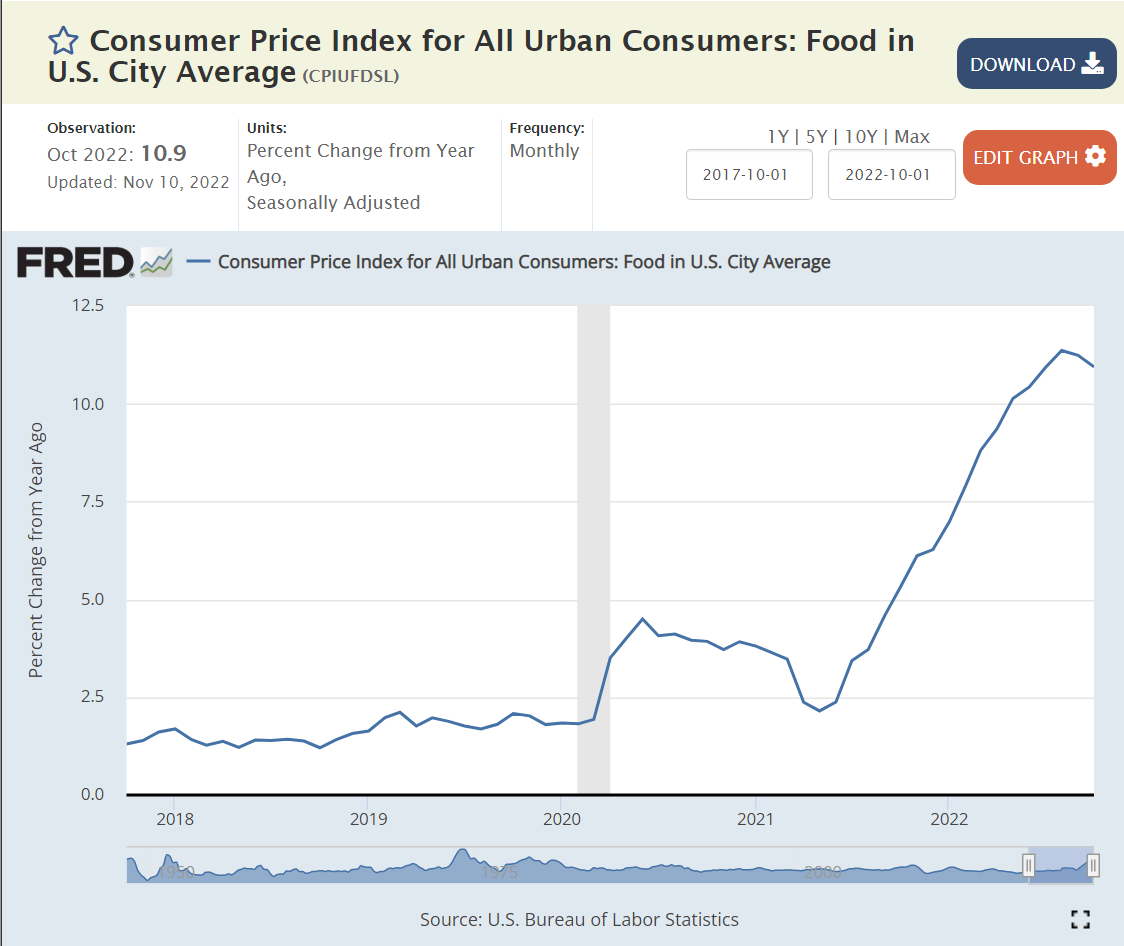
The food consumer price index clearly accelerated from late 2020 through mid 2022. Monthly inflation grew from 0.2% in late 2020 to 0.6% in the last 2 quarters of 2021. Food inflation reached 1% monthly in February, 2022 and stayed at that level for 6 months, before beginning to decline quite sharply to 0.6% in the next 4 months.
On a year-over-year basis, it took a little longer for food price inflation to become noticeable, as the earlier lower inflation months were combined with the growing inflation months. In June, 2021, the trailing 12-month food inflation rate was just 2.4%, comparable to the last 30 years. The annual inflation rate reached 6% by November, 2021 and peaked at 11.4% in August, 2022. The monthly food inflation rate and the trailing 12-month rate are clearly declining. Consumers face a grocery bill each week and are sensitive to these changes for key items.
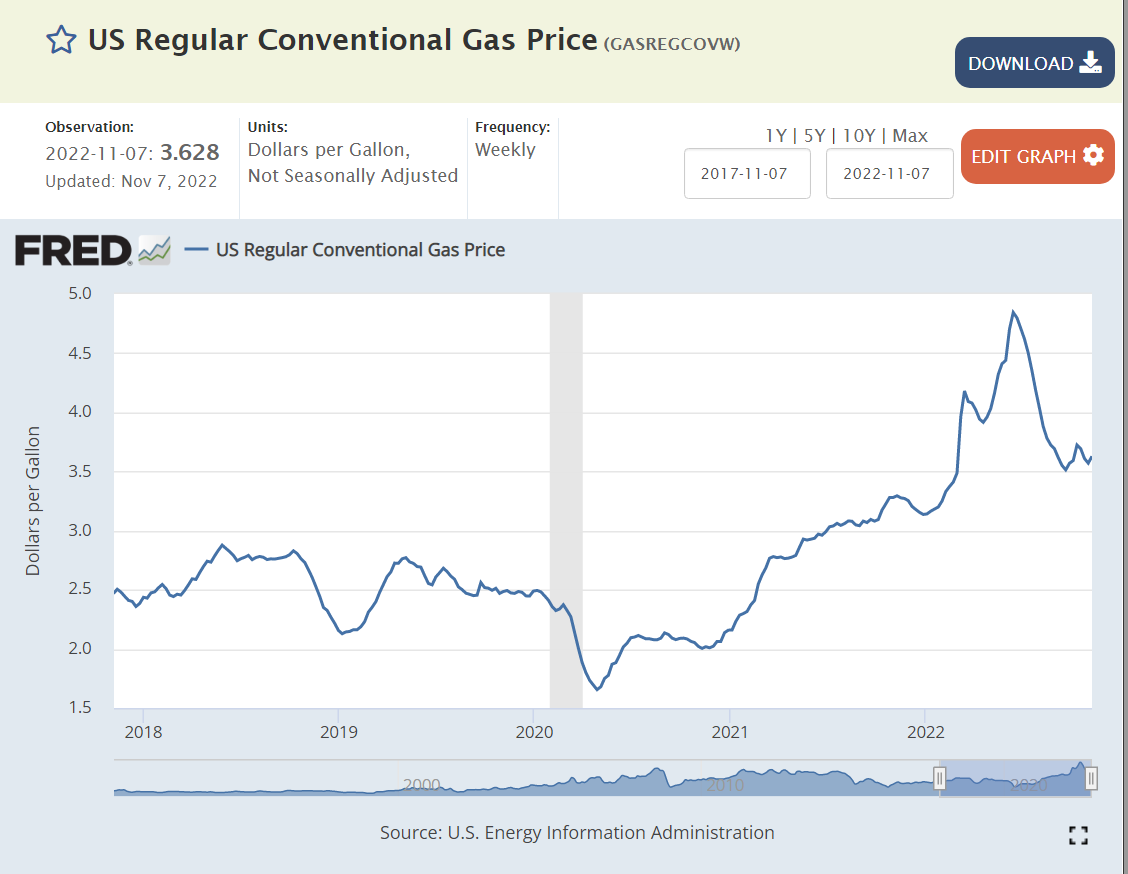
Energy prices are volatile. That’s why they’re excluded from the “core” inflation measure. Nonetheless, from a consumer experience and future inflation expectations perspective, they matter. They matter greatly. The gas and electric bills arrive each month. Automobile fuel is purchased weekly or more often with huge price signs at the station. Monthly energy prices increased by 5% in June, 2021 alone and averaged about 2.5% per month for the next year and one-half. Energy prices then briefly increased by 19% in the next 4 months combined before finally dropping a bit. The monthly experience was one of 2 years of increases and 30% annual inflation for more than a year. The recent price reduction is seen as a release from relentless large increases.
The most visible energy price. for regular auto fuel, dropped from $2.50 per gallon to just $2.00 per gallon during the first year of the pandemic before increasing to $3.00 per gallon in the second year and then up to nearly $5.00 per gallon in June, 2022. It has since declined to a slightly elevated $3.60 per gallon. Consumer perception of “gas prices” is mixed. It’s clearly higher than in 2019, 2020 or 2021, but it has come down from the peak level. Various threats and weekly volatility make consumers shy to conclude that gas prices are “really” declining.
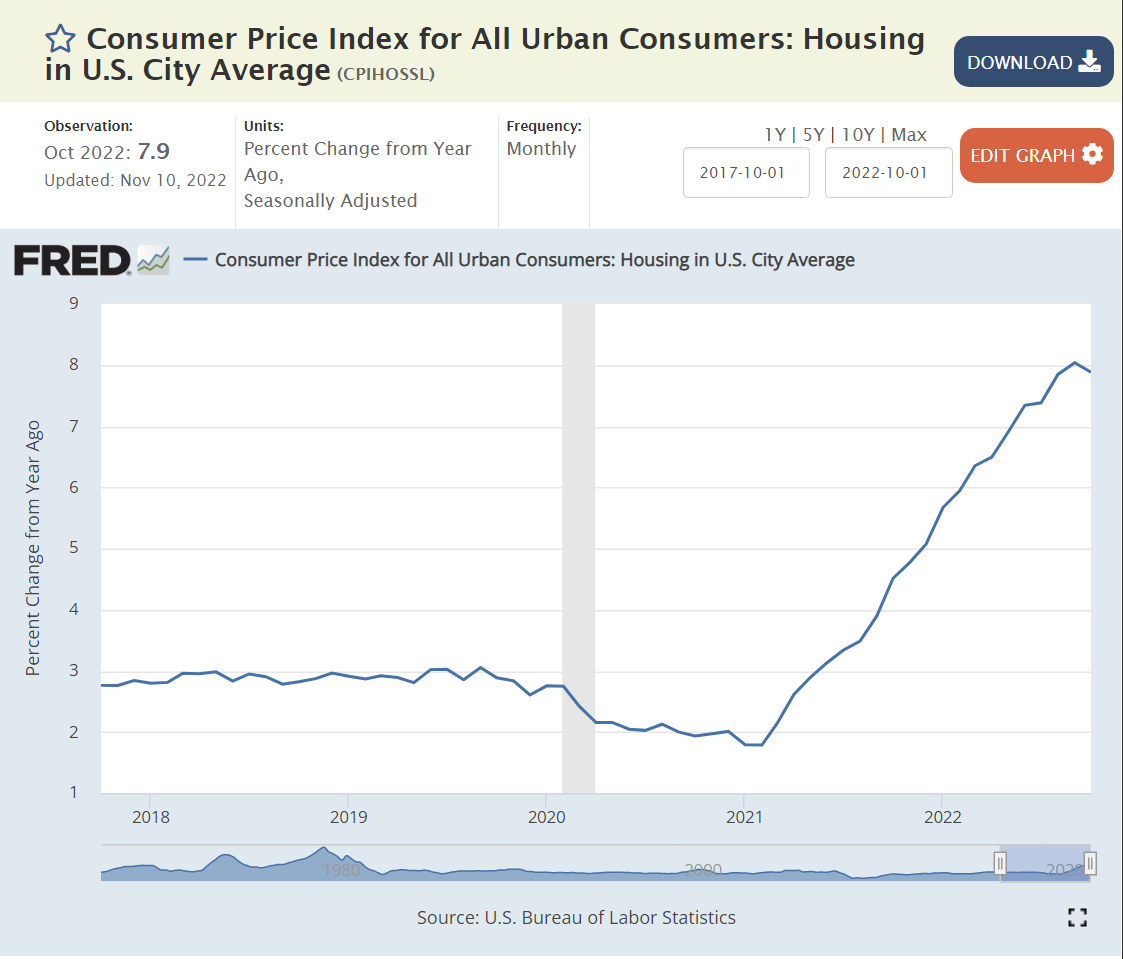
Housing/shelter is the largest component of the CPI. Both rental and home ownership costs are estimated, with adjustments used to try to smooth out variable month-to-month changes.
Annual housing inflation remained in the 2-3% range for the first year of the pandemic, but very quickly climbed to 6-8% as the supply of new homes was reduced and demand for housing of all kinds increased. Consumers saw this inflation in record high rent and housing prices (new or used).
With the Fed driving higher mortgage interest rates, consumers can afford less housing, so demand for new and used housing has dropped, causing owned and rental prices to flatten or fall.
Consumers have clearly seen the substantial increases in housing values and rents, and the subsequent flattening in recent months. Most consumers would estimate experienced annual housing inflation at more than 10% for the last 2 years and be unsure as to expected future housing and rent prices. When in doubt, consumers are likely to expect the worst; some level of continued increases in rents and total costs (mortgage payments).
The pandemic’s large consumer and business subsidies lead to a 20% spike in demand for durable consumer goods, which drove a 25% price increase in 18 months. Consumers obviously experienced this large price increase, even though it was implemented over more than a year. Prices effectively peaked by February, 2022 and then returned to their usual 0-2% annual level. Consumers can feel that “everything costs more”. Many durable goods are purchased infrequently, so the new zero inflation will take some time to shape consumer perceptions, but we are already 9 months into this cycle, so consumers are mostly feeling better about this category.
The “transportation” subset of the CPI looks like the durable goods graph. It contains the prices of cars and trucks, the cost of fuel, insurance and maintenance. I think that most consumers would say that transportation costs are up and have not yet begun to fall, even though the index indicates that they plateaued beginning in March, 2022. This is another category where expectations should slowly change to match the numbers.
Used car and truck prices stayed flat or declined in the 7 years before the pandemic. In the 17 months from June, 2020 to November, 2021 they increased by 45% as private vehicle demand increased and new car supplies shrunk. Used car prices have essentially flattened in the last year. Consumers are aware that prices have stopped increasing but suspect car dealers of still trying to raise prices further. A little more positive experience on this higher profile measure will help to reduce inflation expectations.
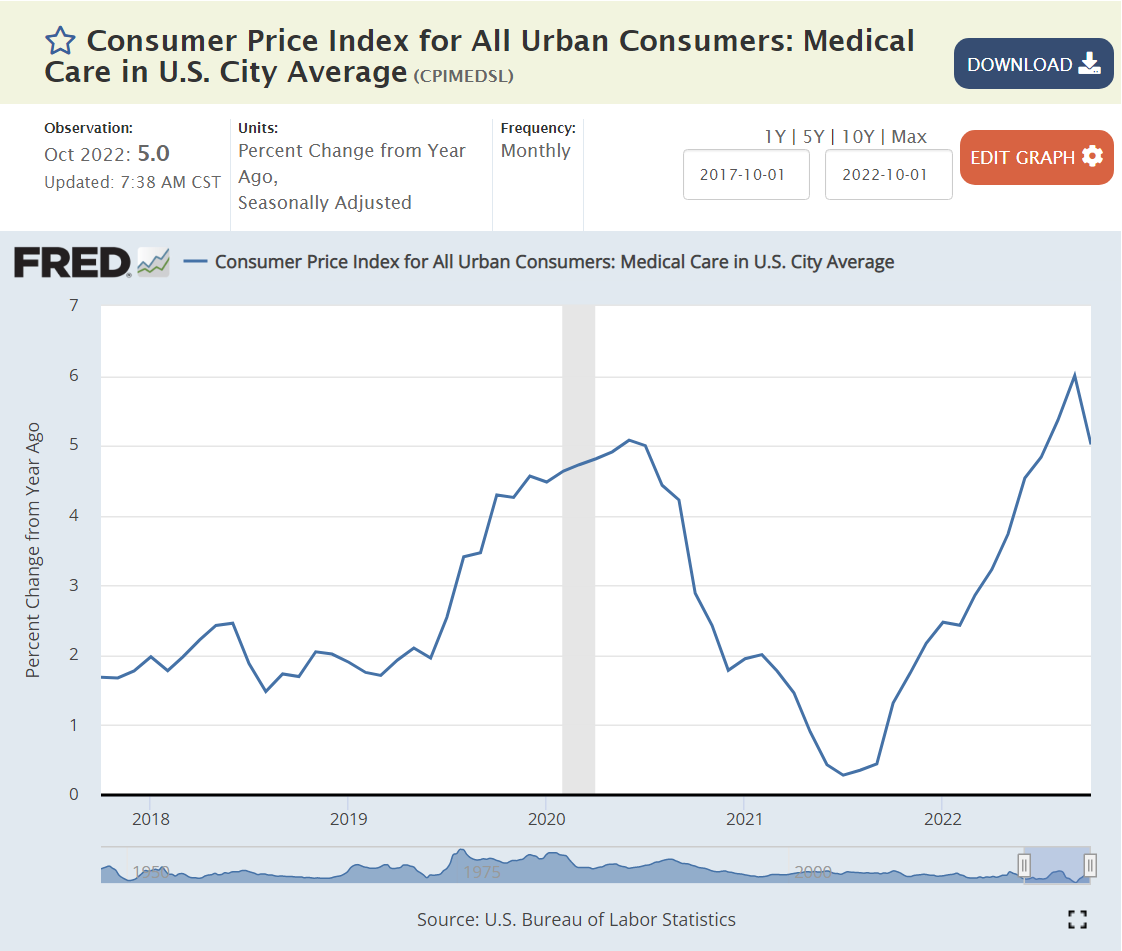
Medical cost inflation was a bit elevated at 5% heading into the pandemic, then fell to less than 2% during 2021. It has since returned to 5%. Consumers have relatively weak perceptions of medical costs due to the buffer of insurance policies. Most service prices were restrained during the first 2 years of the pandemic as demand for durable goods was up, but demand for services was down.
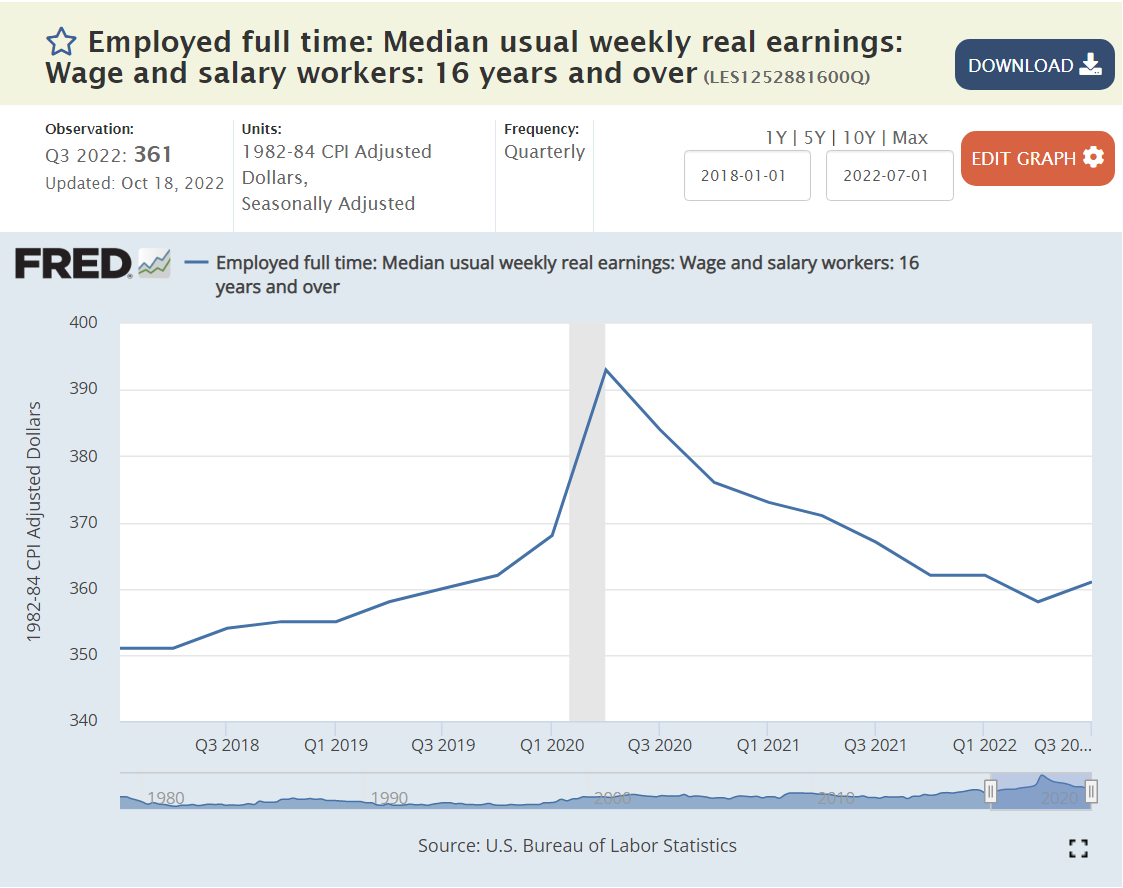
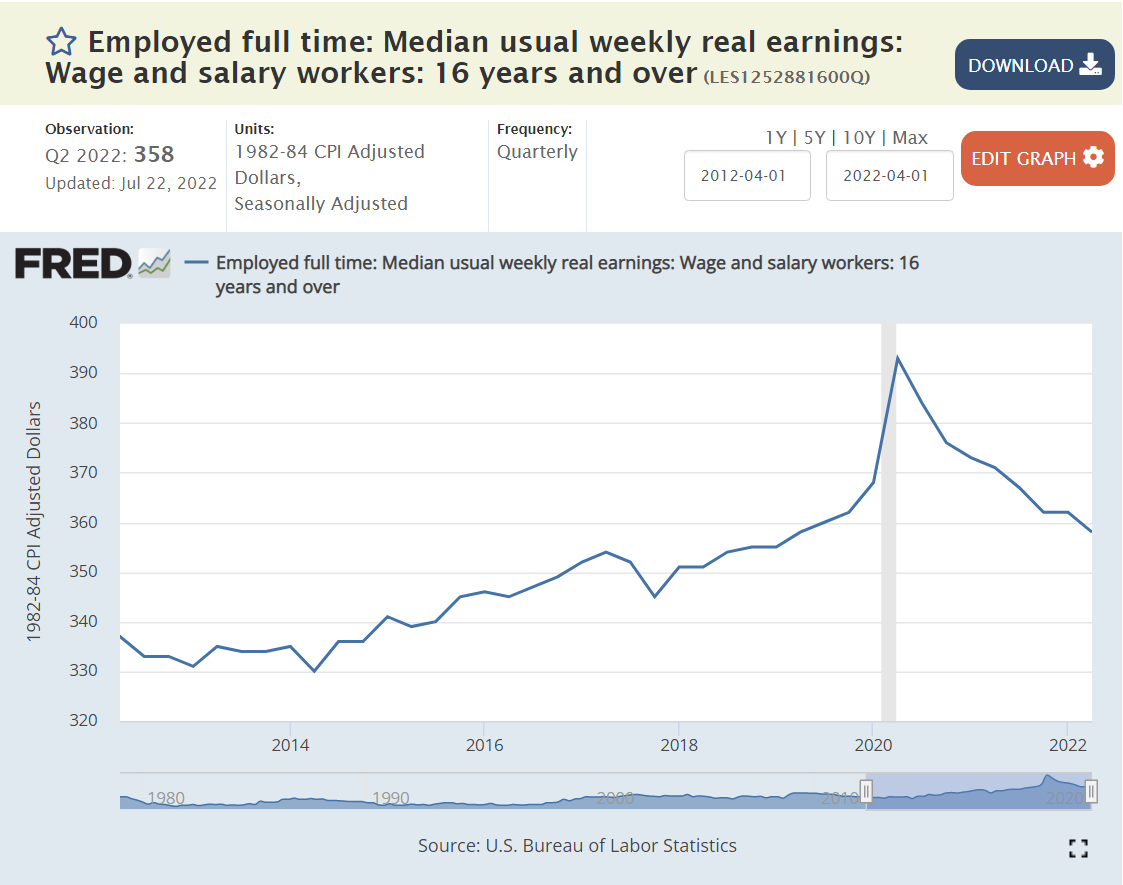
Another way that consumers gauge inflation is through their “real”, inflation-adjusted incomes. Real incomes were increasing slowly in the 3 years before the pandemic, following many flat years. Businesses bid up wages during the first year of the pandemic, but then reduced the increases in their offered wages to less than the increase in inflation. Hence, real wages have decreased by about 2% annually in each of the last 2 years. Hence, at a total level, workers are feeling inflation, because their wages are able to buy a little less at the end of 2022 than at the end of 2020 or 2021.
Summary
The data clearly indicates that inflation has peaked and is heading downward. The rate of decline is unclear. It’s unclear how long it will take to return to a stable 0-2% rate. Consumer perceptions are likely to lag the data by 3-6 months.
Total inflation reached an inflection point in June, 2022, pointing to 3% inflation, rather than 8-9%. Core inflation increased quickly throughout 2021 to a 6% annual level, but has remained flat at 6%. Food inflation reached a 12% annual level, but has slowed to 7%. Energy inflation reached 30% for an extended period of time, but has decreased to “just” 20% with high variability. Official housing costs rose by 8% annually, while consumers experienced 10% plus cost increases. The official housing inflation rate has declined a little to 6%, while consumer perceptions of current and future housing inflation are mixed. Durable goods inflation exceeded 12% annually, but has dropped back to its typical 0-2% range. Broadly defined transportation costs increased by 12%+ for more than a year and have flattened out recently at close to zero percent. Medical cost inflation was low after the pandemic, but has increased back up to 5%. Real worker wages have declined by 4% in the last two years, making inflation a felt reality. There is no sign of a wage-price spiral.
The worst of the post-pandemic inflation appears to be over. Key sectors show flat or declining inflation. Gas prices and used car prices are down. Consumers have used up most of their excess savings. Government spending is way down in real terms. Increased interest rates and a tight labor market are slowing the economy. Consumer inflation expectations are coming down with experienced inflation. Barring another major supply chain disruption, inflation should be under 3% before the end of 2023.
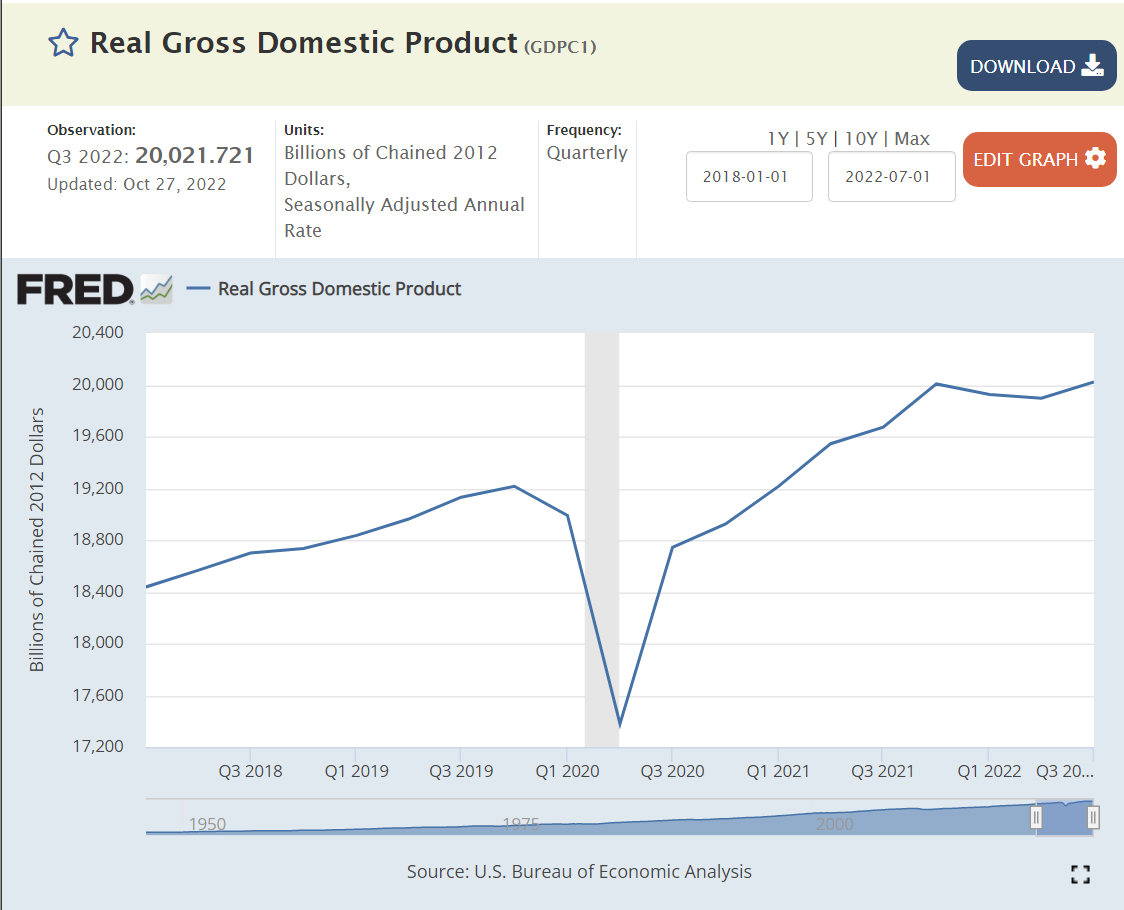
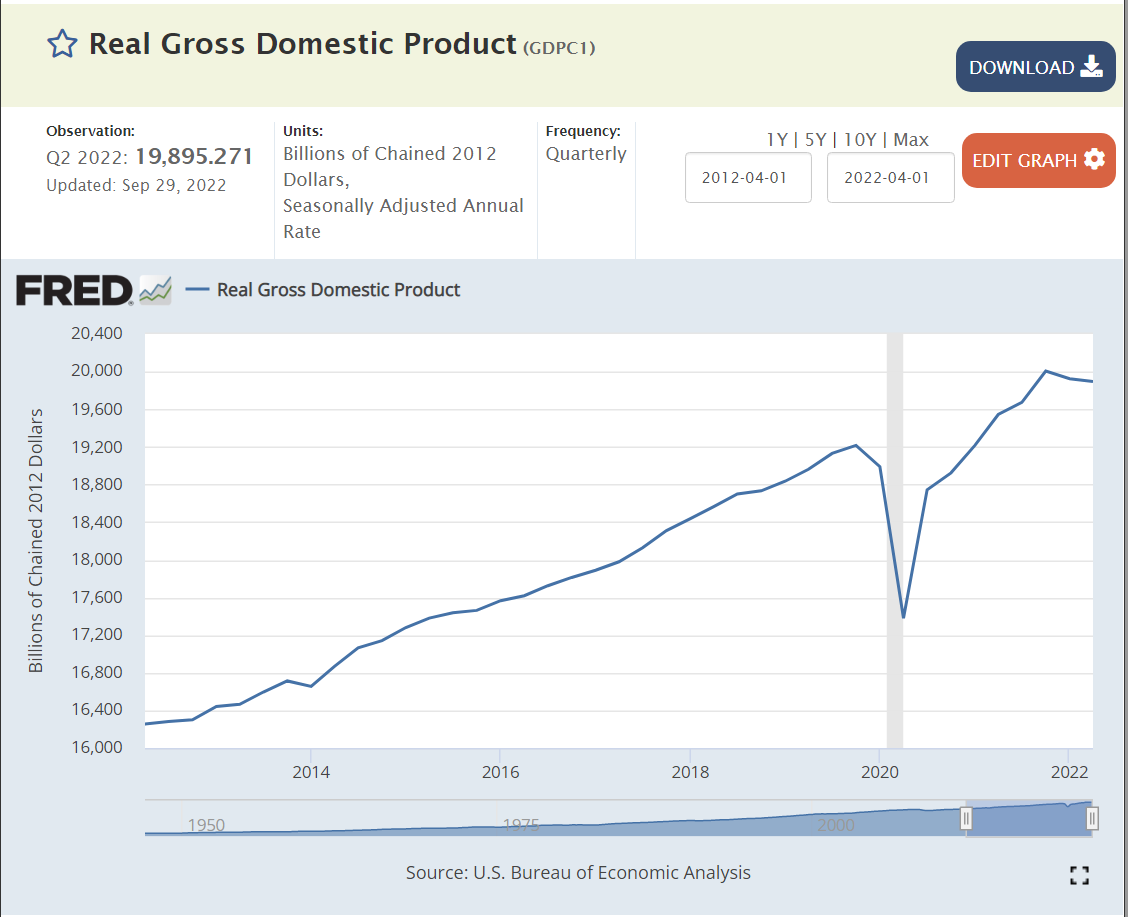
Real, inflation adjusted, GDP has quickly resumed its long-term growth rate. GDP grew in the 3rd quarter and on an annual basis has continued to grow through the 3rd quarter of 2022. Employment recovered more slowly, but has exceeded the pre-pandemic peak. Very solid job growth has continued through September, 2022.
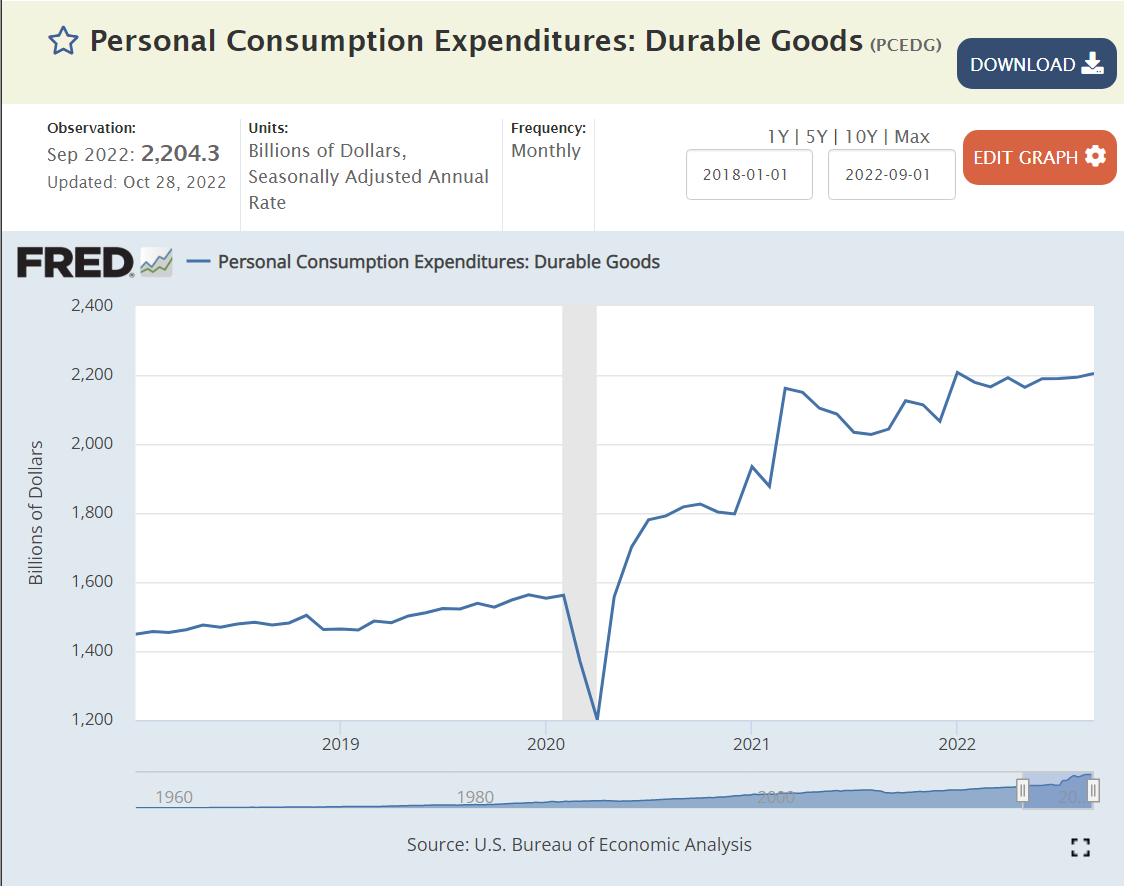
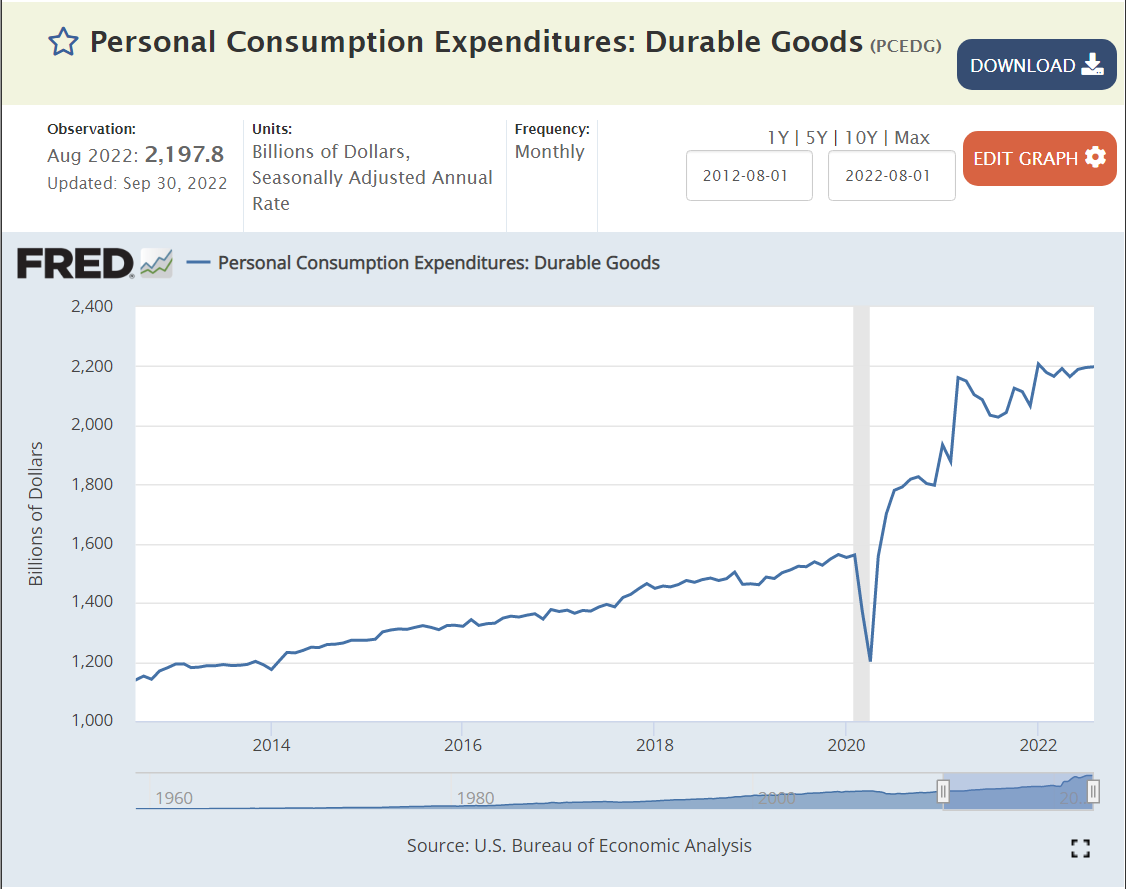
Real, inflation-adjusted, consumer spending quickly recovered from the pandemic and continues to grow. Consumers have enough income and savings to spend more, despite inflation challenges.
This is the labor market we have been waiting for since I graduated from high school in 1974. Record low unemployment, twice as many job openings and real wages above those of 2018-19, after inflation.
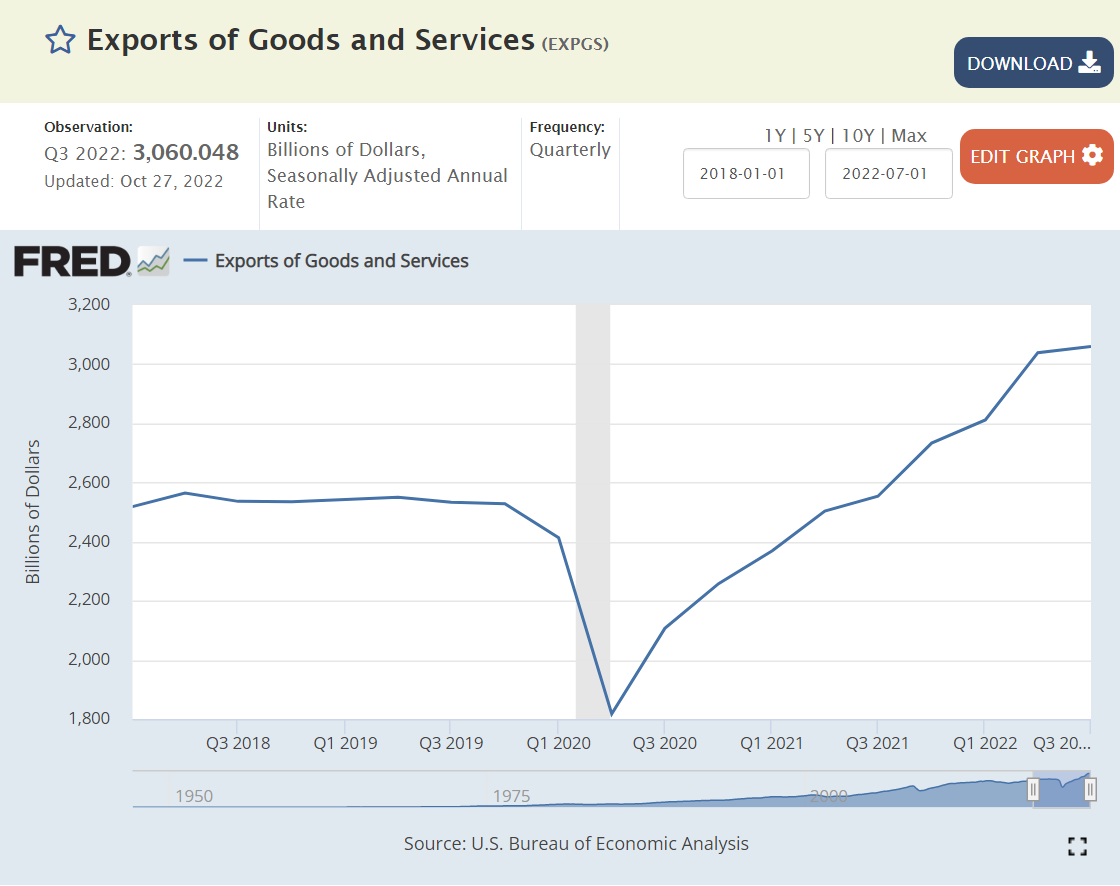
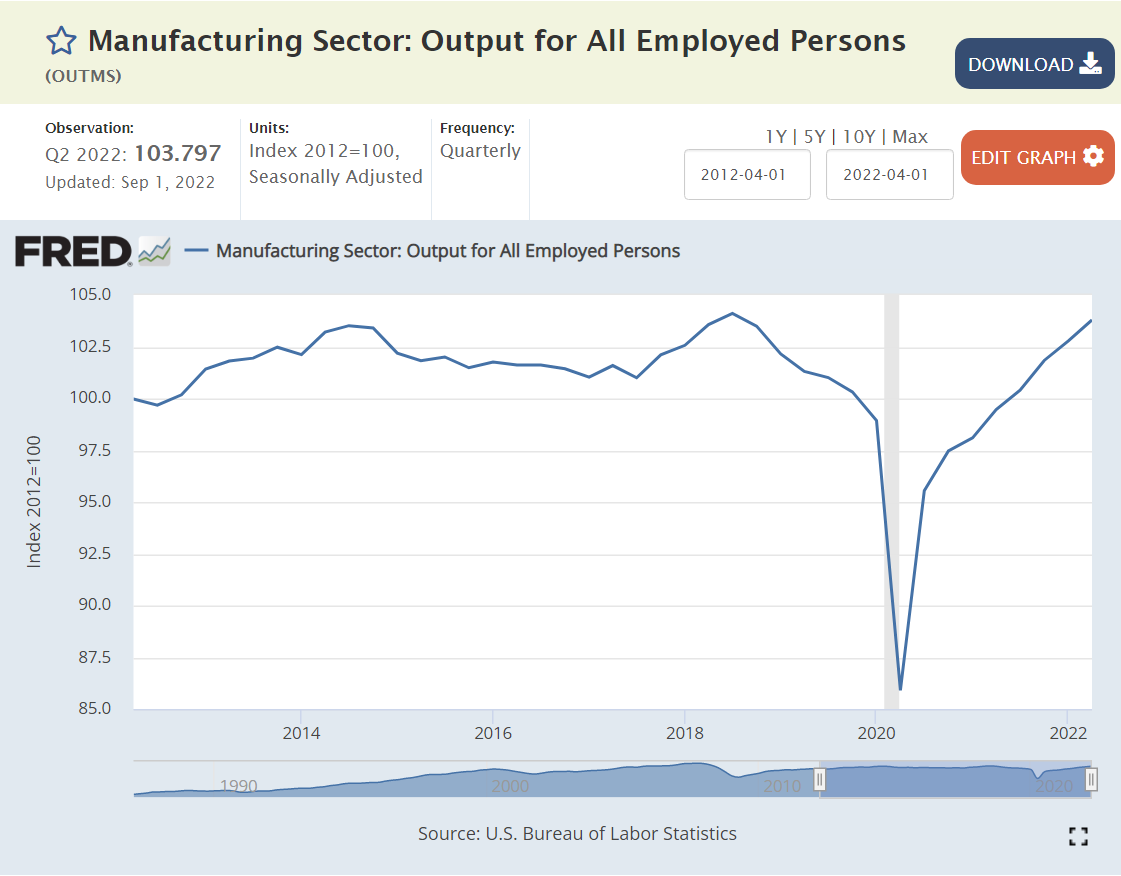
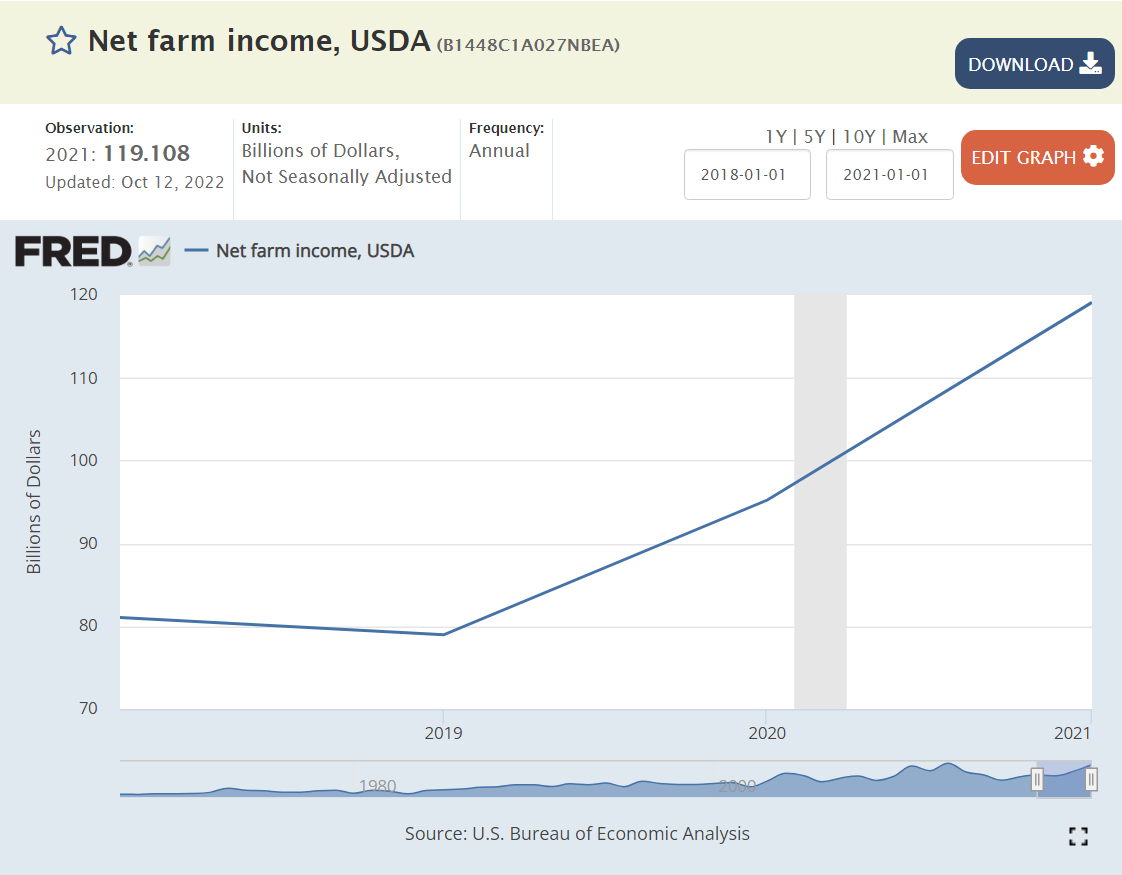
The overall US economy continues to grow, faster than other countries, including China. Exports are up by 20% as US companies continue their competitive wins. This is in spite of a much stronger US dollar. Imports are also up by more than 20%, providing consumers with the best of all global choices. Manufacturing output and employment have recovered to pre-pandemic levels. Farm incomes and output are up significantly.
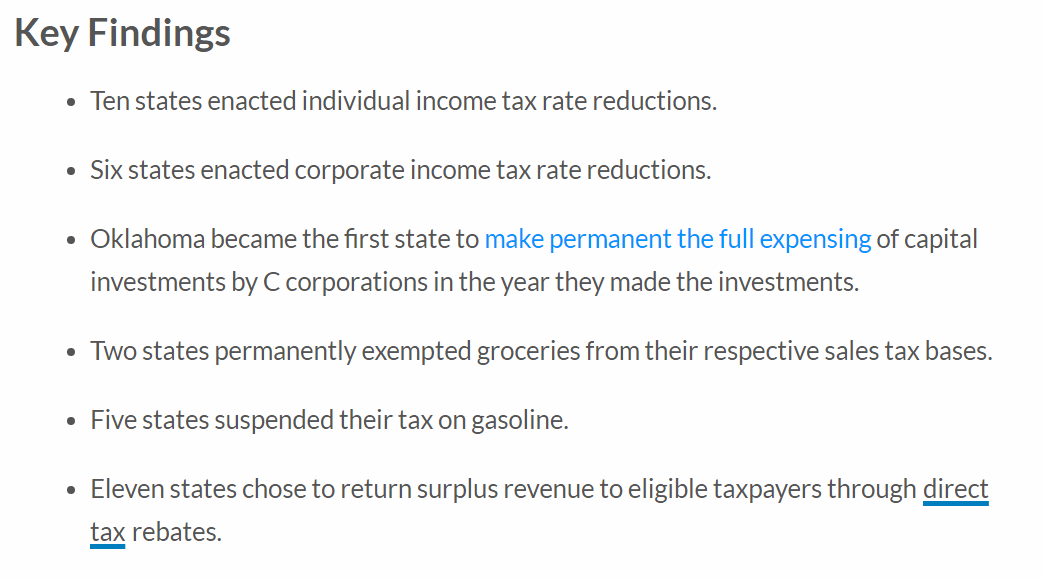
The federal budget deficit has been cut in half, with fiscal year 2022 back to the 2019 level. States have strongly recovered from the pandemic with increased revenues and slowly growing expenditures. State reserve funds are at record levels. 11 states had enough reserves to provide rebates to their taxpayers.
Retirement savings is at a record high. House values are up by one-third. The US stock market is up by one-third, despite the significant declines in 2022. Used car values are up by one-third. Retirement after age 55 remains very attainable for a majority of individuals. This growth in personal asset values has taken place while corporate profits have increased by one-half.
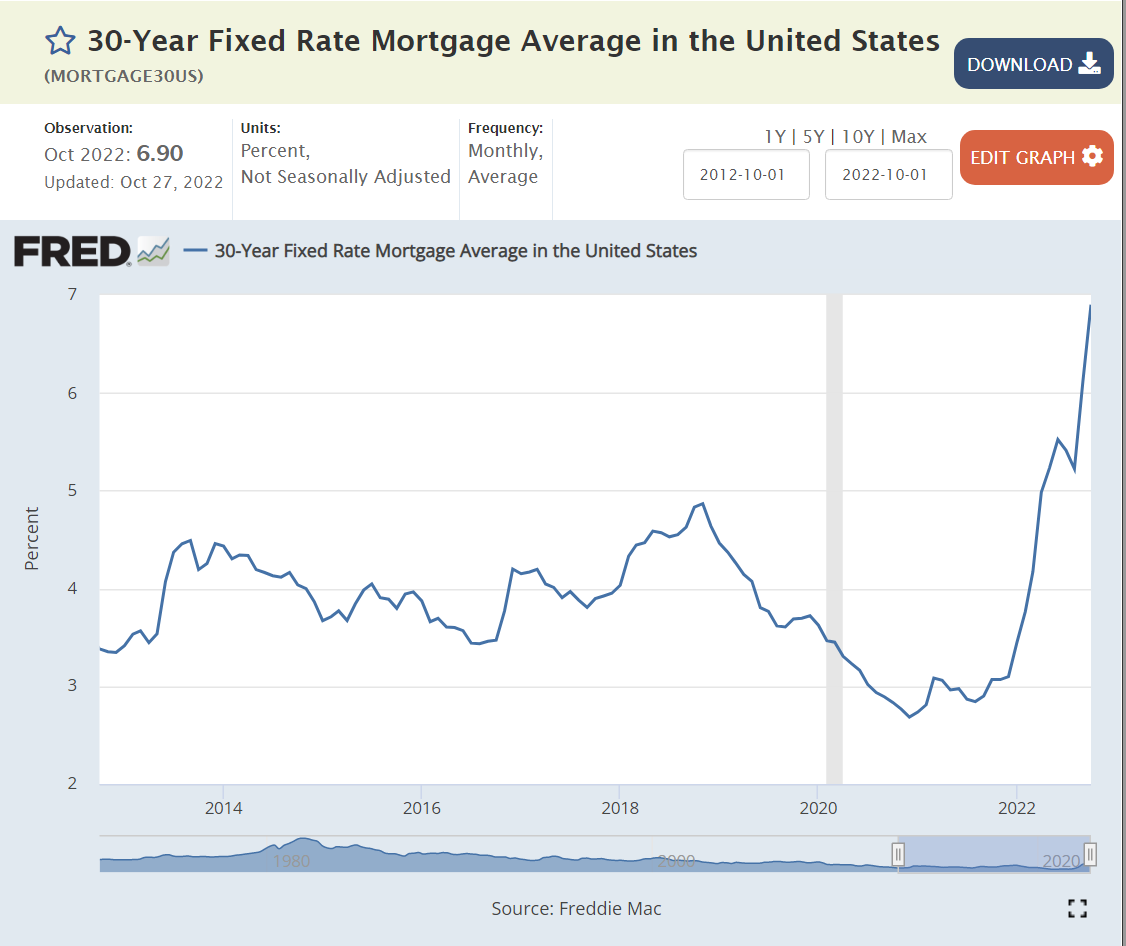
Most Americans today have fixed rate mortgages at 2.5%-3%-4%, locking in advantageous low mortgage payments for 10-30 years. New home buyers and those who must move and get a new mortgage do face 7% interest rates. Mortgage delinquencies are down by 80% and credit card delinquencies are down by one-third. Child poverty, after transfers, is at a record low.
Summary/Interpretation
The news media and politicians want to highlight the negative aspects of the US economy: higher inflation, lower personal savings rates, higher mortgage rates, higher home and apartment rents and prices (lower affordability).
It’s important to put all of the pieces in perspective. Inflation is higher and threatens fixed income and low-income households. Households are using up their extra pandemic period savings. The real estate market is slowing, but prices remain high. Economic growth is close to zero, so there are relatively fewer open positions and net new jobs created. There is a threat of a mild recession continuing through the second half of 2023. BUT …
The overall economy has quickly recovered from the pandemic and exceeded record pre-pandemic levels. Recall that the post-Great Recession recovery continued for almost a full decade. The economy recovered from the record pandemic lock downs and “lost jobs” faster than anyone expected.
Economic growth was low, marginally below the arbitrary 0.0% level in the first and second quarters, but recovered to 2% in the third quarter. Annual GDP growth is likely to be in the -1% to +1% level for the next 3-4 quarters as the Federal Reserve Bank’s increased interest rates work through the economy. We may have an “official recession”, but households will encounter limited negative effects.
The labor market is likely to continue its very positive status. Firms still have 10 million open positions that they expect will EACH deliver positive net economic results. We have a labor shortage. At some point, business Republicans will join Democrats to revise restrictive immigration rules and other policies that limit labor force participation.
Firms, businesses, retirement plans and state governments are in very solid economic shape. Assets are very high, liabilities are low. Net assets are at record levels. The Federal government budget deficit is back to the pre-pandemic level.
There is no evidence of a wage-price spiral of inflation. The president and most Democrats seem to accept the Federal Reserve Bank’s actions to increase interest rates, slow the economy and return inflation to its prior 30 years of modest 2%.
Behavioral economists have repeatedly shown that most people are much more sensitive to losses and risks than they are to economic gains. Hence, it is natural to focus on higher inflation and slower growth and discount the many other positive results.
The US economy quickly recovered from the severe pandemic recession with less collateral damage than anyone expected. The growth in the money supply and federal spending/transfers to ensure that we avoided a business, banking and personal meltdown drove a faster than expected recovery resulting in supply chain disruptions, labor shortages and inflation. The “experts” were slow to identify this situation and take offsetting policy steps. Fortunately, fiscal and monetary policy during 2022 have been tight, slowing the economy. We are in the difficult months of transition. No one knows if the steps taken so far are adequate, exactly right or too much. We need another 3 quarters to decide.
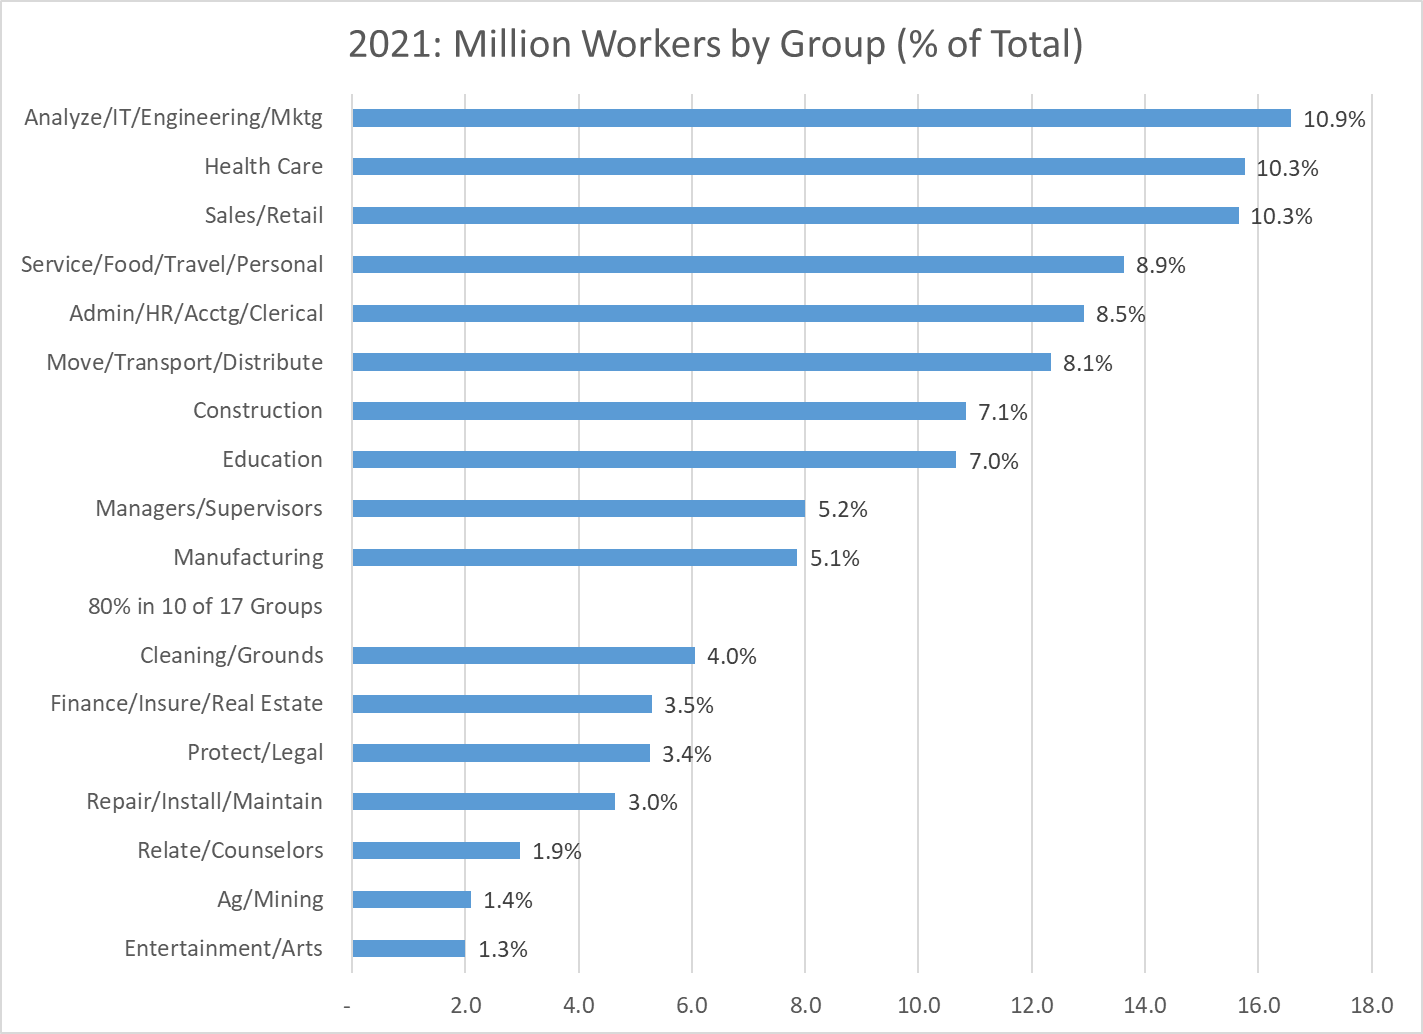
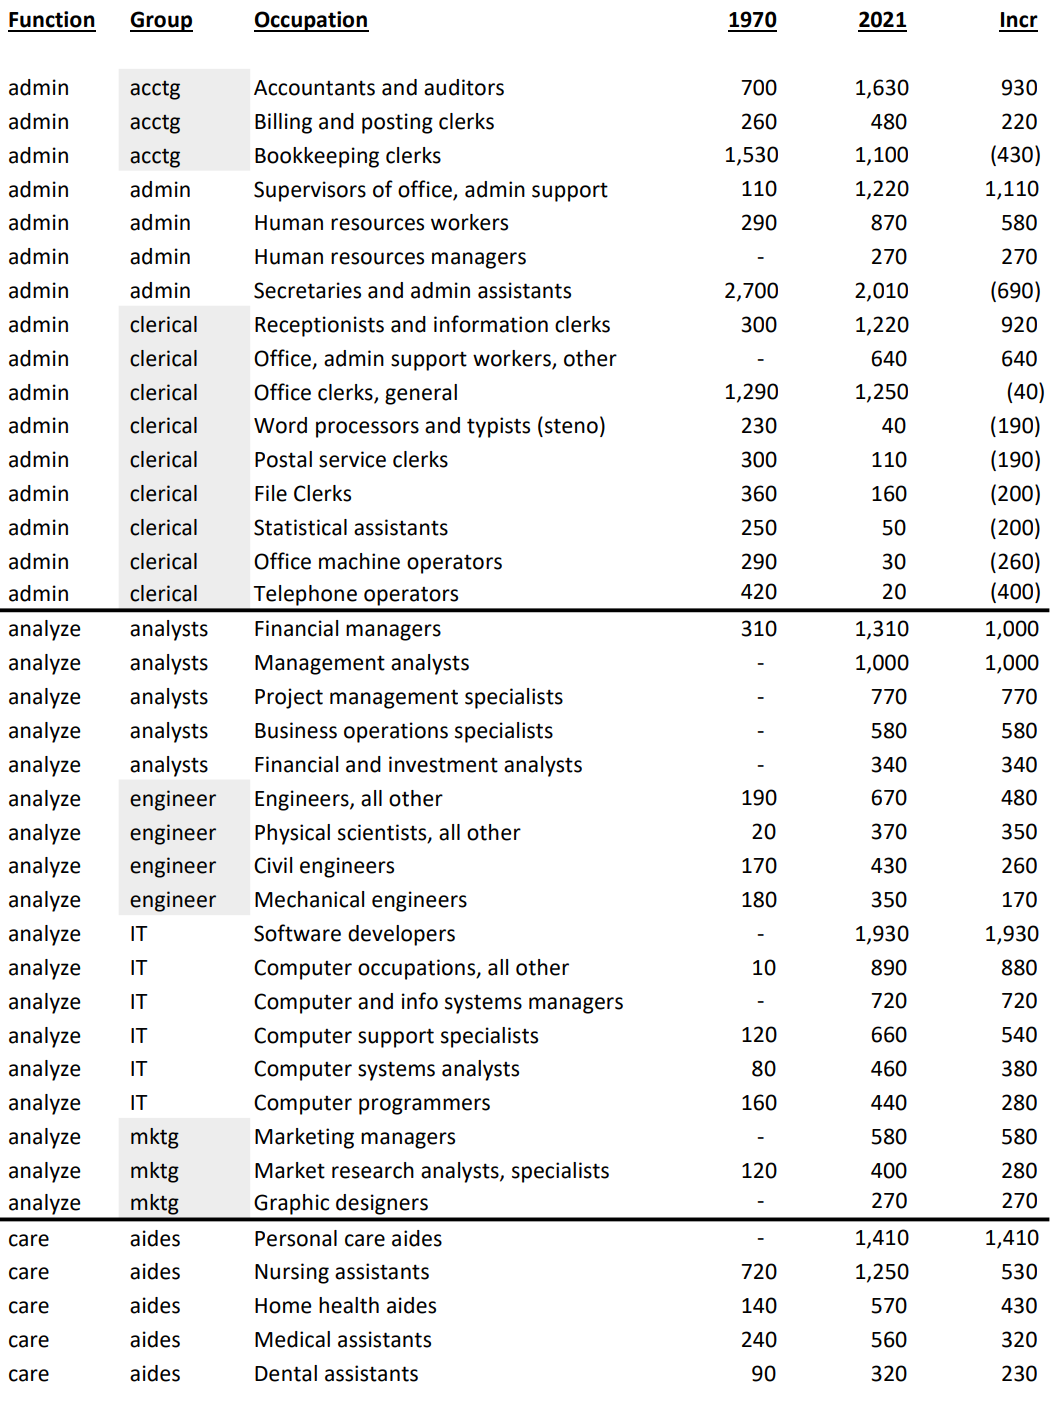
This is a follow-up article to my recent post on “A Very Robust Long-term US Labor Market (1970-2021). Rather than focus on total growth or the “skill-level” of jobs in the labor market, I want to focus on the roles or functions (like career clusters, similar to industries) played by the 150 million US workers in 2021. I’ve grouped the 500 detailed occupations into 17 categories so that we can look at subtotals ranging from 1% to 20% of the total, with an average of 16%. Enough detail to highlight the very significant changes in the last half-century.
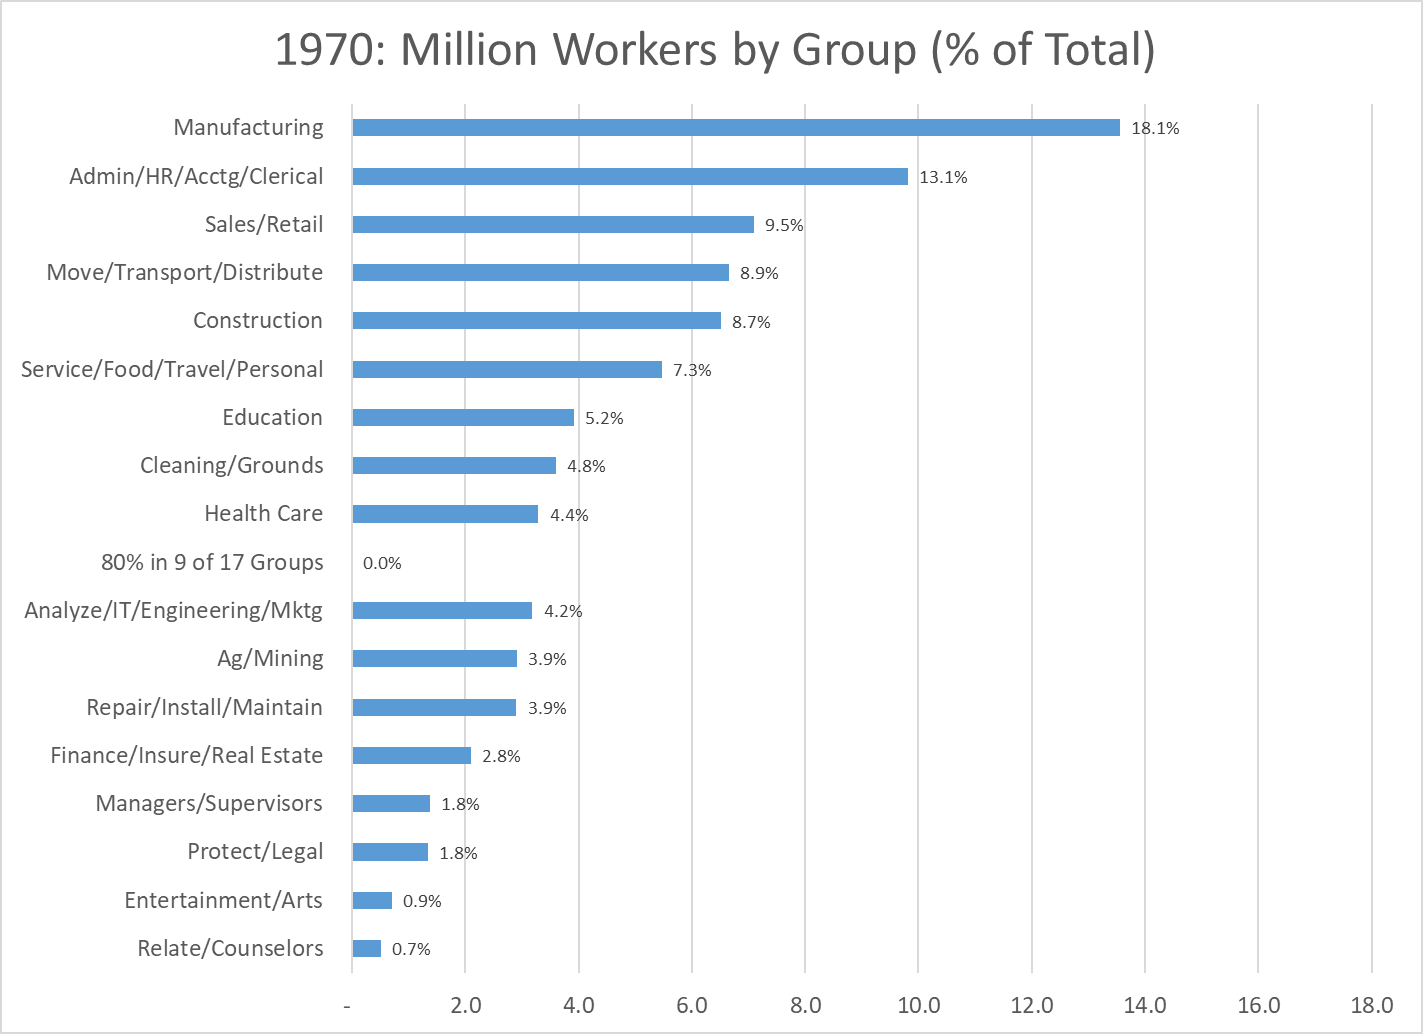
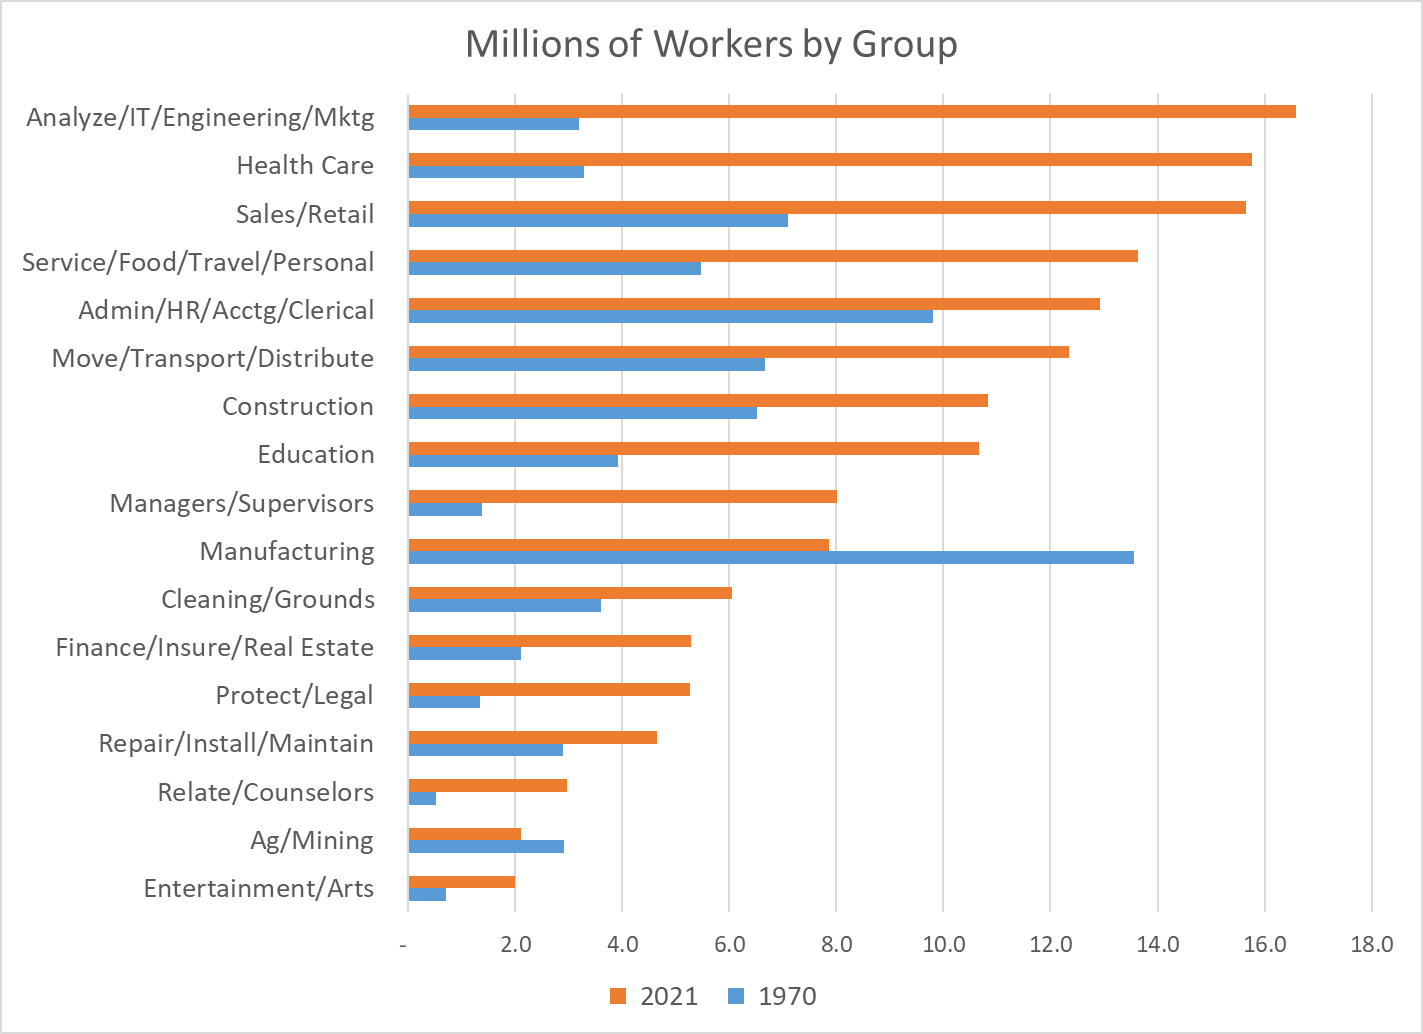
Let’s start with the 1970 data. 75 million employees. Manufacturing was the “big dog”, with almost 14 million workers, 18% of the total, a little less than one out of five.
Administrative workers, including clerical, HR and accounting staff at all job levels were the second largest group, with 10 million people and 13% of the total, one out of eight jobs. These two traditional categories accounted for 31% of the total, not quite one-third.
The next three groups each accounted for 9% of the total, one of every eleven employees. Sales workers, at managerial, professional and retail/clerical levels. Members of the logistics industry broadly defined, including both transportation and distribution staff. Employees of the construction industry. Once again, classic job functions in 1970 that would have been familiar in 1930.
The narrowly defined “service sector”, combining staff in the food service, travel and personal services industries contained 5.5 million workers, or 7% of the total. These six together included 70% of all workers.
Six other categories were each a much smaller 4-5% of the total: Education (KG-post secondary), Cleaning and Groundskeeping, Health Care, Analysis (finance, IT, operations, engineering and marketing), Ag/Mining and Repair/Installation/Maintenance.
The final five categories each averaged just 1.5% of total jobs: Finance/Insurance/Real Estate, Managers/Supervisors, Protection/Legal, Entertainment/Arts and Relating/Counselors.
By 1970 production agriculture had already declined to an immaterial share of the economy. The historically male and blue collar dominated Manufacturing, Logistics, Construction and Repair categories combined to account for 40% of all jobs; two out of five. The historically more female friendly Administration and Sales functions held 25% of all jobs, one in four. Education was the largest “information industry” at 5%, largely dominated by traditional elementary and secondary school teachers. A more broadly defined service group of food service, travel, personal service, cleaning/grounds and health care summed to 17% of the total, or one in six jobs.
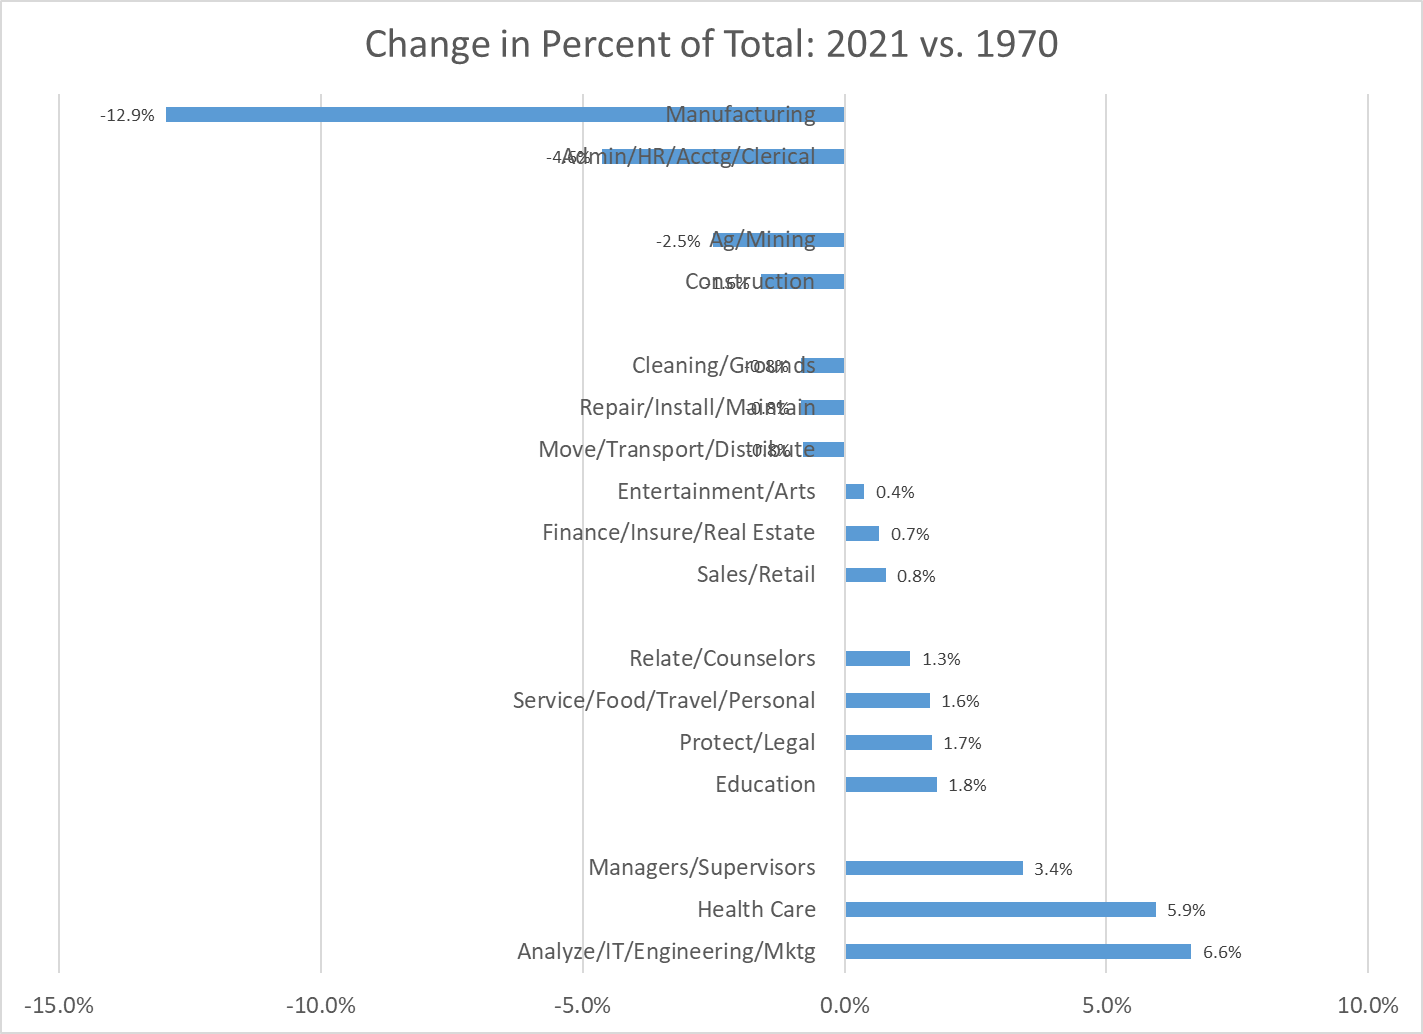
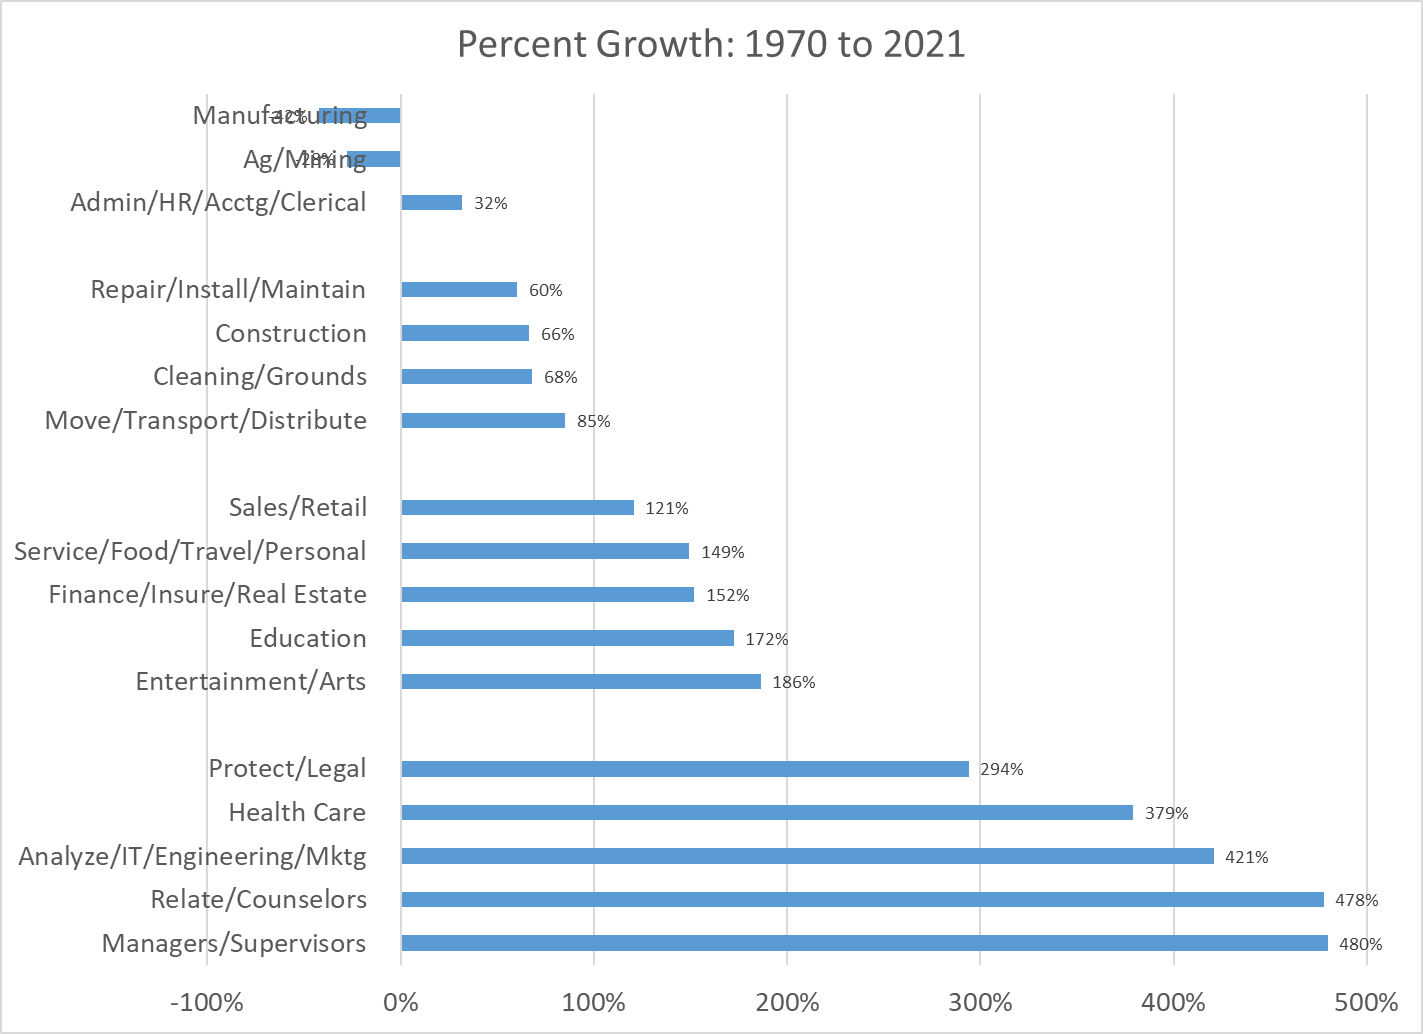
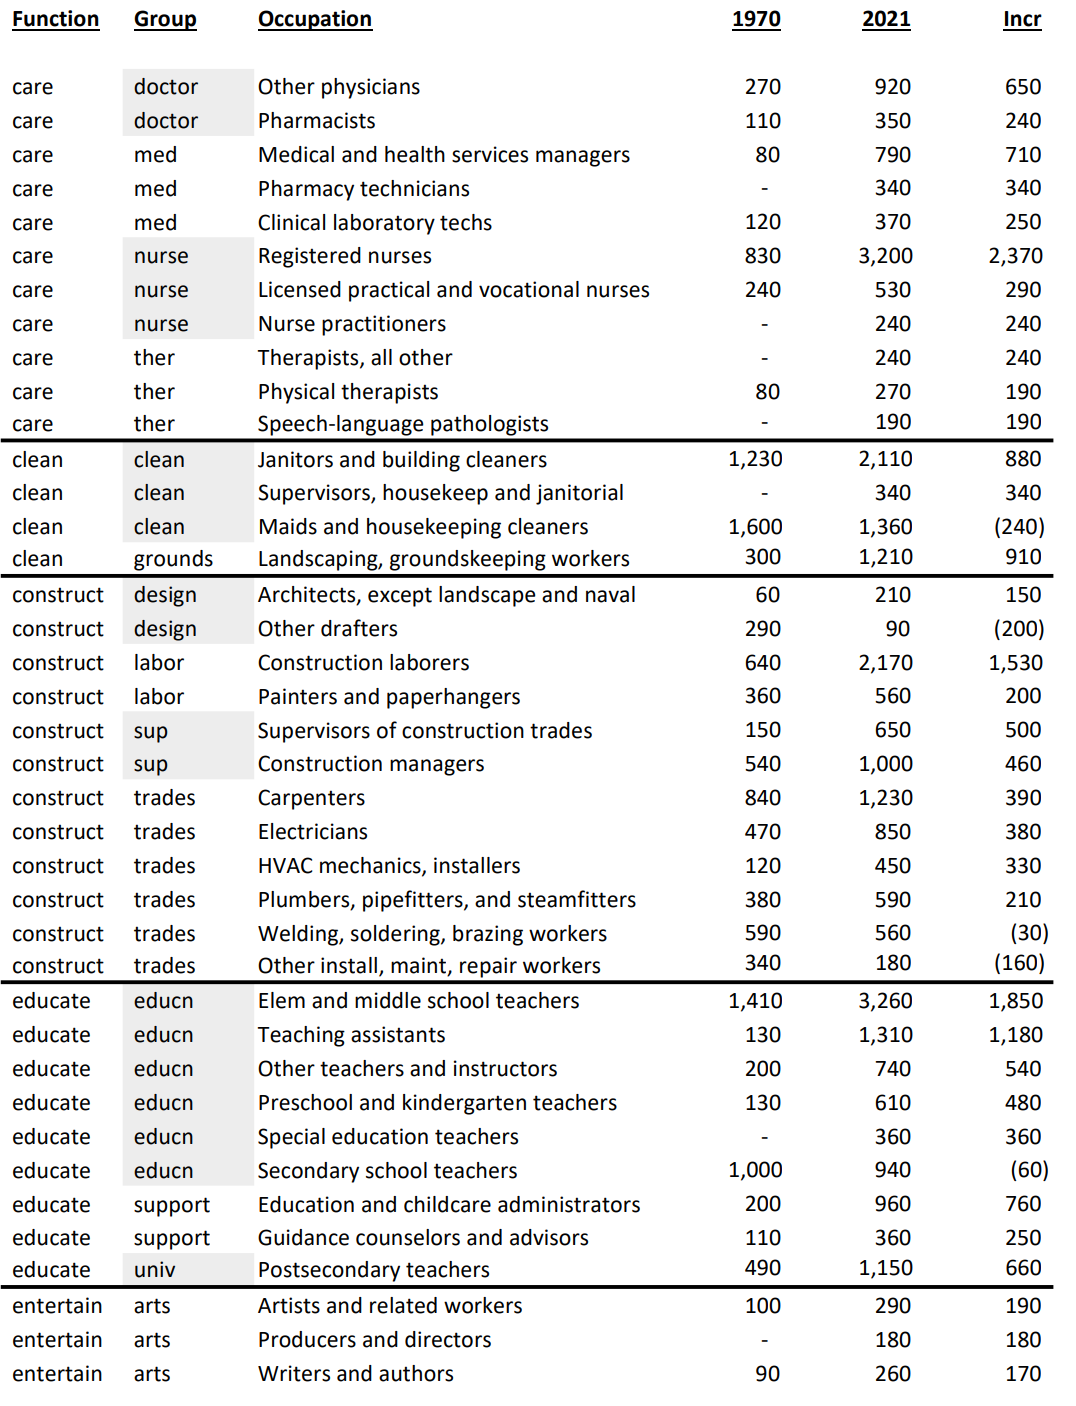
Six categories changed very significantly between 1970 and 2021. Manufacturing dropped from first place to tenth place, from 18% to just 5% of employment, from 14 to 8 million employees. US firms improved labor and overall productivity throughout this period, keeping the most productive firms and factories open, while closing and outsourcing work from the others. This was a tremendous change in the labor market, completed in just two generations of workers.
The Administrative category also declined markedly, from second place to fifth place, shrinking from 13% to less than 9% of total employment, but increasing slightly from 10 to 13 million staff. Process, computer and telecom changes drove improved productivity. Some administrative jobs were outsourced. While the Manufacturing sector lost two-thirds of its labor market share, the Administrative sector lost one-third.
The Ag/Mining group was the third losing category, dropping by nearly two-thirds from 3.9% to 1.4% of all employment. When politicians talk about “reviving” manufacturing, mining or production agriculture they are working against very strong long-term trends.
The largest growth was in the “Analysis” category, which grew by two and one-half times as a share of the total, from 4% to 10%. There was incremental growth in the existing Engineering sub-category, adding 2 million roles. The IT category grew added almost 6 million roles from a base near zero. The operations, finance, marketing analysis group added another 6 million positions to its base of 1.5 million. The “Analysts” category rose from tenth place to first place as firms became more complex and found ways to better employ the talents of individuals with high level analytical skills. At 11% of the economy, one out of every nine jobs falls into the analysis category.
Health Care increased from ninth place to second place, moving from 4.4% to 10.3% of all jobs (2.5X). The number of jobs grew by 13 million, from 3 to 16 million.
The Managers/Supervisors category climbed from fourteenth to ninth place, rising from 1.8% to 5.2% of the economy, adding almost 7 million jobs. The 1970 detailed coding was somewhat different from the modern approach, with many supervisors and managers grouped with other professions or industries. My best guess is that on a comparable basis, the 1970 category would have been closer to 2.5 million than the reported 1.4 million managers and supervisors. This would have put this group in thirteenth place in 1970. Hence, the growth as a share of the total market would be smaller, from 3.3% to 5.2%, but still quite significant. Once again, larger firms with more complexity demanded more managers and supervisors.
In total, we have 20% (1/5 workers) leaving the Manufacturing, Administration and Ag/Mining sectors and 16% (1/6 workers) joining the Analysis, Health Care and Managers sectors.
Comparing the millions of employees in 1970 to 2021 by sector clearly shows the massive changes in the labor market. The Health Care and Analysis sectors leapt from a small 3 million workers each to 16 million workers each. Manufacturing fell in absolute terms from 14 to 8 million workers. The Sales and Service sectors began as large sectors, so their relatively normal growth still added about 8 million roles each. Construction and Administration began as larger sectors and were able to add 3 million employees each, despite slower than average growth rates. Logistics grew slightly slower than the market, but added 6 million workers. Education grew faster than average, adding 6 million colleagues.
Relative growth rates as a percentage of the 1970 base or as a percentage of the total mostly tell the same story. Manufacturing, Administration and Ag/Mining have declined sharply. Analysis, Health Care and Management have grown materially.
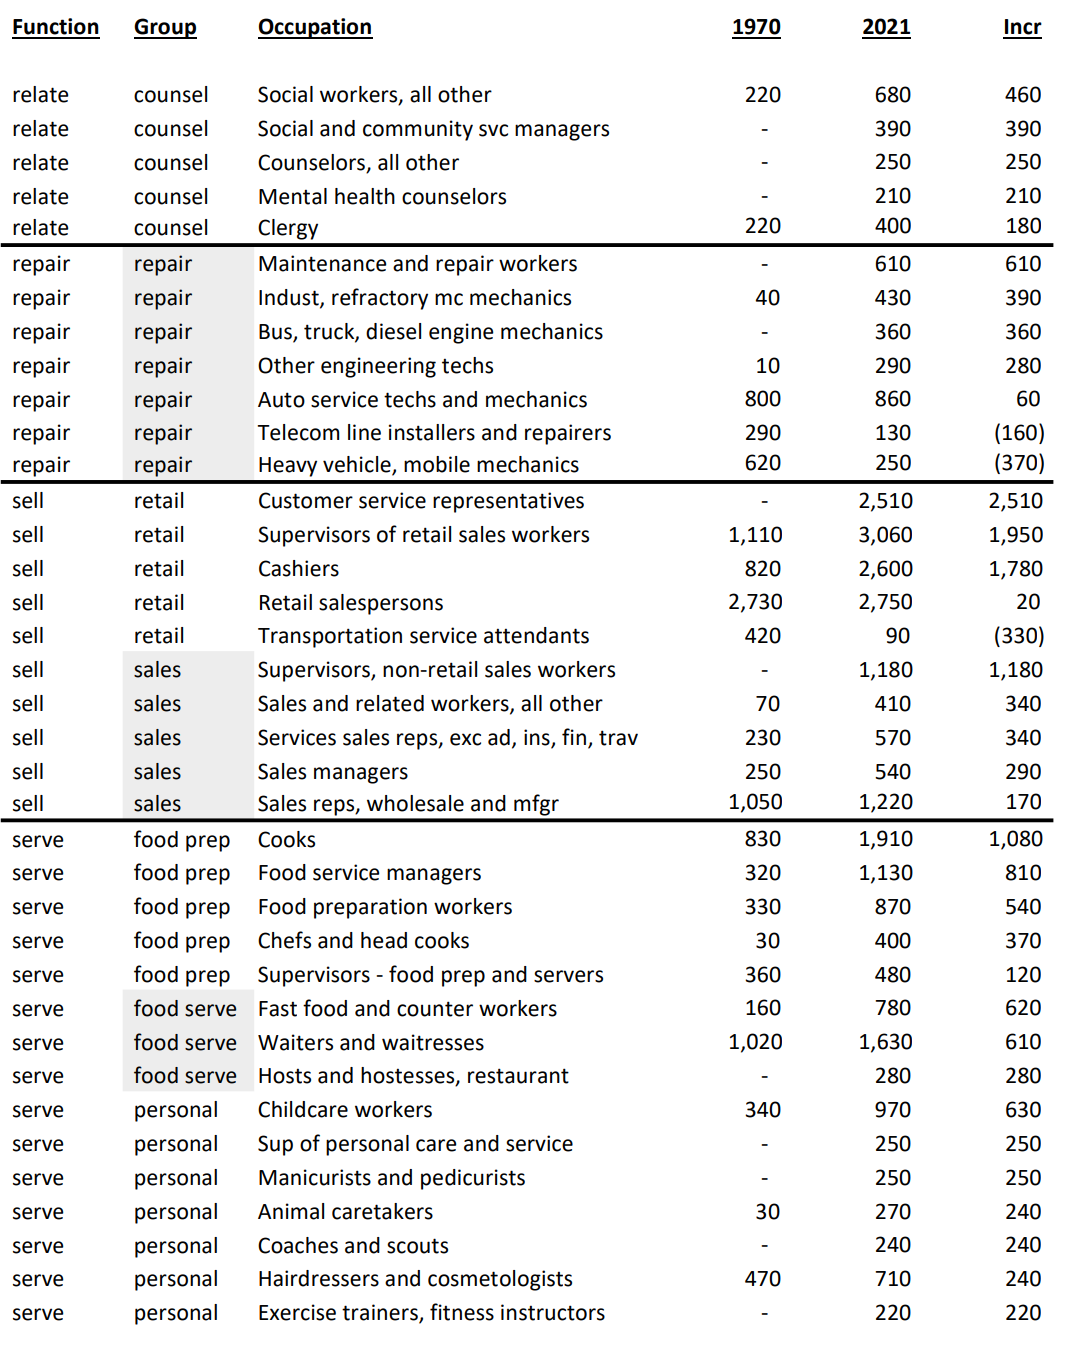
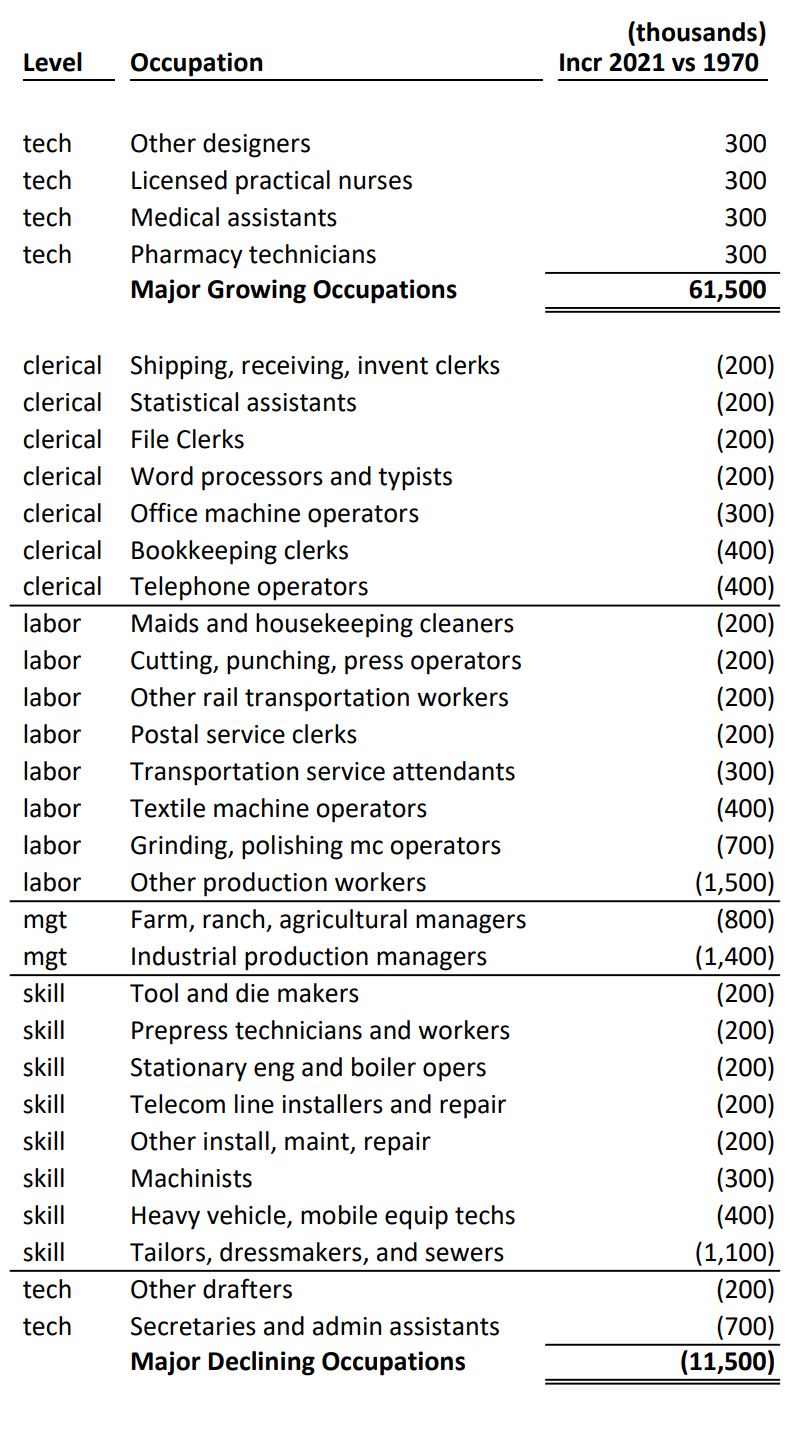
The 152 largest detailed occupations and those with the greatest change in employment are documented below. They account for 91 million jobs, 59% of the 2021 total.
Economists assert that the principles of comparative advantage drive national economic activity. In essence, nations, firms and individuals rationally do what they are “relatively” best at, which changes through time. We see this reduction in the role of agriculture, manufacturing and mining across long periods in the US.
Economists assert that consumers’ tastes change as they have higher income and the relative prices of goods change. Once basic “food, clothing and shelter” needs are met, people turn to other “needs” and “wants”. These tend to be “services” and we also see this transformation.
Economists assert that profit maximizing firms will employ labor that provides a return on the investment based on the marginal or incremental value added by the labor resource. In a more complex economy, professional and managerial skills are in greater demand. Firms (and not-for-profits and governments) have adapted very well to these major changes in the last 50 years.
These changes are not without major pain to individuals, firms and local economies. The general trends in the economy (more automation, greater trade/outsourcing, more services, more personal care, greater role for analytical skills) are clear. Nations, firms, individuals and regions that adapt to the trends will be relatively successful. This requires wise individual and political choices and investments.
A Dozen False Claims of Journalists, Analysts and Pundits
Job growth is too slow, there are not enough jobs.
All of the good jobs are gone, there are fewer good jobs.
The only growth has been in “low wage”, service jobs.
There are no “blue collar” jobs, no “hands-on” work is available today.
Jobs are all “dumbed down”, no real content remains.
Automation, computers and artificial intelligence are eliminating all jobs.
There is no room for advancement at work.
The economy is inherently stagnant, firms are unable to create new positions.
We’ve become a nation of shopkeepers.
There’s no hope for millennials in the job market, Boomers are leaving a disaster.
More and more jobs are subject to the “imposter syndrome”, they really do nothing.
This time is different, we have reached the “end times” for jobs.
The Data Says …
The US Census Bureau and the US Bureau of Labor Statistics attempt to measure the detailed occupations in the evolving US labor market. I have selected 1970 as a baseline because it is effectively prior to the “computer revolution” and within my lifetime of observing the labor market. The US economy was still essentially in the post WWII boom period with manufacturing clearly the most important industry in 1970. Prior to Japanese or Chinese competition. Prior to the “energy crisis” and environmental concerns. Prior to improved social, political and economic opportunities for women, racial and other minorities.
We had 153 million people working in the US labor market in 2021.
The total measures and the detailed measures are somewhat inconsistent between 1970 and 2021. But, they are adequate to make basic comparisons. The labor force doubled in 50 years. 75 million new jobs created! 15 million new jobs each decade. 1.5 million new jobs each year, on average.
The detailed occupation categories have also changed. The 500+ categories in 1970 are very different from 2021, but the basic measures are roughly consistent. I have mapped the 1970 categories onto the 2021 categories. In 1970, the “undefined” responses were in the 10% range and not reallocated back to the detailed occupations as is done currently. Self-employed individuals were measured differently. Managers and supervisors were measured differently. The current definitions are better aligned with the current jobs. The 1970 categories provided much more detail on the manufacturing sector.
Employment by Job Level
Total employment more than doubled.
The highest level “manager/supervisor” jobs category nearly tripled. 18 million manager/supervisor jobs were added between 1970 and 2021. In 1970, there were 10 million manager/supervisor jobs; 13%, or one out of every 8 positions. The newly added positions are 24% of the labor force in 1970. The 28 million current manager/supervisor roles are 37% of the total 1970 work force. Opportunity, indeed. In 2021 terms, manager/supervisor roles are 18% of the work force, more than one of every six positions.
Professional jobs (college degree plus required) also tripled, growing from 14 to 41 million, an increase of 27 million new jobs. This increase is 36% of the 1970 work force. The manager, supervisor, professional subtotal is 23 million in 1970 (31% of the total). It has grown to 69 million (3X) in 2021, reaching 45% of the labor force. The number of “premium” jobs tripled, while the share of “premium” jobs increased by almost 50% in this half-century. Good news, indeed.
“Skilled” labor jobs were flat across 50 years, declining as a share of total jobs by one-half, from 10% to 5% of the economy. However, their neighbor, technical jobs, increased faster than the economy, adding 10 million high quality positions. The combined skilled labor (trades) and technician/technical level positions increased from 15 to 25 million, overall. This two-thirds growth is slower than the overall labor market’s doubling. Hence, this job level decreased from 20% to 16%, or from one in five to one in six positions. This is a “glass half-full or half-empty” situation. The 14% of the total labor market growth for premium positions is offset by a 4% decline in middle skilled positions, resulting in a 10% increase of combined middle and premium positions as a percentage of the total.
Lower skill level jobs accounted for nearly half of all jobs in 1970; 37 of 75 million. They comprised a decreased 39% of the total in 2021, 59 million out of 153 million. A smaller share of “lower skill” jobs seems like progress. Yet, even here, we have a growing labor market, with 59 million jobs in 2021 versus just 37 million jobs in 1970; 50% more.
The “physical labor” category grew from 22 to 32 million jobs, but it declined from 30% to 21% of the work force. Relatively fewer jobs, absolutely more. The clerical workforce encountered a similar, but less extreme change, growing from 11 to 15 million jobs, but declining from 14% to 10% of the work force. The “service sector” grew twice as fast as the overall economy, increasing from 4 to 12 million jobs and from 6% to 8% of all jobs. The “service sector” is growing disproportionately, but it is a relatively small part of the overall economy, just 8% of the total in 2021.
In total, the lower skilled clerical, labor and service groups combined, grew from 37 million to 59 million positions, but declined from 49% to 39% of all jobs. I see this as progress and look forward to the next half century reducing this category to just 30% of all US jobs.
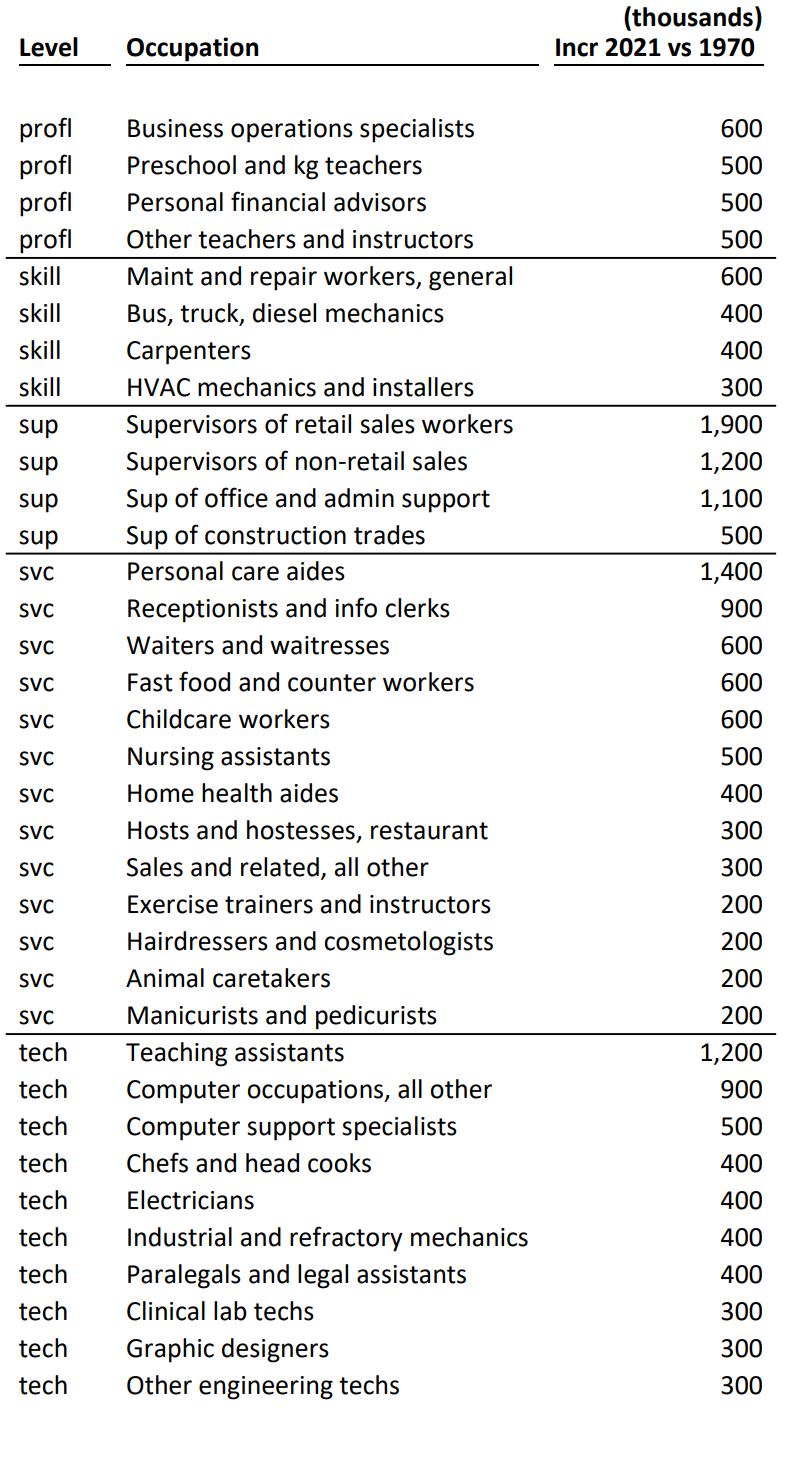
At the detailed level, we have 70 occupations driving 62 million new jobs, 82% of the 1970 base. We also have 27 occupations experiencing a 12 million jobs loss, 15% of the 1970 base. Joseph Schumpeter’s “creative destruction” model of a dynamic economy is validated. Changes in demand and technology eliminated 12 million jobs, 15% of the total, across 50 years. The US economy is capable of permanently destroying and replacing a quarter million positions each year, about one-fifth to one-third of one percent of total employment.
Let’s go back to the dozen negative claims. Is there support in the details? Are there “good” jobs being destroyed? I only see declines due to “natural causes”: improved IT, telecom, process/quality/manufacturing, international trade, railroad, textile automation/imports, ag productivity, printing and DIY office options.
On the upside, what do we see? Management and supervisor roles growing in all areas in a more complex environment with higher sales volume, more products, faster product introduction, more exports, more outsourcing of functions, greater customer demands in all dimensions, global sourcing and competition.
Technology supplemented/infused positions at all levels. Cashiers, customer service reps, distribution employees, tellers and drivers today leverage IT systems and processes.
Increased specialization/technical skill in many service/technical areas. Retail terminals. WMS. HRIS. EDI. Customer service scripts. Web based transactions.
Increased professional skills, sophistication and impact in all areas.
More professional teachers, nurses, analysts, accountants, lawyers, HR, real estate and financial advisors.
Diverse technical computer, automation, lab, design, legal, teaching, culinary and design technical positions.
More medical, food service and personal care service roles.
Summary
In the last 50 years the US labor market has doubled in size and added an increasing share of managerial/professional/technical positions.
In my next blog, I’ll focus on the next level of detail: 17 categories of the US labor market.
It’s time to revisit the state of the US economy. The media and stock market are overreacting to the positive news today that the US economy added about 250,000 jobs in September. Pundits and investors deem this as a “too hot” labor market which will drive higher inflation and force the Federal Reserve Board to further increase interest rates to slow the economy. We need to look at history, components of the economy and specific measures carefully to evaluate our position.
In a nutshell, the US Congress and President spent so much to offset the pandemic that we have classic inflation from higher demand and lower supply. At the same time, the Fed increased the money supply and lowered interest rates to zero to ensure that the banking sector did not provide a “credit crunch” to businesses or households. Foreign governments and banks acted similarly. This allowed the world economy to work through the pandemic with minor negative effects. However, the boost to the economy was too much and governments and central bankers were slow to reduce the stimulus they provided. The world was tightly focused on “recovering” to the pre-pandemic GDP and employment levels during 2021, so major changes in government spending and the money supply were not implemented until near the end of 2021. By the start of 2022, it was clear that growth was unsustainable and inflation was rising quickly, so policy makers needed to adjust. They have now done so and the impacts can be seen. So far, the economy is slowing, official recession or not, to low/zero growth and looks to remain at that level through the end of 2022 with low/slow growth expected in the first half of 2023.
We can call this a “soft landing”. We can call this a “growth recession”. We can call this a “recession” or a “recessionette”. There is no evidence of a “major recession” with 2% GDP declines or 3% unemployment rate increases or “50% declines” in housing starts or bank lending freezes or massive industry balances to liquidate or … Inflation is high and seems to have peaked. It is not coming down as quickly as most experts (or me) predicted during the first half of 2022, but many factors indicate that we are not in a self-perpetuating inflationary spiral.
With the benefit of hindsight, real GDP growth during 2018-19 was somewhat above trend and unsustainable. A 2% excess output doesn’t seem like much, but it does matter. The economy at the end of 2021 was in roughly the same place with 3.5% style unemployment. 4Q, 2021 was more than $1 trillion higher (5%) than 4Q, 2020. 5% real annual economic growth is very rare for a large, modern, developed economy. This was after the immediate pandemic bounce. The 3rd and 4th quarters of 2022 are likely to be reported as essentially flat with the 2nd quarter. Consensus forecast is near zero growth in the first half of 2023, returning to 2-3% growth in the second half.
US government budget deficit will be $2 trillion lower in the fiscal year ending September, 2022. This is good news. The “excess” spending was capped more than one year ago, so the trend rate is part of the current core economy. “Excess government spending” is not driving inflation today. It contributed to the inflationary build-up during 2021 into the first half of 2022 (economic stimulus works with a lag effect).
The increased money in consumers’ pockets lead to a 30% increase in purchases of durable goods. Consumers had money. They were afraid to consume in-person services. They bought stuff. They’re still buying stuff. The transition from buying goods to buying services has been slower than expected. This has led to extended supply chain disruptions (globally), higher demand for many commodities and increased goods prices which feed higher inflation and higher demand for labor. The total demand for durable goods has flattened and prices have stopped increasing. This is a much-improved situation from late 2021.
Consumers did save some of their extra earnings during 2020 and the first half of 2021, but as prices increased and services became available, consumers chose to spend more and reduce their savings rate down to just 4% of income, well below the 7-8% of the prior expansion period. So, part of the “excess demand” in late 2021 was the drawdown of savings. That cannot happen again. It’s possible that low consumer confidence will reduce spending in the next year, but flat spending is more likely.
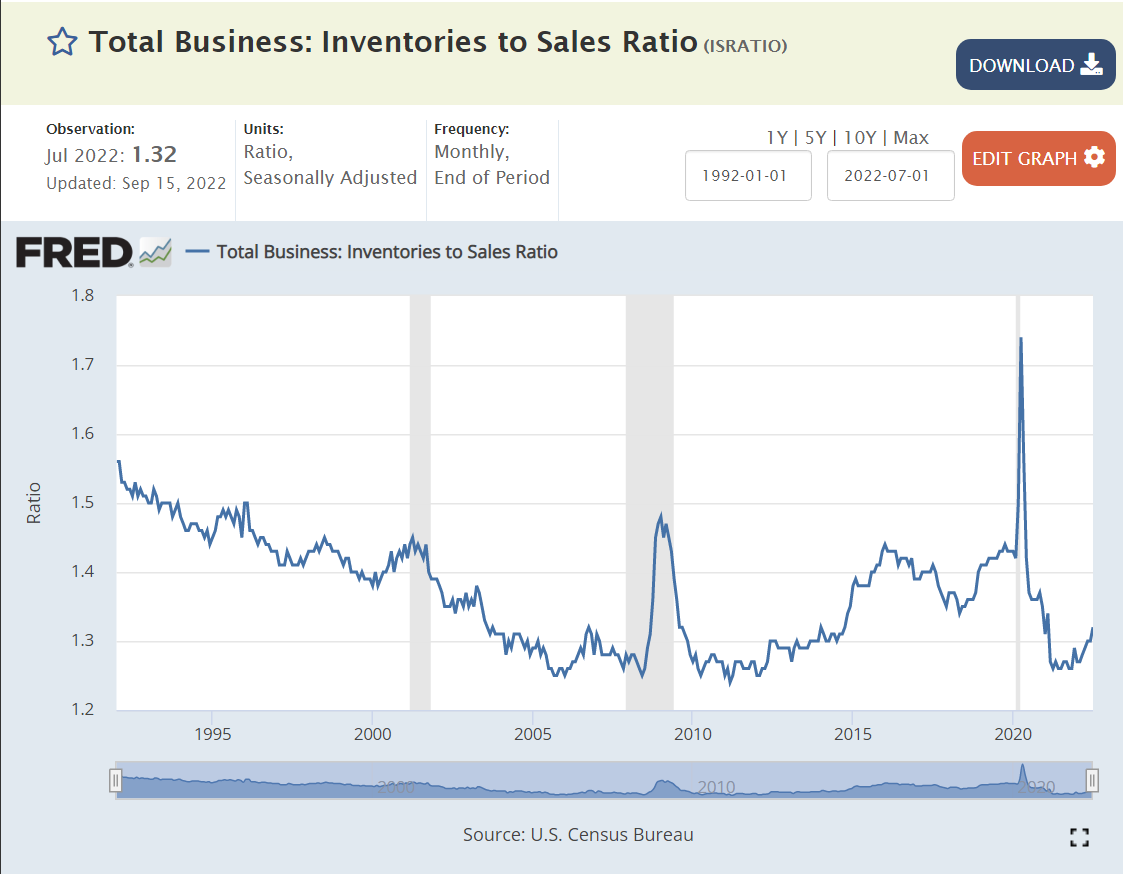
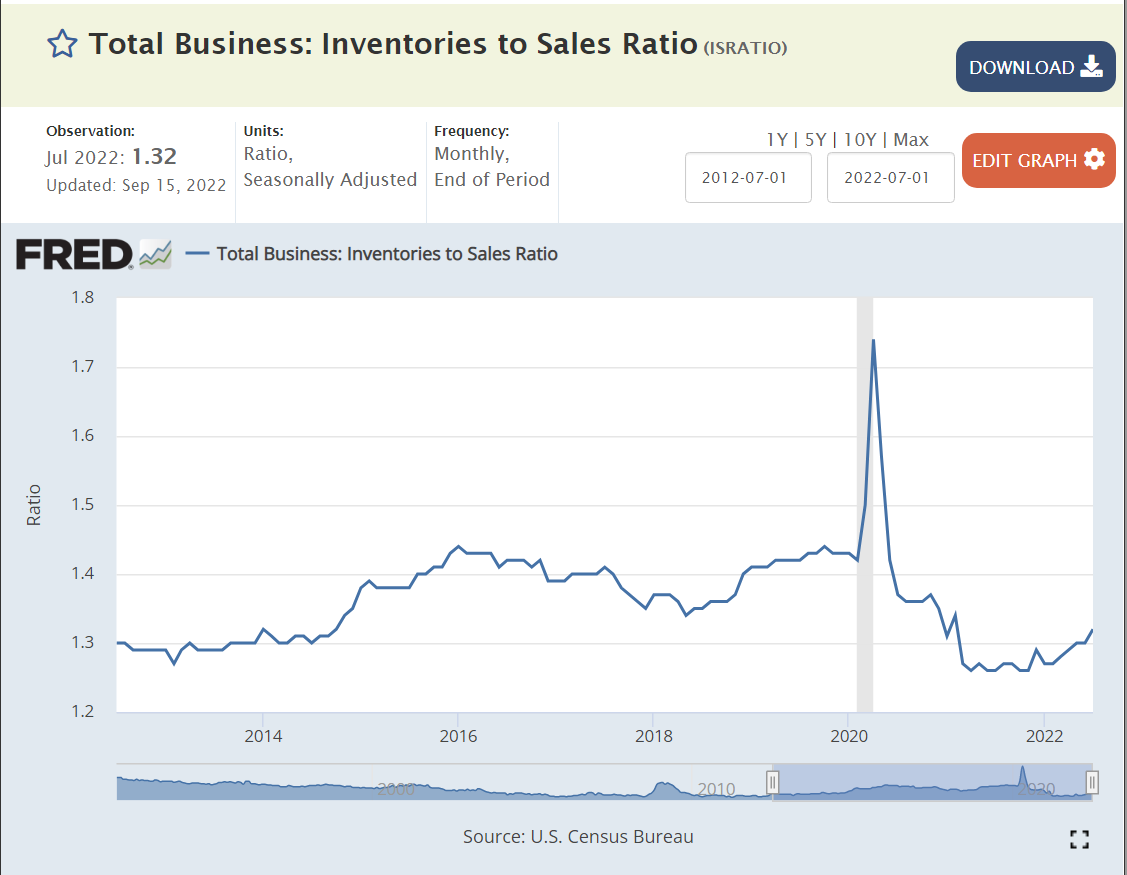
Most business cycle recessions show a clear build-up and subsequent liquidation of business inventories. Inventories were reduced (involuntarily) in the recovery from the pandemic and have increased a bit since then. There is no current indication of a pending “inventory recession”. In a “zero growth” retail holiday sales season, there will be some eternally optimistic retailers that have to cut prices to move goods, but this happens nearly every year.
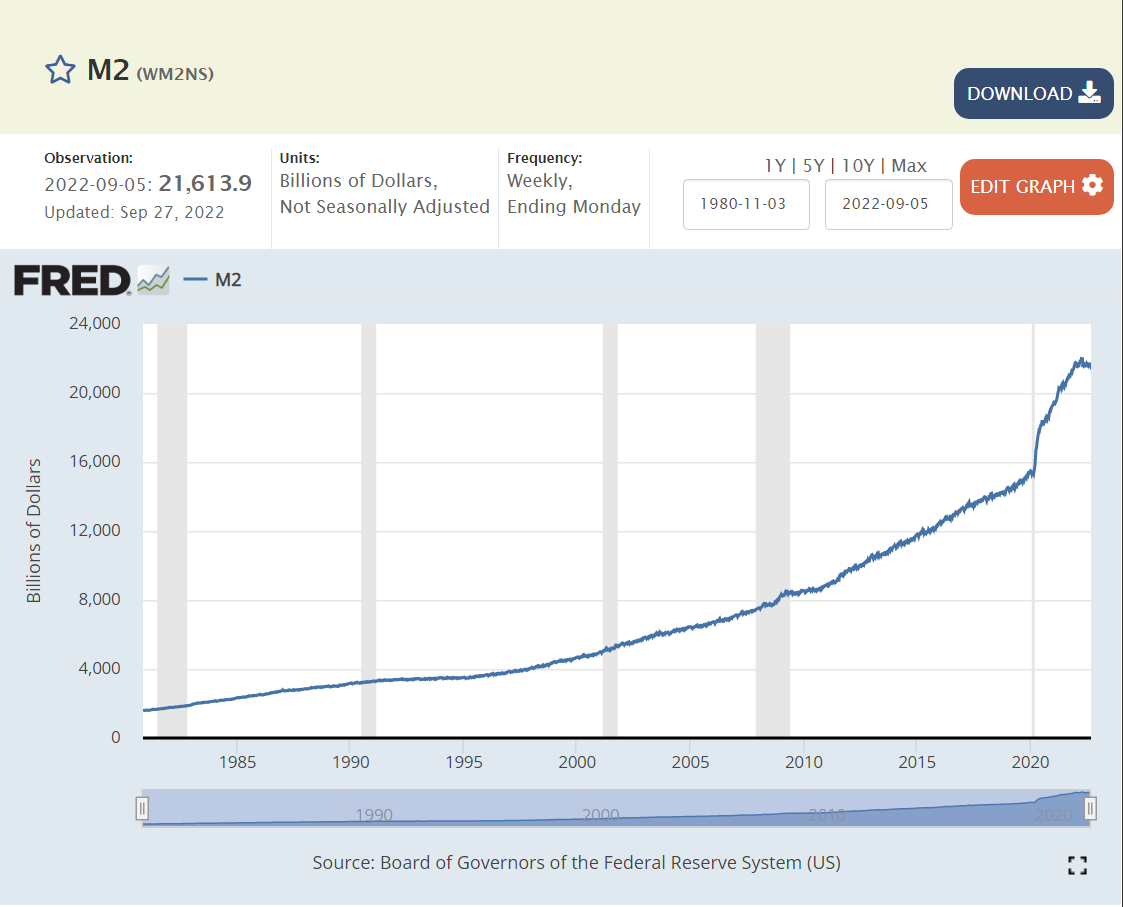
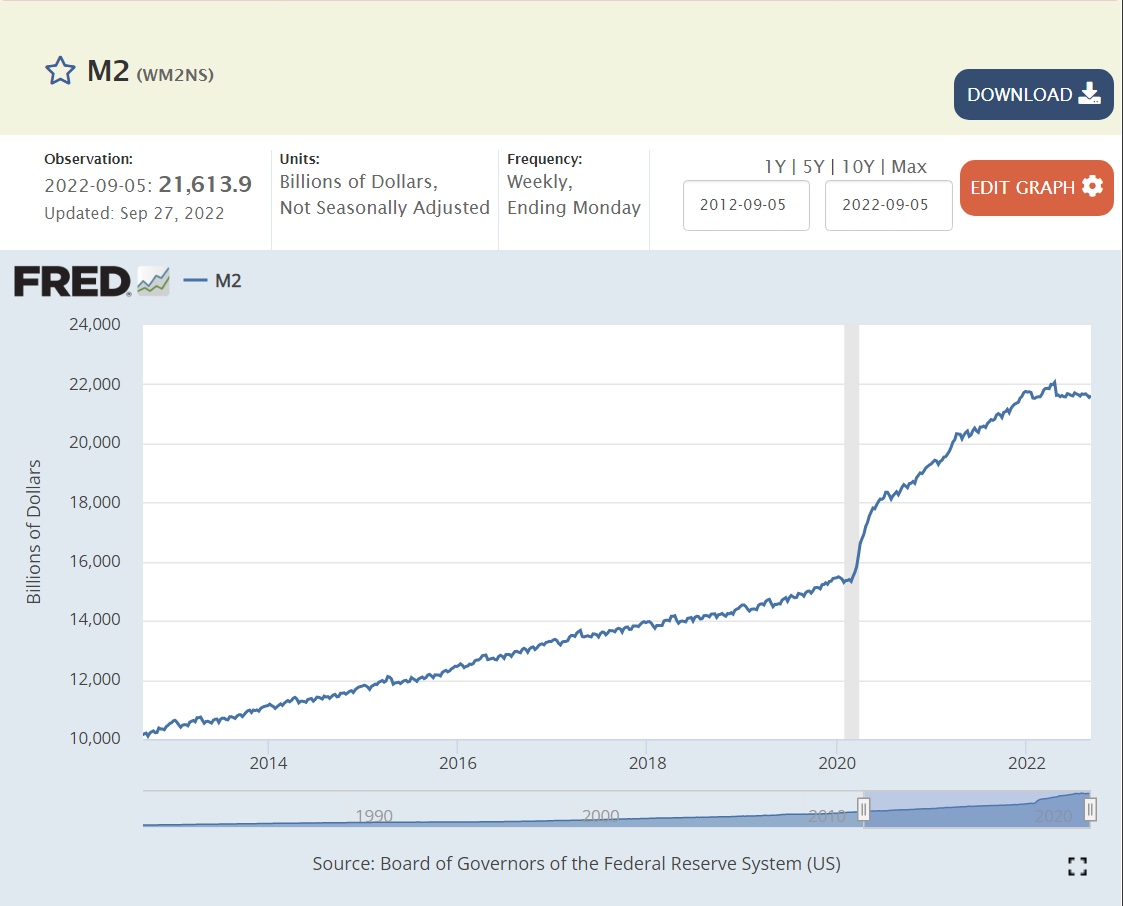
The Fed increased the money supply by an historically unprecedented 25% in response to the pandemic. And then by another 10% during 2021. In hindsight, the 25% was too much and the extra 10% was irresponsible. Fortunately, the money supply growth ended by the fourth quarter of 2021 and has remained flat.
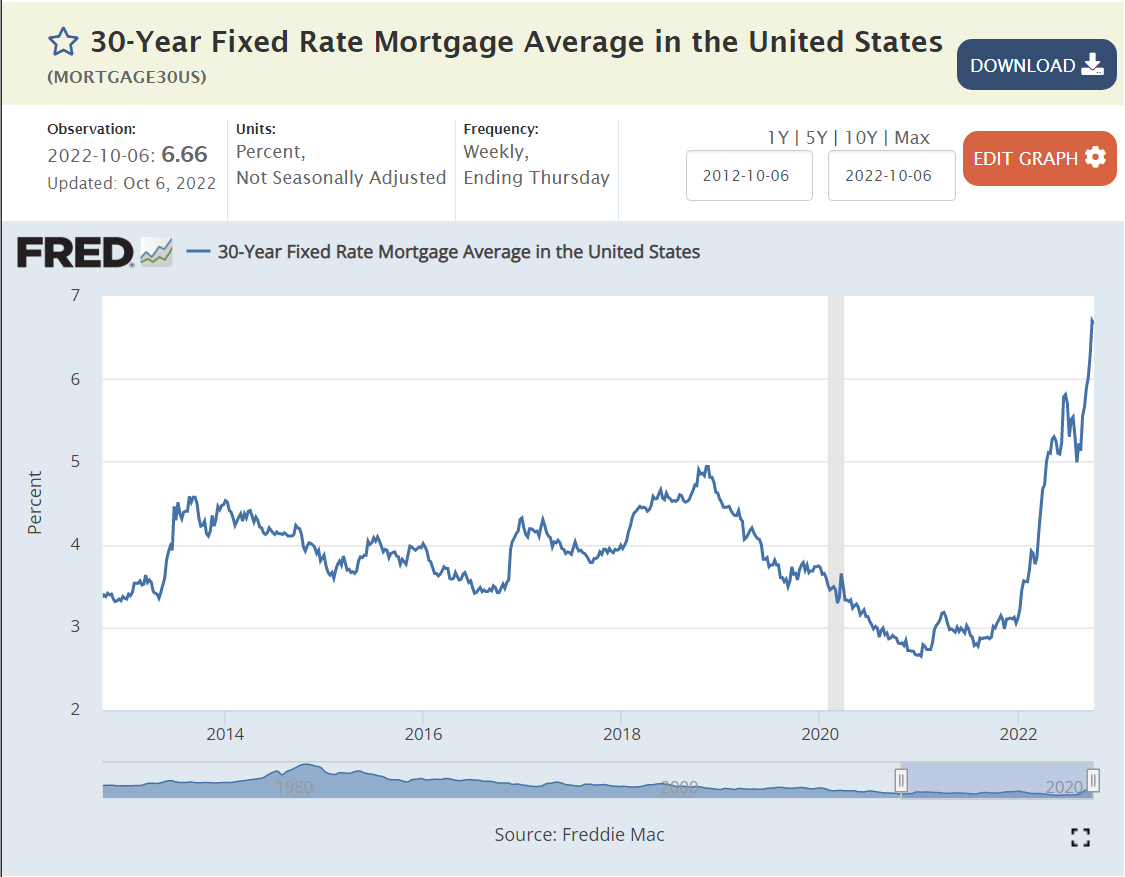
Mortgage rates were held to less than 3% for 2 years to support the recovering economy. They have now more than doubled, in excess of 6%. These higher interest rates will slow economic activity in many dimensions: lending, home buying, consumer credit, consumer spending, business investment, risk taking, stock prices, etc. Higher interest rates work with a lag to slow economic activity. They were still at “crazy low” rates at the end of 2021. The impact of higher rates is now being felt.
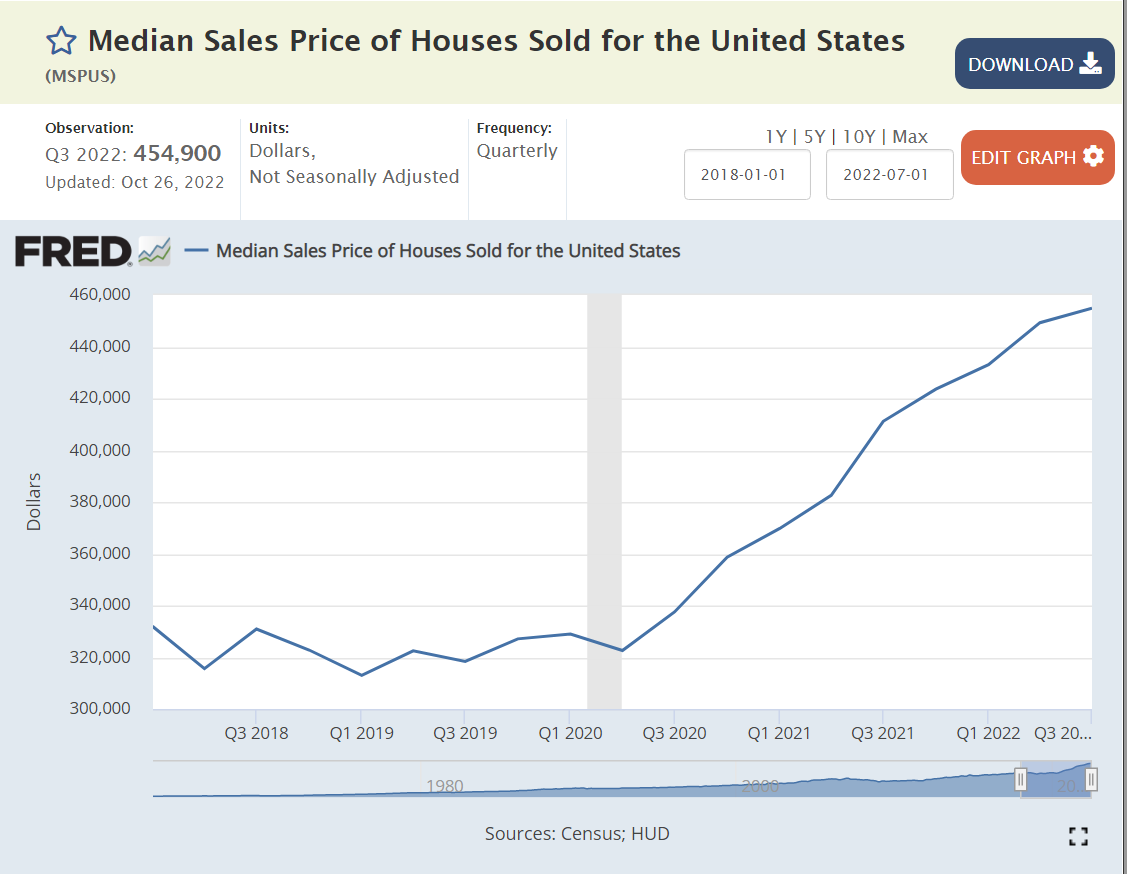
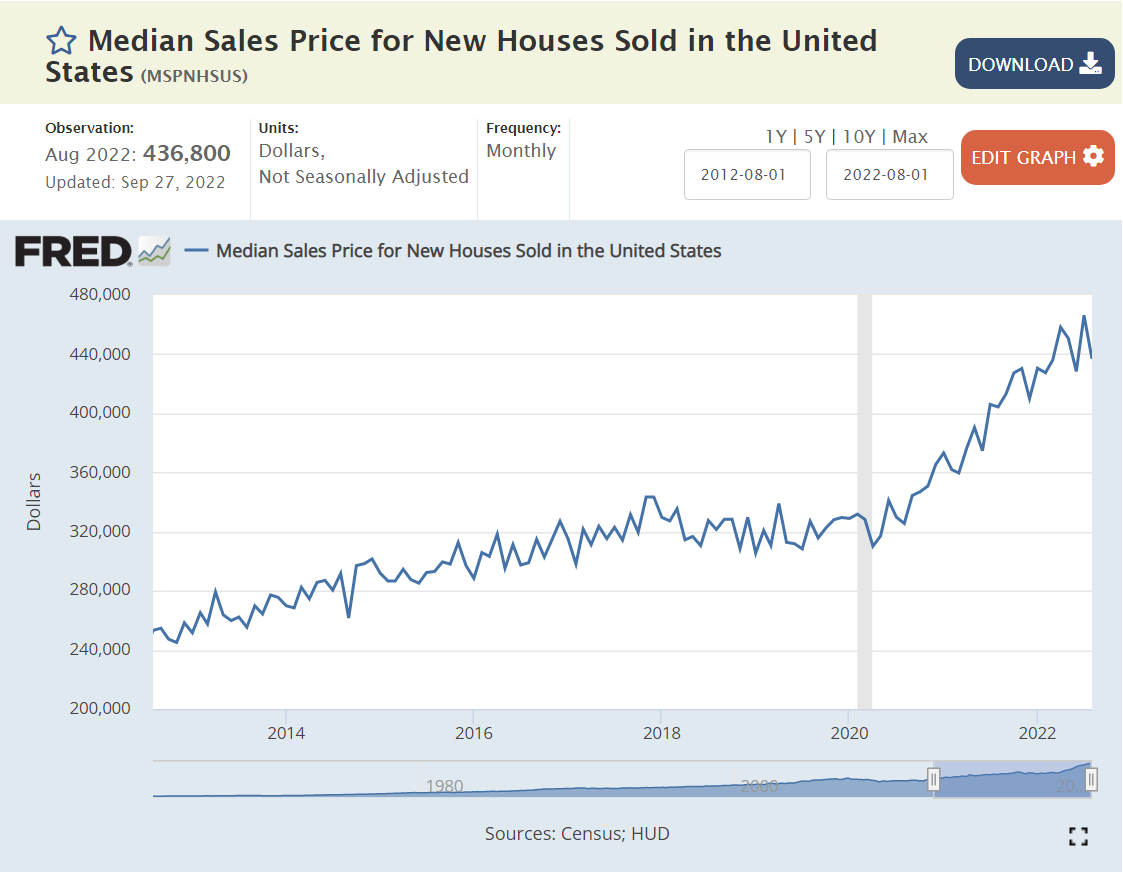
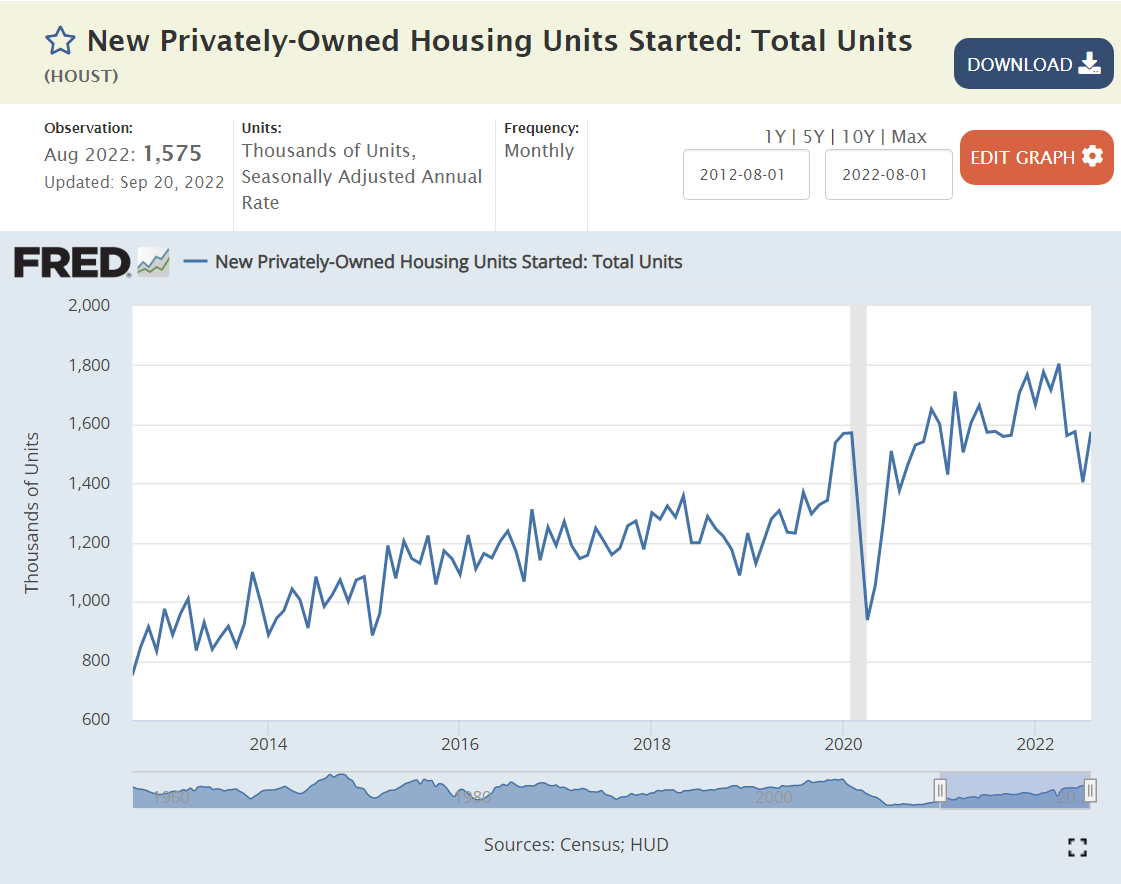
With extra savings, higher earnings, lower unemployment, restricted services available and historically low mortgage rates, consumer demand for housing grew rapidly while supply increased marginally. Housing prices (and rents) grew by 30%. Demand has now slowed. Housing inflation has slowed, perhaps to zero. This is a major channel through which GDP is decreased and inflation is reduced. Home purchases usually trigger thousands of dollars of additional move-in and fix-up expenditures.
Housing sales and new housing starts have adjusted to the new interest rate environment. Note that the level of new housing starts remains above the pre-pandemic level, so some further decline is possible in the second half of 2022.
The US and global stock markets very quickly rebounded from the initial pandemic fear levels (-25%) back to the pre-pandemic levels which were more than 10% above the 2018-19 trend line. Stock markets increased after the initial pandemic recovery by 50% in line with growing profits. They have since dropped by one-quarter, a combination of lower expected future profits and higher interest rates increasing corporate financing costs and the cost of equity investors’ funds. Lower stock market prices usually have a negative “wealth” effect, with nominally poorer investors spending less in the current economy.
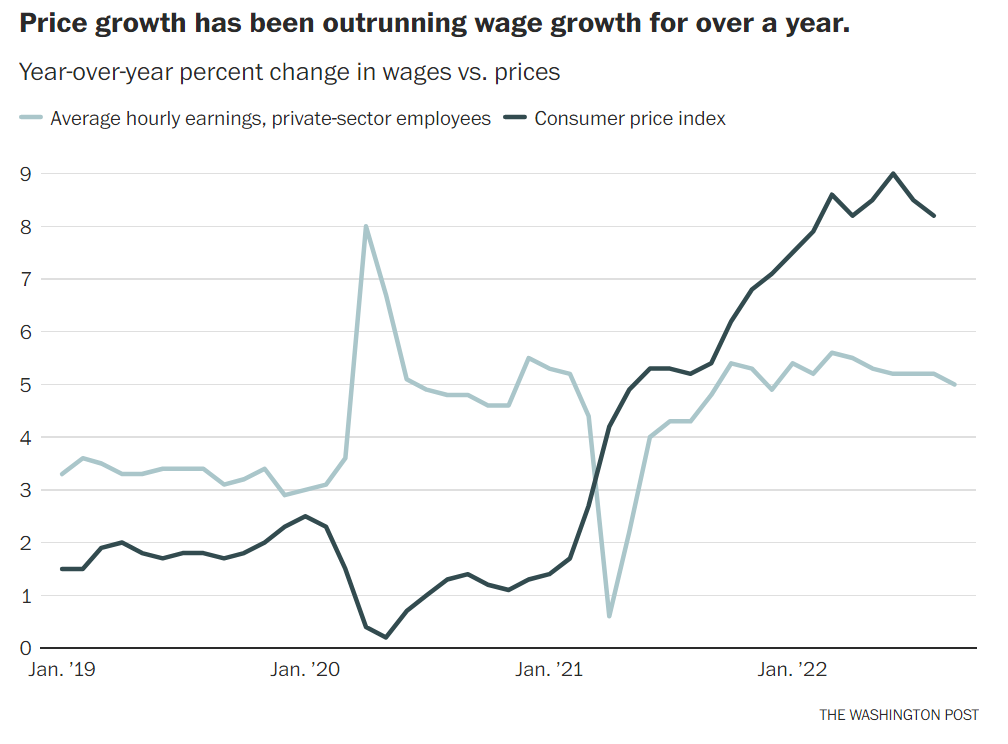
By the second quarter of 2021 we started to see 7-10% annual inflation rates. Increases finally slowed (or stopped) in the last 2 months. Reported inflation on a 12 months apart basis will remain above the 2% target level for the next 9 months, as high monthly inflation during the end of 2021 and the first half of 2022 remains in the measurements. Experts have a wide range of inflation forecasts for the first half of 2023, ranging from 3% to 8%. Most expect inflation to be close to the 2% target by the second half of 2023.
Producer price increases followed the same general pattern as consumer prices. They appear to have reached their peak. Producer prices better reflect global prices, especially the higher price of most commodities. Note the 30% increase in US demand for durable goods.
Global energy prices played a significant role in recent inflation. The last few months displayed an easing of prices, but recent OPEC+ decisions to reduce output indicate oil prices rising some again.
Job openings were at a historical high before the pandemic and quickly returned to that level by the end of 2020 and then nearly doubled in the next year+ as businesses saw opportunities to profit from the expanding economy, but could not find workers at the somewhat elevated prevailing wage rates. The number of unfilled jobs has dropped by nearly 2 million recently, from 12 to 10 million. The labor market is returning towards “normal”, but with 10 million open positions, the number of net new positions added is likely to increase throughout the fourth quarter, even as the Fed attempts to slow the overall economy.
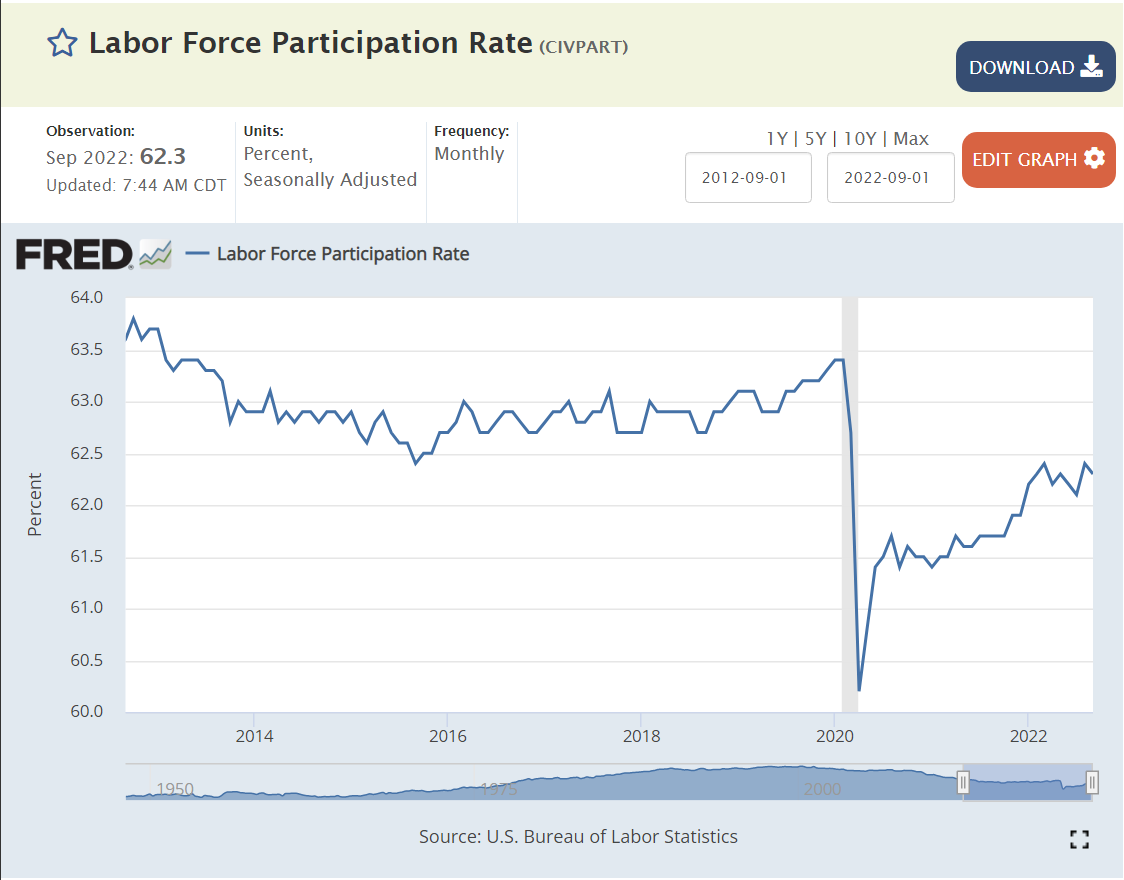
The US labor force participation rate slid from 67% to 66% to 63% from 2000 to 2009 to 2015. It dropped by 1.5% due to the pandemic (61.5%) and has since partially recovered to 62.3%, still a full 1% below the recent peak rate just before the pandemic. The labor market recovery has been good, but not great.
The core, 25-54 year old labor force participation rate has increased by 1.5% since the pandemic to more than 82.5%, less than one-half percent below the recent high of 83% before the pandemic. By this measure, the labor market is recovering nicely, but not completely.
Retirement age workers have not returned to the work force, with more than 1.5% of potential workers choosing to not join the labor market. Employers will need to be more innovative to attract workers back into the labor market.
Summary
The economy is slowing down, inflationary pressures are easing, but the labor market still looks strong. Slow to zero growth for the prior (3rd) and next 3 quarters is likely as inflation falls from 7-8% to 2-4%. Unemployment rates may increase, but it appears that the total number of employees will increase slowly during this low/zero growth period.
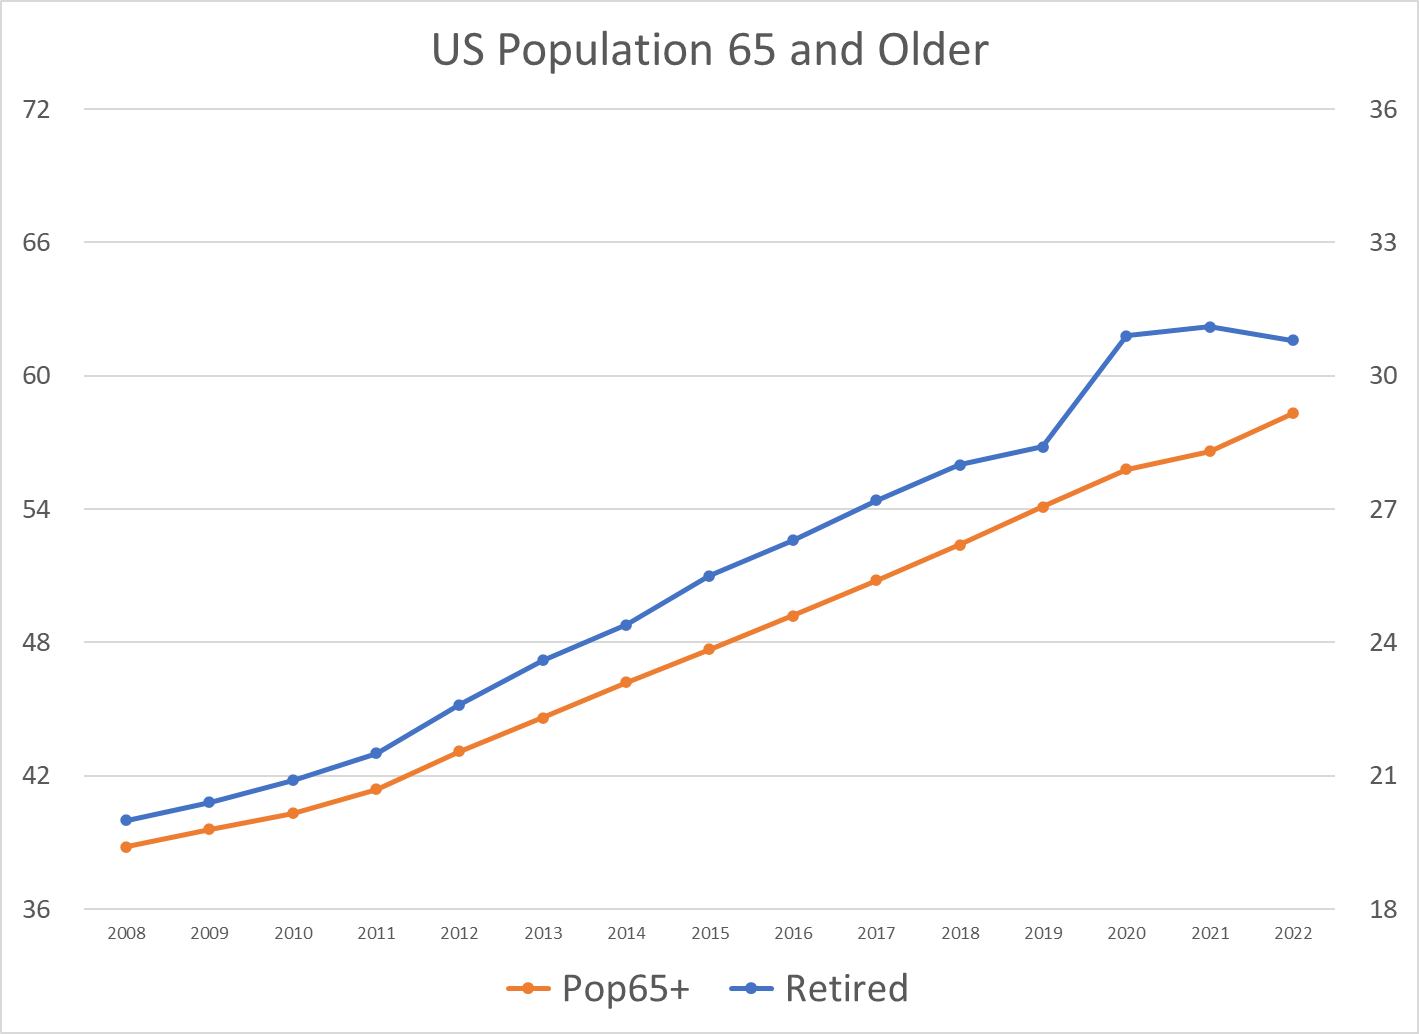
The number of retirees, aged 65+, has increased by more than 50% since 2008, from 20M to almost 31M.
The retirement age population has grown by 4% of the total population in the last 14 years.
The retired 65+ population has grown a little faster than the total 65+ age group. The initial pandemic impact in 2020 was a 5% increase in the retirement rate, indicating about a 2.6M increase in early retirements in 2020.
The retirement rate in 2020 was about 2% higher than the trend, indicating an extra 1.2M extra retirees. The percentage of retired individuals has since fallen back below the trend line.
Later estimates indicated about 1M early retirements, and then a reversal in late 2021 – 22 as individuals chose to defer their retirements due to the uncertain economic conditions.
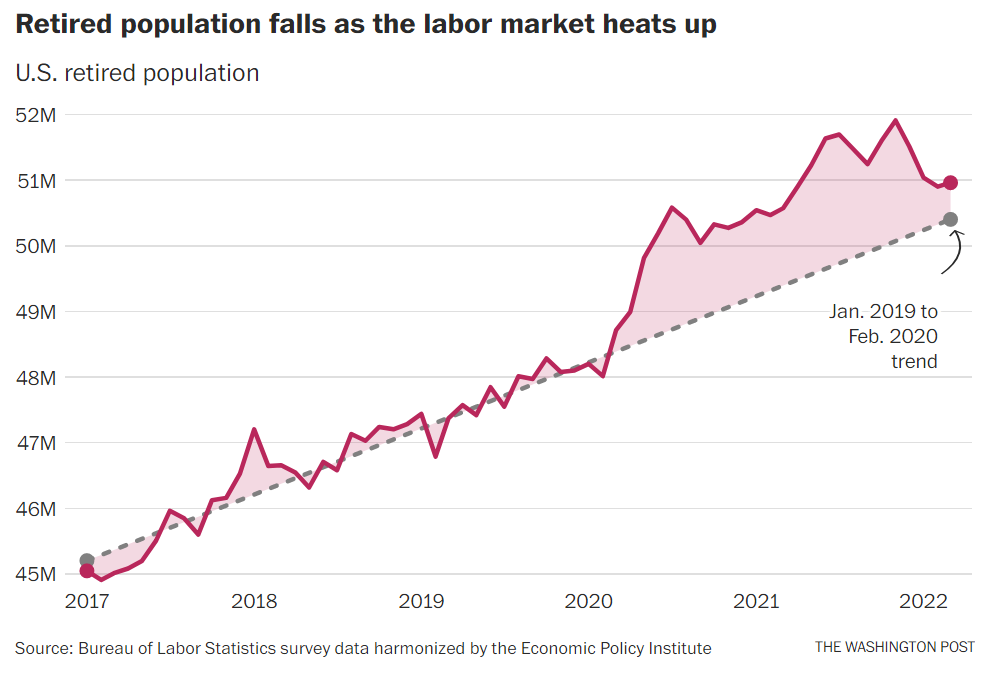
Bloomberg noted that new Social Security filings did not increase, so even though there were some retirement candidates with adequate resources to delay claiming Social Security benefits, it was unlikely that there were 3M extra early retirees.
CNBC documented the late Pandemic swing towards more potential retirees deferring this step.
The Washington Post’s approach shows a peak of 2 million extra retirees, falling back to about one-half million in 2022.
Summary
The US economy, political system and social norms have supported the number of aged 65+ retirees growing from 20 million to more than 30 million since 2008. Some of the increase in “retirees” at the start of the pandemic was not voluntary and some retirees have returned to work in the last year as the labor market remains tight and workers worry more about economic conditions. However, overall, an extra 10 million individuals have chosen to retire from active employment and enjoy their retirement years.
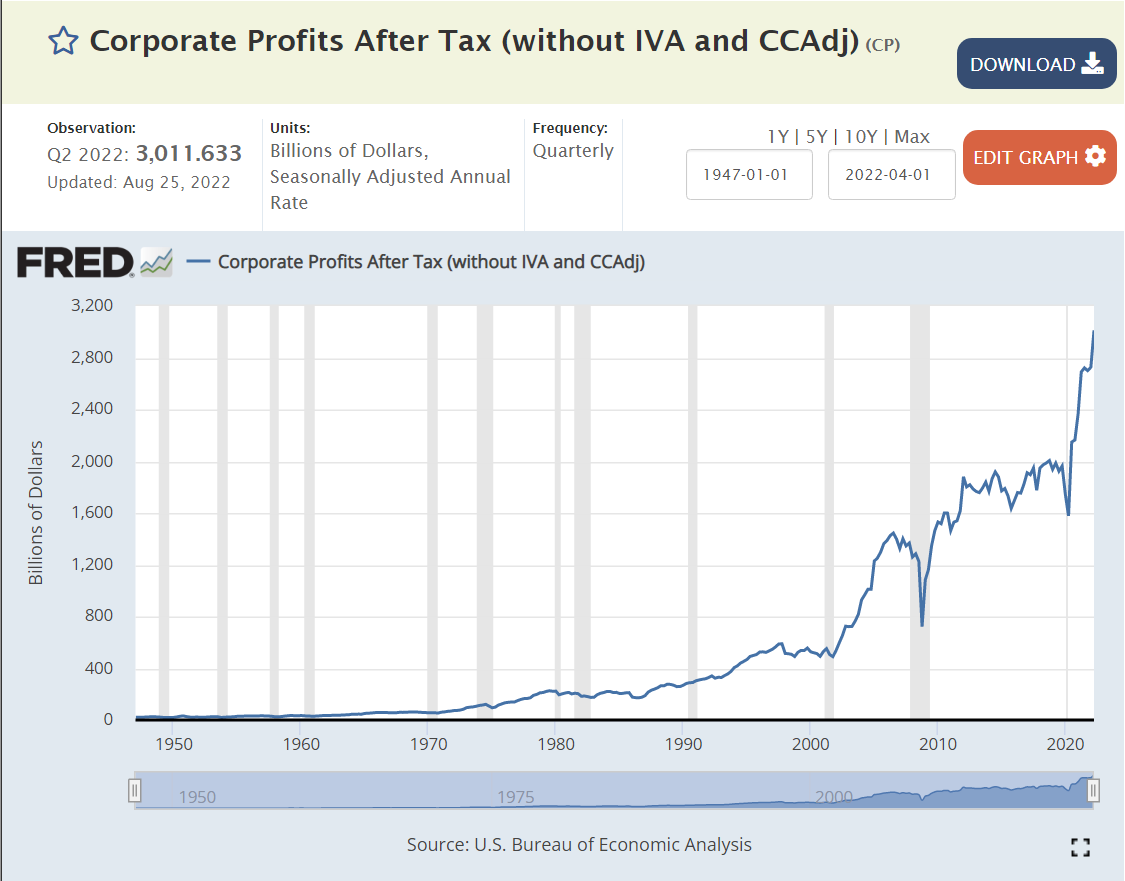
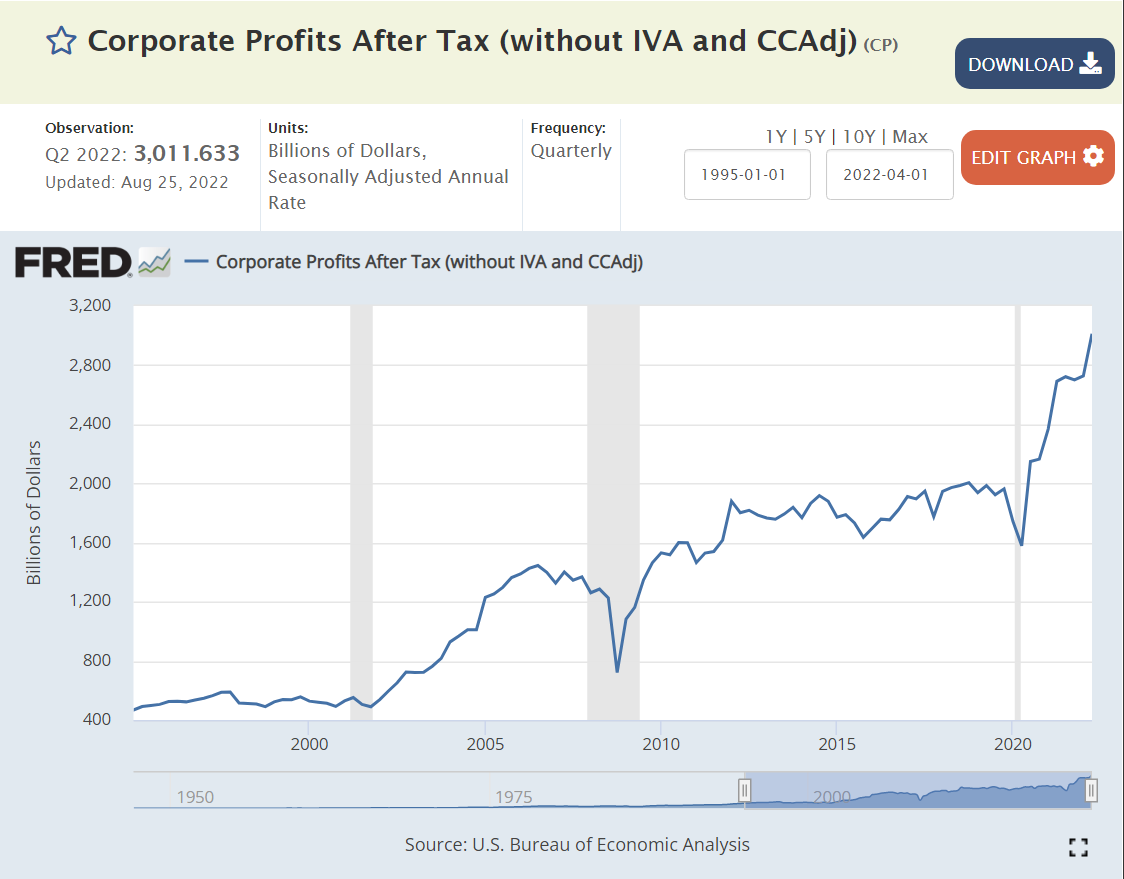
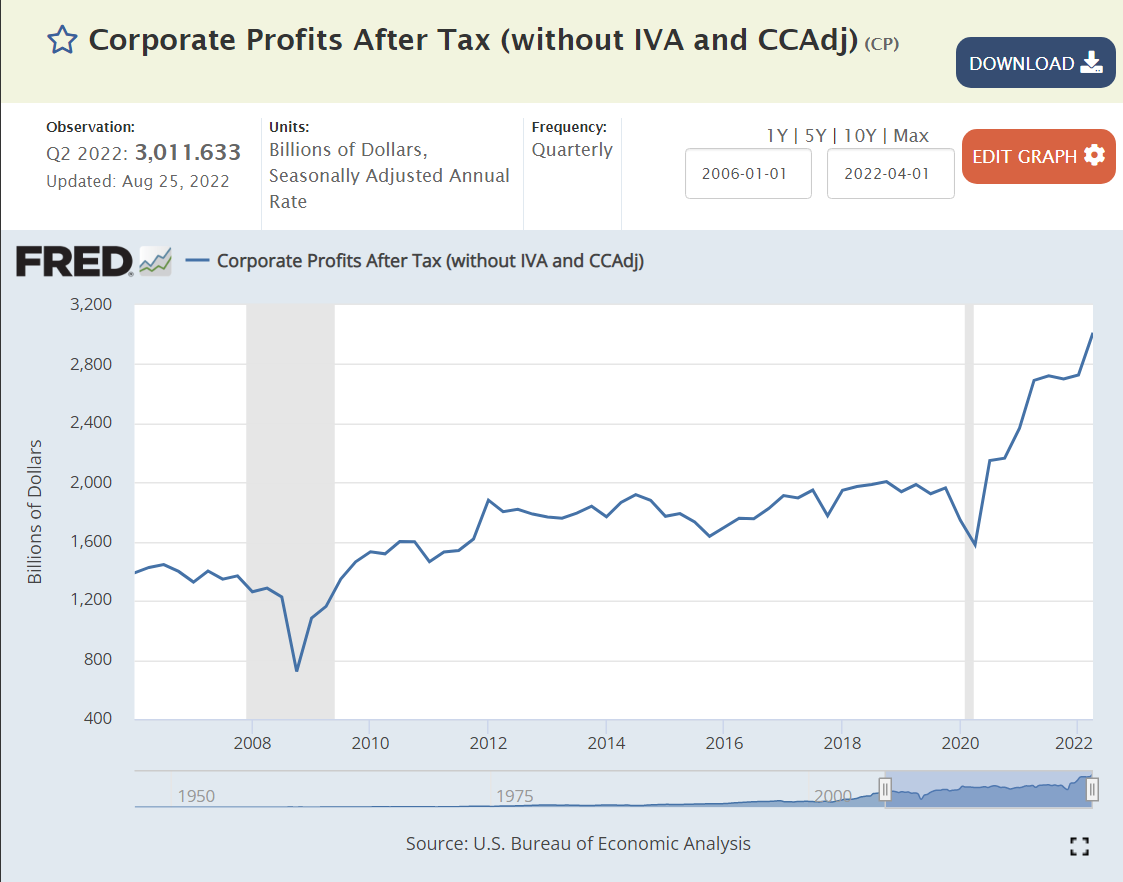
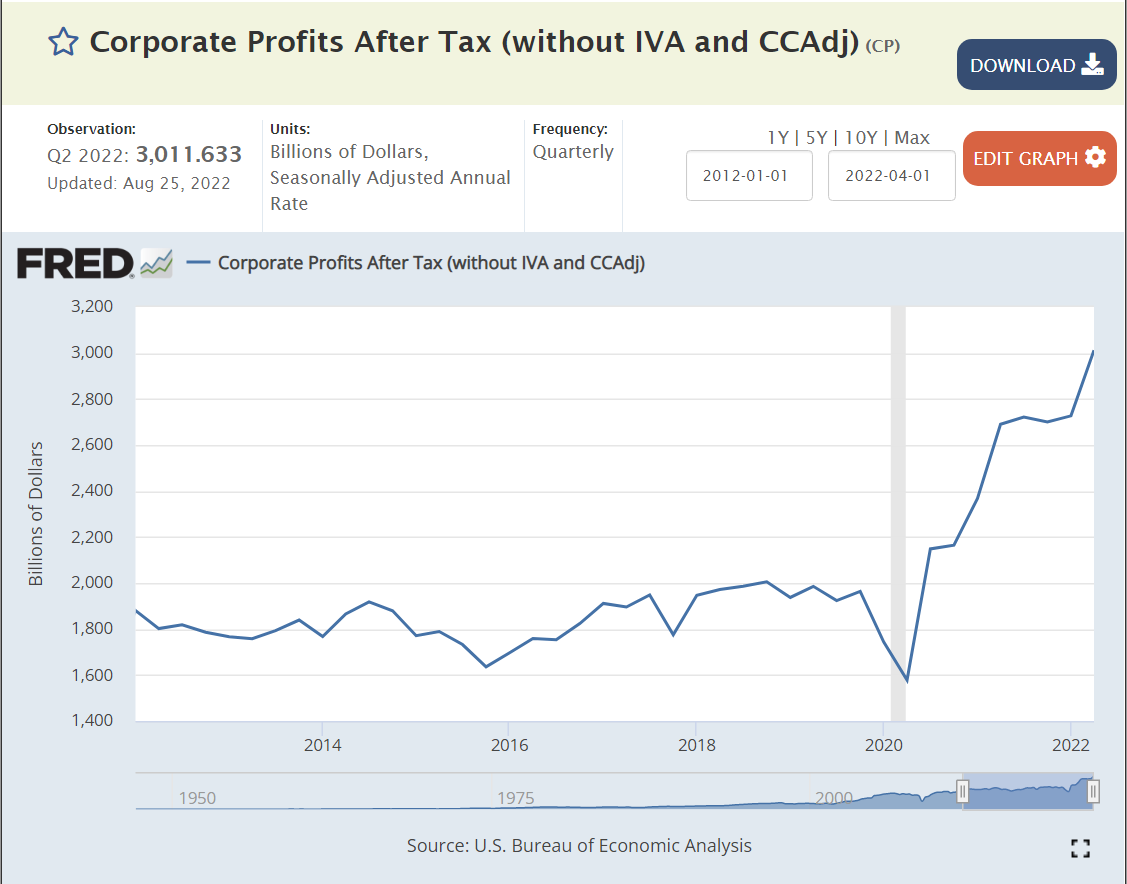
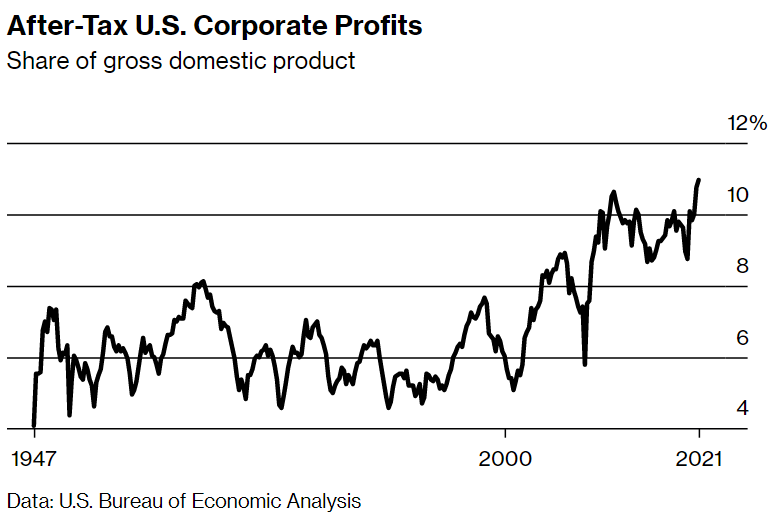
US Corporate profits grew from $1.9 Trillion(T) on an annual basis in the second quarter of 2019 before the pandemic to $3.0T in the second quarter of 2022; plus $1.1T (+57%)!!! US nominal gross domestic product (GDP) grew by 17%, from $21.3T to $24.9T, an increase of $3.6T. Real, inflation-adjusted, GDP grew by just 4%, accounting for a $0.8T increase in the real economy. Inflation grew by 13%, causing the other $2.8T of measured GDP. The $1.1T of increased corporate profits represents 39% of the inflation which has occurred in the last 3 years.
Analysis
Let’s look at the growth of US corporate profits from a half-dozen starting points to try to put this into perspective.
US corporate profits reached $3 Trillion in 2022, up from essentially zero in 1950. I’ve selected 7 peak profit years to outline this growth. Nominal profits increased from $55B in 1970 to $3.0T in 2022. In real, inflation-adjusted terms, profits have grown from $142B to $1,023B, a 7-fold increase in 52 years! Annual profit growth has been erratic, increasing by a high of 8% from 1995 to 2006 and a low of -1% from 2012 to 2018. The cumulative annual real profit growth has stayed near 4% throughout the period. 4% compounded for 52 years is a little more than 7x.
The US population grew from 200.3M to 338.3M during this period, 1.0% per year. So, corporate earnings grew by 3% per year above the rate of population growth for 52 years!!!! This kind of compound growth rate cannot continue for long periods of time without greatly impacting other sectors of the economy.
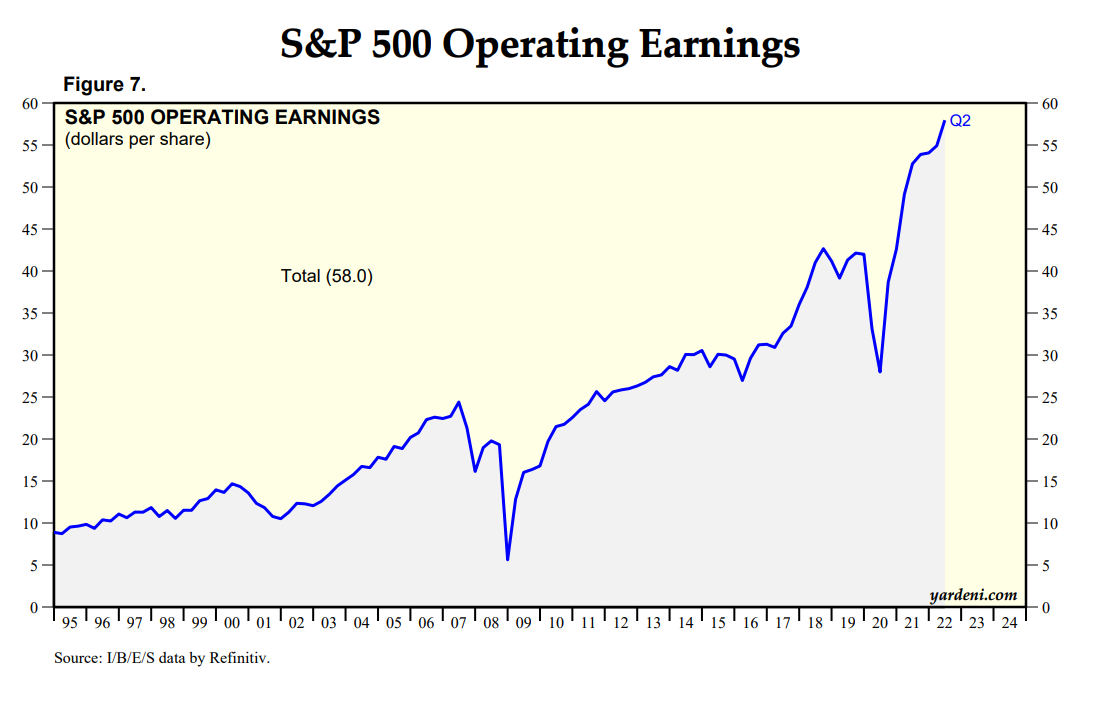
Corporate profits fluctuated in the 4-6% of GDP range from 1947 through 2000. Profits jumped up to 10% of GDP by 2010 and have largely remained at this two-fold elevated level for a decade. Profits reached a new record of 12% in 2022!
This measure shows profits growing eight-fold since 1970. (I’m going to ignore the detailed differences between the various measures of profit. They are important, but not necessary to see the major growth in profits, which is broadly consistent across the various measures.)
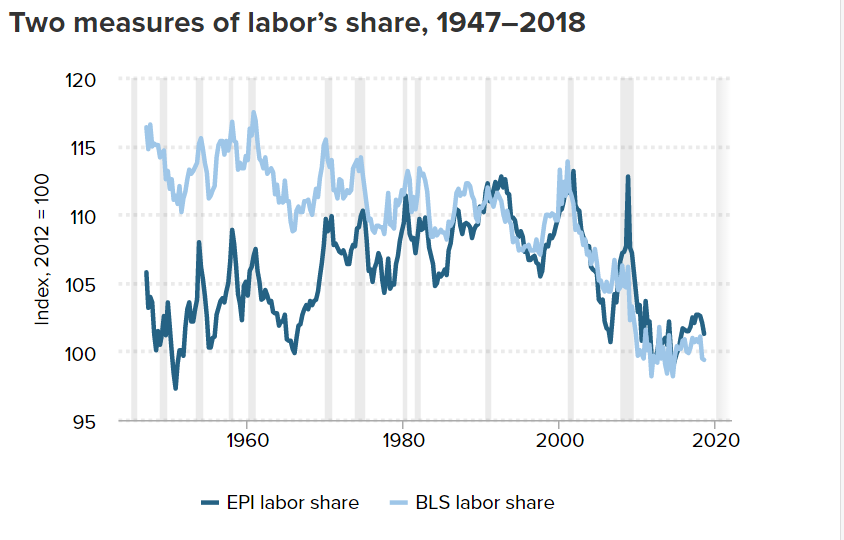
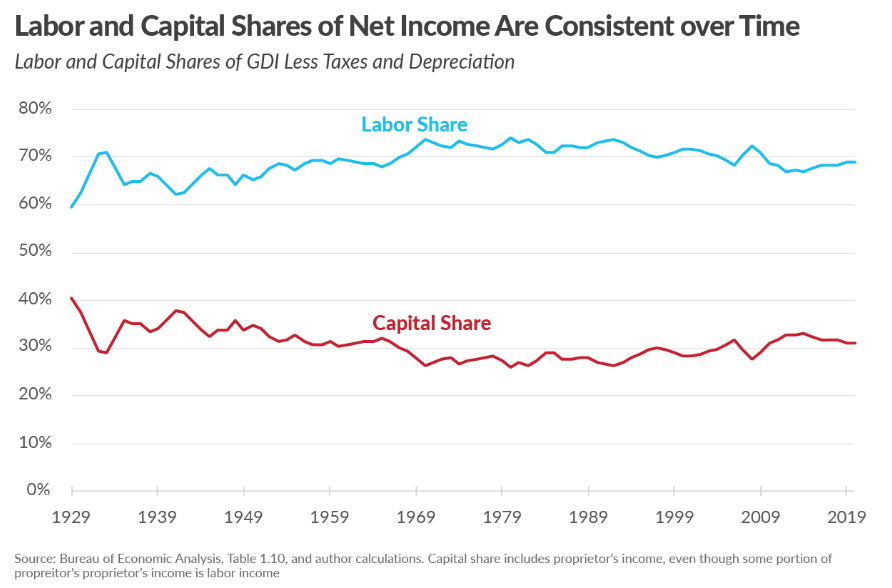
Most analyses of the growth in profits and decline in relative wages note that labor productivity has continued to rise by 2% or more annually, but labor has received almost no portion of those gains in the last 30 years.
A right-leaning think tank adjusts the data and claims that labor’s share remains constant in the long-run. The Tax Foundation does delve into the various measures of income and provides arguments for their preferred measure.
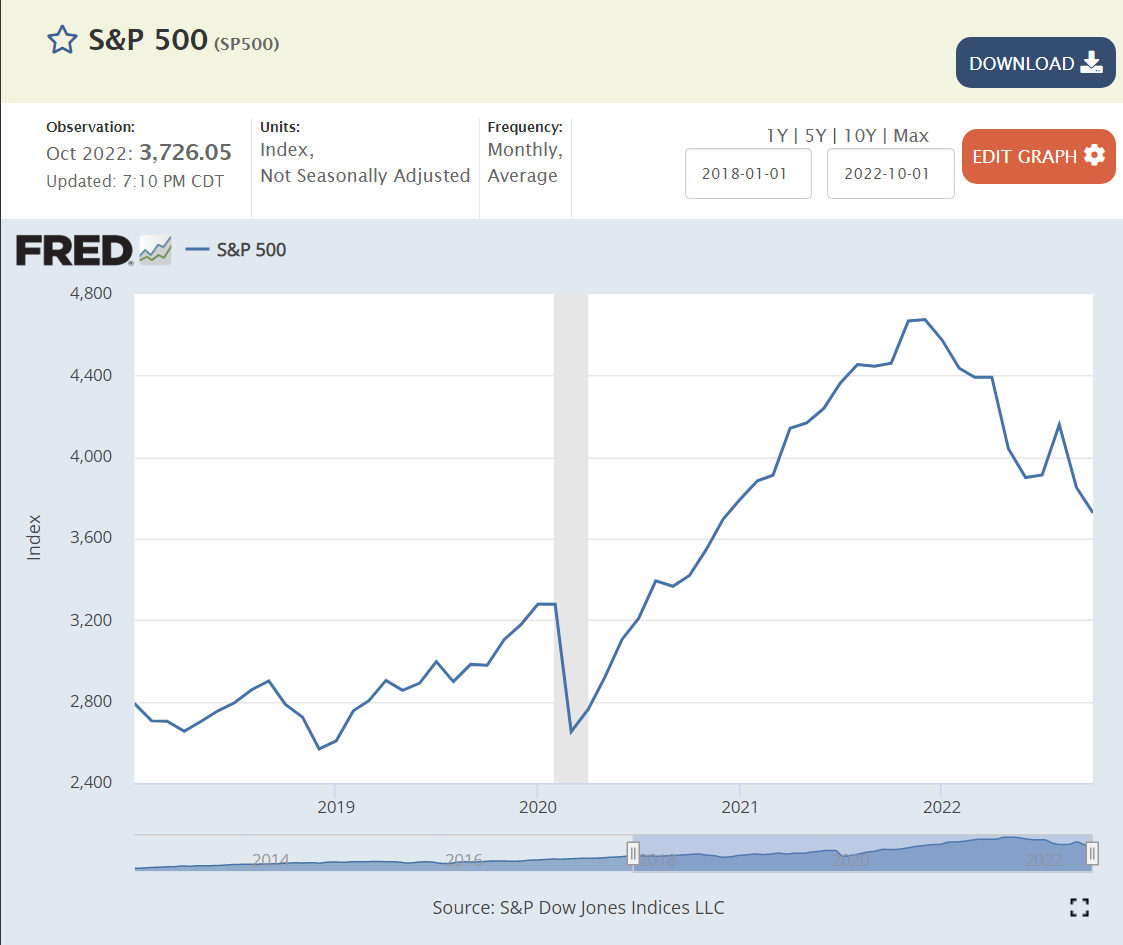
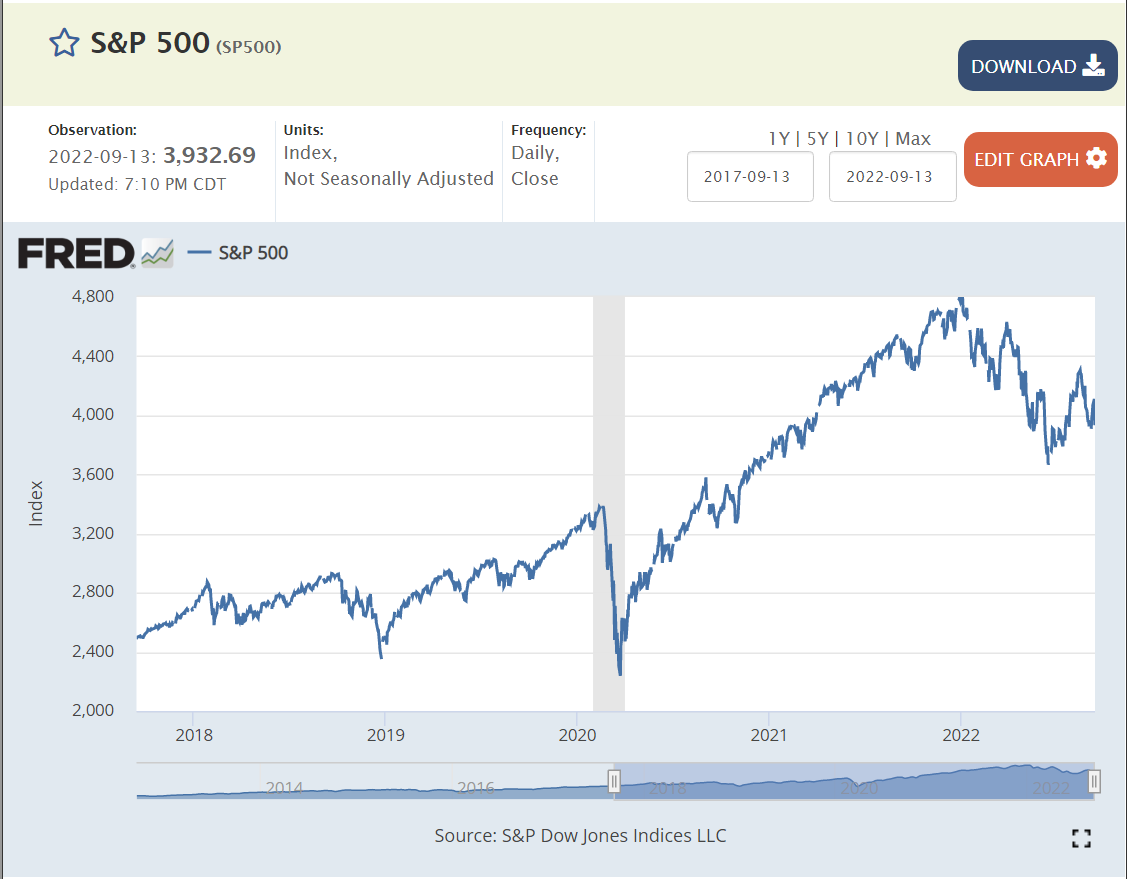
Stock prices tend to follow profits. The S&P 500 index has grown by 50% in the last 2 years (despite the recent decline), reflecting the amazing growth in corporate profits during a “once in a century” pandemic driven recession.
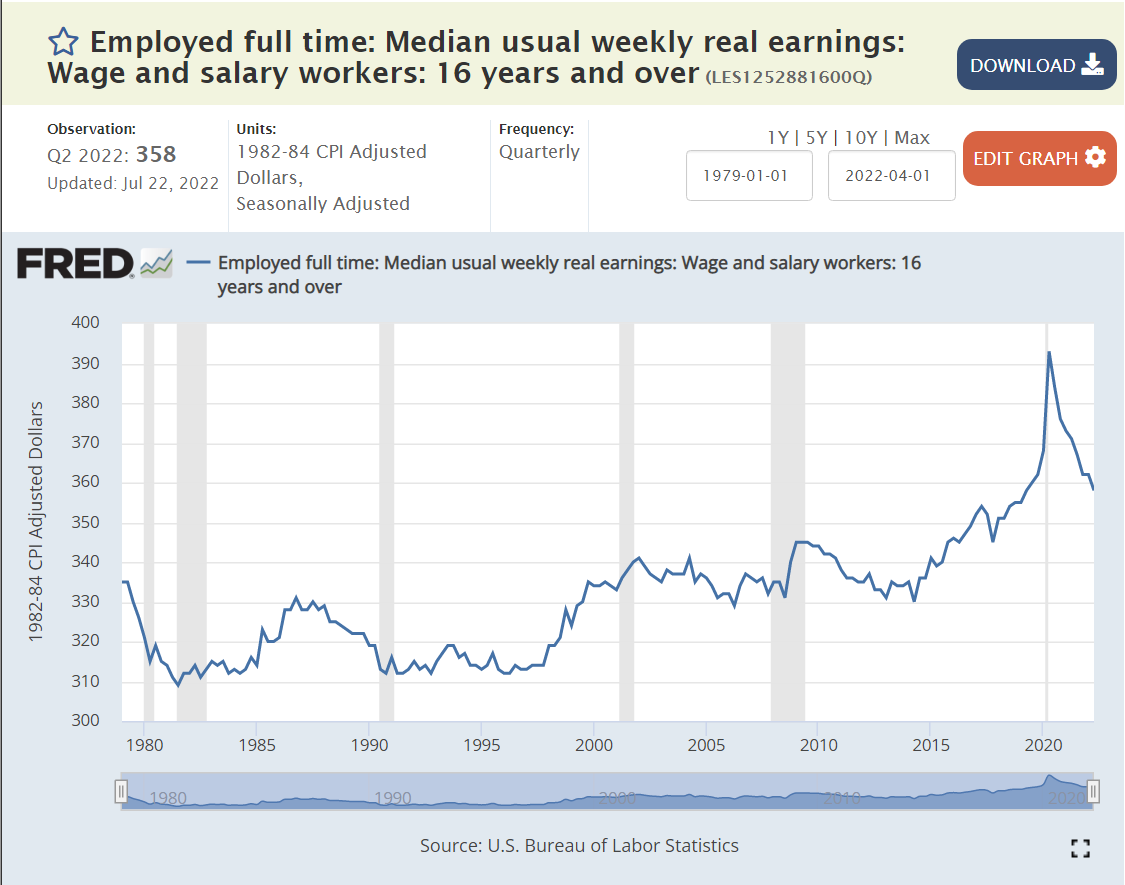
Median REAL, inflation-adjusted, earnings remained flat at $330/week from 1979 through 2014, a period of 35 years! This is during periods where profits were growing at 4% per year in REAL terms. In the last 8 years, REAL wages have increased by 9%, a bit better than 1% per year on average.
The media has published many articles, especially noting the increase of profits, overall, since before the pandemic. This is a popular topic because the result is certainly counterintuitive and because President Biden and the more left-leaning national Democrats have been criticizing corporations for “price gauging” and causing the recent inflation spike.
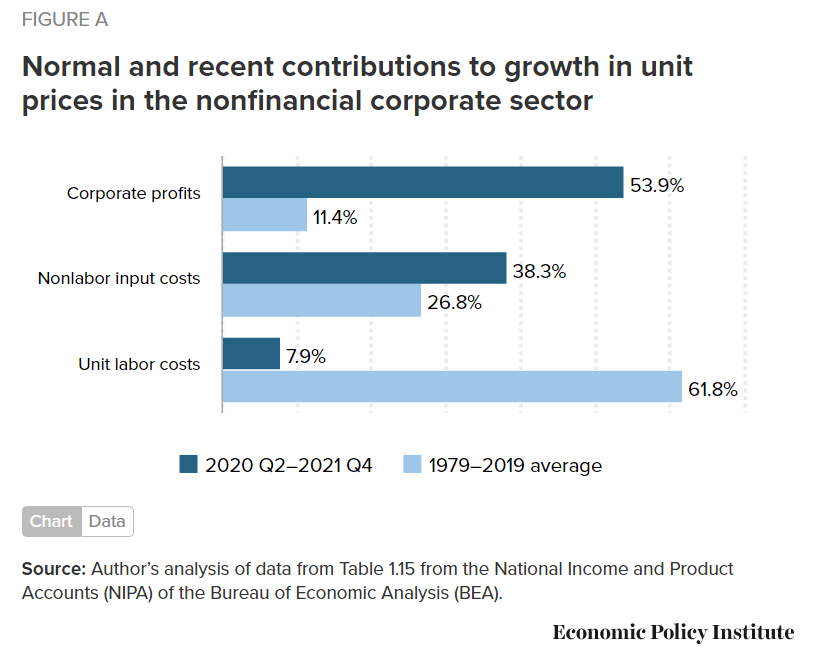
A variety of sources provide compelling data and logic to indicate that corporations are “taking advantage of” the post-pandemic inflation caused by supply chain issues and expansive fiscal and monetary policies to boost prices at rates faster than their costs of inputs (suppliers, labor, capital).
Most economists and analysts point to the increased concentration of firms (fewer) by industry increasing their pricing power and allowing them to raise prices during periods of change.
This is pretty dense and dry stuff. There is a general consensus among economists who focus on this topic that concentration and pricing power have risen very significantly. This is partly due to the simple aging of industries with fewer players left standing. The winners in a world of global competition are simply “much better” than the losers so they continue to take market share. US anti-trust enforcement in the last 40 years has been very limited, following the theory that “open competition” in the long run (Schumpeter’s creative destruction) eventually undermines leading companies with innovative products, processes and market strategies.
The US Chamber of Commerce argues that industry concentration has not increased, noting that consumer choices in broadly defined industries have increased greatly through time.
By a dozen measures, profit has consistently grown as a share of the American economy in the last 40-50 years. This necessarily means that the share of output and income received by labor is much smaller as a percentage of the total pie. The recent surprising ability of American corporations to effectively work through the pandemic supply chain disruptions, lose more than 10% of their labor force, increase nominal wages significantly, encounter severe input price inflation and still engineer price increases to come out much further ahead on profits is a major story for our time.
It is attracting attention to what I believe is an even more important story: the ability of corporations to incrementally capture nearly all of the increased value added by the productive American economy across 40-50 years and share very little with labor. This structural advantage of a very effective corporate sector “doing its job” within the relatively low-tax and low-regulation US political context is now completely proven.
In an ideal world, we would be developing and considering serious policy options that would limit this excess power without “killing the goose that lays the golden eggs”. Unfortunately, the Republican party remains focused on tax and regulation cuts as the main economic tools and the Democratic party alternates between 1960-70’s era Biden “centrist” policies and much further-left Bernie Sanders style policies.