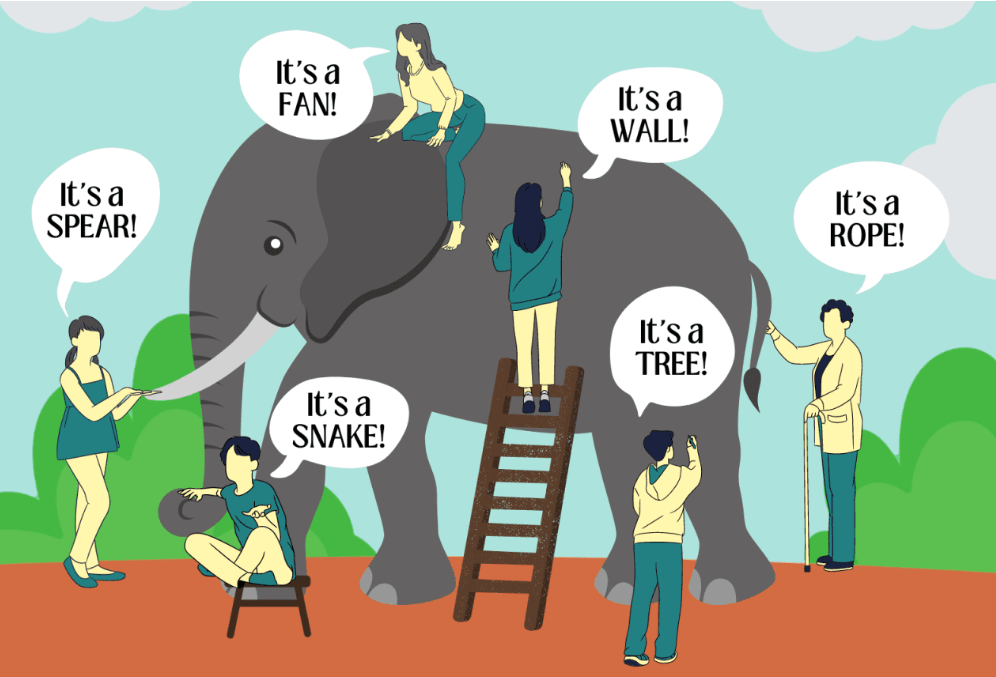
Civility, root causes of our problems, community, good news, the economy, Trump, history, religion, popular culture, Indiana, Hamilton County.
Scroll down to the bottom to subscribe.


Hamilton County has the 3rd highest average voting rate of Indiana’s 92 counties in the last 12 years. It was tied for 3rd highest in 2012. It was tied for 7th highest in 2016. It was first in 2020. It was tied for 6th highest in 2022. It was 6th highest in 2024.
Hamilton County’s 2024 population is estimated to be 378,000. The 2020 US Census indicates that the non-voting age population is 25%. The resulting voting age population is 283,000. This exactly matches the registered voter population!!! It is very unlikely that every voting eligible person in Hamilton County is registered to vote. Based on national figures, 90% voter registration is the maximum level. If the valid voter registration number was 10% lower than the reported 283,200 level, it would be 254,900 making the voting percentage 78%, far above all other Indiana counties.
https://worldpopulationreview.com/us-counties/indiana/hamilton-county


Hamilton County moved from a 30,000 vote Republican advantage in the 2016 presidential election to just 13,000 votes in 2020. Political gurus near and far watched the 2024 race closely to see if the squeeze would continue. It did not. Trump won Hamilton County by 12,000 votes in 2024, just a statistically insignificant shade below 2020.
The long-run trend indicates very competitive political races for the next 3 presidential election cycles.
https://www.wfyi.org/news/articles/hamilton-county-indiana-purple-trump-harris
https://secure2.hamiltoncounty.in.gov/Elections/2024G/results/index.htm
https://www.hamiltoncounty.in.gov/DocumentCenter/View/15431/2020-General-Office-Detail-Report
https://secure2.hamiltoncounty.in.gov/Elections/2016G/results/index.htm
https://secure2.hamiltoncounty.in.gov/Elections/2012G/results/President%20And%20Vice-President.htm
https://secure2.hamiltoncounty.in.gov/Elections/2008G/index.htm
https://secure2.hamiltoncounty.in.gov/Elections/2004G/RESULTS.HTM#0001
https://secure2.hamiltoncounty.in.gov/Elections/2000g/index.htm

She grew up in an Indiana town … with them Indiana boys on an Indiana night.
https://en.wikipedia.org/wiki/Mary_Jane%27s_Last_Dance
Indiana wants me, Lord I can’t go back there.
https://en.wikipedia.org/wiki/Indiana_Wants_Me
Oh, the moonlight’s fair tonight along the Wabash
https://en.wikipedia.org/wiki/On_the_Banks_of_the_Wabash,_Far_Away
A little ditty about Jack and Diane
Two American kids growin’ up in the heartland
https://en.wikipedia.org/wiki/Jack_%26_Diane
I grew up in Greater Cleveland as a proud buckeye in “the best location in the nation” 1956 – 74. Learned about demography in my first 1974 quarter at New College in Sarasota from Dr. Peter Hruschka. Transferred to Indy in 1988. Remained ever since. Slowly became a “Hoosier”. Started documenting the Hoosier population in 2009, including the exceptional growth of our suburban Hamilton County.
The urban counties have tripled in growth. The others remain flat.
Urban counties will grow.
Indy has found a growth solution. Cleveland has not.
Urban growth, rural stagnation nationally.
Indy metro and a few suburban or university counties grew, others declined.
Long-term stagnation outside of Indy and a dozen counties.
Indy metro area is increasingly dominant.
Metro Indy stands out as a growth leader in the Midwest.
Rural America was behind in 1960. It was much further behind in 1980. The gap has continued to grow. This has huge political implications. George Wallace, Spiro Agnew and Richard Nixon deeply understood this in 1968. Not sure my Democratic party has yet caught on.
Metro areas thrived. Suburbs thrived even more.
The components of Hamilton County’s 50 years of growth.
Hamilton County breakout by suburb.
Net in-migration continues.
Population growth drives job growth.
More diverse …
Older …
An Indianapolis suburb can compete for “best place to live” in the US!
Yet I get an Indiana kick out of you.
https://en.wikipedia.org/wiki/I_Get_a_Kick_Out_of_You

Hamilton County’s 357,000 residents are a little more than 0.1% of the 332 million national citizens (1/1,000). It’s typical 80 National Merit Semifinalists are 0.5% of the 16,000 national total (1/200). It produces 5 times more than its “fair share”.
The 13 lowest population states range from 0.6 to 1.8 million citizens, averaging 1 million. Hamilton County has one-third as many citizens, on average.
Public Sheridan HS awards some NMS semifinalists. Hamilton County has a large number of students at private schools that do not report NMS semifinalists by their place of residence. University, Park Tudor, Heritage Christian, Cathedral, Roncalli and Guerin. I estimate that there are another 3-5 Hamilton County winners each year.
Hamilton County students benefit from their abilities, parental and neighbor involvement, high expectations, extracurricular opportunities and strong school systems.
Typical annual National Merit Scholarship Semifinalists:
West Virginia 63
Hawaii 60
New Hampshire 76
Maine 62
Montana 48
Rhode Island 45
Delaware 40
South Dakota 35
North Dakota 30
Alaska 35
DC 30
Vermont 35
Wyoming 20
https://www.statsamerica.org/sip/rank_list.aspx?rank_label=pop1
https://patch.com/new-hampshire/across-nh/hundreds-nh-students-are-2023-national-merit-semifinalists

In 1970, Hamilton County was home to just 55,000 people. It has grown 6-fold since then to more than 330,000. One percent of the nation’s 3,143 counties have experienced similar growth in this 50-year period. These 32 counties combined have grown more than 5-fold from 2.2M (1.1% of US) in 1970 to 11.8M (3.6% of US) in 2020.

8 of the counties are Sunbelt retirement areas. 4 are smaller urban areas. 20 are suburban/exurban counties within larger metropolitan areas.
Each county remains fast growing, issuing an average of 5,000 building permits in 2022 versus an average of 500 per county nationally. Hamilton County’s 5,800 permits is above average.
As a group the counties average 16% of residents aged 65+, ranging from 11% to 25-29% in retirement counties. Hamilton County’s 14% makes it a little younger than the national average of 17%.
The percentage of adults working averages 66% versus 64% for the US as a whole, ranging from 48-54% in retirement communities up to 74%. Hamilton County’s 71% ties for second place.
Median household income at $85,000 for this group is 13% higher than the national average. Hamilton County’s $115,000 is sixth highest. 5 of the retirement counties average less than $70,000. Loudon County records a stunning $170,000.
Poverty rates are the mirror image, at 9% for the group versus 12% nationally. Rates range from 3-16%. Four retirement areas have poverty rates above the national average. Hamilton County’s 4% is tied for second lowest.
The group records 38% of adults with college degrees versus 34% for the nation. 7 retirement counties and Henry County south of Atlanta report 28% or less. Hamilton County’s 61% is second to Loudon County’s 64%.
Average home values are $345,000 for this subset, a solid 22% higher than the $282,000 national average. 10 counties reported prices below the national average, 5 in retirement areas, 4 in suburban counties and Bentonville, AR. 4 suburban counties listed their median home prices above $600K: DC, Sacramento, Nashville and Denver. Hamilton County’s $351,000 was average for the high growth group.
The group averaged 68% non-Hispanic White versus 59% for the nation as a whole. 4 counties had more minorities than non-Hispanic Whites: Ocala, FL, Henry/Atlanta, Prince William/DC and Brazoria/Houston. St. Charles County in the St. Louis Metro area had the highest non-Hispanic White share at 85%. Hamilton County’s 81% was 6th highest.
These 32 counties averaged 10% foreign born, much below the 14% national average. St. Charles County recorded only 3% foreign born. 5 counties reported 20% or higher foreign born: Forsyth/Atlanta, Ocala and Naples, FL, and Loudon and Prince William/DC. Hamilton County’s 9% is a little below the group average.
Hamilton County is one of 32 counties that have recorded tremendous growth across 50 years. It is relatively young and less diverse than most. It has higher incomes and average housing costs compared with its peers.


This growth started from a low base of 1,500 new jobs per year and accelerated to 5,000 new jobs per year by 2000. Hamilton County has maintained this growth rate for 2 decades with some extra results recently!

Hamilton County’s population doubled from 1970 to 1990. Metro Indy, excluding Hamilton County, grew by the same 50,000 people. In the next 30 years, Hamilton County added more than 250,000 people and the rest of metro Indy added a very solid 475,000 people (almost 2X). Hamilton County benefits from the Midwest leading growth of metro Indy.

Hamilton County employment growth has been a little faster than population growth.

Metro US population has grown by 1% annually and employment has grown by 1.6% annually. The Indy metro area has grown at similar rates. Hamilton County has grown 3-4 times faster.

As Hamilton County has grown, its annual growth rate has declined from 7% to 4%, still far above the 1.5-2% baseline growth rate.

Hamilton County has grown from 1/3,000 US people and 1/5,000 US employees to 1/800 citizens and workers. (4-6X growth).


Metro Indianapolis has been a solid job creator. Hamilton County has grown alongside the metro area.

Hamilton County was a “bedroom suburb” in its early days but reached the national level of jobs to population by 1992 and tracked the national average thereafter.

Between 1990 and 2008 US jobs grew by 22% but trailed in Midwest metro areas, increasing by only 14%. US jobs have grown by 9% since the Great Recession, with the Midwest trailing slightly at 8%. Metro Indianapolis has been a percentage growth leader in both periods, at 27% and 18%. Columbus and Kansas City show similar figures. Minneapolis has higher actual jobs added but slightly lower percentage growth on its twice as large base.
Chicago has added more total jobs, but its 18% growth is far behind Indy’s 49% and most of its growth took place back in the 1990’s. Nashville is typically grouped with the Southeastern states but if it was included in the Midwest, it would be the clear winner, nearly doubling its job base in 3 decades.


https://www.arcofappalachia.org/highlands-nature-sanctuary/

A 3-hour driving radius covers 100,000 square miles and 200 counties. Indiana is the 38th largest state with 36,000 square miles, so we cover almost 3 Indiana’s. This is equal to the combined land area of Michigan and Ohio or the combined land area of Illinois and Kentucky! Indianapolis is deemed the “Crossroads of America” due to its central location and direct access to national highways in all 8 directions away from the city. Chicago, Peoria, St. Louis, Evansville, Louisville, Cincinnati, Columbus and Lansing. US 31 provides a ninth limited access highway north to South Bend and Grand Rapids. The abundance of highways offers 3-hour access up to 210 miles away.
During the pandemic I hiked in all 200 counties within 3 hours of Hamilton County. I summarized the top 40 hikes in 3 blog posts based upon distance away and an extra one for honorable mentions. Let’s organize them below based upon their primary attraction for hikers.
Hoosier National Forest / Pioneer Mothers Memorial Forest (121 S)
Great Seal State Park (205 SE) Ohio
Morgan-Monroe State Forest (61 S)
Jackson-Washington State Forest (93 S)
John James Audubon State Park (196 SW) Kentucky
Lawrence Woods State Nature Preserve (184 NE) Ohio
https://www.fs.usda.gov/detailfull/hoosier/about-forest/?cid=fsbdev3_017499
https://www.greatsealstatepark.com/
https://www.in.gov/dnr/forestry/properties/morgan-monroe-state-forest/
https://stateparks.com/jackson-washington_state_forest_in_indiana.html
https://parks.ky.gov/parks/find-a-park/john-james-audubon-state-park-7815
https://ohiodnr.gov/go-and-do/plan-a-visit/find-a-property/lawrence-woods-state-nature-preserve
Spring Mill State Park (90 S)
Clifton Gorge State Nature Preserve (144 E) Ohio
Cedar Line Nature Preserve (151 SE) Kentucky
McCloud Nature Park (40 W)
Versailles State Park (75 SE)
Portland Arch Nature Preserve (80 W)
https://ohiodnr.gov/go-and-do/plan-a-visit/find-a-property/clifton-gorge-state-nature-preserve
https://pendletoncounty.ky.gov/Pages/CedarLineNaturePreserve.aspx
https://www.visithendrickscounty.com/listings/mccloud-nature-park/186/
https://www.in.gov/dnr/state-parks/parks-lakes/versailles-state-park/
https://www.nature.org/en-us/get-involved/how-to-help/places-we-protect/portland-arch-1/
Clifty Falls State Park (90 SE)
Charleston Falls Preserve (122 E) Ohio
Cove Spring Park (186 SE) Kentucky
Highlands Nature Sanctuary (196 SE) Ohio
Hoosier National Forest – Yellow Birch Ravine (142 S)
Williamsport Falls (83 NW)
https://www.miamicountyparks.com/parks/charleston
https://www.frankfort.ky.gov/751/Cove-Spring-Park
https://www.arcofappalachia.org/highlands-nature-sanctuary
https://www.hoosierhiking.com/the-blog/yellow-birch-ravine-nature-preserve
https://en.wikipedia.org/wiki/Williamsport_Falls
Devou Park (138 SE) Ohio
Harmonie State Park (206 SW)
Battelle Darby Creek Metro Reserve (175 E) Ohio
Providence Metro Park (186 NE) Ohio
https://www.exploredevoupark.org/
https://www.in.gov/dnr/state-parks/parks-lakes/harmonie-state-park/
https://metroparkstoledo.com/explore-your-parks/providence-metropark/
Patoka Lake (142 S)
Pokagon State Park (158 NE)
https://www.in.gov/dnr/state-parks/parks-lakes/patoka-lake/
Hooper Branch Savannah (125 NW) Illinois
Kickapoo State Recreation Area (100 NW) Illinois
Midewin National Tallgrass Prairie (176 NW) Illinois
Ouabache State Park (110 NE)
Pumpkinvine Trail (150 N)
https://dnr.illinois.gov/inpc/area.area3iroquoishooperbranchsavanna.html
https://dnr.illinois.gov/parks/park.kickapoo.html
https://www.fs.usda.gov/midewin
https://www.in.gov/dnr/state-parks/parks-lakes/ouabache-state-park/
Ott Biological Preserve (205 NE) Michigan
Spicer Lake (143 N)
Gallagher Fen Nature Preserve (147 E) Ohio
France Park (80 N)
Calli Nature Preserve (70 SE)
https://www.calhouncountymi.gov/departments/parks/ott_biological_preserve.php
http://www.sjcparks.org/591/Spicer-Lake
https://ohiodnr.gov/go-and-do/plan-a-visit/find-a-property/gallagher-fen-state-nature-preserve
https://www.co.cass.in.us/departments/e-i/france-park/home
Allerton Park (150 W) Illinois
Gabis Arboretum (146 NW)
Bernheim Arboretum and Forest (157 S) Kentucky
Boone County Arboretum (130 SE) Ohio
Yew Dell Botanical Garden (144 S) Kentucky
Pyramid Hill Sculpture Park (115 SE) Ohio

https://en.wikipedia.org/wiki/Roberts_Chapel_%28Atlanta,_Indiana%29
Roberts Settlement was founded in rural Hamilton County in 1838 as a home for Black and mixed-race individuals.
The county seat of Noblesville also hosted Black AME and Baptist congregations beginning in 1853 and 1873.
https://www.through2eyes.com/post/2019/08/01/the-roads-and-rhodes-of-westfield-indiana
https://digitalresearch.bsu.edu/digitalcivilrightsmuseum/items/show/20
https://www.hamiltoncounty.in.gov/392/Bray-Family-Park-History
Methodists, Baptists and “Christians” played key roles in founding churches in the pioneer 19th century. Some of these churches or their descendants remain influential to this day. The historical summary below is from 1915.
http://genealogytrails.com/ind/hamilton/church-history.html
https://sacredheartcicero.org/welcome
The Pew Research Institute rates Hamilton County as 0.745 on a 0 to 1.0 scale of religious diversity, 20% more diverse than the national average.
Hamilton County has the national average of 1% of LDS, Muslim, Hindu and Buddhists. It hosts 2% of Jewish faith members versus the 1% national average. The county reports 25% unaffiliated, slightly above the national average of 23%. The county reports only one-third of the national average of Black and Hispanic religious members today. It has 50% more White Catholics, Evangelicals and Mainstream Protestants compared with the national average (63% vs 44% overall).
Sperling’s Best Places reports that Hamilton County has 45% religious citizens versus the national average of 49%.
https://www.bestplaces.net/county/indiana/hamilton
Hamilton County has 172 places of worship.
https://maps.nazarene.org/ARDADemographics/?search=46032
At 2,074 people per congregation there are one-half as many churches as the national average of 1,000 (332M/350K). It’s difficult to interpret this number. I think that it reflects the lag between population growth and church planting. Nearby Indianapolis is noted for its nation leading 2,900 churches for 1 M people or one church for every 300 people.
https://www.usreligioncensus.org/
Like the rest of America, Hamilton County hosts several megachurches. It also hosts a wide variety of denominations.
https://en.wikipedia.org/wiki/Church_of_God_(Anderson,_Indiana)