

http://news.bbc.co.uk/cbbcnews/hi/find_out/guides/trends/rollercoasters/newsid_1578000/1578955.stm
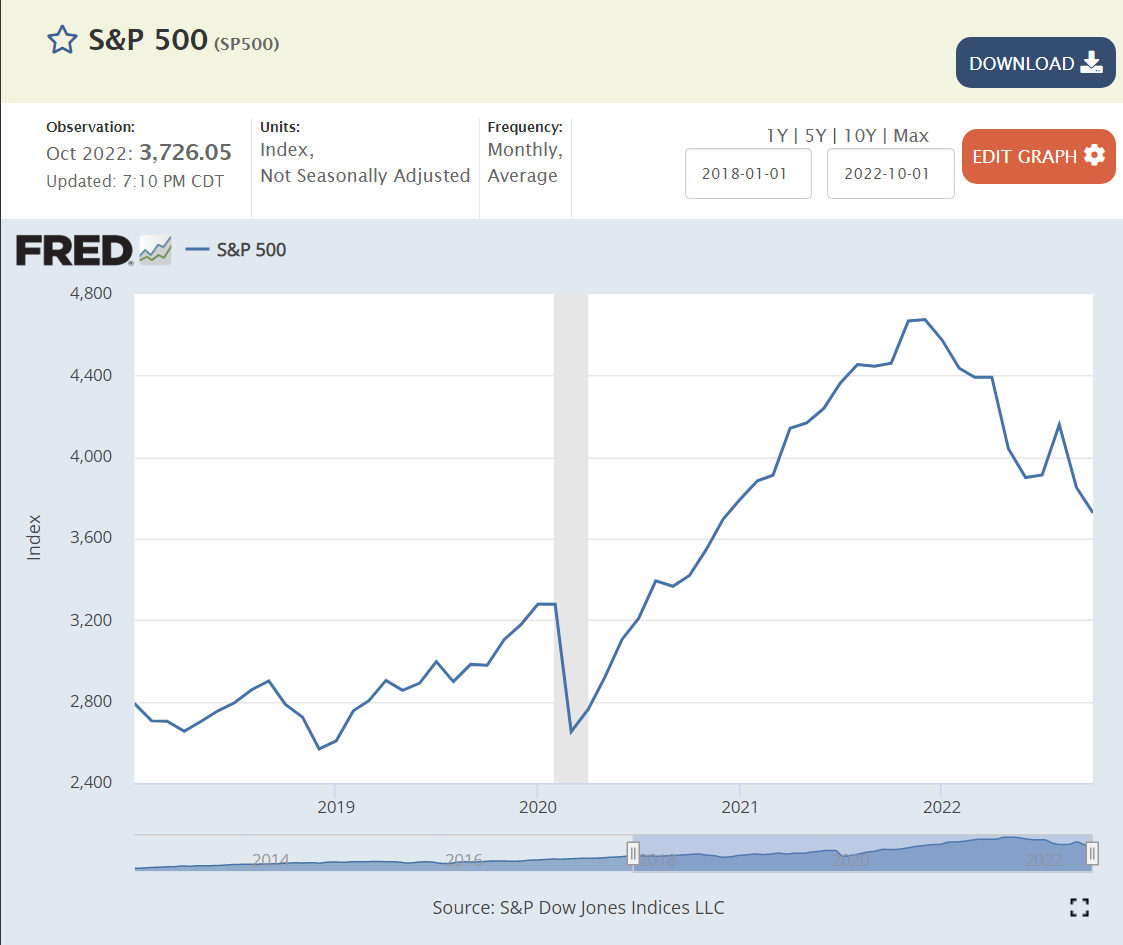
The stock market reacted quite positively yesterday to the slightly better than expected news regarding measured inflation. The total measure and the “core inflation” measure excluding more volatile food and energy prices were both a little lower than expected for the month and for the 12-month calculation.
https://www.cnbc.com/2022/11/09/stock-market-futures-open-to-close-news.html
I don’t think that trend inflation was ever as high as the markets and voters perceived (double digits) and I don’t think that today’s reaction/perception of a peak or recovery in the inflation rate is correct, as inflation totals and details have been slowing for seven months, since March. In hindsight, the business cycle tends to reflect a smooth “sine-wave” curve of increasing, flattening and then decreasing various measures. It is VERY difficult to separate the “signal from the noise” as the monthly data is released on GDP, employment, inflation, etc.
As usual, we need to look at nearly a dozen measures of inflation and its components and 2-3 views of each component to try to identify the “signal”.
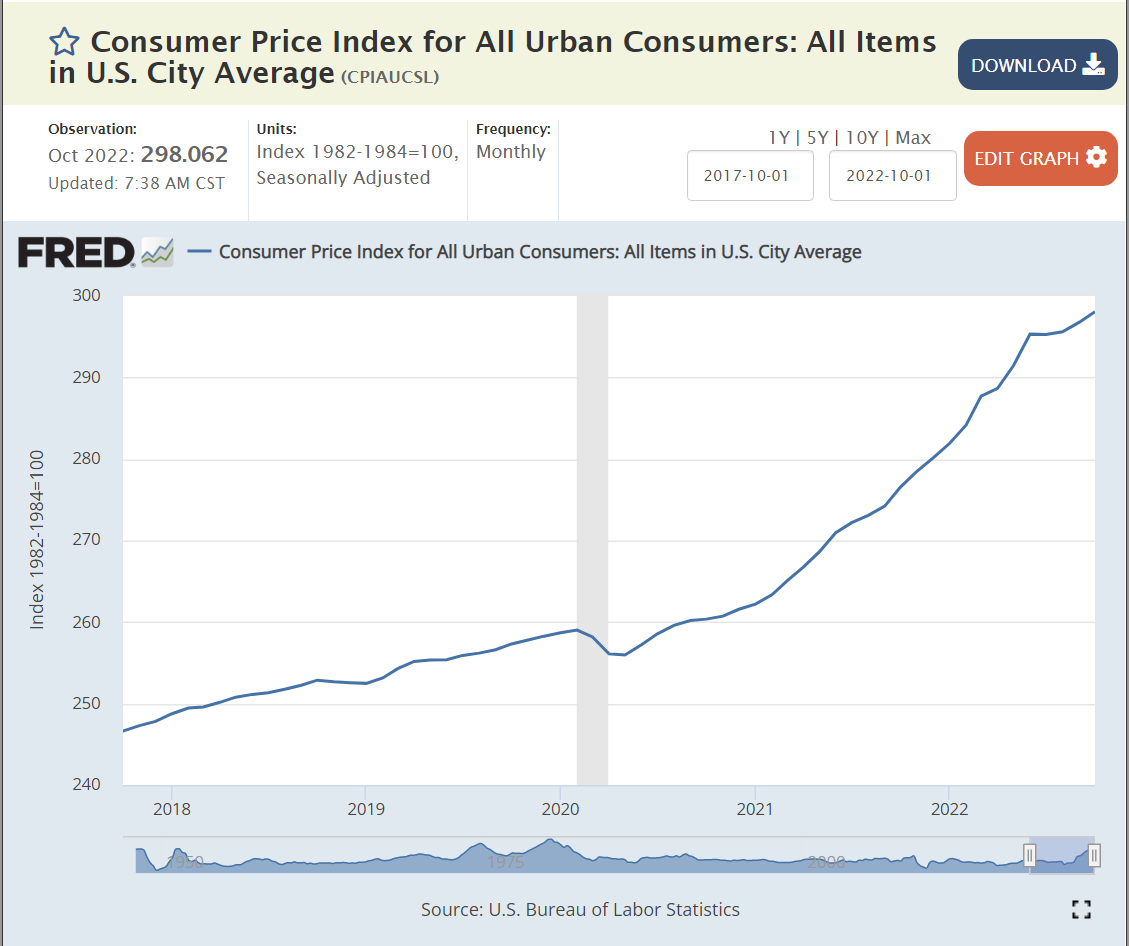
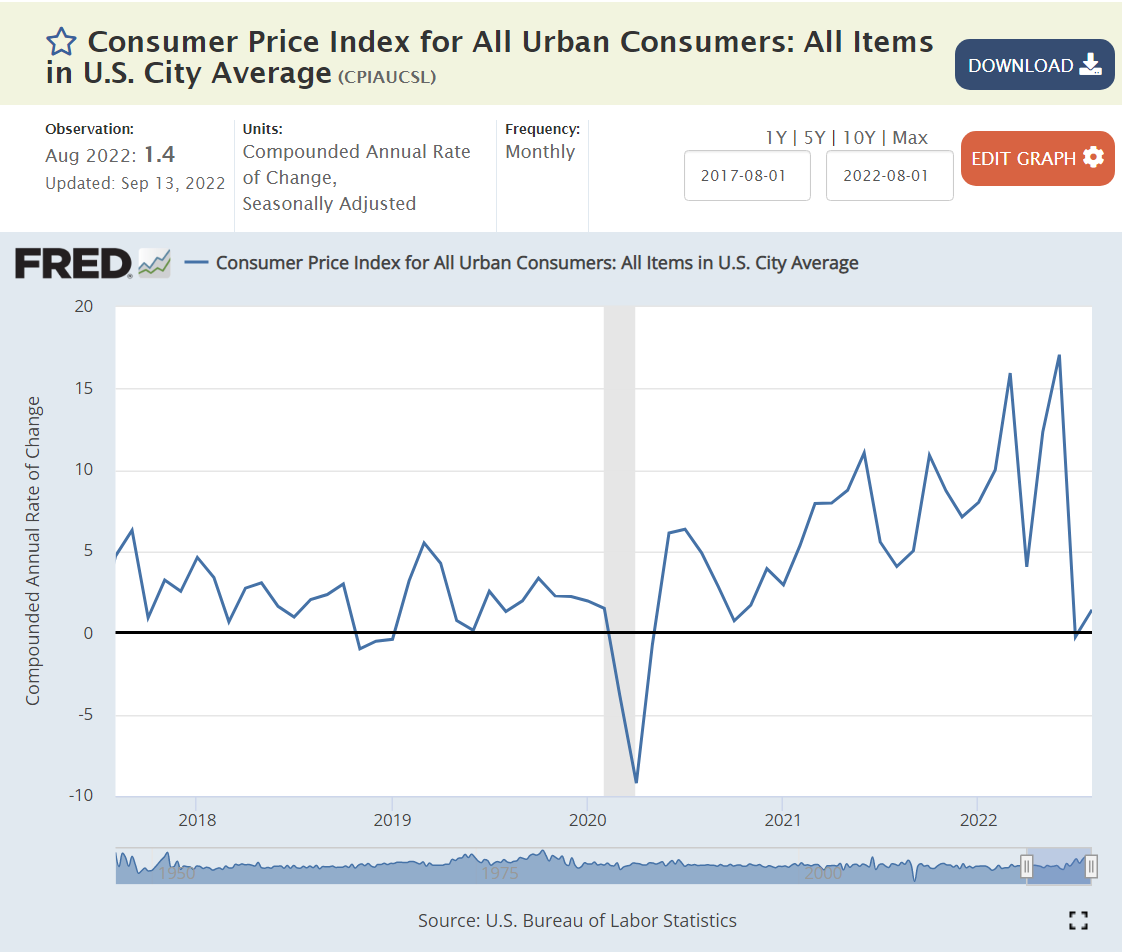
When I look at the consumer price index, I see an inflection point in March, 2022, when a quickly accelerating curve paused its growth rate. Inflation appeared to resume at its prior pace in April and May, not faster than in prior months, indicating that March was a fluke, but at about the same pace, indicating that, overall, there was the beginning of a slow-down in Feb-May. In June, I see a second inflection point, and the pace of price growth has clearly slowed for the next 4 months. The annual inflation rate from March to October was 6.2%
The inflation rate from September, 2021 to March, 2022 was 9.8%. This was the highest rate indicated by this data. 6.2% is a good one-third lower than 9.8%, strongly indicating that the inflation rate has peaked. It might not be declining, but it has clearly peaked.
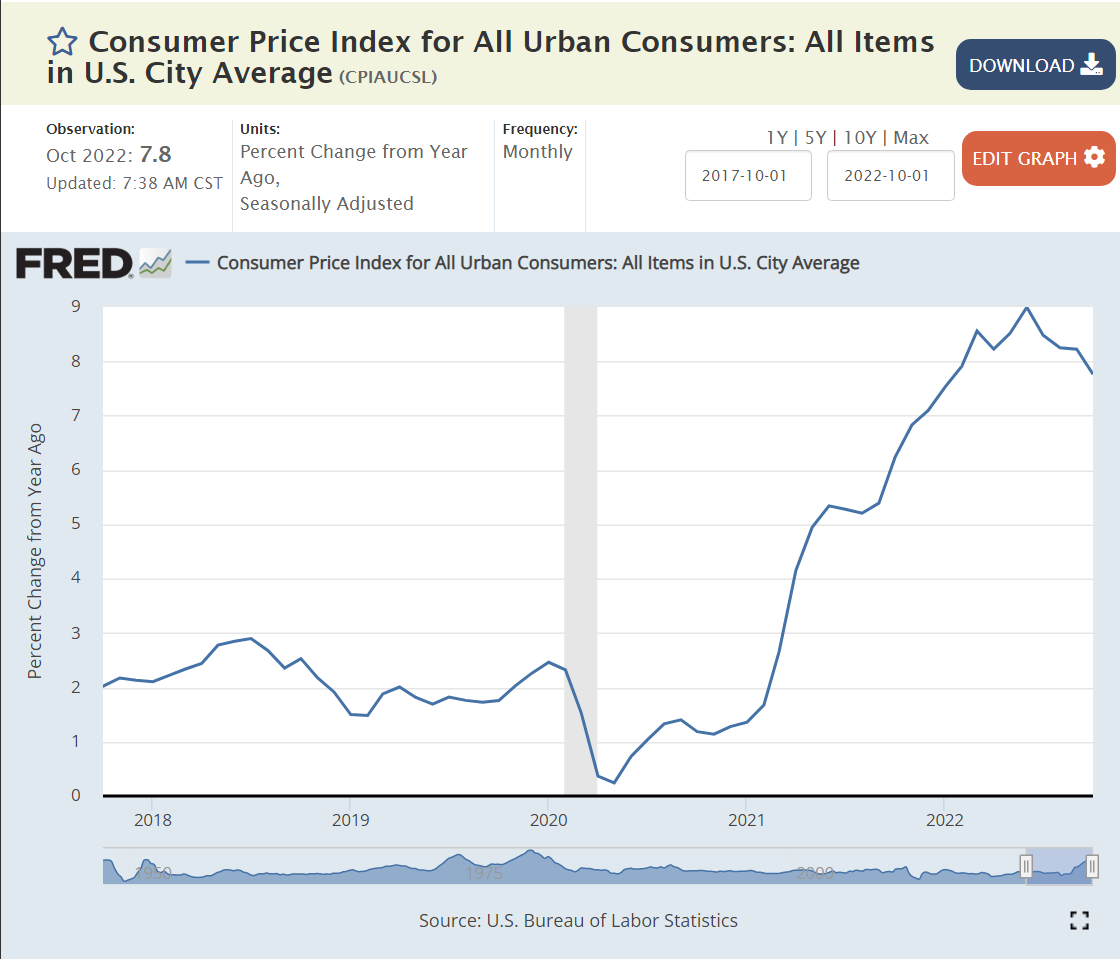
The annual, 12-month price change measure tells the same story. At September, 2021, the trailing annual inflation rate was 5.4%. At March, 2022, the rate had reached 8.6%. It appears to have peaked at that time, levelling off in the low 8% range. A peak was reached in June at 9%. The next 5 months have shown a declining trend to less than 8%.
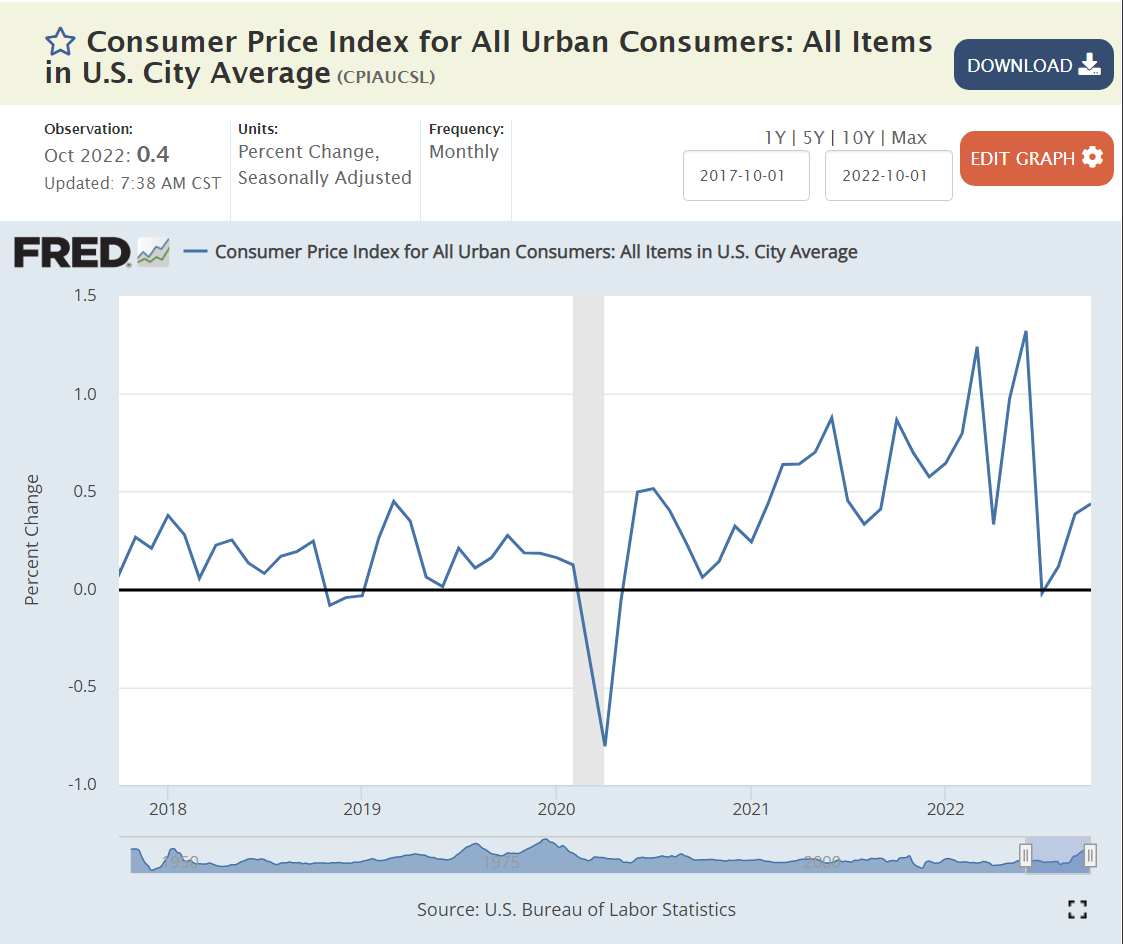
The monthly percentage change is much more volatile. Monthly changes reached 0.88% in Jun 21 and 1.32% in Jun 22. There were also lower monthly changes during this period, keeping the 12-month measure to 9% or less. The last 4 months have shown good news, with monthly inflation of 0%, 0.1%, 0.4% and 0.4%, a total of 0.9% for 4 months, or 2.7% annually. This measure is too volatile to claim victory, but it reinforces the notion that inflation has peaked and is beginning to decline significantly.


The “core” inflation index appears to have peaked at 6.4% of annual inflation in Feb, 2022. Most economists focus on this measure because the excluded food and energy components are much more volatile and tend to return to their low long-term inflation rates, so high monthly increases tend to be followed by offsetting declines. The core inflation index appears to have levelled off at 6.5%, but evidence of a future decline is not obvious in this measure.
The monthly core inflation measure fluctuates between 0.4% and 0.6% for the last 18 months, indicating annual inflation of 5-7%. A lasting decline is not obvious, but the October measure is encouraging.

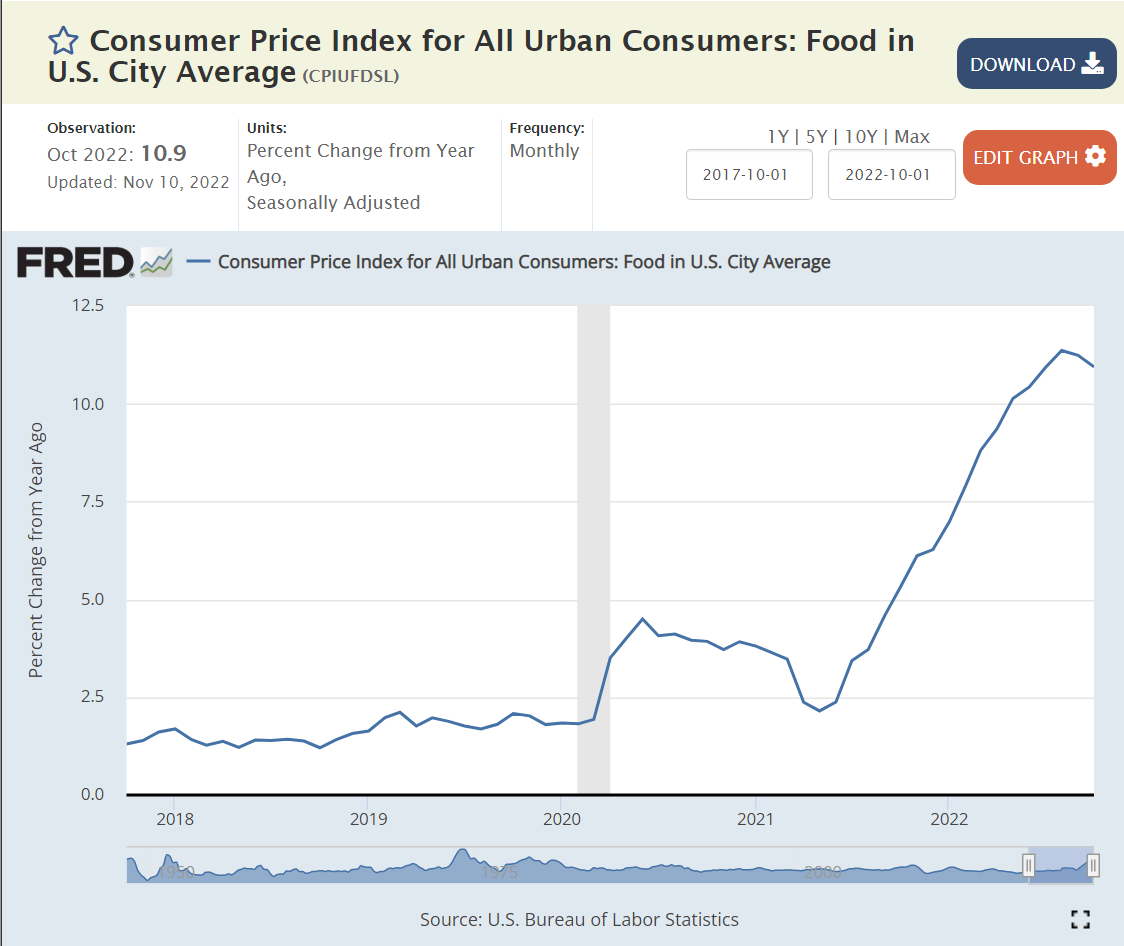
The food consumer price index clearly accelerated from late 2020 through mid 2022. Monthly inflation grew from 0.2% in late 2020 to 0.6% in the last 2 quarters of 2021. Food inflation reached 1% monthly in February, 2022 and stayed at that level for 6 months, before beginning to decline quite sharply to 0.6% in the next 4 months.
https://fred.stlouisfed.org/series/CPIUFDSL#0
On a year-over-year basis, it took a little longer for food price inflation to become noticeable, as the earlier lower inflation months were combined with the growing inflation months. In June, 2021, the trailing 12-month food inflation rate was just 2.4%, comparable to the last 30 years. The annual inflation rate reached 6% by November, 2021 and peaked at 11.4% in August, 2022. The monthly food inflation rate and the trailing 12-month rate are clearly declining. Consumers face a grocery bill each week and are sensitive to these changes for key items.


https://fred.stlouisfed.org/series/CPIENGSL#0
Energy prices are volatile. That’s why they’re excluded from the “core” inflation measure. Nonetheless, from a consumer experience and future inflation expectations perspective, they matter. They matter greatly. The gas and electric bills arrive each month. Automobile fuel is purchased weekly or more often with huge price signs at the station. Monthly energy prices increased by 5% in June, 2021 alone and averaged about 2.5% per month for the next year and one-half. Energy prices then briefly increased by 19% in the next 4 months combined before finally dropping a bit. The monthly experience was one of 2 years of increases and 30% annual inflation for more than a year. The recent price reduction is seen as a release from relentless large increases.
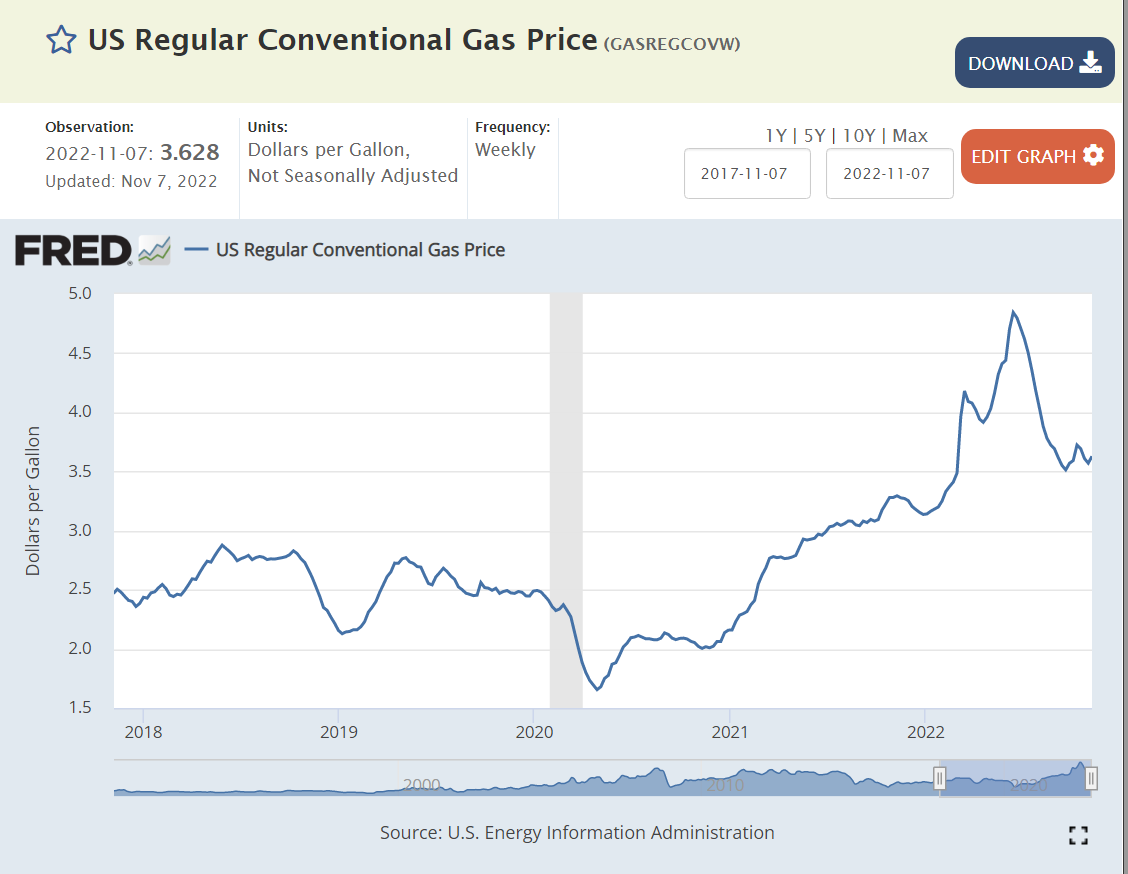
https://fred.stlouisfed.org/series/GASREGCOVW
The most visible energy price. for regular auto fuel, dropped from $2.50 per gallon to just $2.00 per gallon during the first year of the pandemic before increasing to $3.00 per gallon in the second year and then up to nearly $5.00 per gallon in June, 2022. It has since declined to a slightly elevated $3.60 per gallon. Consumer perception of “gas prices” is mixed. It’s clearly higher than in 2019, 2020 or 2021, but it has come down from the peak level. Various threats and weekly volatility make consumers shy to conclude that gas prices are “really” declining.

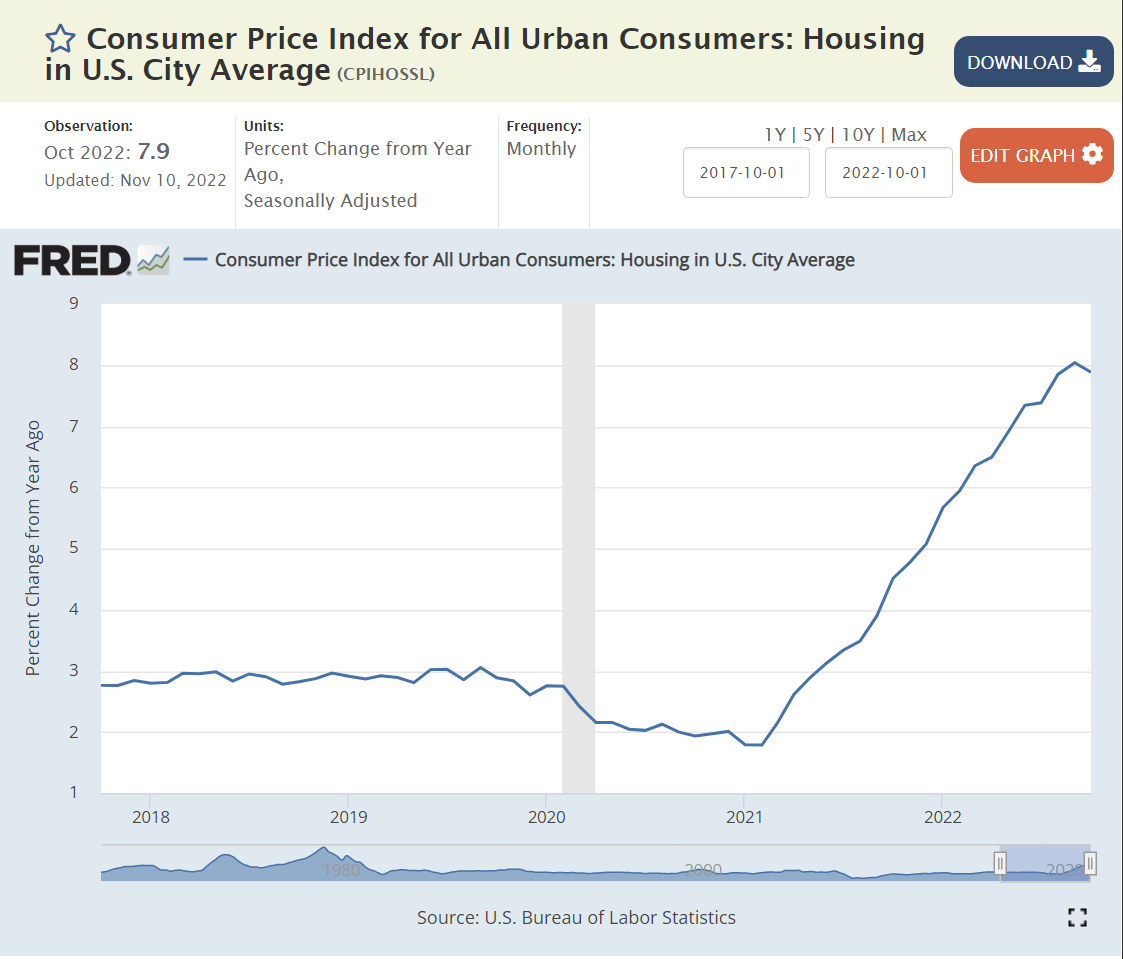
https://fred.stlouisfed.org/series/CPIHOSSL#0
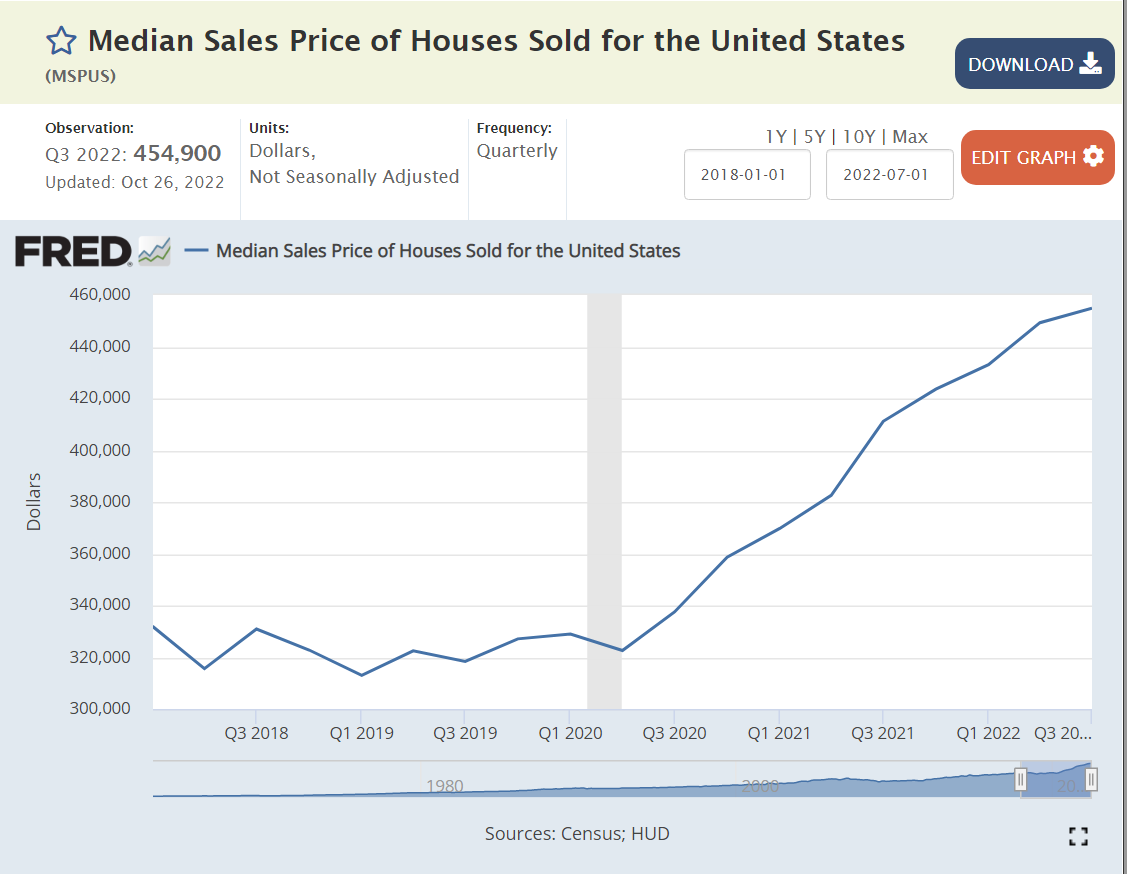
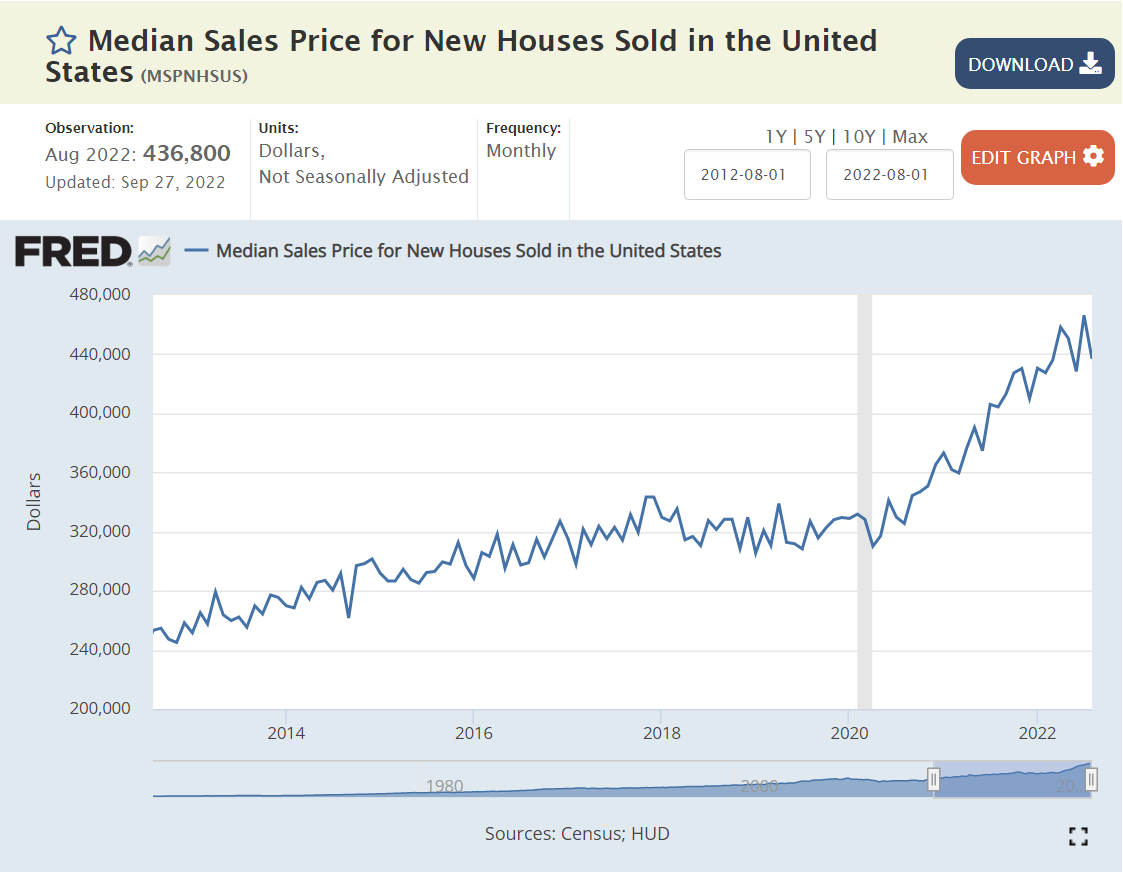
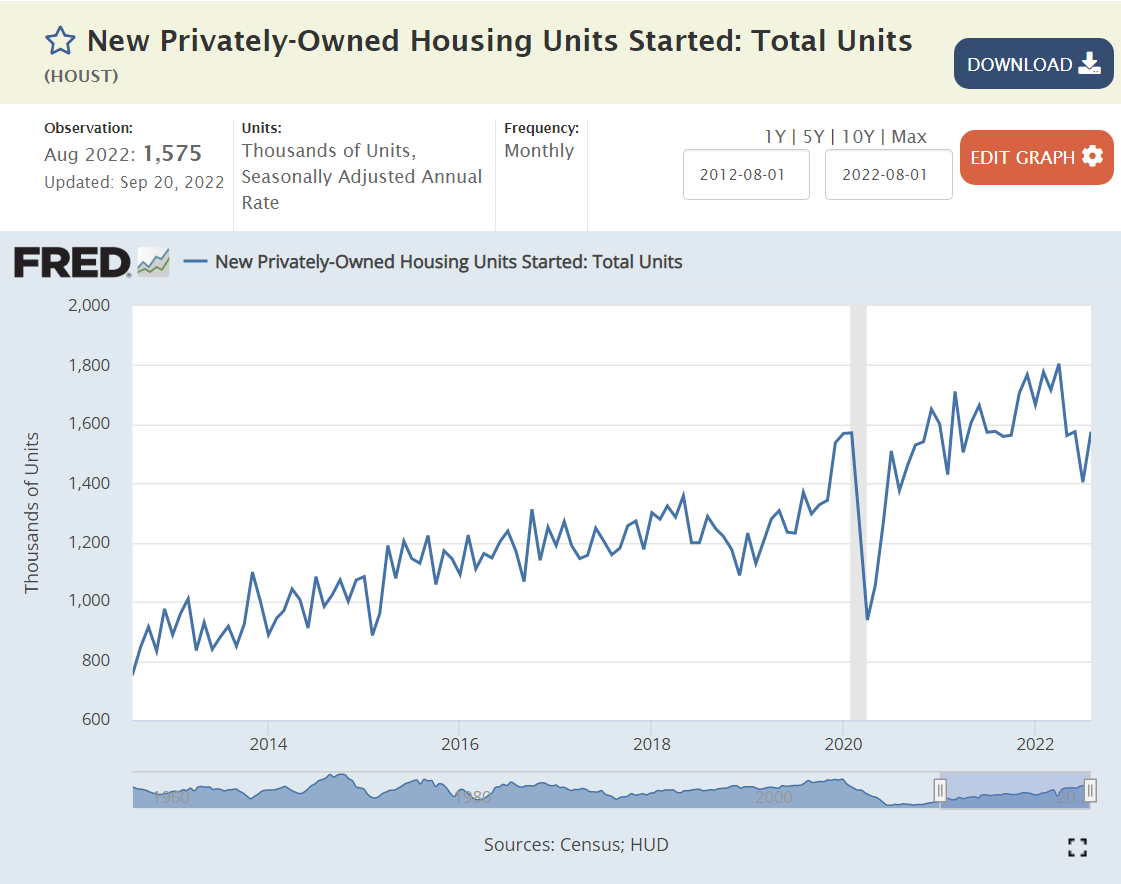
Annual housing inflation remained in the 2-3% range for the first year of the pandemic, but very quickly climbed to 6-8% as the supply of new homes was reduced and demand for housing of all kinds increased. Consumers saw this inflation in record high rent and housing prices (new or used).
https://fred.stlouisfed.org/series/MSPUS

https://www.cbsnews.com/news/apartment-rent-price-august-dip-realtor-costar/
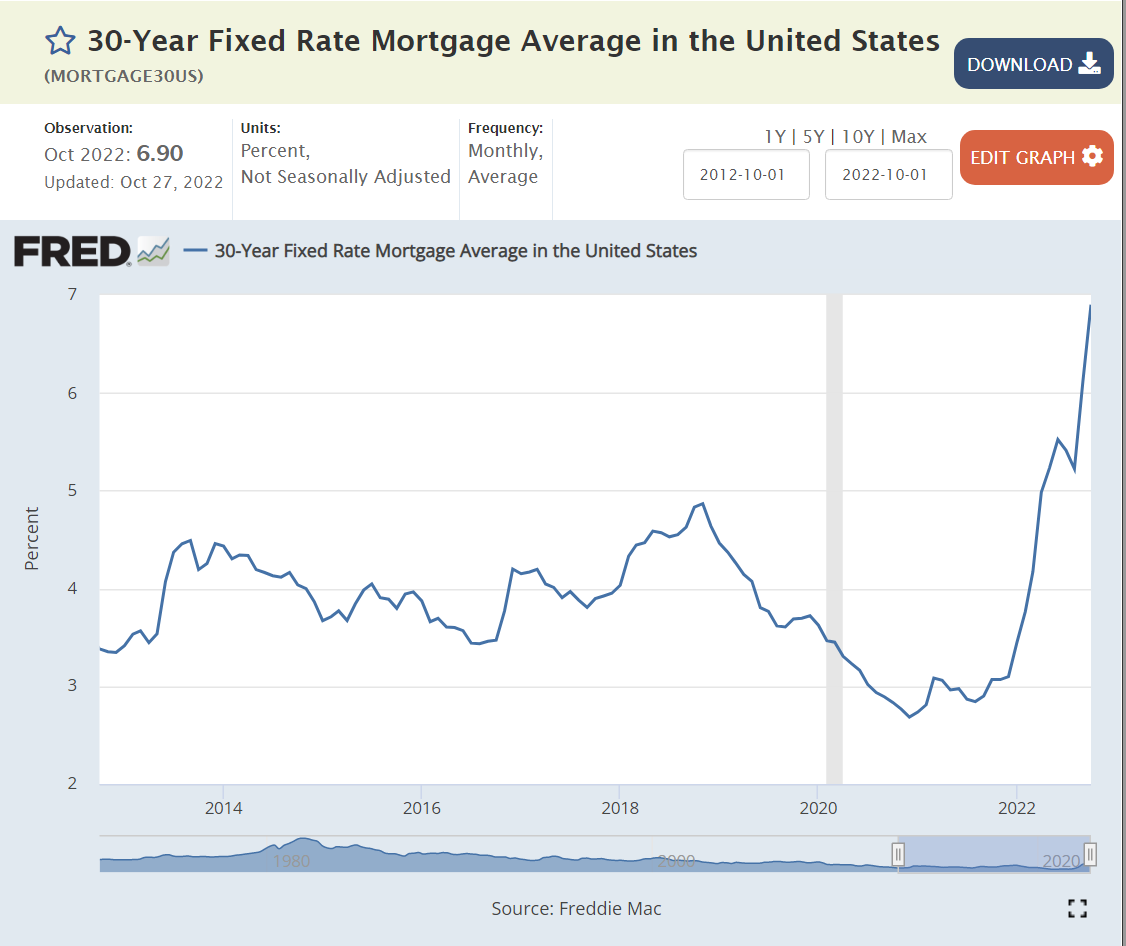
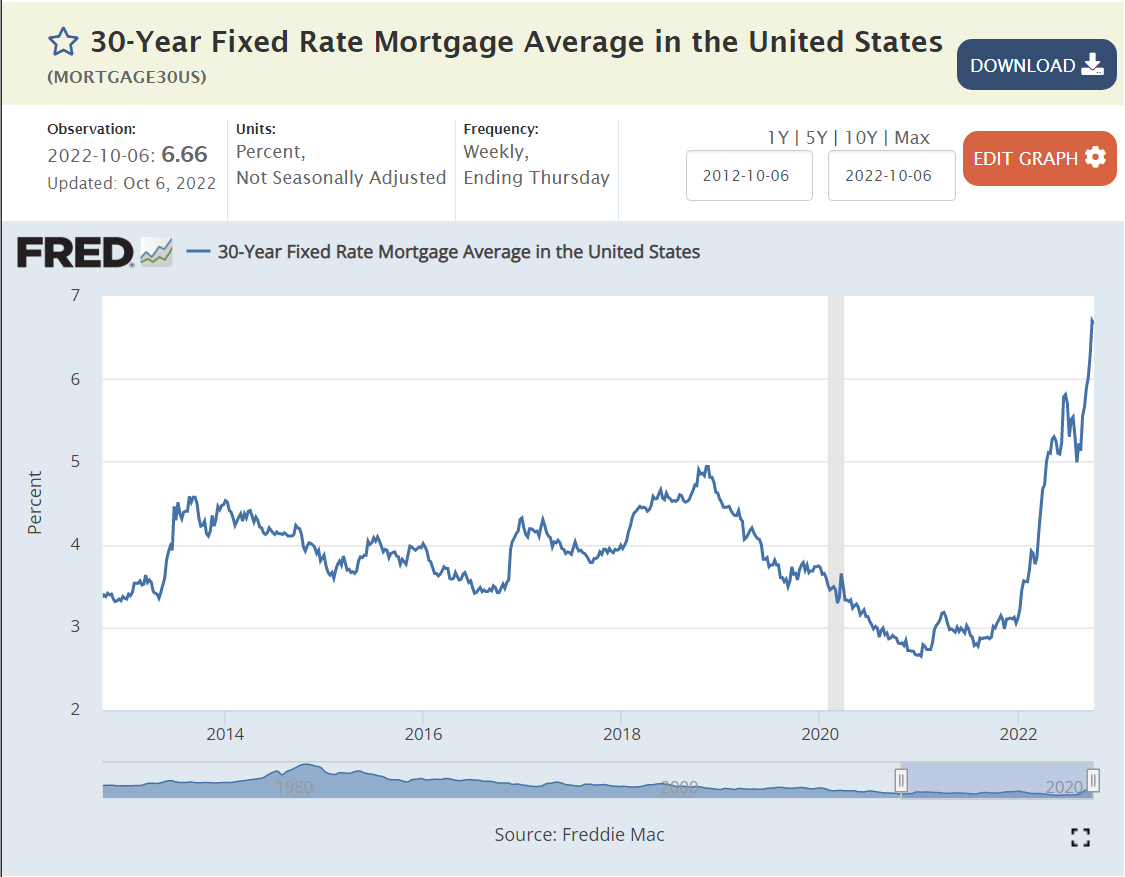
With the Fed driving higher mortgage interest rates, consumers can afford less housing, so demand for new and used housing has dropped, causing owned and rental prices to flatten or fall.
Consumers have clearly seen the substantial increases in housing values and rents, and the subsequent flattening in recent months. Most consumers would estimate experienced annual housing inflation at more than 10% for the last 2 years and be unsure as to expected future housing and rent prices. When in doubt, consumers are likely to expect the worst; some level of continued increases in rents and total costs (mortgage payments).


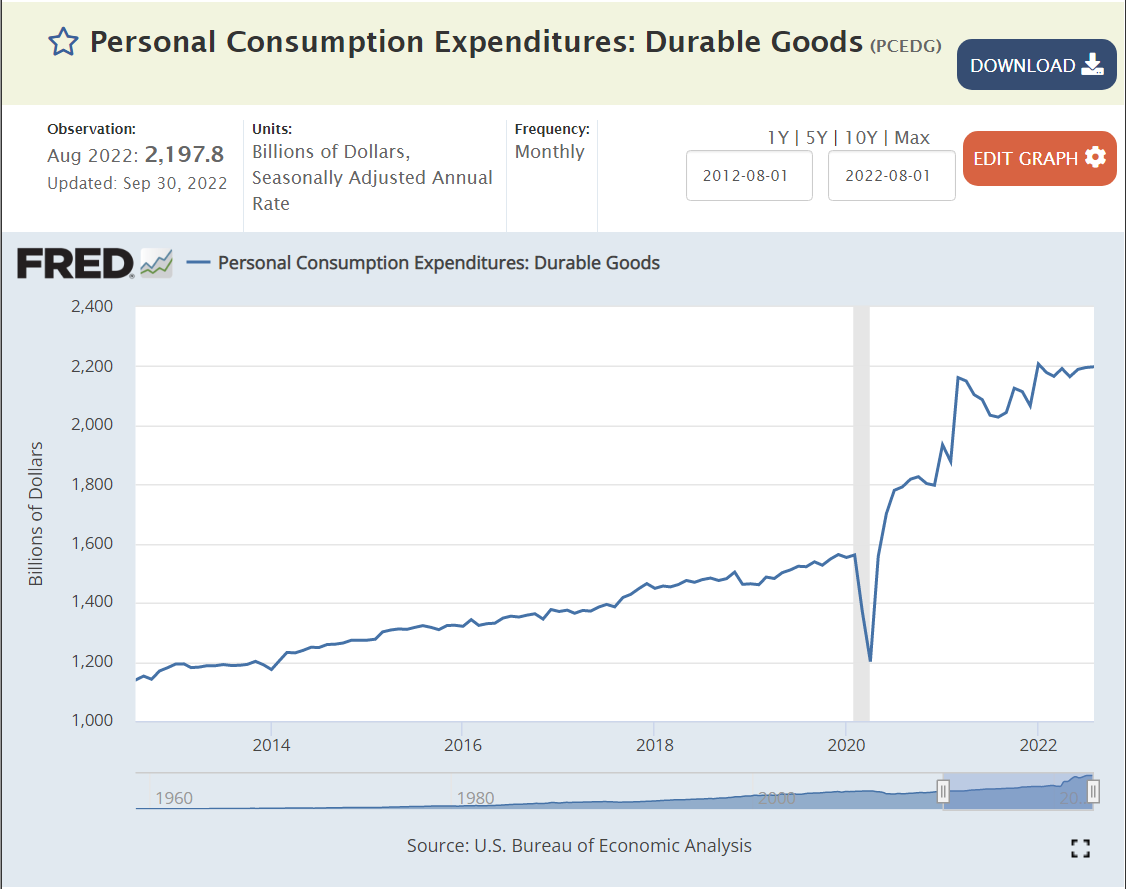
https://fred.stlouisfed.org/series/CUSR0000SAD#0
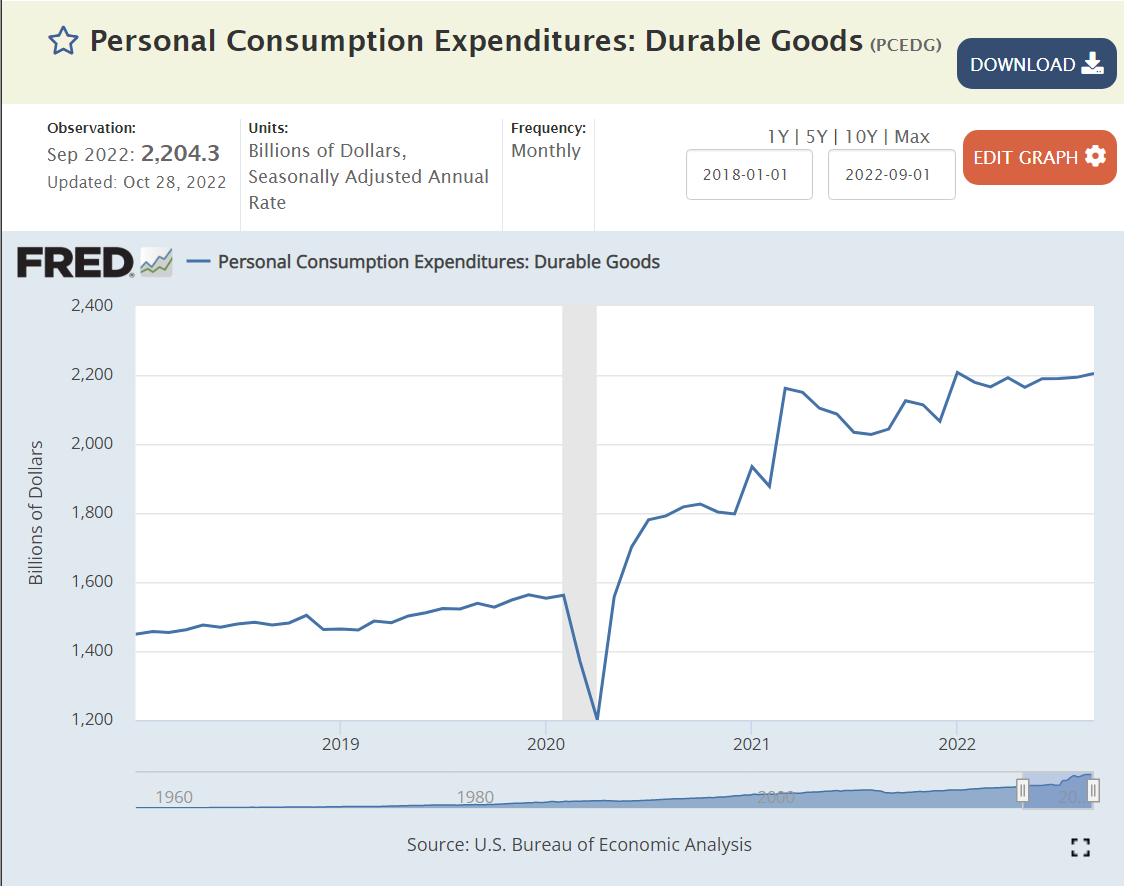
The pandemic’s large consumer and business subsidies lead to a 20% spike in demand for durable consumer goods, which drove a 25% price increase in 18 months. Consumers obviously experienced this large price increase, even though it was implemented over more than a year. Prices effectively peaked by February, 2022 and then returned to their usual 0-2% annual level. Consumers can feel that “everything costs more”. Many durable goods are purchased infrequently, so the new zero inflation will take some time to shape consumer perceptions, but we are already 9 months into this cycle, so consumers are mostly feeling better about this category.

https://fred.stlouisfed.org/series/CPITRNSL
The “transportation” subset of the CPI looks like the durable goods graph. It contains the prices of cars and trucks, the cost of fuel, insurance and maintenance. I think that most consumers would say that transportation costs are up and have not yet begun to fall, even though the index indicates that they plateaued beginning in March, 2022. This is another category where expectations should slowly change to match the numbers.

https://fred.stlouisfed.org/series/CUSR0000SETA02
Used car and truck prices stayed flat or declined in the 7 years before the pandemic. In the 17 months from June, 2020 to November, 2021 they increased by 45% as private vehicle demand increased and new car supplies shrunk. Used car prices have essentially flattened in the last year. Consumers are aware that prices have stopped increasing but suspect car dealers of still trying to raise prices further. A little more positive experience on this higher profile measure will help to reduce inflation expectations.
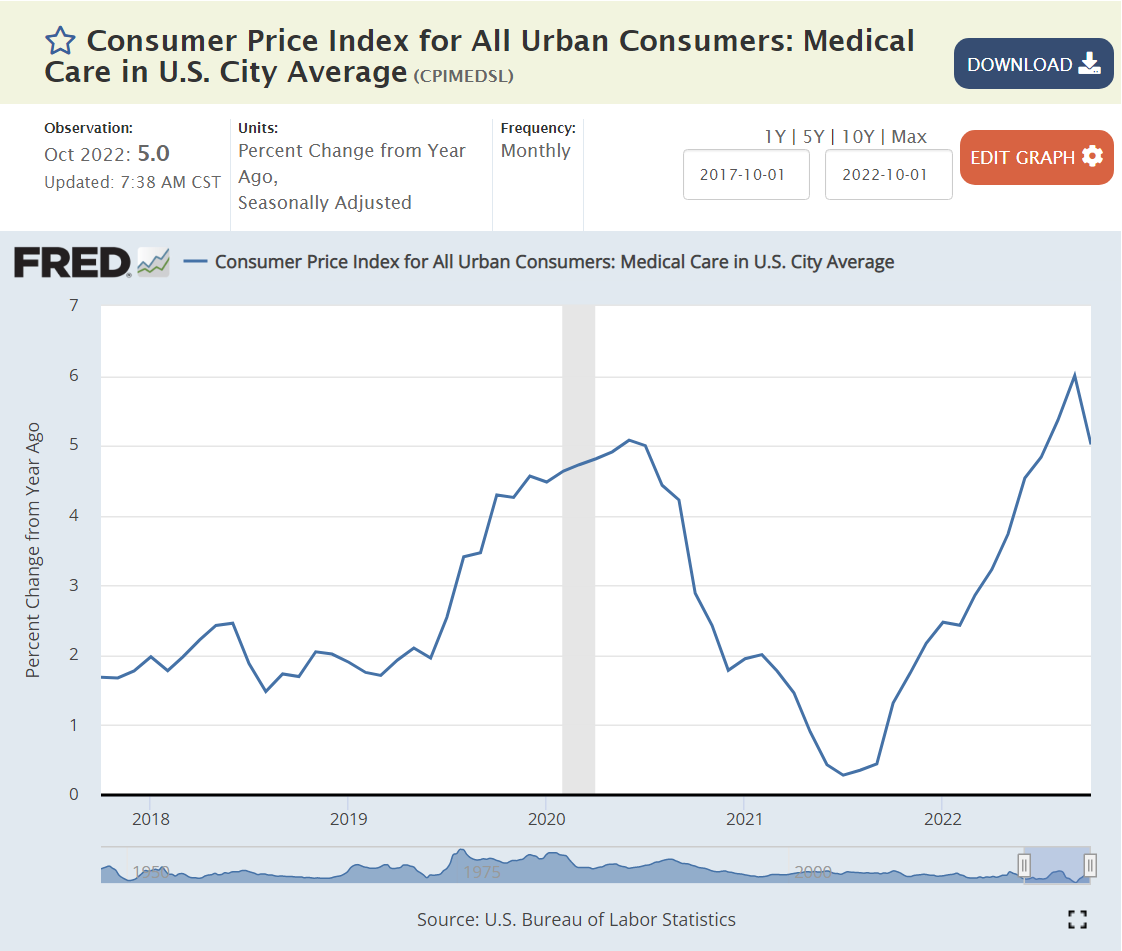
https://fred.stlouisfed.org/series/CPIMEDSL#0
Medical cost inflation was a bit elevated at 5% heading into the pandemic, then fell to less than 2% during 2021. It has since returned to 5%. Consumers have relatively weak perceptions of medical costs due to the buffer of insurance policies. Most service prices were restrained during the first 2 years of the pandemic as demand for durable goods was up, but demand for services was down.

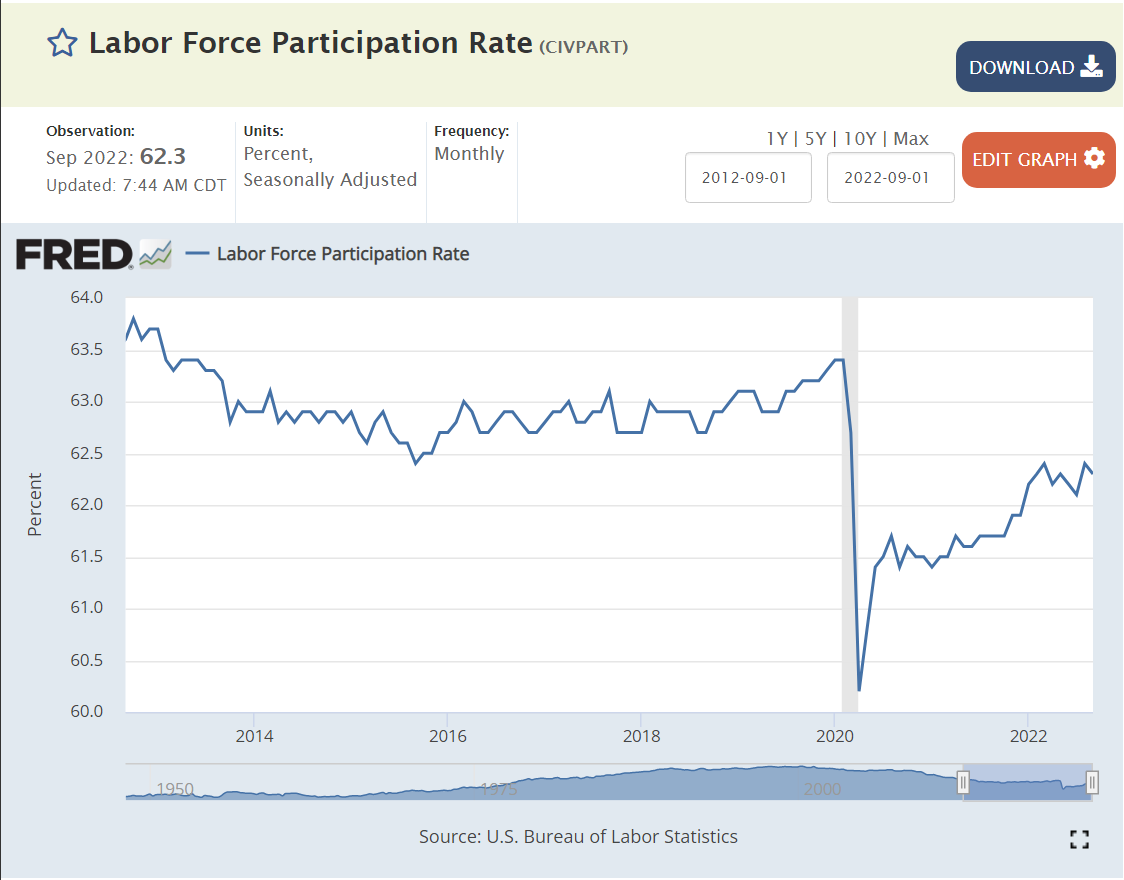
https://fred.stlouisfed.org/series/LES1252881600Q
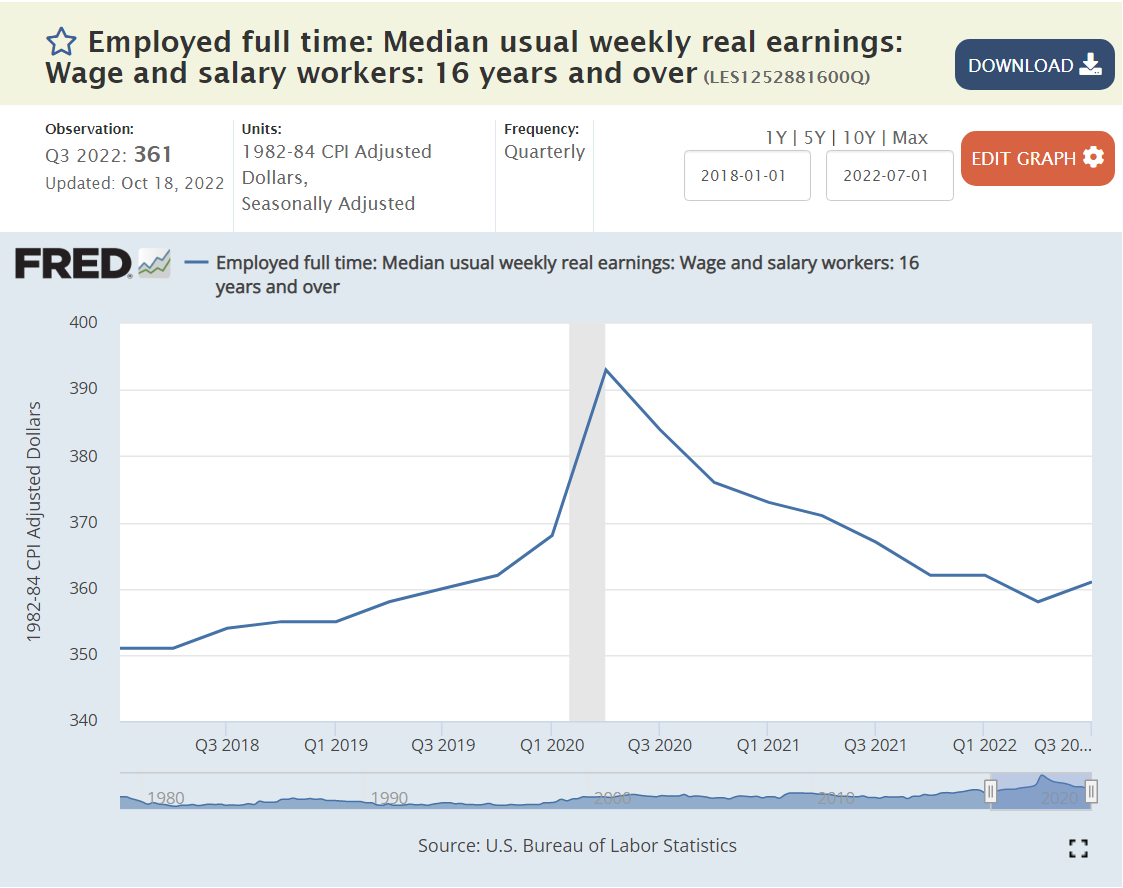
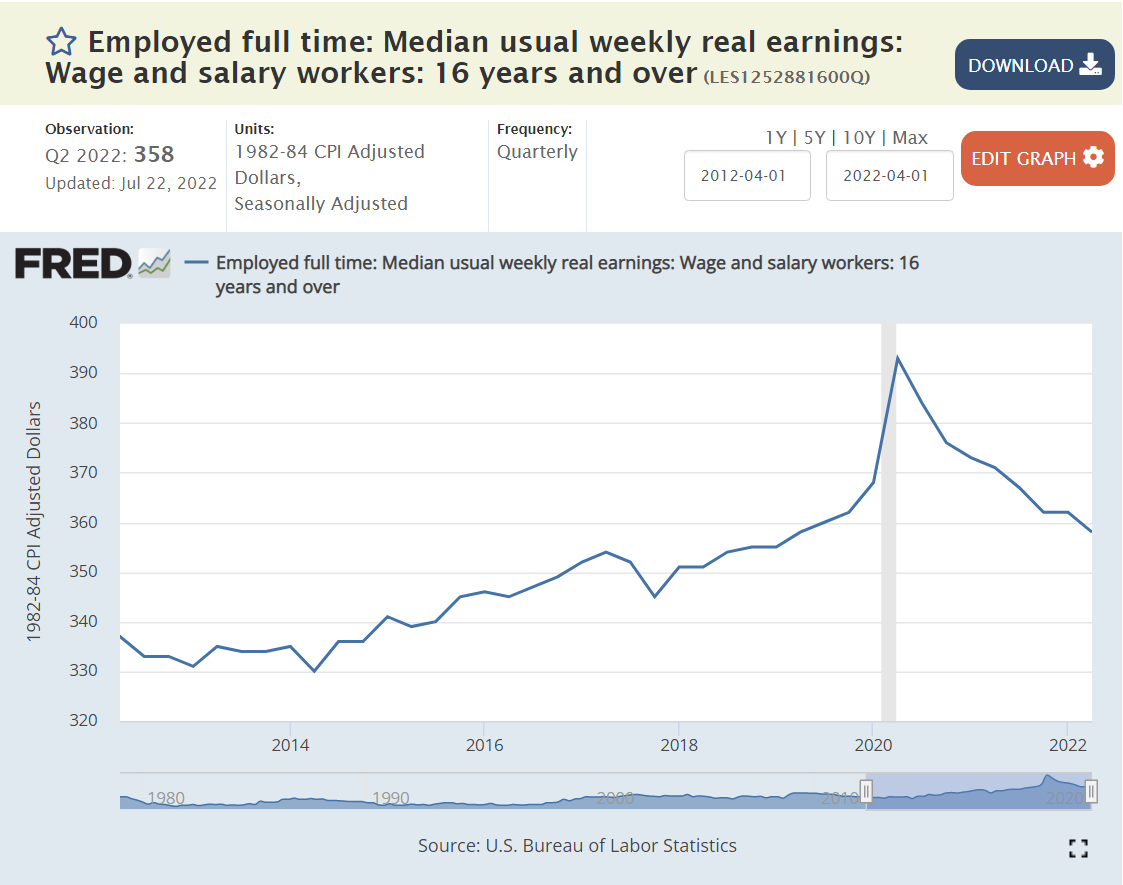
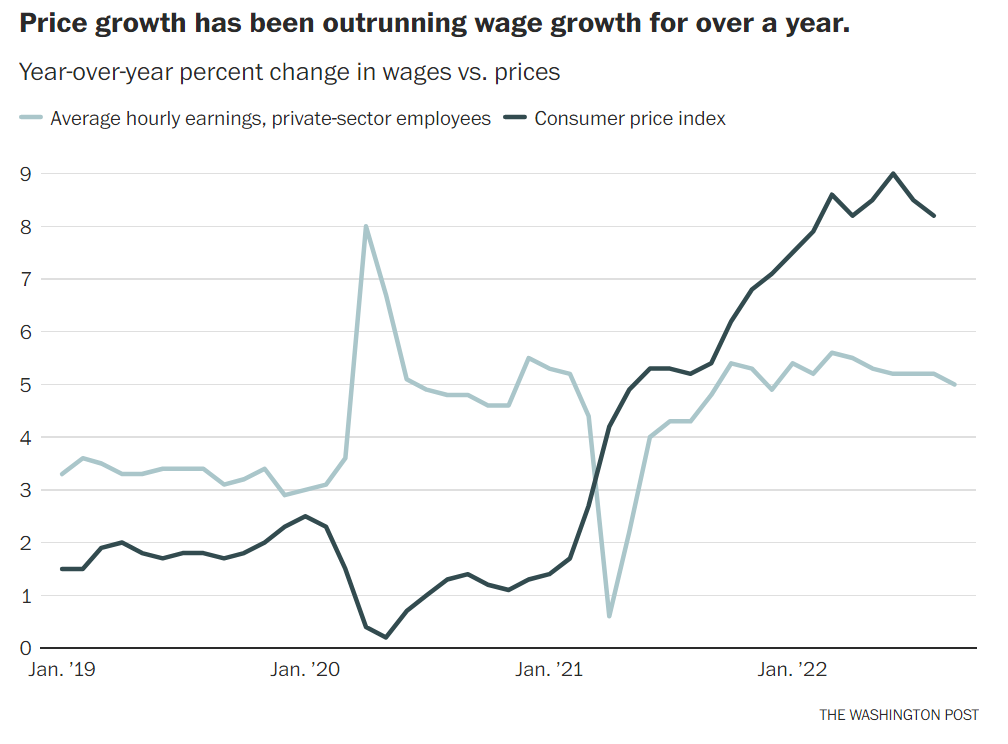
Another way that consumers gauge inflation is through their “real”, inflation-adjusted incomes. Real incomes were increasing slowly in the 3 years before the pandemic, following many flat years. Businesses bid up wages during the first year of the pandemic, but then reduced the increases in their offered wages to less than the increase in inflation. Hence, real wages have decreased by about 2% annually in each of the last 2 years. Hence, at a total level, workers are feeling inflation, because their wages are able to buy a little less at the end of 2022 than at the end of 2020 or 2021.
Summary
The data clearly indicates that inflation has peaked and is heading downward. The rate of decline is unclear. It’s unclear how long it will take to return to a stable 0-2% rate. Consumer perceptions are likely to lag the data by 3-6 months.
Total inflation reached an inflection point in June, 2022, pointing to 3% inflation, rather than 8-9%. Core inflation increased quickly throughout 2021 to a 6% annual level, but has remained flat at 6%. Food inflation reached a 12% annual level, but has slowed to 7%. Energy inflation reached 30% for an extended period of time, but has decreased to “just” 20% with high variability. Official housing costs rose by 8% annually, while consumers experienced 10% plus cost increases. The official housing inflation rate has declined a little to 6%, while consumer perceptions of current and future housing inflation are mixed. Durable goods inflation exceeded 12% annually, but has dropped back to its typical 0-2% range. Broadly defined transportation costs increased by 12%+ for more than a year and have flattened out recently at close to zero percent. Medical cost inflation was low after the pandemic, but has increased back up to 5%. Real worker wages have declined by 4% in the last two years, making inflation a felt reality. There is no sign of a wage-price spiral.
The worst of the post-pandemic inflation appears to be over. Key sectors show flat or declining inflation. Gas prices and used car prices are down. Consumers have used up most of their excess savings. Government spending is way down in real terms. Increased interest rates and a tight labor market are slowing the economy. Consumer inflation expectations are coming down with experienced inflation. Barring another major supply chain disruption, inflation should be under 3% before the end of 2023.


_and_Manufacturing_Employment.png)