Ryan Burge is THE data guy on American religion. Sociologist, political scientist and ordained minister. He got everyone’s attention with his projection that the historically important Presbyterian Church would be gone – poof – within 20 years. Let’s review the forecast.
The data is straight from PCUSA reports and the trend is really tight.
Decline in every year, but 2012-18 is really brutal. The whole period averages 63,000 lost members per year. 2019-22 averages 53,000.
I’ve never seen a trend continue in a linear fashion all the way to zero. There are always countervailing forces. The rate of decline varies. So, I think we should frame this like the “half-life” of a radioactive isotope. How long does it take for the church to lose one-half of its members? At this point, it’s more likely that some level of percentage decline will continue than a straight linear model of decay.
The national member decline points to 9 years for one-half of todays members still remaining. The relatively better last 4 years indicates 11 years. Hmmm. Pretty close to Burge’s 20-year forecast.
The percentage loss is a better predictor. The percentage decline was alarming but just 2%ish in the “oughts”. It accelerated to more than 5% per year in the dark years before dropping a little to 4.3%. The long-term and recent annual declines are both 4.3% per year. A very scary rate. Thanks to the “benefits” of compounding, it takes 16 years for 96% of 96% of 96% to reach 50%.
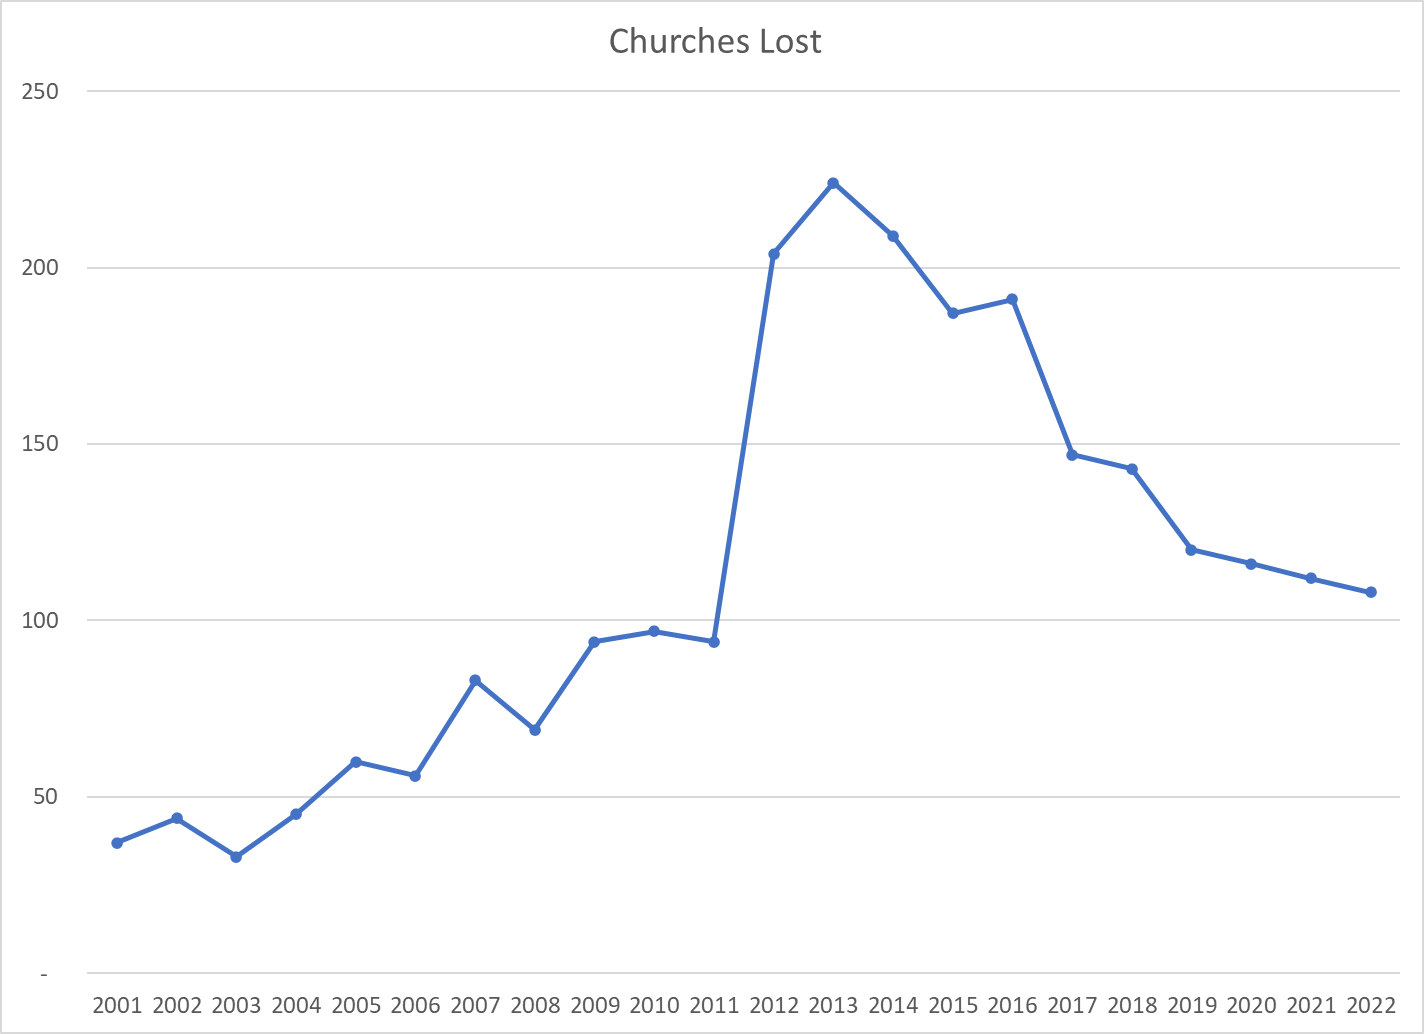
Churches and congregations are quite resilient. Presbyterians are not exactly governed on the fully “Congregational” model. They have a national and regional structure that has some impact on local affairs. Nonetheless, local congregations consider themselves to be in charge and act that way. The church decline is much slower. The acceleration in 2012-18 is obvious here too.
50 net lost churches per year became 100 and then 200! The losses have since declined towards 100 per year. Not “good news”, but improvement.
The “percentage” chart mirrors the “changes” chart. The recent 1.4% loss per year points to 50 years to cut the number of churches in half. Resilient, indeed! Ironically, the loss of churches can be “good news” for the remaining churches who absorb some of the lost church members.
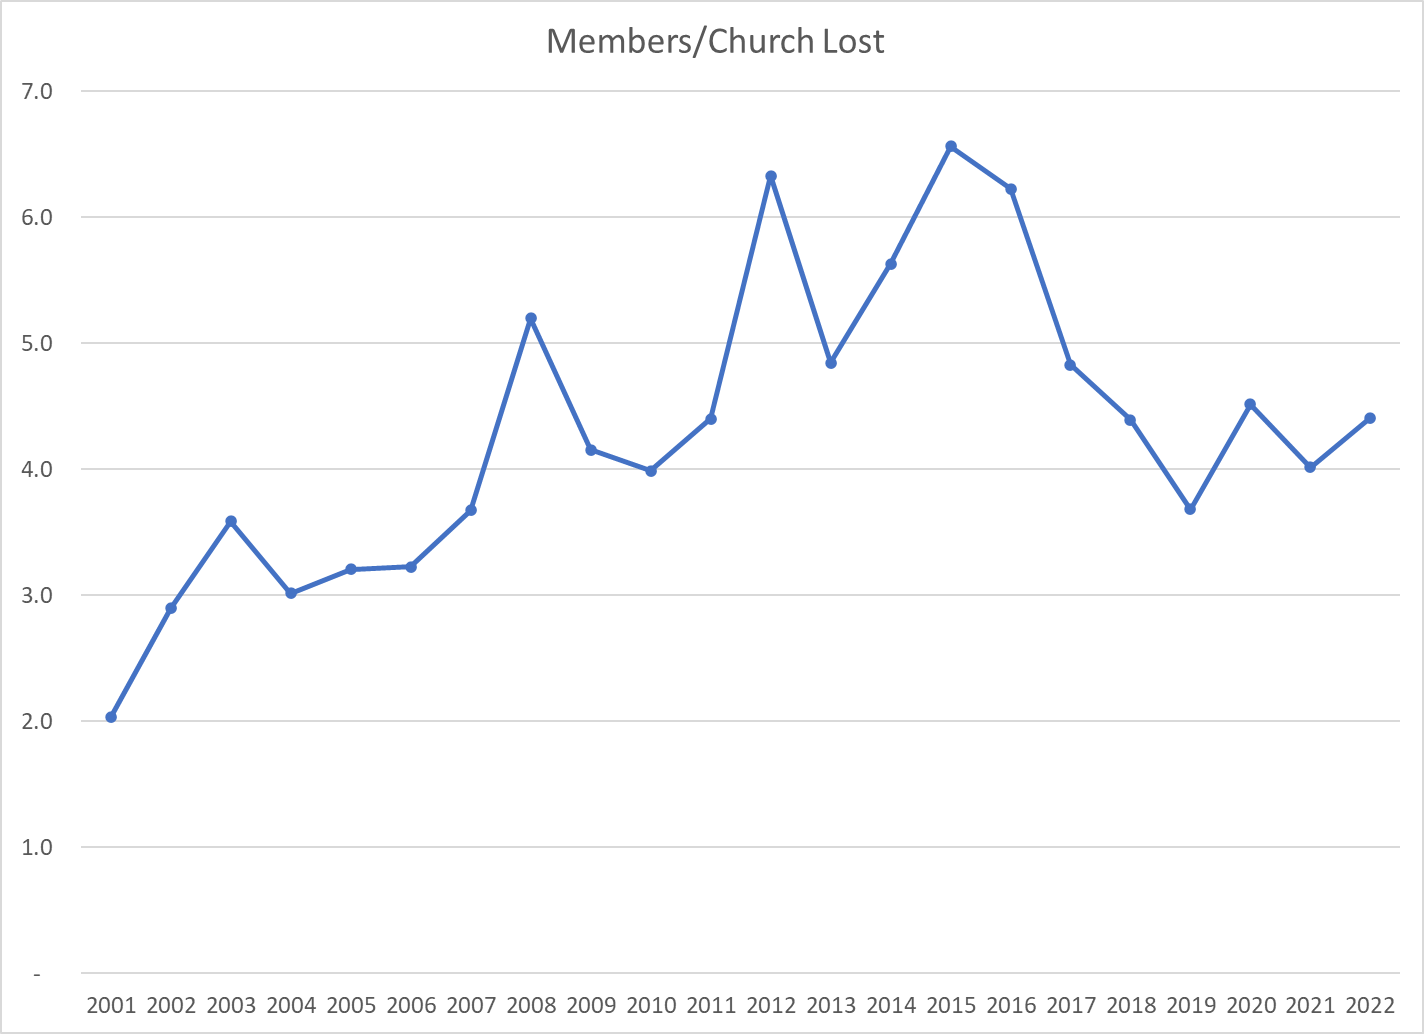
The members/church graph is quite similar to the members graph, but the decline is a little slower.
The overall and recent numbers are a loss of 4.3 members per year. It takes 15 years to lose 50% at this rate.
Local congregations saw their loss percentage grow from 1% to 4% in 15 years. The recent 6-year average is 3.2%, That provides 22 years to lose one-half of remaining members. If I was wagering in an on-line market, this would be my bet. Continued 3% loss per year for the next 5 years is likely.
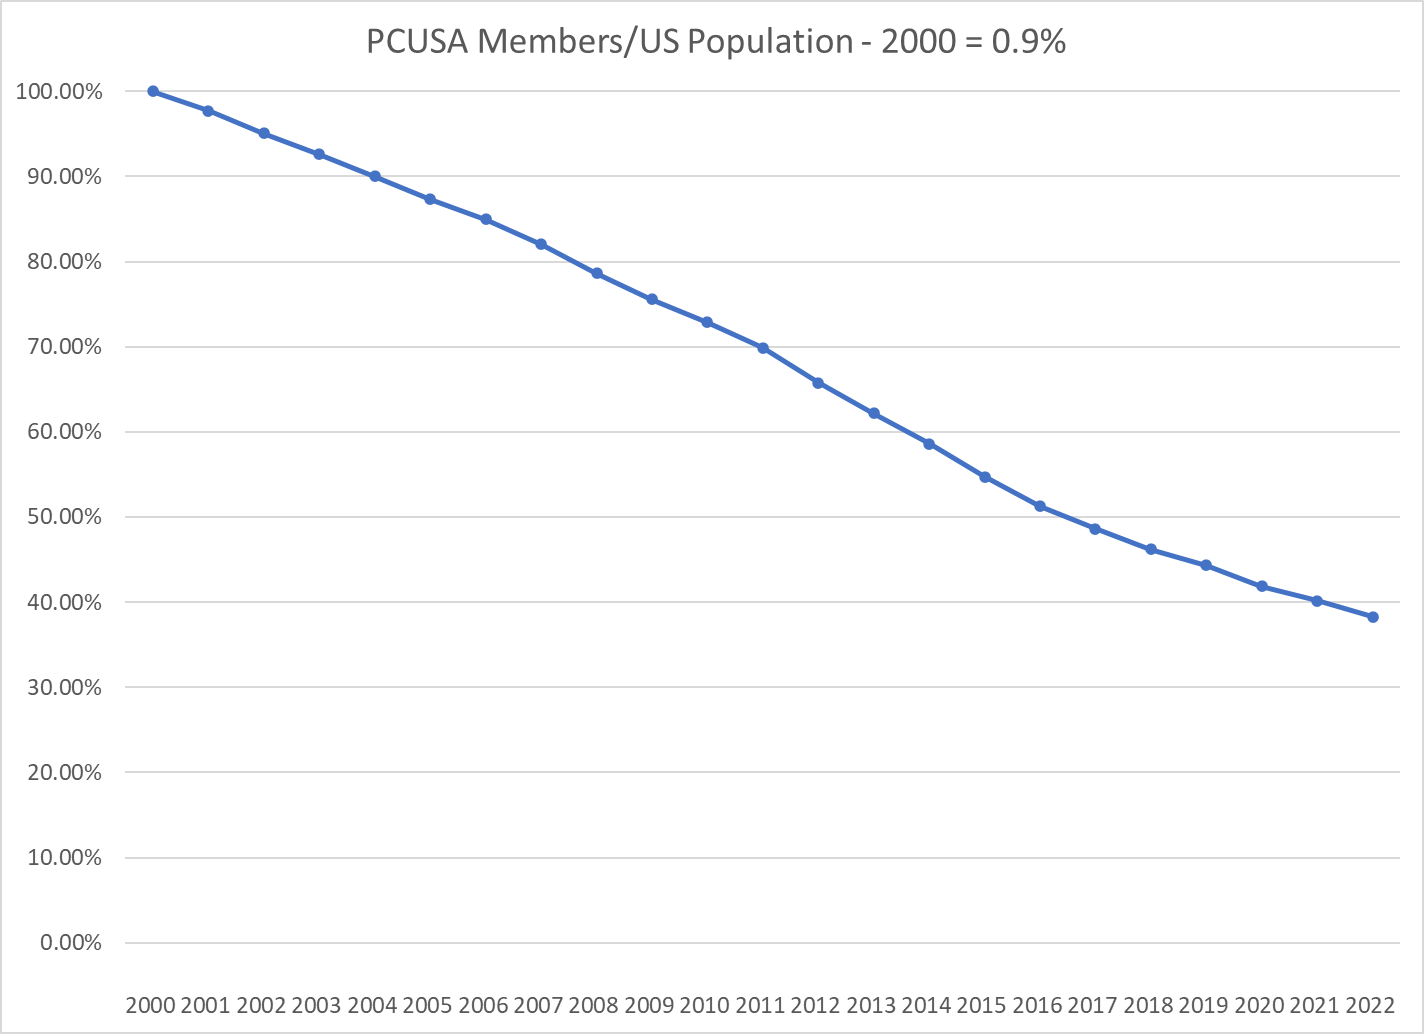
The US population has grown by 18%, adding 50 million people since 2000. PCUSA has been shrinking while the country has been growing. Presbyterians were 1/110 citizens in 2000 but are only 1/300 today. A two-thirds reduction in their share.
Can/will the denomination survive?
The significant improvement between 2012-18 and 2019-22 charted above provides evidence that the trend is improving.
The decline of “mainline” Protestant church membership appears to have bottomed out in 2016 at 12.8% of the country and stabilized at 14% in the last 6 years. Evangelical Protestants surpassed the mainline folks around 1982 and peaked at 30% market share in 1992. They have lost more than 10% of the US since then. By some measures, the Mainline denominations have more members than the “evangelicals” today.
Presbyterian Future
Megatrends greatly impact religious organizations. Some (generally) optimistic observations for the long run.
The US is a more highly educated country. The Presbyterian emphasis on thinking and “the Word” should be attractive.
The world has generally evolved to hold more complex views on science, politics, economics and philosophy. Presbyterians have been able to adapt to these changes without compromising their theology.
The worlds of trade, migration, culture, media, technology and globalization continue to evolve. Adaptability matters.
The era of “Big Government” is over. High service religions are filling the void.
We live in “A Secular Age” where the default view is skepticism and materialism. The Reformed Church’s blend of conservative core and liberal application is well suited to address religious seekers in this context. It is also equipped to wrestle with the extreme claims of atheism.
Younger adults claim that “authenticity” is their highest value. Presbyterians have a 500-year history of seriously reading and applying scripture, and then living their beliefs (imperfectly).
Teens and adults invest a great deal of time in constructing and affirming their personal identity today. The surface Presbyterian identity may require some marketing help, but most Presbyterians are very comfortable with the positive role that religion plays in their identity.
We live in a politically polarized time of left versus right. Our current challenges could lead us back to the center with the Presbyterians, mixed market capitalism and liberal democracy regaining their appeal.
We live in an “individualistic” age. Presbyterians embrace individualism through man’s direct relationship to God and responsibility for moral understanding and choices. Presbyterians also emphasize the balance of community in their governance, role in the universal church and service/mission projects.
We live in a “therapeutic age“, where every child has unlimited growth potential and a need to find and live their own path to self-fulfillment. Presbyterians embrace potential and personal development but retain a strong sense of original sin, human weakness and the need for help in living a moral life.
There is pressure for individuals to choose a political side, red or blue. Yet, a greater share of voters claim to be independent or to hold a variety of so-called liberal and conservative views on individual issues. The Presbyterian Church has roughly equal numbers of these 3 groups and they mostly function well together.
We live in a time when individuals demand “certainty“, even though scientists, mathematicians and philosophers have removed the possibility of absolute certainty. The Presbyterian emphasis on serious study of God’s Word and world allows members to cope with only a “strong” certainty that increases with time.
We live in a scientific age. Presbyterians have been able to reconcile their theology with modern science throughout the last century.
We are said to live in a post-structural or post-modern world with everything based on subjective views, except that powerful actors oppress the weak and that it is moral to reject this oppression. Presbyterians embrace an objective view of morality and are historically intertwined with the advance of “Western Civilization”, mixed market capitalism and liberal democracy. Those who find postmodernism to be a dead end may look back to the center.
We live in a materialist consumer culture. Presbyterians are not highly effective at defining their product, defining a brand, determining target markets or conducting marketing campaigns except through traditional personal means.
We live in a culture that emphasizes rights before responsibilities. Deeply serious Presbyterians emphasize responsibilities to God, neighbor, community and self. Presbyterians recognize equal rights for each of God’s children and have supported modern “rights” campaigns.
Presbyterianism may continue as a smaller denomination and never regain the size and influence that it once had in the US. It has many assets to support a positive future.
Austin and Tamara are a married mid-thirties couple with two preschoolers living in a suburban starter home. They met at a tree-planting volunteer day at a park near the luxury apartment district where they both lived after finishing college. Austin is a systems analyst for a medium-sized firm that owns and operates health care and retirement communities. His parents and a brother live within an hour. He was raised as a Baptist but has been mostly a casual church goer as an adult. He considers himself politically independent but has voted in some Republican Party primaries. Tamara moved to the US at age 5 and identifies as Hispanic. She manages 3 franchises of a hair-cutting business. She majored in “American Studies” in college with an emphasis on American religions, was raised Catholic but has been affiliated with 2 different mainline churches as an adult. She has mostly voted for Democrats but also considers herself a political independent. She has no nearby family members. Tamara has been visiting churches in the area for a year, without Austin, and is ready to share her findings.
The Brand
Austin: Wow, I didn’t see you choosing them. Aren’t they one of those very conservative Protestant churches?
Tamara: The church has a serious side, but it’s generally considered to be one of the more liberal, tolerant, flexible mainline denominations. I think it will work for me.
A: What’s the odd name all about?
T: A presbyter is a spiritual elder. Like many early Protestant denominations, they wanted to break away from the hierarchical Catholic model and manage congregations mostly at the local level. Some churches label themselves as “Reformed” churches or even “Reforming” churches to highlight their role in the Protestant Reformation instigated by Martin Luther and their engagement with modernity, rather than their governance structure.
A: Aren’t they the ones who believe in predestination of the “elect” and got caught up trying to prove that they’re saved?
T: The founder John Calvin’s theology and the early life of the church highlighted this and distinguished them from Lutherans and other Protestants. Keep in mind that “salvation” was the overwhelmingly the main religious focus around 1500. That’s why the Catholic indulgences were such a good source of revenue and at the core of Luther’s criticisms. The Italian Renaissance had started to open the door for modern days and thoughts, but the culture was still mostly Middle Ages, dark ages, medieval. Without science or medicine, with plagues and short lives, common deaths during childbirth, periodic invasions and landowners with arbitrary power, the people were very focused on heaven because the threat of death was a constant companion. Calvin agreed with Luther that people are saved by God’s gift of grace through faith, not through priests, the Catholic Church or good works. Calvin’s logic led to the idea that God has pre-ordained the “saved” versus the others. I didn’t see this as an important part of the modern church in their creeds, confessions or sermons, although Calvin’s seriousness about life and faith continues to be seen.
A: I loosely associate this church with bankers, Puritans and Masons. Any truth in these images?
T: The Presbyterian Church was an early and influential church in the US, so its members have been civic, business and political leaders for centuries. I think they’ve had a half-dozen presidents, probably second to the Episcopalians who have a similar history. They’re definitely part of the so-called “mainline” churches that were highly influential throughout the 21st century. They’re not tied to the Puritans or the Masons as far as I’m aware. They remain mostly a white-collar, professional class church in many places.
Just How Serious?
A: How serious is this church? I was just hoping to find a nice place for our children to learn about the Bible, a social community and an inspirational sermon from time to time.
T: The two Presbyterian churches I visited did have a warm social vibe and a lot of space and volunteers devoted to childcare and youth education. The church radiates seriousness in many ways. The worship spaces and buildings were spare, clean, almost secular. The worship bulletins were pretty structured and part of a calendar of worship. Sermon topics ranged widely, but these places were more focused on “the word”, on logic and rationality than on feelings or mystical spirits. The creeds were highlighted on-line and used in worship. Joining the church requires a public pledge of commitment to the core beliefs. The greeters emphasized that the church works hard to engage new members in the life of the church and expects them to be active members.
I could tell that theology and consistency matters to these groups. One said that we do everything “decently and in order”. Jesus in the New Testament was at the heart of each sermon. The ministers and congregation seemed to be serious about their moral lives and those of their kids. They were hungry for understanding passages from the Bible, thinking about purposes and connecting with God. They believe in free will, responsibility and an objective real and moral universe. Members seemed to be serious about church attendance, prayer, education and behavior. Salvation was not the primary focus, but it was part of the structure of messages.
So … yes, I’d say that they are pretty serious about religion. Not overly so, self-absorbed, proud, self-righteous or imposing on others, but religious belief and practice clearly matter.
A Sense of Humor?
A: Your description helps to explain my preconceptions. I’m a structured guy. I appreciate order. But you can go too far. Are there two sides to this coin? Some positivity to balance the “dead serious” core? A sense of humor, lightness, balance or tolerance even?
T: I’m sorry. I’m answering you too literally, without scope or balance. This is an interesting question. I didn’t find negativity anywhere! Focus, attention, clear thinking, concern and connectedness, yes. But negativity, per se, was absent. Well, they do believe in “original sin” and that Jesus died to remove the burden of sin from man. They know that people are morally imperfect and need help to live moral lives. They believe in some kind of heaven and hell. I guess you might call this “negative”, but all of the Christian denominations generally hold these views.
I think the positivity comes from the “good news” gospel of Jesus saving men and instructing them. Jesus is seen as directly accessible to individuals in prayer. They focus on God creating each individual in his image and giving them a name, to be known. They appreciate the opportunity to join together at church, in communion, in small groups and in service projects. I observed spiritual calm and centeredness at times. They spoke about the gift of “grace” often and appreciated that gift. I witnessed a general confidence and hope about the future in these churches.
Beliefs
A: What are their core beliefs? Do they make logical sense? Are they much different from the Baptists and Methodists? Will I need to take a theology course to join the church?
T: Their main beliefs seem to greatly overlap with the other mainline churches. You won’t need to go to school or pass a test. They do agree that Jesus is fully man and fully God. They describe God, Jesus and the holy spirit as 3 dimensions, faces or “persons” of the single true God. As in the Catholic church they “proclaim the mystery of faith”. People are expected to understand the surface description of the creeds and through time try to better understand the mysteries of “3 in 1” or “both/and”.
A: Which “person” is most important? Jesus seems to dominate in most churches today.
T: Tough question. I agree that some of the more conservative churches really elevate Jesus to be the 90% factor. I didn’t see that in the Presbyterian churches. Jesus was in the sermons, creeds, songs and prayers as the essential connection between God and man. Yet, the Old Testament has its fair share of worship time. Salvation by grace through faith points to God. ”The word” in the whole Bible points to God. The holy spirit gets a smaller billing. It is emphasized in prayer, communion, meditation, moral decisions, accepting grace and many songs.
A: How does this church see the 3 “persons”? What should I expect? Will I be surprised or concerned?
T: The father is seen as an “awesome God”, beyond human comprehension. ”Be still and know that I am God”. The demanding God of the Old Testament is viewed as the same loving God in the New Testament. God is the eternal, infinite, all powerful God, the source and purpose of all, the ultimate. Yet this is a personal God who created Man and individuals, who cares and listens to prayer. He is accessible in prayer and worship, through Jesus and the holy spirit. He is a creator and a mystery. He speaks to man directly, through scripture, prophets, Jesus, the soul, nature and reason. I didn’t hear an appeal to logic, science or history to support God, only acceptance of his obvious presence.
Jesus is seen as a prophet, teacher and savior. Co-equal with God. A more human scale opportunity to intimately connect with God. He is an example of a perfect life and an inspiration to imitate his life. As a largely verbal church, the idea of God’s communications or “the word became flesh” is important. Mystery remains. Guilt for human deeds is summoned by the crucifixion.
The holy spirit is welcomed as a gift. A personal channel for understanding, self-awareness and good moral decisions. An inspiration to do more and better. Presbyterians believe in the spirit having a real impact in this world, just like God, miracles, saints and angels. They believe that the spirit can deliver gifts of teaching, prophecy and tongues, but this is not emphasized. The Presbyterian spirit is more “calm and rational”, rather than fiery, dynamic and emotional, but it matters deeply to active members who seek its guidance and support.
Not many Presbyterians seem to pursue mystical experiences. They don’t devote all of their effort to an eternal life in heaven. They appreciate their lives on earth. I don’t think that other mainline Protestants would find significant differences from the Presbyterian Church. There are some differences of style and emphasis.
Think, Feel and Do
A: That helps. I’m seeing more balance than I expected. How does this church approach the three dimensions of religious life: thinking, feeling and doing? Thinking appears to have the upper hand.
T: This is a “rational” religion, born after the peak years of Thomas Aquinas and Scholasticism. Luther and Calvin were both biblical scholars and wrote great essays and biblical commentaries. They elevated God’s word in the Bible above other sources of revelation. The Presbyterian creeds and confessions guide pastors and members.
The church encourages the use of feelings to motivate individuals. The faith summary of “to love God and to love neighbor” is widely shared. An intimate relationship with the 3-person God is sought. Prayer, scripture, music and worship services include the emotions. God and Jesus ask individuals to bring their sorrows and concerns in prayer to be relieved.
The church is an active church, reflecting Max Weber’s notion of a “Protestant work ethic”. Members are busy with education, small groups, service projects and committees. This work is considered the proper response to God’s grace. Members are expected to fund and serve mission work locally and globally. The three categories are nicely balanced.
Style
A: What will I experience in worship? What’s the style or feeling of the church space? What sacraments are practiced? Is God present? Does it feel sacred?
T: Presbyterians practice holy communion and baptism. God is present in both sacraments and in the church amongst the “community of believers”. Communion and baptism might seem plainer than in other faith traditions. Presbyterians do not believe in transubstantiation. Some sacramental services today are elevated in importance with additional music, time, words, prayers and decorations.
Presbyterians and Lutherans both reacted against the complexity, multiple senses and ornate styles of the medieval Catholic churches. Worship is focused on the individuals’ connection with the spoken word of God. Church architecture is often simple and plain, tan and Scandinavian. It emphasizes the priesthood of all believers. Some Presbyterian churches do have stained glass windows, soaring architecture and added visual features, but the overall look is normally clean.
Likewise, the worship service emphasizes “the word”, church music and personal greetings. Congregational dress is mostly semi-formal today. Ministers and choirs often wear robes. The church employs various forms of audio-visual equipment and broadcasts the service. Most churches incorporate “contemporary” music into some services. The church retains its “low church” simplicity, but some Presbyterian congregations have increased their use of “high church” elements to spice things up, increase engagement and emotion and help people pull closer to God. Presbyterian churches have a communion table without major separation from the congregation. The sanctuary has a sacred presence, though it cannot compete with a cathedral for most visitors!
Discipline
A: How strict are the church’s rules? How are they enforced? Who enforces them? What are the consequences of not complying? How does the preaching emphasize the church’s expectations?
T: More great questions. The church is serious about moral behavior. It has a relatively strong belief in clear “right and wrong” actions. It believes in original sin, free will, personal responsibility, and the necessity of believing and accepting grace to gain salvation. The consequence of sin and non-salvation is eternal separation from God.
Presbyterians believe that the Old Testament is the inspired word of God, so they believe that the 10 Commandments should be obeyed. They believe that Jesus’s injunction to “love God and love neighbor” is a continuation of God’s will for men. They don’t read the Bible literally, so there is room for interpretation of its many instructions. Presbyterians acknowledge that different denominations have different beliefs. They believe that the individual is ultimately responsible for interpreting the “word of God” and responding appropriately. They understand human weakness. Members tend to consider the situation when making a moral judgment rather than attempting to strictly follow all rules. In practice, this makes the Presbyterians a relatively liberal or tolerant church with respect to moral conduct despite its serious, thinking, “right and wrong” foundations.
On the other hand, Presbyterian ministers, leaders and members tend to have high expectations for moral behavior. ”Love God and neighbor” has no limits. ”Accept grace” and “have faith” mean completely, without limits, always. Presbyterians expect themselves to act morally in thought, word and deed in all situations. In response to God’s saving grace, they expect members to donate and serve, and then do some more as requirements become apparent. Members are expected to engage and participate in the congregation and community to identify those needs. The church sometimes takes positions and encourages members to address social justice issues.
Ministers have less formal and informal powers than those in other denominations. The “priesthood of all believers” philosophy levels the status of ministers. Ministers do have formal powers to act on behalf of the congregation and informal powers based on their roles, messages, knowledge, wisdom and relationships. Ministers do provide counseling to members. The church does not hear confessions or assign penance. The church employs professional counselors and uses small groups to provide advice and feedback on personal and moral issues.
The Presbyterian Church today tends to take a constructive approach to moral conduct: instructing, modeling, encouraging, leading, sharing, suggesting, advising and counseling. Removal from membership is rare. ”Fire and brimstone” or fear-based sermons are rare. Individuals are not “called out”, asked to “repent” or “be saved” in services. Individuals are encouraged to privately consider their conduct, feel proper guilt as appropriate and take steps to offset any impacts and improve their behavior.
Community
A: What are the people like at this church? Are they welcoming? Do they get along with each other? Do they work well together? Is there high drama and politics? Who actually runs the church?
T: Presbyterians believe that the church is a holy body established and led by Jesus. Luther and Calvin both stressed the potential of all individuals to directly relate to God. Hence, it is assumed that they are capable of relating to each other, especially as members of the universal church. The “fellowship of believers” is expected.
The church teaches that all humans are equal, created by God in his image, named and known. There are no strangers or “others”. Members have specific instructions to care for strangers, the poor, weak and widowed. Presbyterians are human and imperfect but embrace this responsibility. I was warmly and personally welcomed each time I attended.
The church welcomes new and baptized members with a congregational pledge to support them. Members are expected to serve the church and other members. They are responsible for educating children, encouraging moral behavior, teaching and volunteering on mission projects. They have many opportunities to use their various spiritual gifts.
This “equality” idea also results in ministers having key functional and spiritual roles but lessened political and administrative roles. The congregation is managed by the session of elders. Even functional areas and worship are guided by committees that include elders. This approach requires a large share of the congregation to participate in meaningful committee and service roles.
Members also build relations through their many activities. The church is a busy place. Church service, education, small groups, visitation, social gatherings and service activities abound.
Politics
A: We two have somewhat different political views. Which way does this church lean? Does it embrace different views, doubts or skepticism? I’m predicting the conservative side: historical roots, successful members, community, responsibility, thinking, seriousness, objective values, classic beliefs, simple style, and orderliness. On the liberal side: the individual really matters, tolerance, weak group discipline, feeling, spirit, abstract “3 in 1” God rather than Jesus, equality in governance, not hierarchical, many committees, contemporary music and use of modern technology.
T: Presbyterian churches come in relatively liberal and relatively conservative flavors. Most are considered relatively liberal, despite their “conservative” underlying theology. American churches began to divide in the 1920’s into those who read the Bible literally and rejected several modern science conclusions such as evolution. Today they’re called fundamentalist Christian churches or evangelical Christian churches. They grew slowly until the 1970s but accelerated to have more members than the mainline churches by 1985.
The mainline churches’ seminaries and leaders had adapted to the many changes in the second half of the 19th century, accepting the new science as valid or possible, reading parts of the Bible as stories or allegories, emphasizing the moral dimension of the gospel and addressing social issues such as poverty. Mainline churches kept this “liberal” approach and maintained 30% of Americans as members through 1980. Membership rapidly declined to just 12% by 2010 but has since stabilized.
In American cultural terms with 25% of the population identifying as atheists, agnostics or “nothing in particular”, the mainline churches are now closer to the center. The Presbyterian Church USA has 50% Republican, 42% Democratic and 8% independent voters.
The national Presbyterian Church has adopted the “liberal” position on many social issues: slavery, poverty, race, women’s rights, gay rights, abortion choice and the environment. The church is active in promoting ecumenical ties with other Christian and non-Christian churches. These positions have caused some conservatives to leave and other conservatives to not join a church which otherwise might have met their spiritual needs. Presbyterian churches welcome doubters and skeptics to attend and participate but expects them to develop beliefs consistent with the membership standards before officially joining the church.
Presbyterian churches practice communication skills, civility and tolerance to hold congregations together in a more partisan age. Congregations select and “call” their pastors with some role for regional church offices. Hence, congregations are able to choose pastors whose personal views overlap with theirs.
The Presbyterian Church has found a way to have solid religious beliefs that allow some variation in religious beliefs by members and broad variation in political beliefs. For a family like ours, I think it can work very well.
End of Story: Just Some Notes Below …
Church Decisions: Worship and Programs
More variety, color, interaction, spontaneity, beauty? Better service or just entertainment?
Plan for 25% feeling and spirit in worship. Program options for feeling and spirit?
Popular, familiar music. Introductory comments.
Dynamic visuals, sounds, physical dance, clap, chants, get up out of your seat. Fun.
Fully “high church” small chapel environment, worship services option at times.
Music alternatives in worship. Dance, videos, presentations, sculpture, paintings, nature, photos, comments, maps, puzzles, games, good news, heroes, volunteers, awards, births.
Irresistible children’s programs.
Irresistible new member partners, engagement.
Refocus mission activities on a few critical local needs?
Invest in civility, cooperation, anti-polarization in politics?
Communion more often. Multimedia support.
More sacred sanctuary access, buffer, colors, highlights, spotlights, stations of the cross like exhibits, God, spirit, background music, eternal flame, flowing water, laser lights?
Shared worship services with sister cities.
Ongoing monitoring of attendees and new members to encourage greater participation.
Everyone needs a mentor and counselor matching program.
Church Resources: Theology and Apologetics Materials
Is salvation the first topic, or “God versus meaninglessness”?
Has predestination been sidelined by the church?
Is there some part of “liberal” theology that must be rejected today?
Adult education in Christian apologetics for all members.
We believe in an objective moral and physical universe.
Rationality and scientific proof cannot drive morality. It is fundamentally experiential.
Who is driving Christian apologetics arguments and materials for mainline Christianity?
Why we cannot support the literal view of the Bible!?
Truth in science is not the same as truth in religion.
Certainty is impossible throughout science. We don’t expect it in religion.
How we combine conservative theology and liberal application and tolerance.
The royal “individual” after Luther. How we implement this.
The royal “individual” and the necessity of community.
19th century Christian critics – evaluated today. Marx, Freud, Nietzsche, Darwin.
Nietzche was right about Judeo-Christianity as a radical religious turn.
Christianity and Greek philosophy. Surprising ways they can be connected.
The fallacy of linear progress, modernism.
The impossibility of supernatural forces? History of scientific discovery.
Bankruptcy of atheism. Dawkins only attacks a straw man.
History and scientific undermining of materialism.
Philosophical inconsistency of subjectivism. So many proofs.
Philosophical nonsense of radical skepticism.
Christianity believes there are no strangers or “others”. Diversity 1.0.
Church Resources: Marketing and Communications
Strategy to target “nothing in particular” individuals.
Strategy to target blended left-right families.
Strategy to make the church more attractive to minority individuals.
Strategy for the professional, college educated market.
Strategy for the working and middle classes. Are they the same?
Review the top 25 technical religious terms and replace them with common sense phrases.
Can “Presbyterian” be eliminated or replaced by “Reformed”, “Christian”, “Modern”, “Progressive”, “Universal”, “Blended”, “Both/And”, “Relevant”, “Community”, “Servant”, “Missionary”, “Respect”, “Scottish”, “Genevan”, “Reforming”, “Loving”, “Serving”, “Engaged”, “Locally Owned”?
Can/should mainline Christianity be linked to mixed government capitalism and classic liberal democracy? All 3 take a middle position. The new conservatism of demonstrated effective options?
Framing communications to be better understood in “A Secular Age”.
Communicate the “both/and” of a serious, well-defined theology and a tolerant, diverse, loose, dynamic application of the principles.
Honest communications to emphasize services, fellowship and community without religion.
Marketing style guide that emphasizes warmth and caring in all communications.
Marketing strategy to emphasize and illustrate individual attention and identity affirmation.
Recontextualizing “original sin” as part of the mixed human nature.
Consistent image and language to emphasize “an awesome God”.
Consistent image and language to describe love in relationship to God, congregation, neighbors and mission recipients.
Consistent image and language to emphasize 2,000 years of Christianity and 500 years of the Reformed/Reforming Church.
Consistent image and language to describe the intimate connections of believers and God, Christ and the holy spirit.
Strategic marketing campaign to highlight the role of each local congregation in building community and serving.
Marketing program to share 30 of Jesus’ messages to his local community and how they resonate today.
The “historical Jesus” has been confirmed.
Consistent image and message to emphasize Jesus as a countercultural rebel in his time.
Consistent image and message to explain the meaning of the crucifixion and the cross.
Consistent image and message to highlight the earthly benefits of church participation.
Consistent image and message to promote the trinitarian God. How it meets everyone where they live.
Consistent image and message to describe how the church addresses thinking, feeling and doing dimensions of religion.
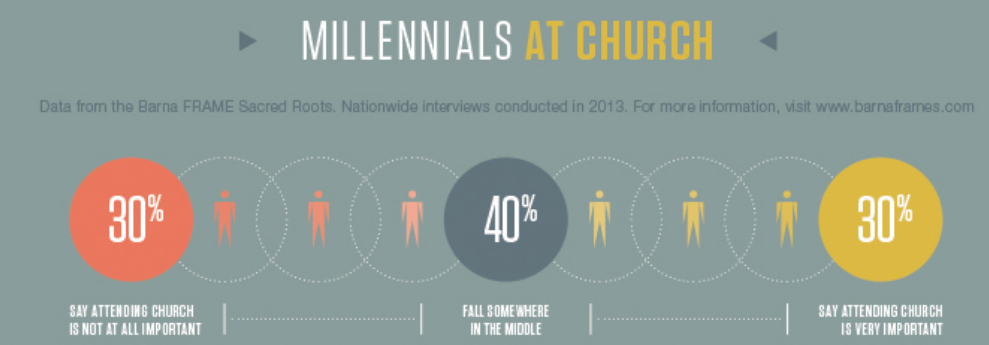
Overall, not that different from other generations. Optimistically, the glass is “half full”.
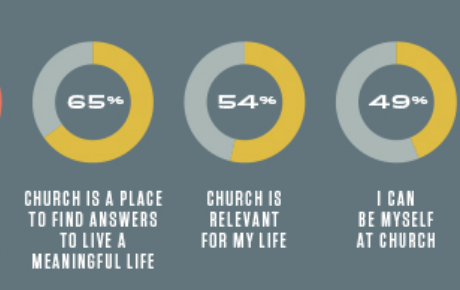
The motivated group looks like other church attenders. I connect with God at church. I feel a responsibility to participate at church. The church is an important part of our world.
The “not so interested” group doesn’t find God or relevance in churches. Perhaps, this points to an opportunity. Churches don’t reach out and grab this disengaged group. Again, it could be an opportunity for some.
Substantial majorities of Millennials who don’t go to church say they see Christians as judgmental (87%), hypocritical (85%), anti-homosexual (91%) and insensitive to others (70%). This is a strong rejection of the “Christians” they picture when answering a survey. Congregations or denominations which are seen as more “open” to others and differences might interest this group.
Even for all Millennials, churches are seen as out of step with modern authentic, tolerant and inclusive values.
Despite perceived church shortcomings, most Millennials do see positive dimensions in churches.
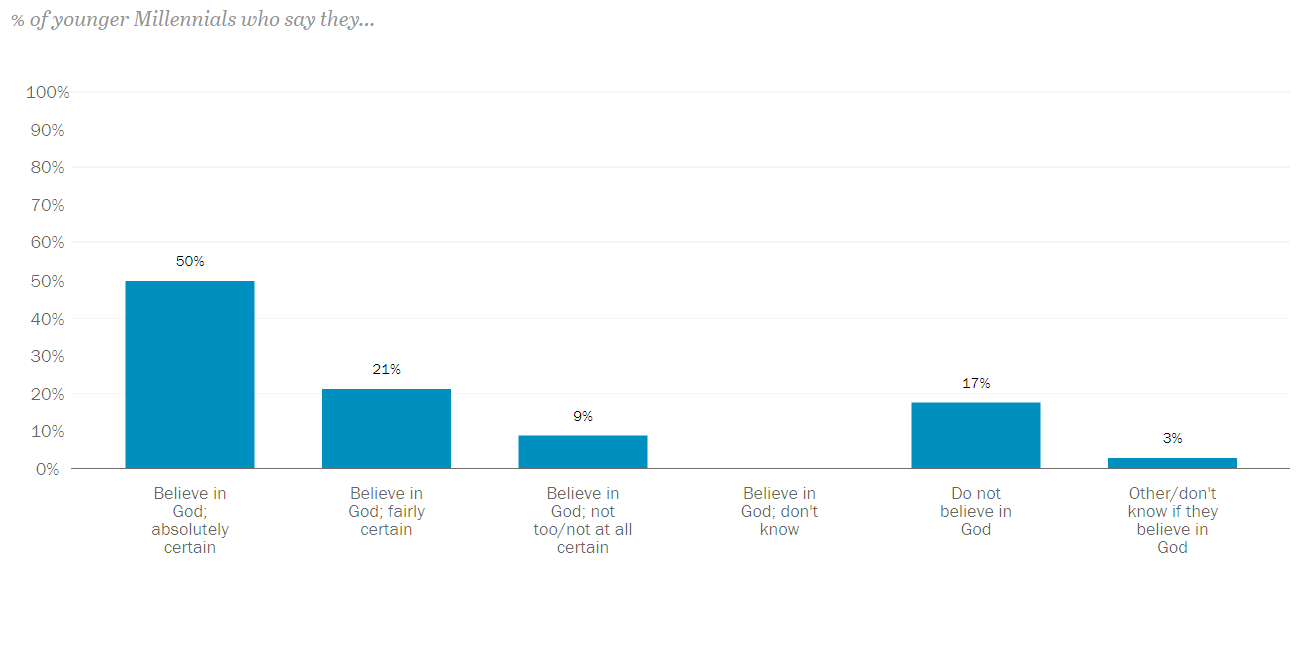
Pew Research: Younger Millennials
80% “yes” is a start.
Half experience spiritual well-being often. Half do not.
We live in “A Secular Age”. Millennials mostly don’t begin with religion.
A few take a fundamentalist view. One-third take a blended view of God’s special word. One-half are skeptical about any direct contact from God.
Millennials want the church to offer what only the church can offer: to know and to love God. To learn about God, Christ and the holy spirit. To study the scriptures and the creeds. To love and be intimate with God, Christ and the holy spirit in order to transform their lives. To connect with the infinite universe, eternity and ultimate meaning.
They want practical sermons, programs and activities that apply this knowledge and relationship to guide their lives: moral decisions, self-improvement, relationships, consumer choices, financial choices, career/vocation, service.
Church Is a Place of Worship
It clearly looks, feels, sounds, surrounds and even smells sacred and appropriate for engaging with God. Initial impressions matter. Buffering matters. Appropriate technology is employed. The worship service, music and sermon link the congregation with God. Everyone can sense the sacred and holy presence.
Community is Real
Individuals know and trust each other. They worship, pray, learn, play and serve together. They care about the congregation as a whole and as individuals. They listen, share, interact, counsel, and advise one another. They respond to needs generously. They practice collective responsibility.
“Meaning” Matters
Ideas and activities must be relevant and most important. No time for distractions.
They must be material, worthwhile, substantial and impactful. My time is valuable.
They must be supported by logic and evidence. They must be compelling.
Millennials have lived in a world of progressive improvements, expanded consumer choices, increased affluence, scientific and technical change, computer and communications revolution, political polarization, created identities, infinite possibilities, reduced social safety nets and increased competition in a meritocratic world of widened results. Charles Taylor describes this as the “primacy of instrumental reason”. The demands of society force individuals to become highly skilled in the rational evaluation of means and ends, costs and benefits, risks and returns. They expect their religion to clearly deliver well-defined results, or it will be rejected. This is consistent with Paul Tillich’s view of religion as “matters of ultimate concern”.
In a world of non-stop commercial marketing, branding, hidden persuaders, cookies, fake news, newspeak, click-bait, communities of interest, confirmation bias, distrust, media power, communications and advertising techniques, framing, strawmen, Overton windows, artificial intelligence, multitasking, narrow casting, micro markets, customized products and messages, enhancements, earworms, and virtual reality, Millennials fully appreciate the difference between reality and constructed reality.
For something as important as the meaning of life, ultimate reality, eternal salvation, mystical union, moral guidance, vocation, and true community they must have the “real thing”. They have very sensitive BS detectors. They demand authenticity in theology, creed, sermons, teaching, worship, programs, service and community. The pastors and congregation must “walk the talk”. They have no time for market-driven messages. They want “the real thing”, even if it is not perfectly comprehensible. They can manage some uncertainty, but no hypocrisy.
They have worked in organizations that have aligned mission, vision and values with strategy, tactics and reporting. They know that this can be done (well-enough). They want deep structures that persist, not shallow messages that quickly evaporate.
They value unity, integration and the whole. A complex system must work with its parts. They have seen this in action in many realms and expect no less from religion.
They value transparency, honesty and openness. In a competitive, commercial, secular culture, they wrestle with hucksters every hour. They need something they can fully trust in their religion.
Charles Taylor outlines the historical development of “authenticity” as a primary moral value in the book noted above.
The “Individual” Matters
Millennials value tolerance, respect, equal rights, and personal identity. They expect to be treated as fully equal humans in all dimensions. They have seen, experienced and achieved much. They have been given the opportunity to contribute meaningfully to organizations at young ages. They cannot tolerate irrational delays, politics, insider cliques and power, undue hierarchies, risk aversion, prejudices, waffling, consensus building, history worship, or tribal knowledge.
Charles Taylor devotes one-half of his book to the lopsided development of individualism versus the community or religious dimensions of life. This is the culture we inhabit and to engage Millennials, we must meet them where they live.
Summary
Religious belief, belonging and behavior have declined in the US for 50 years, especially reducing the attractiveness of the mainline Protestant denominations. The decline is mostly a generational decline, with newer generations much less attracted to religion. For mainline Protestant denominations to survive the 50% to 75% decline in membership, they must find ways to attract, engage and retain younger generations. The US remains an outlier for its high degree of religious engagement among economically advanced nations. The decline of mainline religions seems to have bottomed out, while the 1990’s growth of evangelical denominations appears to have been a temporary event. Younger adults still seek meaning in life, including connection to the universe, eternity and God. Their world is much different from the world in 1960, 1980 or 2000. Religious organizations must meet them where they live. Mainline Protestant churches are well positioned to maintain their core beliefs and connect with these demanding “seekers”.
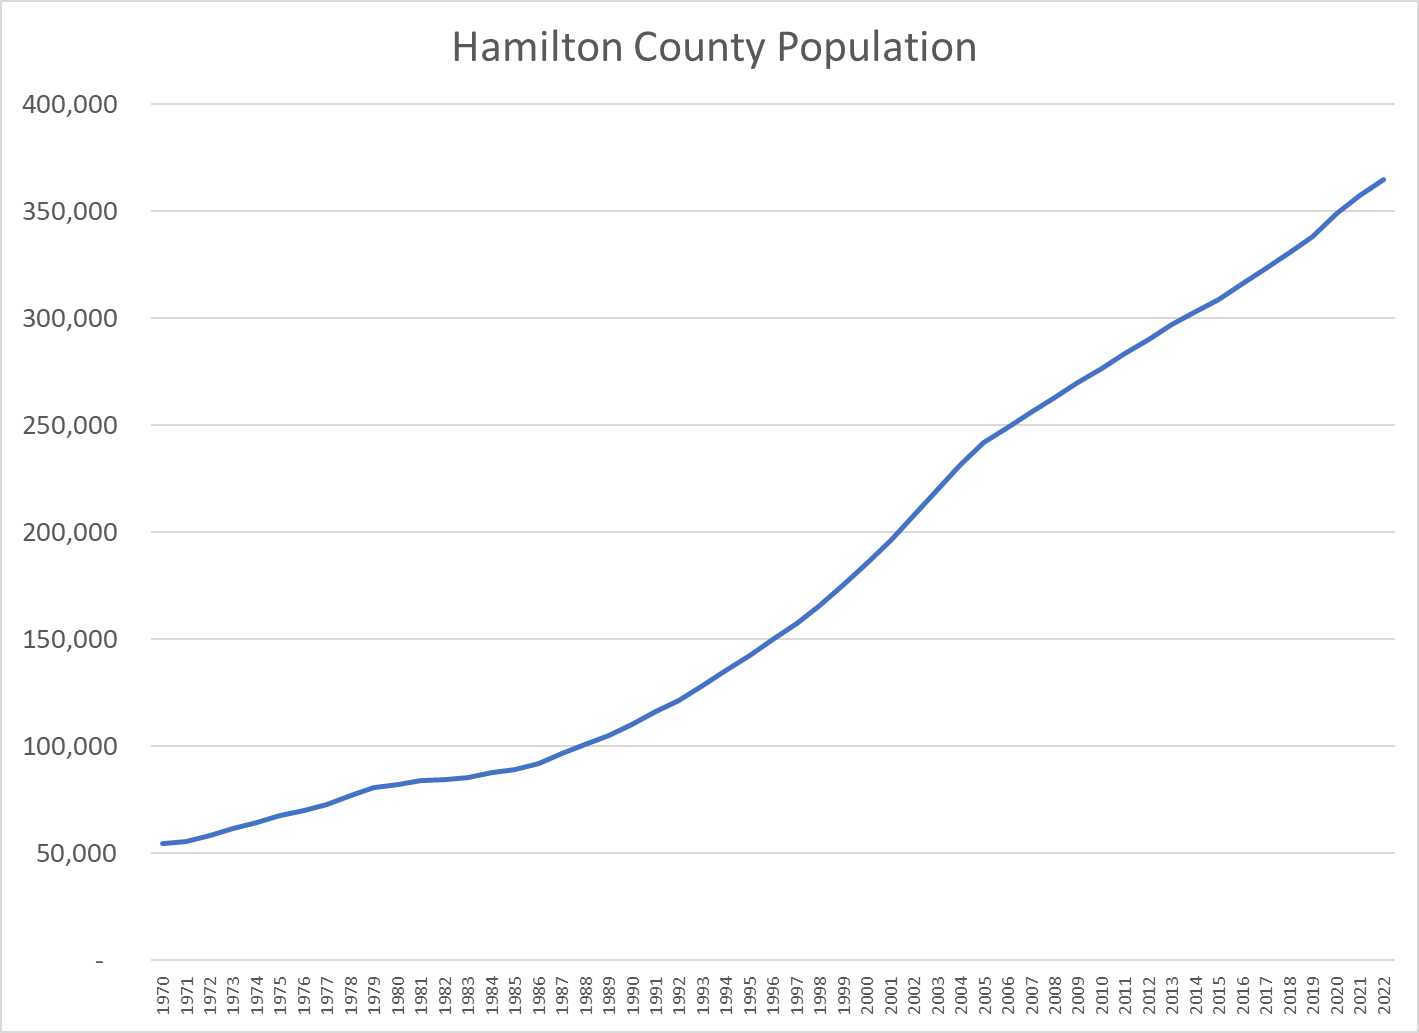
In 1970, Hamilton County was home to just 55,000 people. It has grown 6-fold since then to more than 330,000. One percent of the nation’s 3,143 counties have experienced similar growth in this 50-year period. These 32 counties combined have grown more than 5-fold from 2.2M (1.1% of US) in 1970 to 11.8M (3.6% of US) in 2020.
8 of the counties are Sunbelt retirement areas. 4 are smaller urban areas. 20 are suburban/exurban counties within larger metropolitan areas.
Each county remains fast growing, issuing an average of 5,000 building permits in 2022 versus an average of 500 per county nationally. Hamilton County’s 5,800 permits is above average.
As a group the counties average 16% of residents aged 65+, ranging from 11% to 25-29% in retirement counties. Hamilton County’s 14% makes it a little younger than the national average of 17%.
The percentage of adults working averages 66% versus 64% for the US as a whole, ranging from 48-54% in retirement communities up to 74%. Hamilton County’s 71% ties for second place.
Median household income at $85,000 for this group is 13% higher than the national average. Hamilton County’s $115,000 is sixth highest. 5 of the retirement counties average less than $70,000. Loudon County records a stunning $170,000.
Poverty rates are the mirror image, at 9% for the group versus 12% nationally. Rates range from 3-16%. Four retirement areas have poverty rates above the national average. Hamilton County’s 4% is tied for second lowest.
The group records 38% of adults with college degrees versus 34% for the nation. 7 retirement counties and Henry County south of Atlanta report 28% or less. Hamilton County’s 61% is second to Loudon County’s 64%.
Average home values are $345,000 for this subset, a solid 22% higher than the $282,000 national average. 10 counties reported prices below the national average, 5 in retirement areas, 4 in suburban counties and Bentonville, AR. 4 suburban counties listed their median home prices above $600K: DC, Sacramento, Nashville and Denver. Hamilton County’s $351,000 was average for the high growth group.
The group averaged 68% non-Hispanic White versus 59% for the nation as a whole. 4 counties had more minorities than non-Hispanic Whites: Ocala, FL, Henry/Atlanta, Prince William/DC and Brazoria/Houston. St. Charles County in the St. Louis Metro area had the highest non-Hispanic White share at 85%. Hamilton County’s 81% was 6th highest.
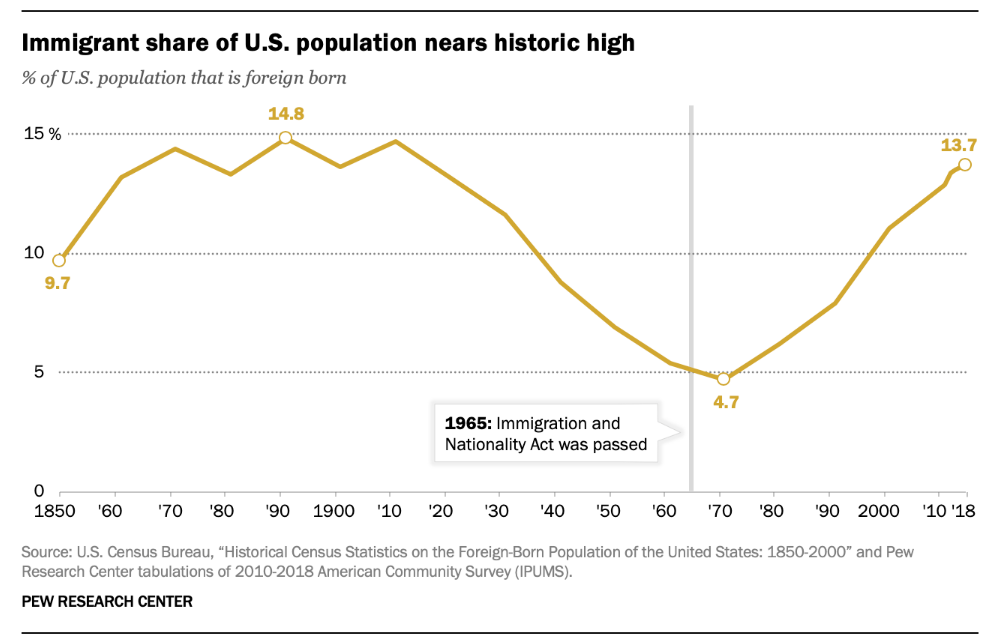
These 32 counties averaged 10% foreign born, much below the 14% national average. St. Charles County recorded only 3% foreign born. 5 counties reported 20% or higher foreign born: Forsyth/Atlanta, Ocala and Naples, FL, and Loudon and Prince William/DC. Hamilton County’s 9% is a little below the group average.
Summary
Hamilton County is one of 32 counties that have recorded tremendous growth across 50 years. It is relatively young and less diverse than most. It has higher incomes and average housing costs compared with its peers.
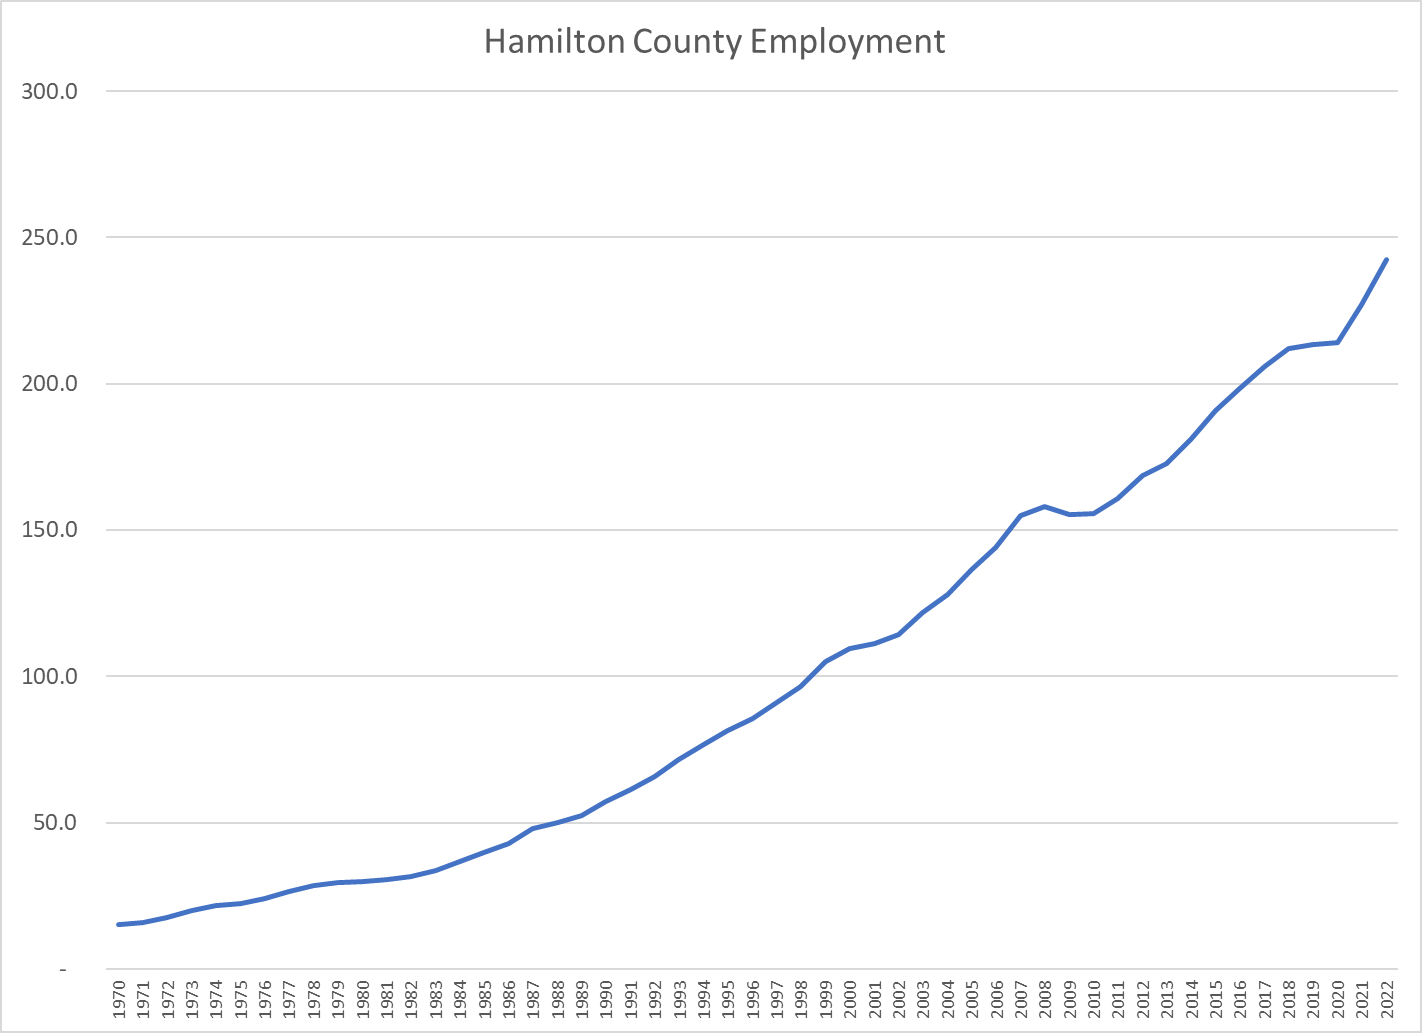
Hamilton County’s employment has grown 16-fold since 1970 from 15,000 to 243,000. This is a 52-year compounded 5.5% growth rate. You aren’t likely to find that growth rate in your stock or mutual fund portfolio!
This growth started from a low base of 1,500 new jobs per year and accelerated to 5,000 new jobs per year by 2000. Hamilton County has maintained this growth rate for 2 decades with some extra results recently!
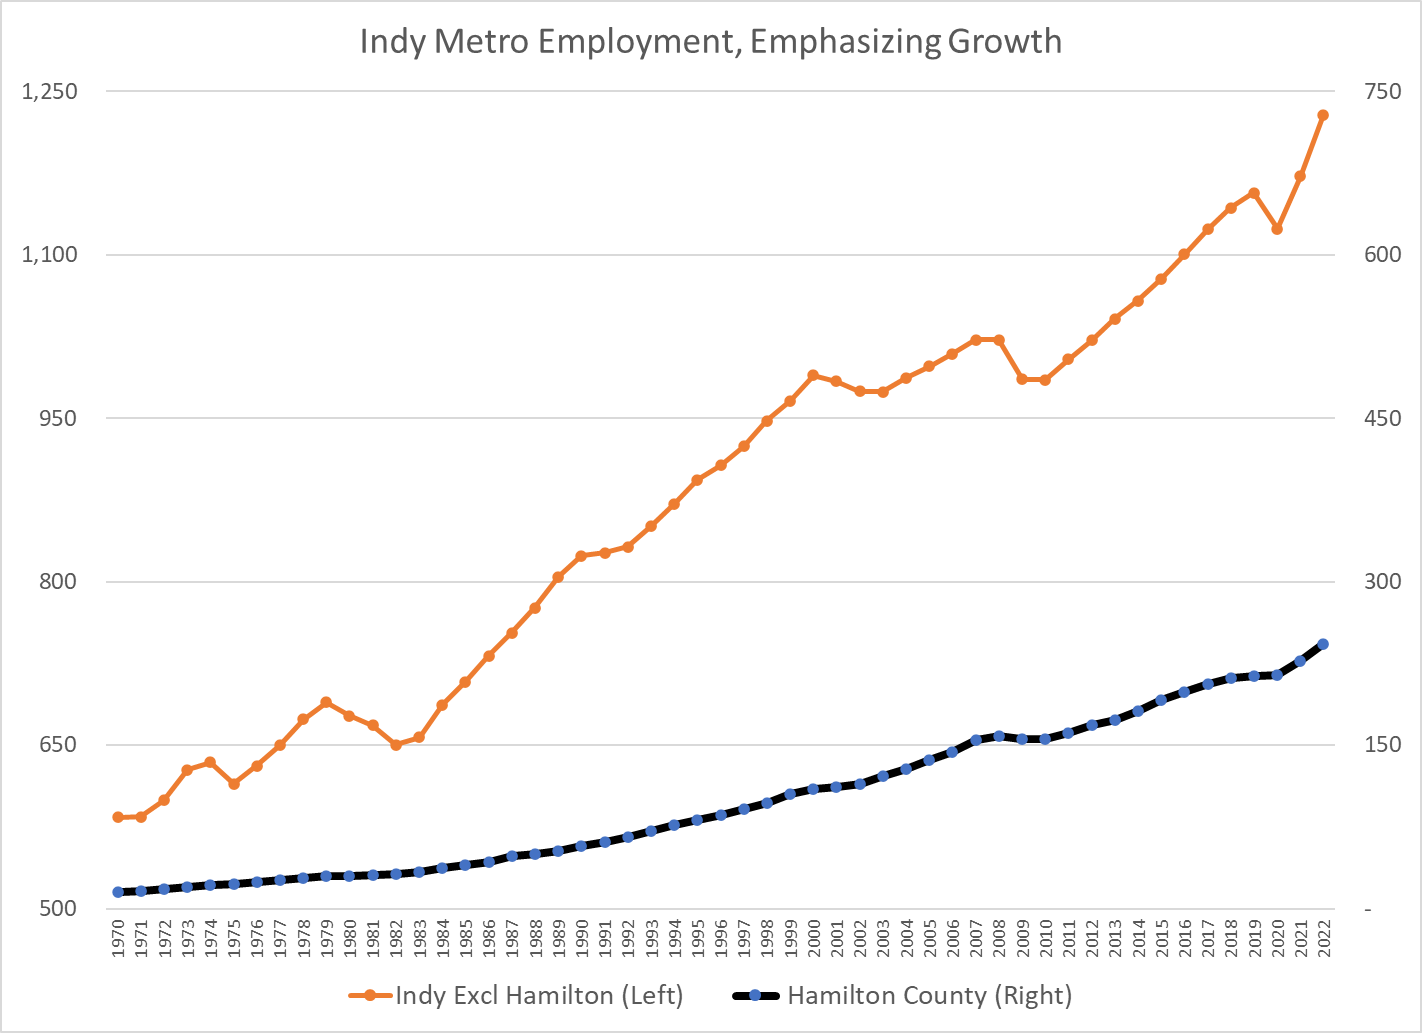
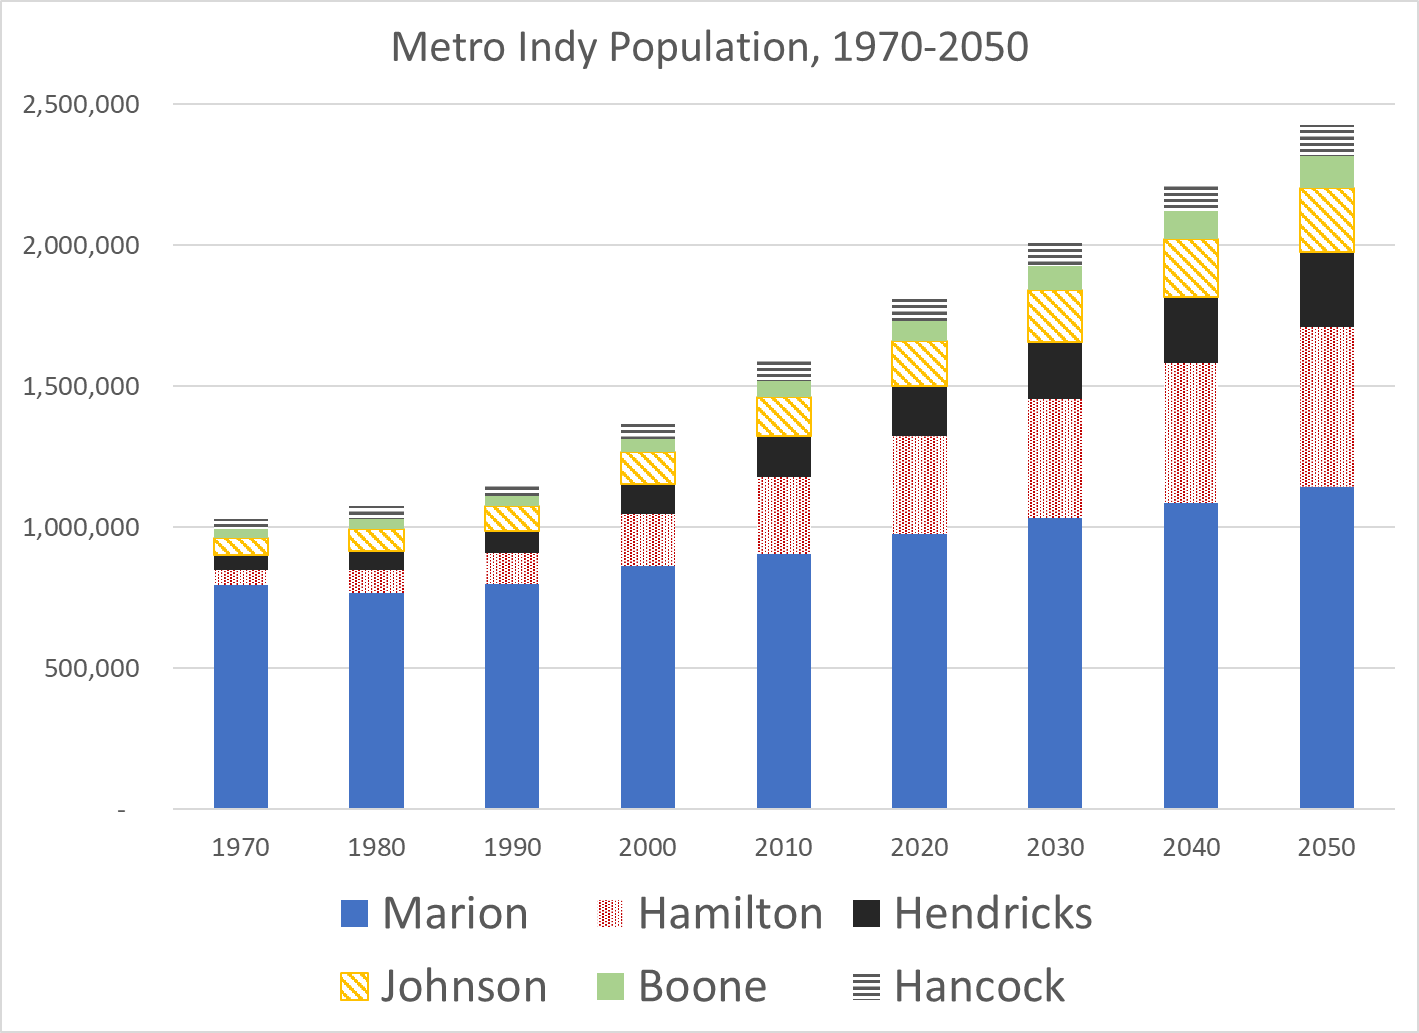
Hamilton County’s population doubled from 1970 to 1990. Metro Indy, excluding Hamilton County, grew by the same 50,000 people. In the next 30 years, Hamilton County added more than 250,000 people and the rest of metro Indy added a very solid 475,000 people (almost 2X). Hamilton County benefits from the Midwest leading growth of metro Indy.
Hamilton County employment growth has been a little faster than population growth.
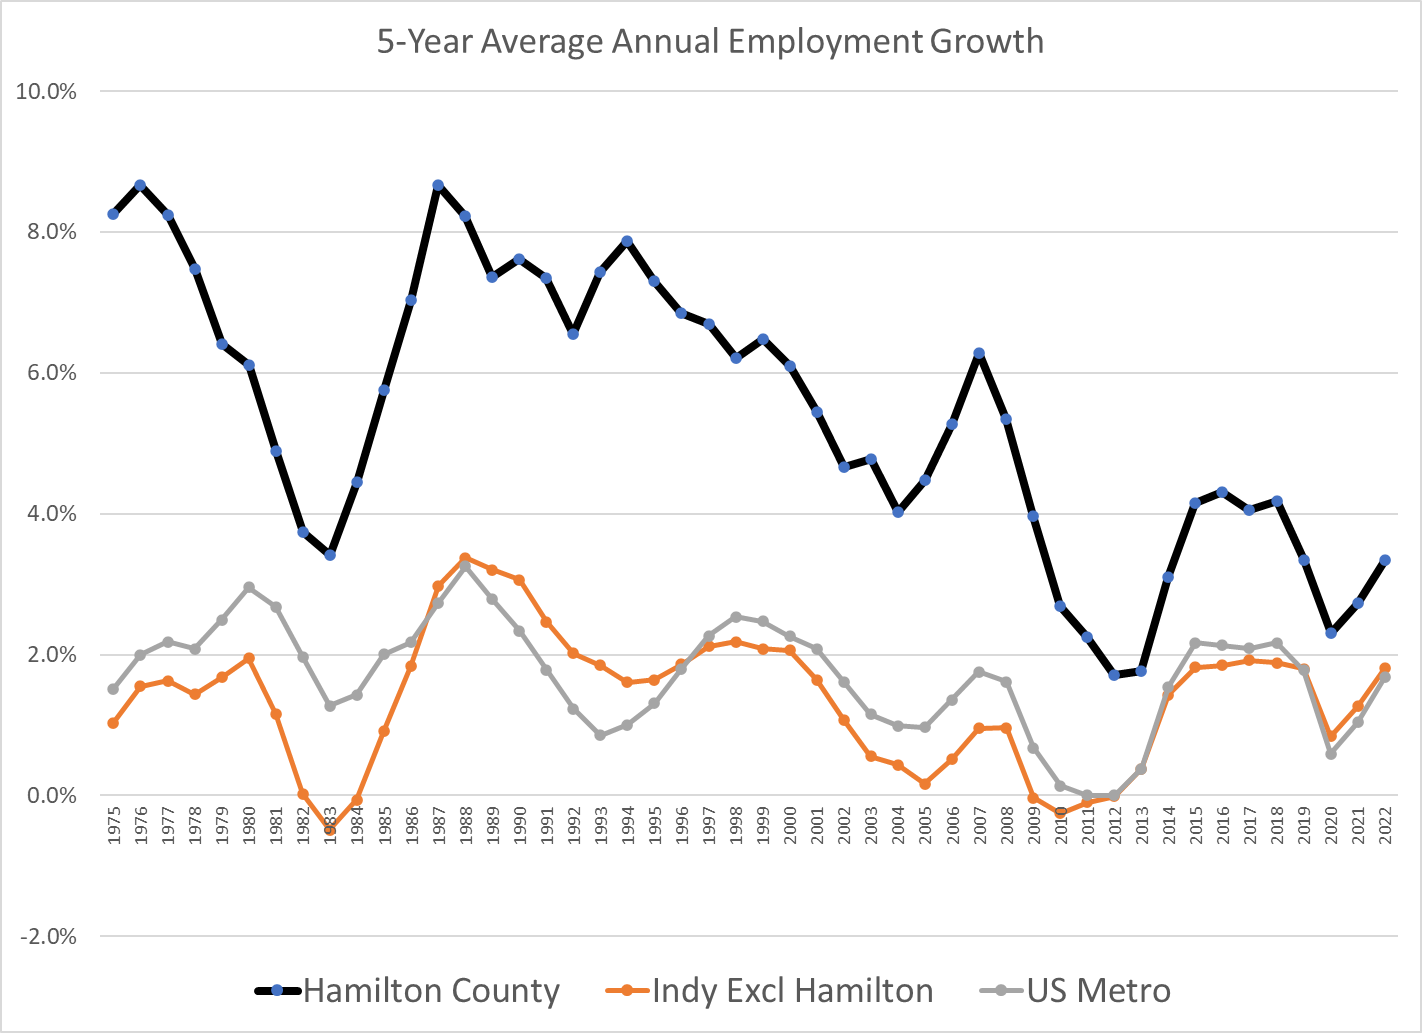
Metro US population has grown by 1% annually and employment has grown by 1.6% annually. The Indy metro area has grown at similar rates. Hamilton County has grown 3-4 times faster.
As Hamilton County has grown, its annual growth rate has declined from 7% to 4%, still far above the 1.5-2% baseline growth rate.
Hamilton County has grown from 1/3,000 US people and 1/5,000 US employees to 1/800 citizens and workers. (4-6X growth).
Metro Indianapolis has been a solid job creator. Hamilton County has grown alongside the metro area.
Hamilton County was a “bedroom suburb” in its early days but reached the national level of jobs to population by 1992 and tracked the national average thereafter.
Hamilton County has the fourth largest population of the 92 Indiana counties at 365,000, trailing only Allen (391K), Lake (500K) and Marion (961K) counties.
It has the second highest Net Assessed Property Valuation (NAV) at $33.8 billion, trailing only Marion ($58.1B), but ahead of Lake ($30.6B) and Allen ($24.0B) counties. This reflects higher than average residential property values and significant commercial property investments (30% of the total).
The average net assessed valuation per capita in Indiana is $63,000. At $92,600, Hamilton County has the highest NAV/person among the 21 counties with at least 100,000 residents or a density of at least 200 people per square mile. It is 50% higher than the state average. Marion, Lake and Allen counties each have NAV/person slightly below the state average. These 21 counties represent 68% of the population and 67% of the NAV, with an average NAV/capita of $61,900, slightly below the state average.
18 of the 20 counties with the highest NAV/person in Indiana have population densities below the state average of 191 people per square mile. Benton County has a population of just 8,000, rich agricultural lands and several windmill farms giving it the state lead at $148,600 of NAV per person.
The percentage of persons aged 15 or older who are married is 48% in the US. Indiana is slightly higher at 49%. Utah (56%) and Idaho (55%) lead the nation with Wyoming, Nebraska and Iowa close behind at 53%. Five states are lowest rated at 44-45%: New Mexico, Mississippi, Rhode Island, New York and New Jersey.
62% of Hamilton County residents are married! That is first place among the 50 most populous Indiana counties (of 92). It is in first place in metro Indy, where Marion County has a 39% marriage rate.
Of the top 50 most populous counties in the US, none come close to Hamilton County’s marriage rate. Fairfax County (56%) and Santa Clara County (53%) have the highest rates. Lowest rated counties are Milwaukee (38%), New York (33%), Bronx (31%) and Philadelphia (30%).
The US population has grown from 2.5 million in 1776 to 76.3 million in 1900 to 158.8 million in 1950 to 329.5 million in 2020. More than a 100-fold increase, 2+ orders of magnitude.
28 individual metro areas today EACH have a population (2020) equal to or greater than the WHOLE USA in 1776. Pittsburgh, Portland, San Antonio, Austin and Sacramento each have the same 2.5 million residents. Charlotte, Orlando, Baltimore and St. Louis each have a slightly greater 2.8 million citizens. 19 other metro areas today have a significantly larger population.
Declining Rural Population
The US began as 100% rural. By 1900, cities (2,500+) accounted for 40% of the total population. By 1950, city populations were the majority at 60%. In 2020, cities contained 80% of the US population.
Urbanization
In 1776, the US had 5 cities of 10,000 people, led by Philadelphia with 30,000.
By 1900 the nation had 11 major cities with a half-million people or more, led by New York with 5 million and Chicago, Philadelphia and Boston near 2 million. Baltimore on the east coast and San Francisco on the west coast were joined by the Midwest cities of Pittsburgh, St. Louis, Cleveland, Cincinnati and Buffalo to round out this group of early leaders. These 11 exceptions to the still largely rural landscape accounted for one-half of the urban population, 20% of the national population.
By 1950 there were 15 metro areas with a million people or more, up from just 5 in 1900. San Francisco, St. Louis, Cleveland, Baltimore and Buffalo exceeded 1 million as did newcomers to the major city list: Los Angeles (4.4M), Detroit (3.0M), DC, Seattle and Dallas-Ft. Worth. Kansas City, Minneapolis-St. Paul and Houston joined Cincinnati as “major cities” defined as greater than 750K residents. These 19 metro areas contained 50 million people, 31% of the nation’s total and a little more than half of all urban residents. Led by New York’s 13M, the east coast metros totaled 22 million people. Led by Chicago’s 5M, the Midwest metros were close behind with 18 million people. The 3 west coast cities combined for 8 million while the Sunbelt’s 3 cities amounted to just 2.5 million people.
For 2020, we use 2 million as the minimum size for a major metropolitan area. New York (20M), Los Angeles (12M) and Chicago (9M) led the way. Dallas-Fort Worth, Houston, Washington, DC, Philadelphia, Atlanta and Miami all had at least 5 million citizens. 15 new metro areas joined the list, beginning with 6 on the west coast: Phoenix, Riverside-San Bernardino, San Diego, Portland, Sacramento and Las Vegas. The others are widely distributed across the country: Tampa, Orlando, San Antonio, Austin, Columbus, Indianapolis, Charlotte, Nashville and Denver. These 35 metro areas account for nearly one-half of the country’s total population of 330 million. The 4 major regions were relatively evenly balanced: east coast (40M), Midwest (37M), west coast (45M) and sunbelt (43M).
One-half of Americans now live in one of the 35 major metropolitan areas, amounting to 162 million people. That compares with 50 million people in 19 areas in 1950 and 15 million people in 11 areas in 1900. The character of American life has shifted from rural to urban to metropolitan.
The White, non-Hispanic population has typically been 80-89% of the total. It has fallen rapidly to 58% as Hispanic, Asian and multi-race claimers have increased their shares of the population.
The share of immigrants reached a high of 15% from 1870-1910, dropped to 5% in 1960-1970 before reclimbing back to 15% recently.
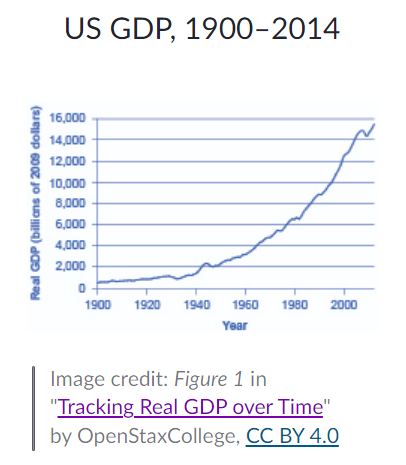
Amazing Real Economic Growth
The growth in the size of the US Gross Domestic Product (GDP), the value of goods and services produced in the country, from 1776 to today is essentially incomprehensible at 19,000 times its original size. The population has grown 132-fold, from 2.5M to 330M. Real, inflation-adjusted GDP per person has averaged 2.0% per year across long periods of time. Due to compounding, this 2% becomes 2.7 times in 50 years, 7.25 times in 100 years, 52.5 times in 200 years and 141 times in 250 years.
In 1955 the 11 corporations at the middle of the newly created Fortune 500 listing averaged $123 million of annual revenue. Adjusting for inflation (GDP deflator), they would have revenues of $939 million today. Comparable revenues in the latest Fortune 500 listing are $15.6 billion, a 16.6X increase.
Over this same period total national real GDP has increased from $3.1 trillion to $21.8 trillion; 7.1 times as large. Large US-based corporations have grown twice as fast as real US GDP.
Summary
Small annual percentage changes add up to become transformations through time.
We see this in population, race, immigration, occupations, industries, urbanization, productivity, output and concentration of businesses.
The population and production scale, complexity, trade, product innovation and diversity of the US is beyond any expectations of the founders of the country. The country and its social, political and economic institutions have survived and adapted to allow the country to thrive for almost 250 years. Further adaptations may be needed to support such continued growth and success.
Hamilton County’s population has grown by at least 7,000 per year for 30 years. Growth peaked at 10,000 per year from 1999-2005, decreased to 7,000 in the aftermath of the Great Recession and has since increased to 8,000 per year.
The county has enjoyed a natural increase of about 2,000 per year, with 4,000 births per year and 2,000 deaths per year. Annual net in-migration has averaged 6,000 in the last decade. Hamilton County loses roughly 3,000 residents to other states and 2,000 students to attend major universities. It gains about 4,000 international immigrants, 1,000 from Illinois, 1,000 from other Indiana counties and 5,000 from nearby Marion County.
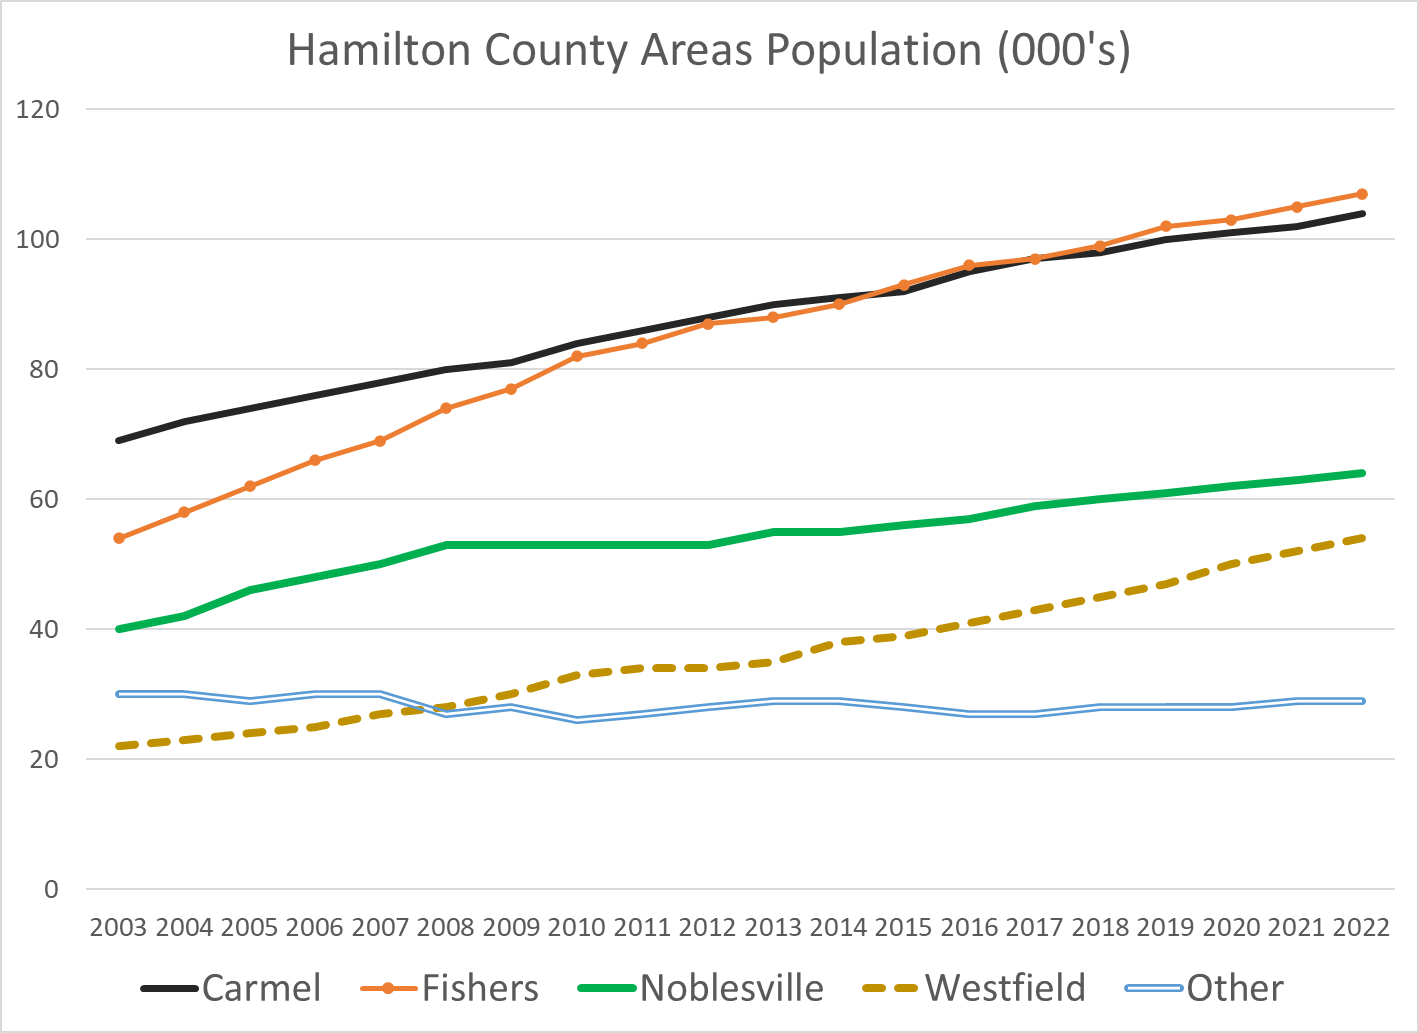
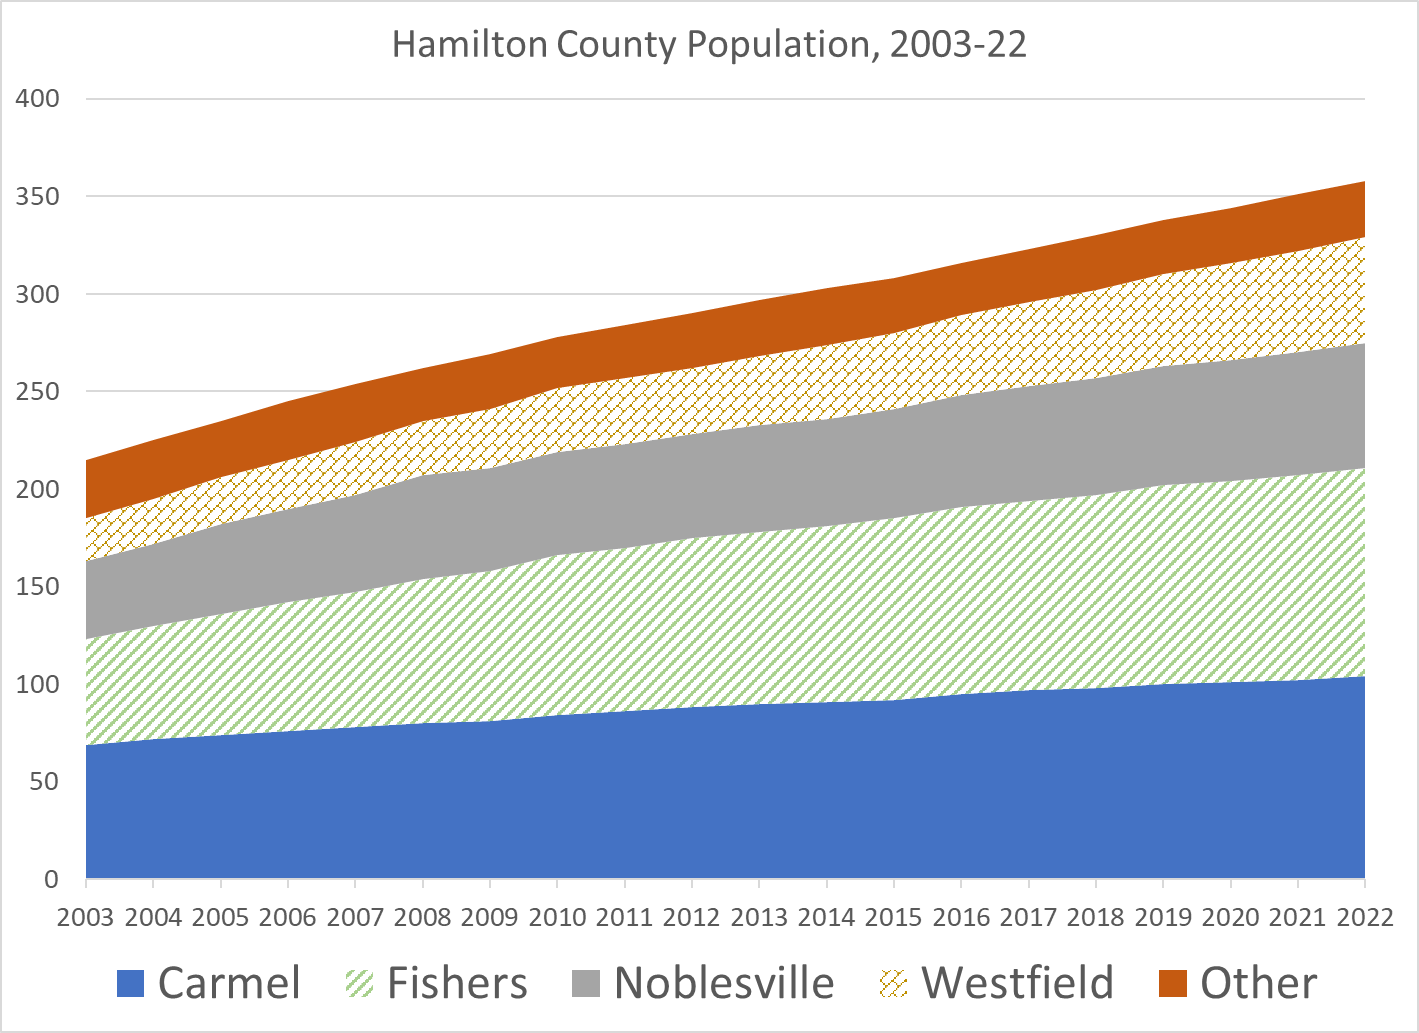
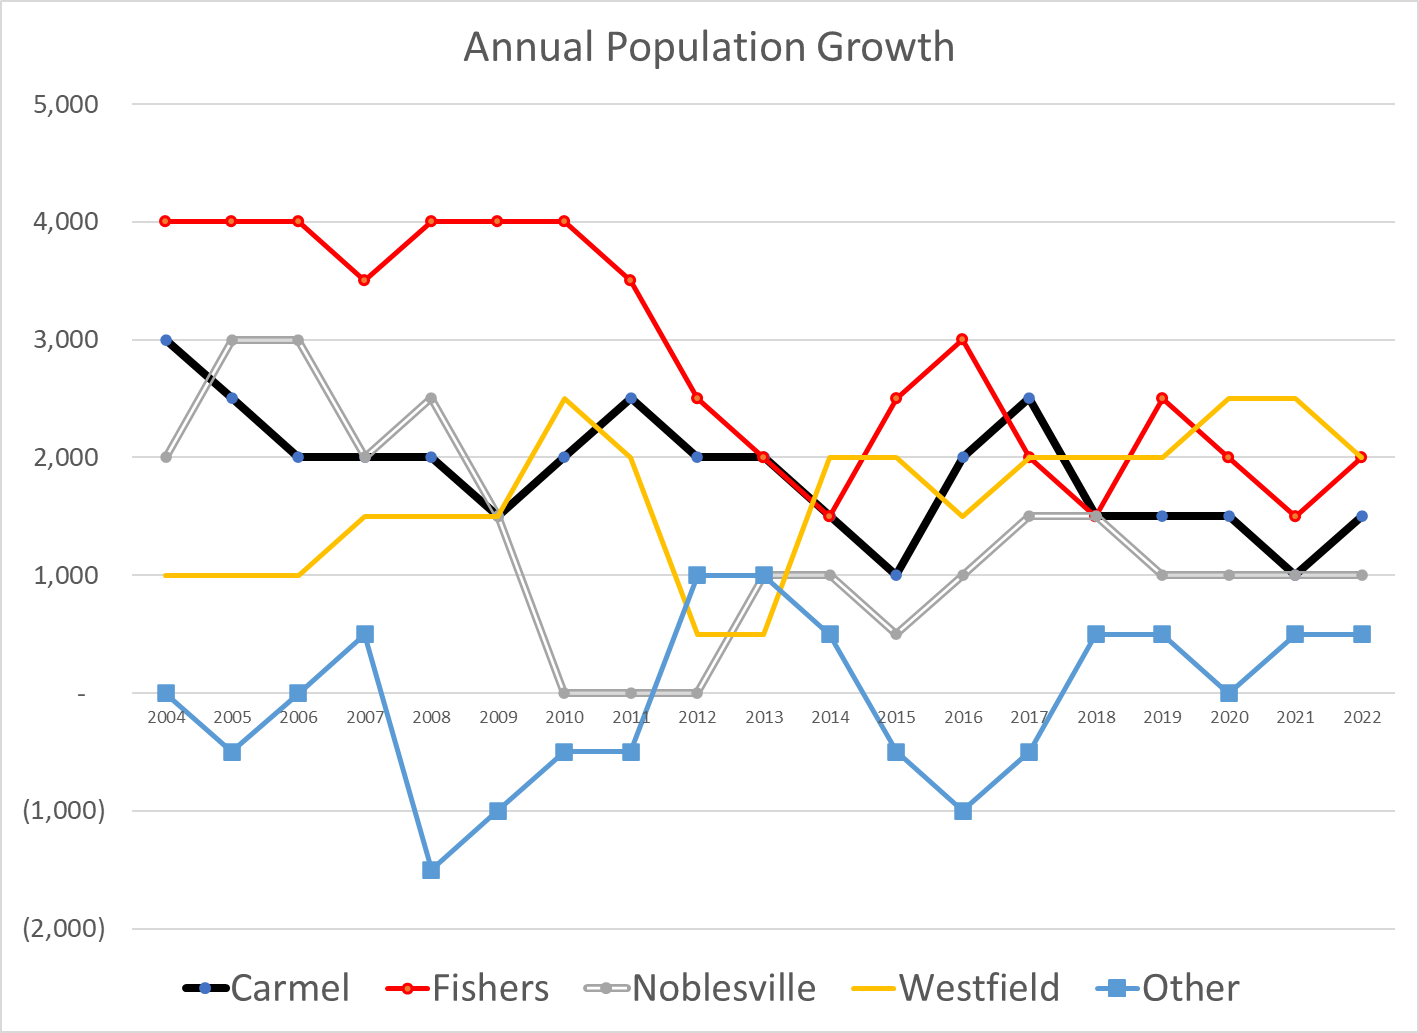
Four major cities contribute to Hamilton County’s rapid growth. Carmel was the early leader. Fishers grew even more rapidly in the 2000’s. Noblesville has continued its steady growth of 1,000 new citizens annually. Westfield has joined Carmel and Fishers in adding 2,000 residents per year, showing a higher percentage growth rate on its lower base.
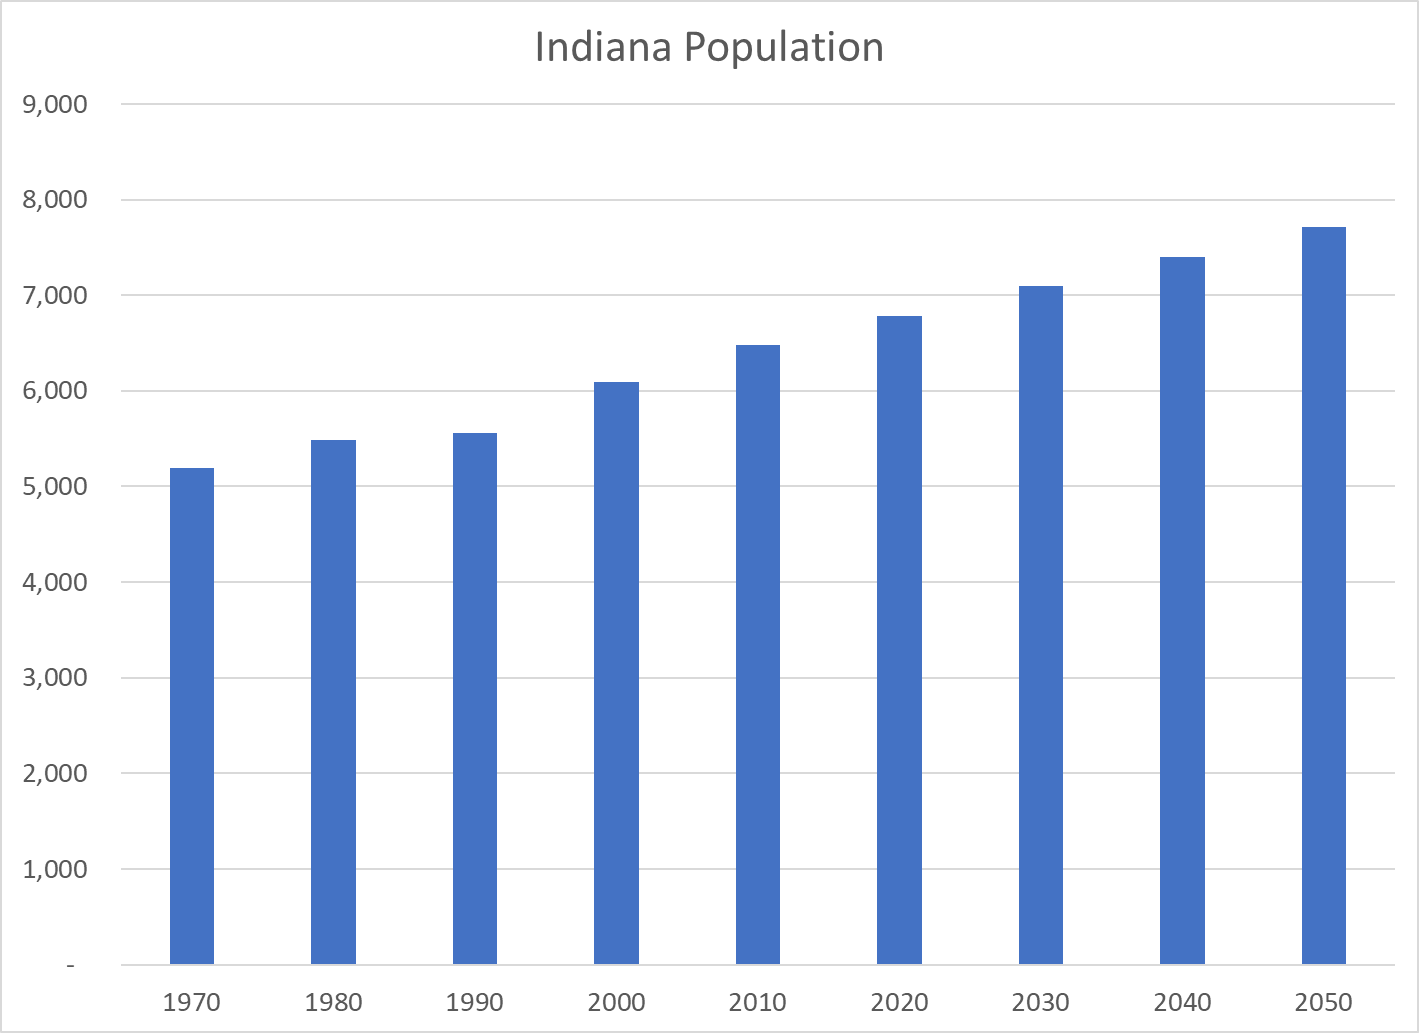
The 2020 census results were significantly higher than the 2018 state of Indiana forecast update. The 2018 forecast shows Hamilton County in 2050 at 528,000 people rather than 567,000 with growth of 180,000 rather than 219,000. It has Indiana at 7.3 million instead of 7.7 million people in 2050.
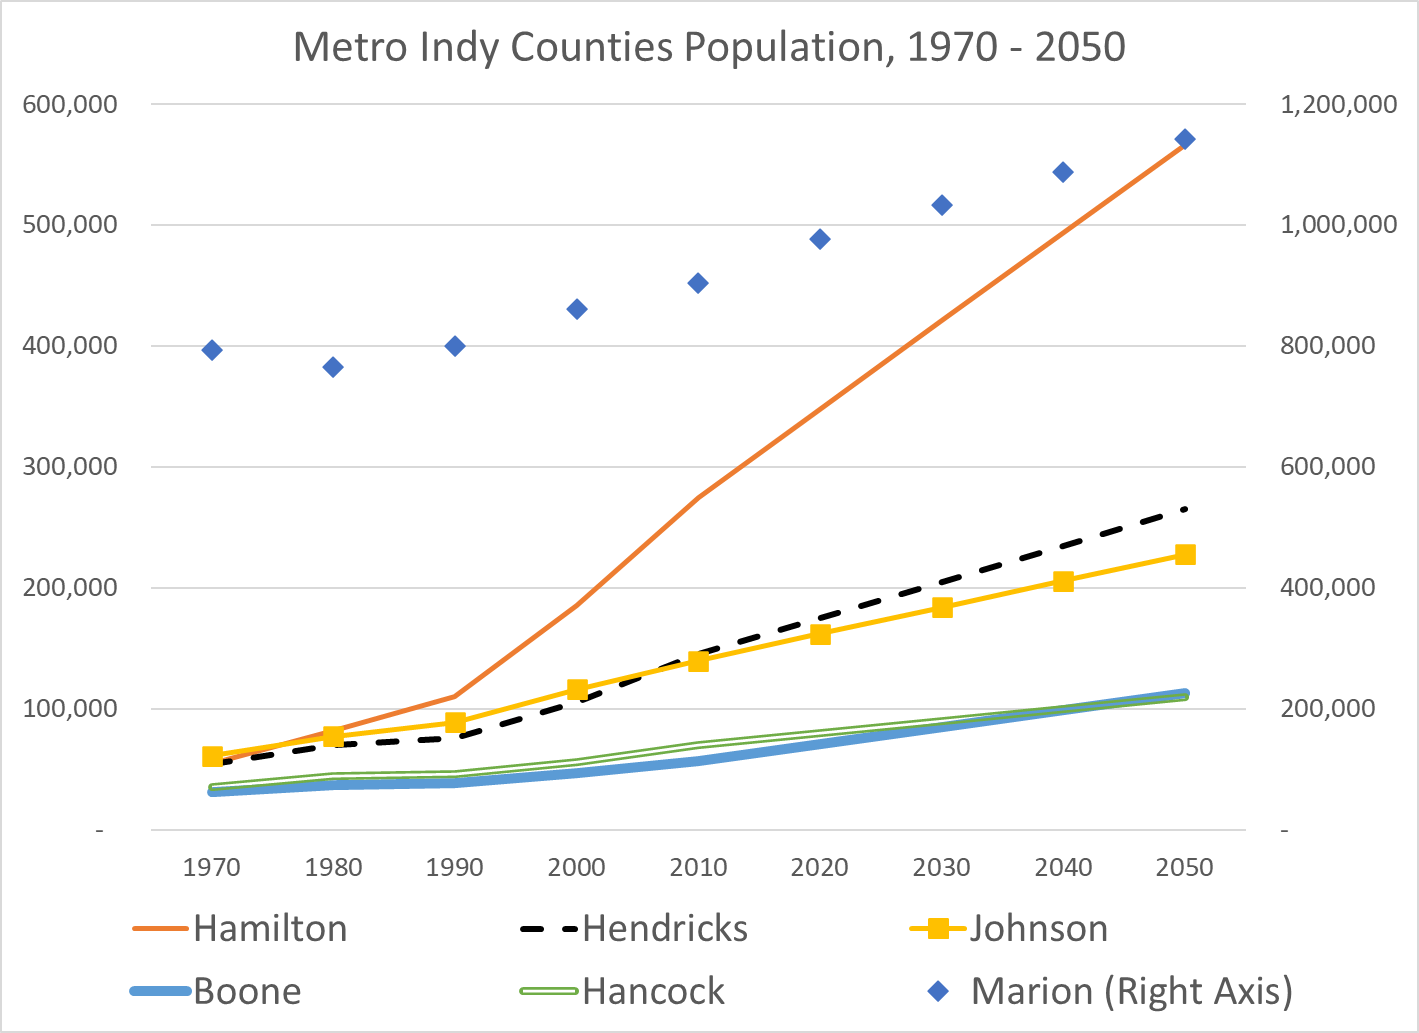
The metropolitan Indianapolis area is expected to continue to experience solid growth rates for the next 3 decades.
In 1970, Hamilton County had 55,000 citizens and ranked 21st of Indiana’s 92 counties. It doubled in size to 110,000 by 1990, ranking 11th largest and joining Madison, Delaware, Tippecanoe, Vigo and LaPorte as “major” counties. By 2000 Hamilton County contained 185,000 people and was ranked the 6th largest in Indiana. Hamilton continued to grow by 75,000 per decade, passing Elkhart and St. Joseph counties for 4th place by 2010. Based on these trends, Hamilton will pass Allen County by 2030 and Lake County by 2040 to become the second largest Indiana county, trailing only Marion County.
Hamilton County has grown as part of the Indy Metro area. Marion County has averaged growth of 60,000 people in the last 3 decades. Hamilton County is forecast to maintain its 73,000 per decade growth rate. The other four suburban counties are forecast to maintain their combined 80,000 per decade growth rate.
Summary
Hamilton County has enjoyed annual population growth of 7-8,000 for the last 30 years and can reasonably be forecast to continue such growth for the next 30 years. The growth of the Indy Metro area stands out versus slower growing areas in Indiana and the Midwest. Hamilton County’s four major cities continue to attract new residents and the county’s northern areas remain available for managed development within short commuting distances of the existing economic centers throughout the county. Economic growth has a tendency to be self-reinforcing. As Hamilton County approaches one-half million residents it will focus more on “managing” such growth.