Good News: Firms and Jobs

Many people complain that the US economy does not create enough new jobs or soon won’t create enough jobs or won’t create enough good jobs or … People worry about employment. Writers and politicians cater to that worry. Fortunately for us, the US economy creates jobs year after year after year, only briefly interrupted by increasingly less frequent and brief periods of economic recession. I’ll share the core numbers on healthy firms and new jobs and provide some context and history which indicates that this is inherent in the modern US economy. The economy is not relying upon any major political change or special insight to continue adding jobs. It just happens.

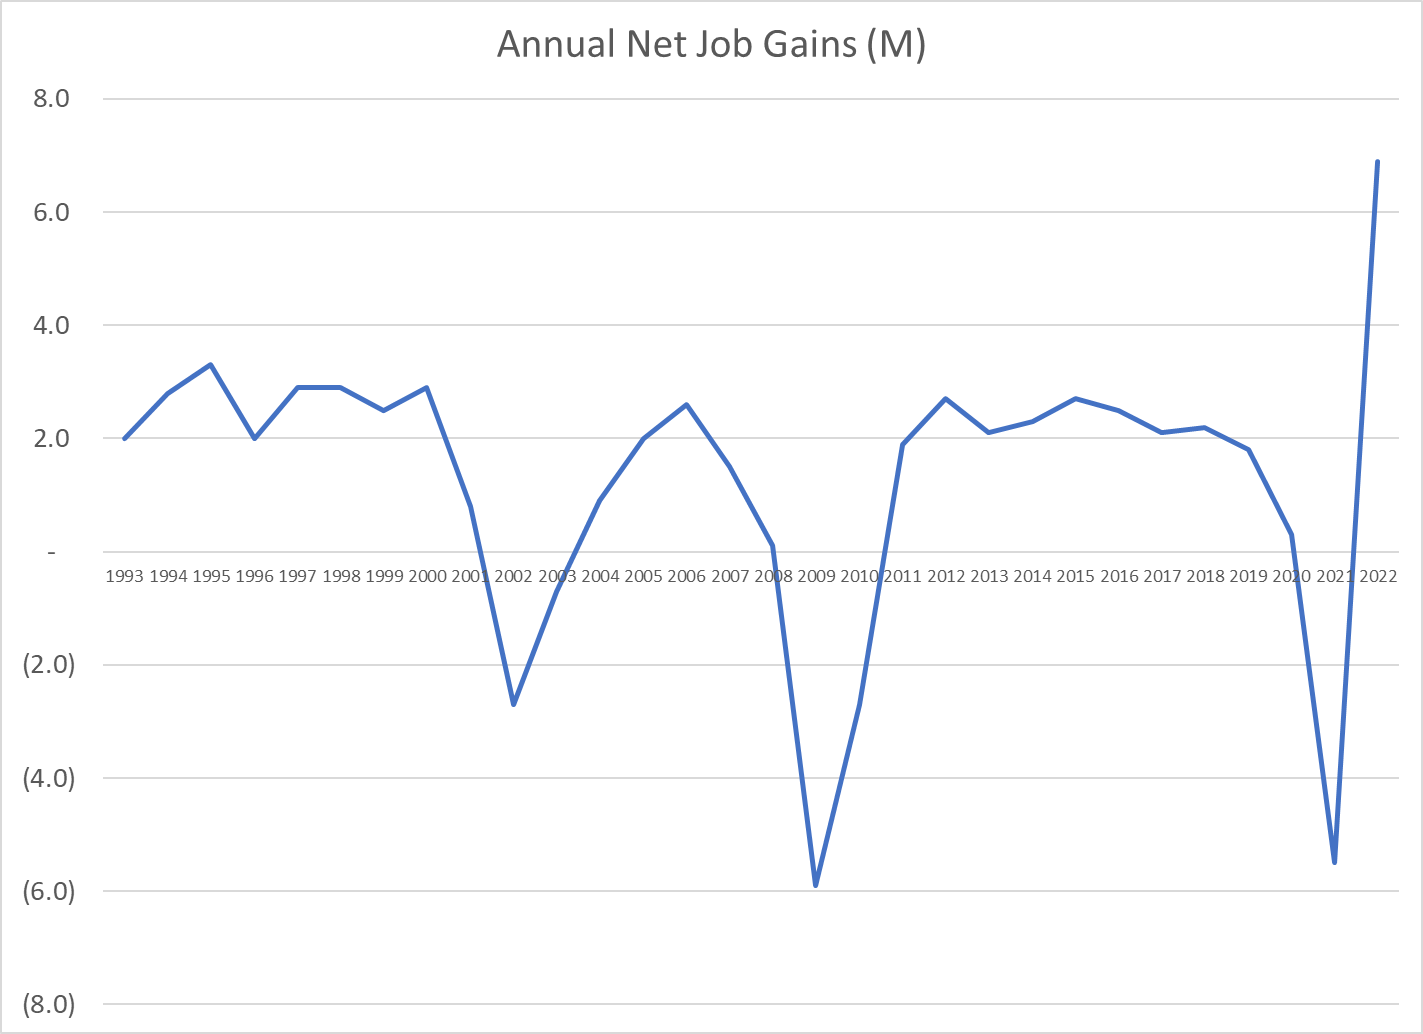
For 9 straight years, from 2011-2020, across 3 presidential terms and 5 congresses, the US economy added 2 million new jobs each year. In the 1980’s, it added 2-4M per year. In the 1990’s it added 3M per year. In the “oughts”, it added 2M per year. 30 years of expansion, 7 lesser years that averaged more than zero. 4 strong years for every 1 weak year..

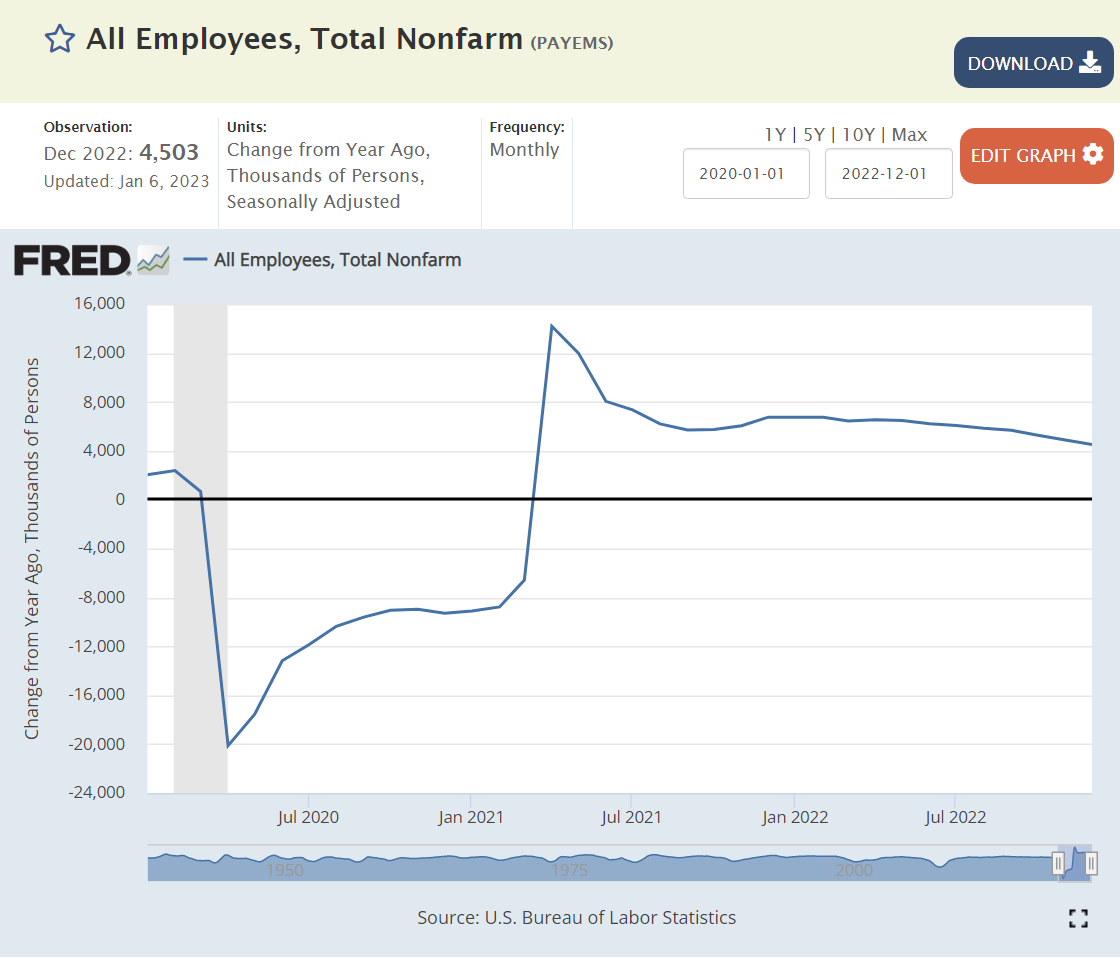
The recovery since the pandemic has been even stronger, starting at 8M new jobs per year in 2021 before sliding to 6M per year and most recently 4.5M per year.

My post earlier this week focused on the role of start-ups in driving job growth. I’d like to build upon that post.

The total number of firms in the US grew slowly in the last 40 years, from 3.5 million to 5 million. The growth rate was much faster prior to the Great Recession (2007-9). Much of this growth was accounted for by single employee firms. Despite this tame 1% growth per year, the economy was able to add more than 2 million jobs per year.

The number of establishments (locations) grew almost twice as fast, just under 2% per year.

The US economy requires some growth in the number of firms or establishments each year to drive job growth. Fortunately, it does not require heroic growth rates.

The number of new establishments added per year is remarkably consistent, averaging about 700,000 per year on a base of 5-7M. Of course, this means that the RATE of new establishments is shrinking, from 14% to less than 10%.

Establishment exits have increased from 500K to 600K to 700K before returning back to 600K per year. Big picture, 700K new establishments and 600K lost establishments each year across 4 decades.

Firm deaths have also been consistent at 450,000 per year.

Data calculated from BDS data. Direct graph not available.

Firm births have also averaged about 450,000 per year but present a different pattern. Firm births were much lower in the troubled time around 1980. Births ranged from 450-500,000 per year in the next 25 years. The Great Depression destroyed businesses, access to capital, personal net worth and aggregate demand. Hence, new firm creation dropped back to the 400,000 level. It recovered back to the 450,000 per year rate by 2015. As with firm deaths, the rate has fallen from 14%+ to less than 10%. Most importantly, the birth and death rates have been relatively consistent and have both been relatively flat, leading to a slow increase in the number of US firms.

https://www.bls.gov/spotlight/2022/business-employment-dynamics-by-age-and-size/home.htm

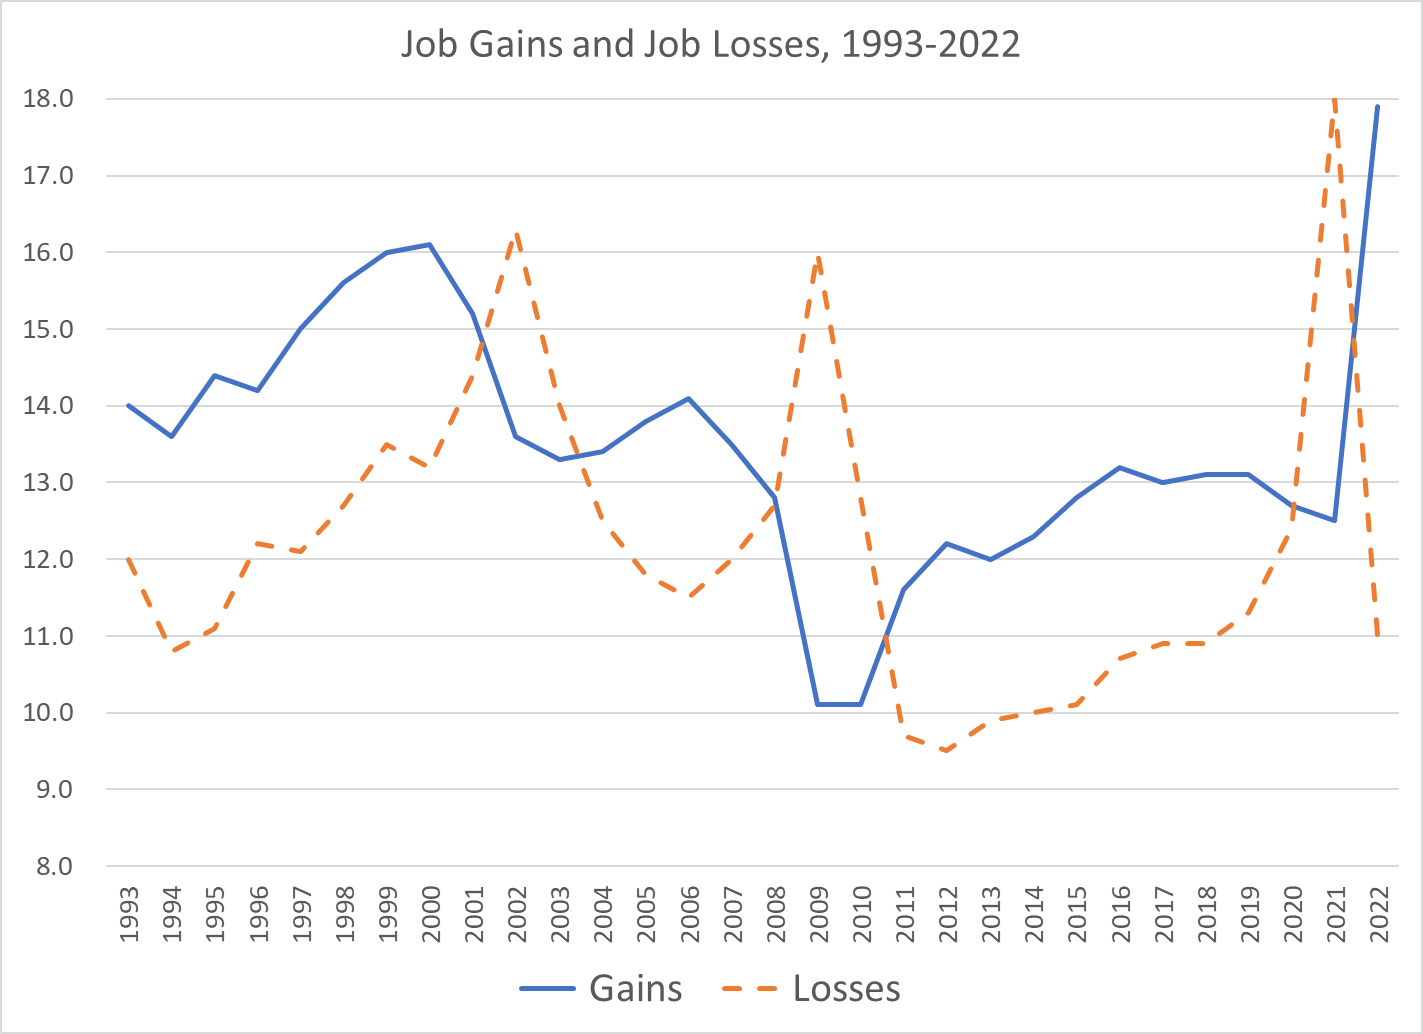
The BDS database shows that job gains and job losses generally move together, but that in a recession job gains fall and job losses increase. This is a very important result. Without active government or policy intervention, the economy creates 12-14M jobs each year and destroys 11-13M jobs each year. There is no guarantee that net jobs will be created in any given year, but overall that is the normal result.

https://bipartisanpolicy.org/blog/trends-in-new-business-creation/

Writers who wish to emphasize the decline of entrepreneurship focus on firms instead of establishments because of the slower growth rate. They emphasize the growth rate rather than the growth numbers because this is less positive. They don’t compare the growth and death rates or numbers, which move together. They focus on the aftermath of the Great Recession which did greatly slow firm creation, resulting in slower than historical numbers and rates of job creation from new firms. Nevertheless, the economy created 2M new jobs per year for 9 years. During that period, existing firms captured a larger than usual share of the job growth required to provide demanded goods and services.

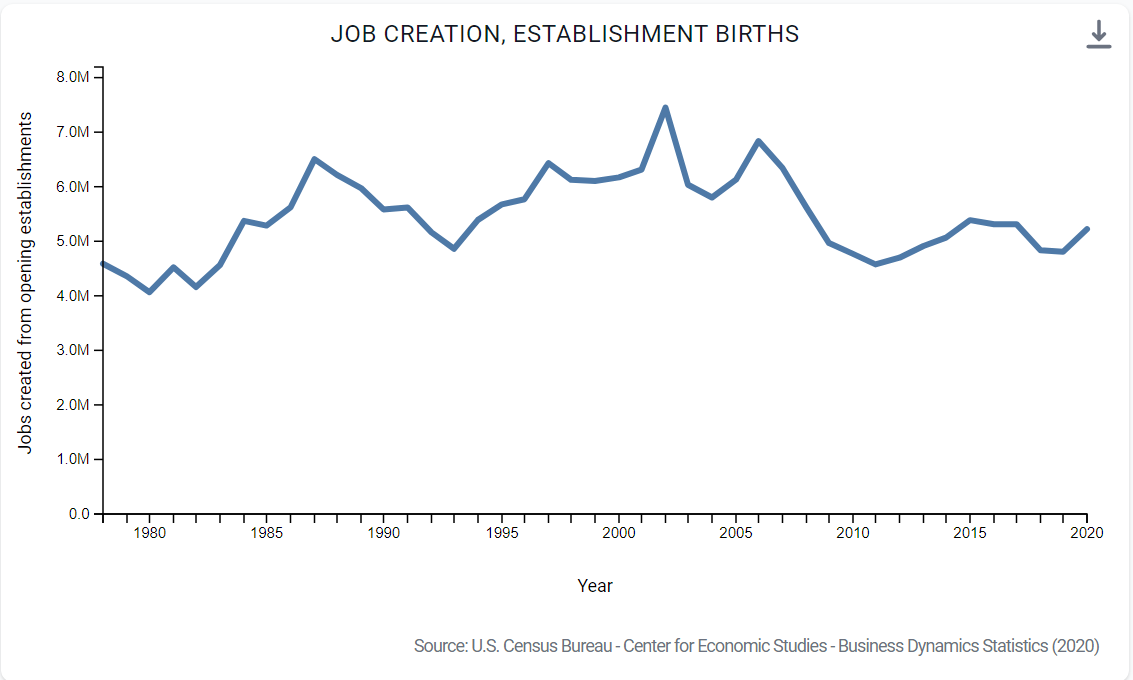
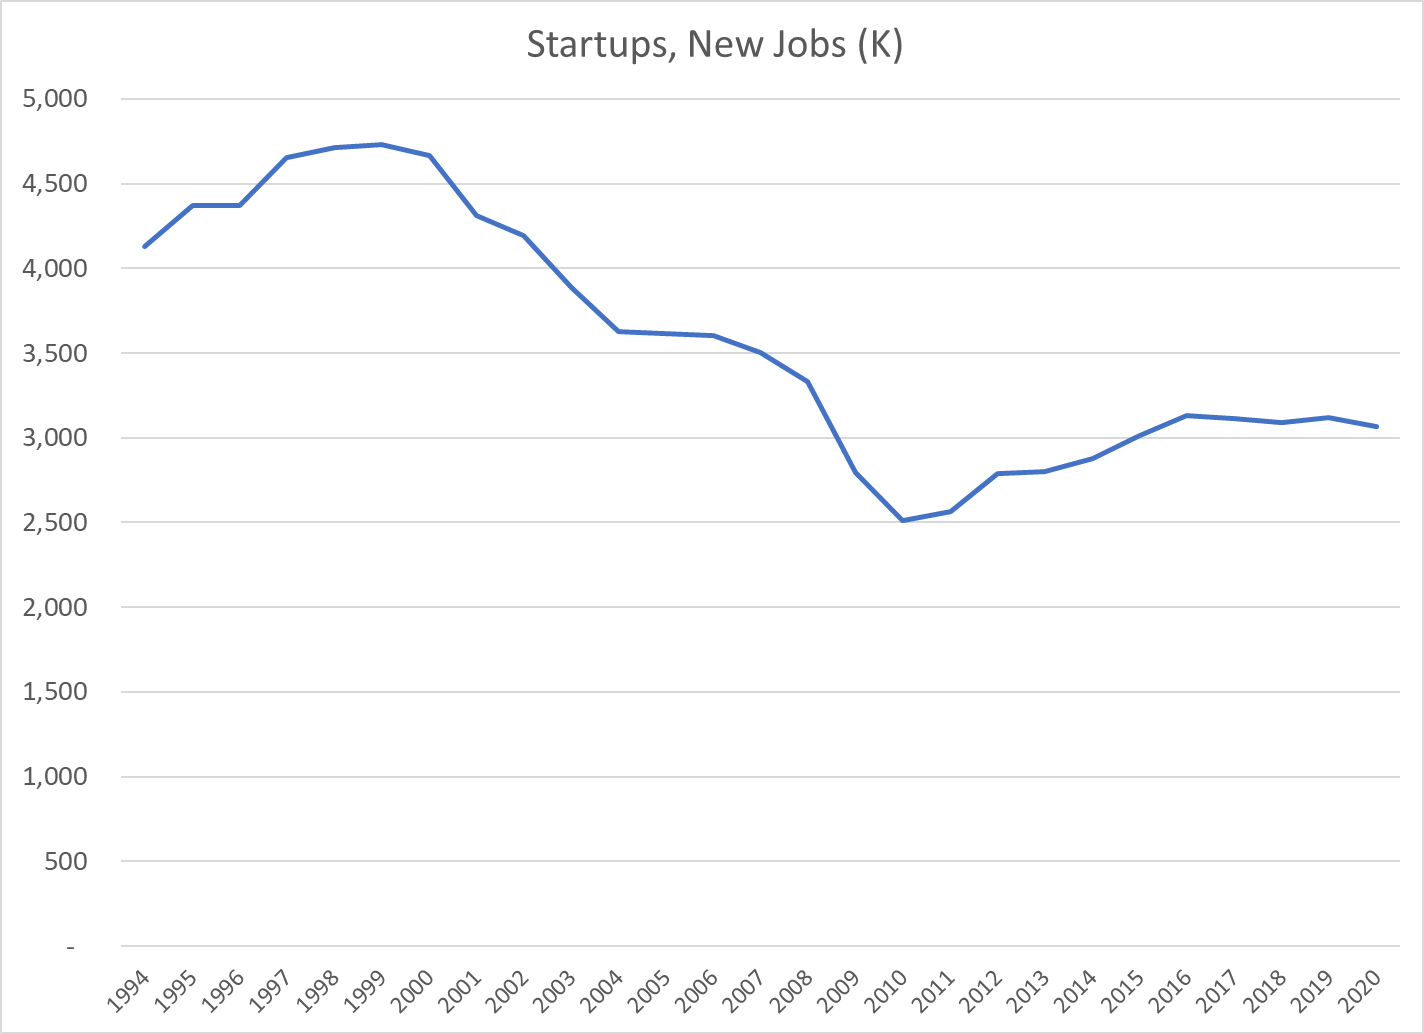
New establishments have driven 5-6M new jobs each year. The late nineties to early “oughts” reported the higher 6M per year figure.

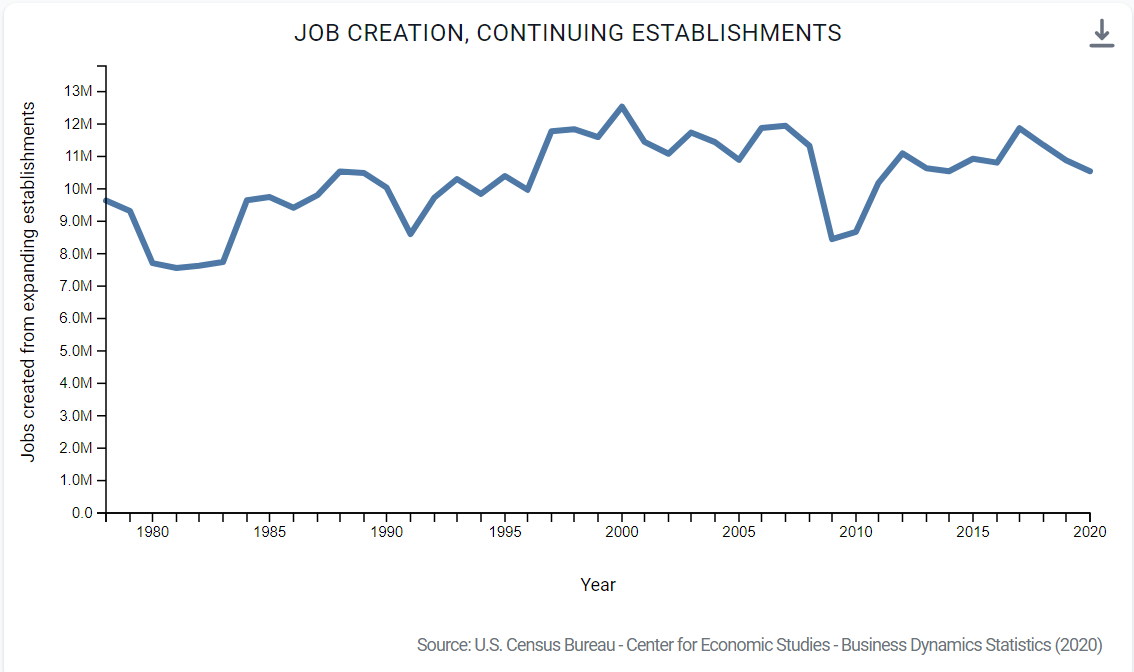
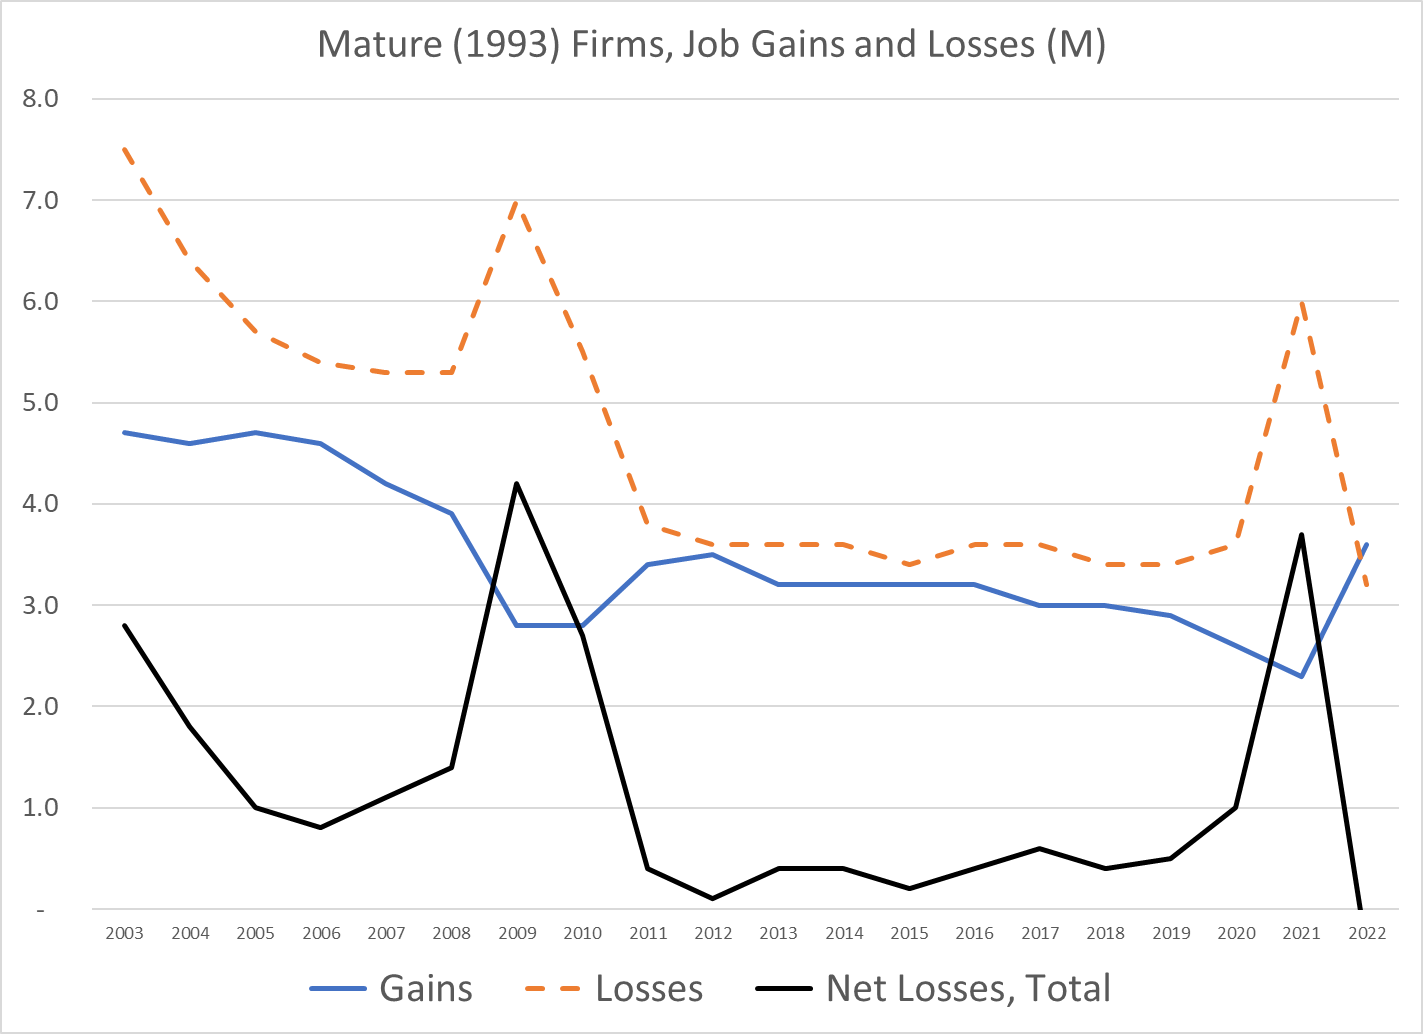
Existing (continuing) establishments have added 10-12M gross new jobs each year.

Establishment deaths (including firm deaths) resulted in 4-5M jobs lost each year.

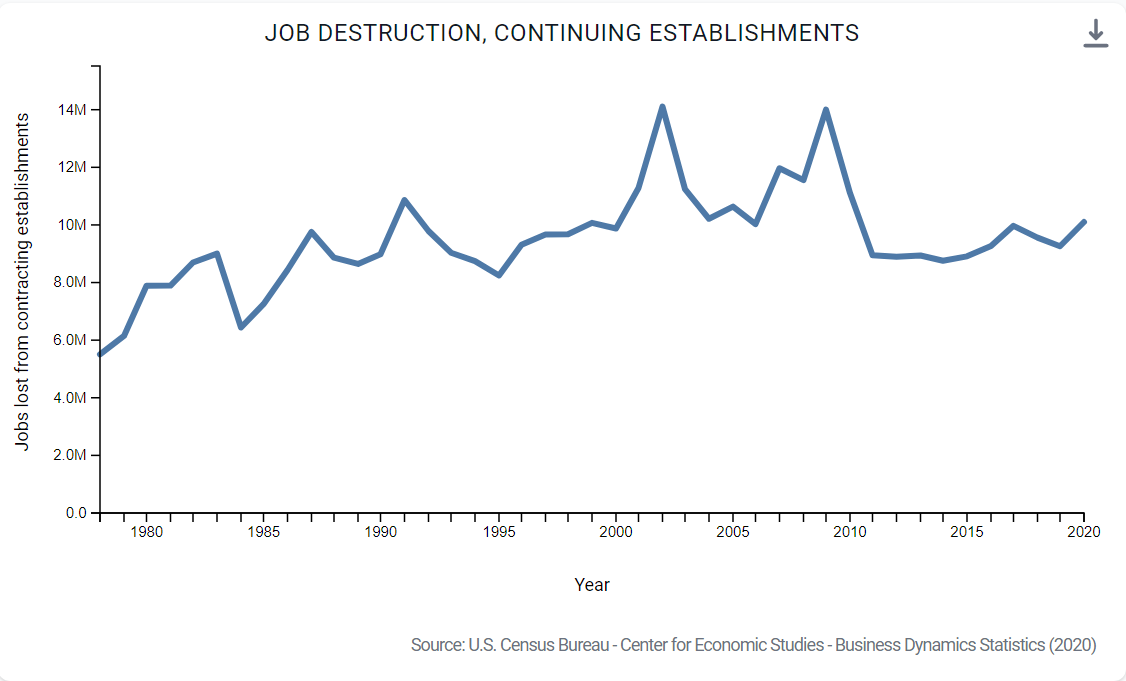
Continuing establishments trimmed 8-9M jobs each year, and many more during recessionary times. Although there are many moving parts, continuing firms eliminate more jobs than they create, especially during recessionary periods when they are adapting to lower demand. Firms die and they close locations, removing 4M jobs each year. New firms and new establishments add the new jobs required to fill the 2M net new jobs each year. This does not happen automatically or precisely, but overall, through time, the pattern is clear.

The US job market has grown from 90-150M positions during the last 40 years.

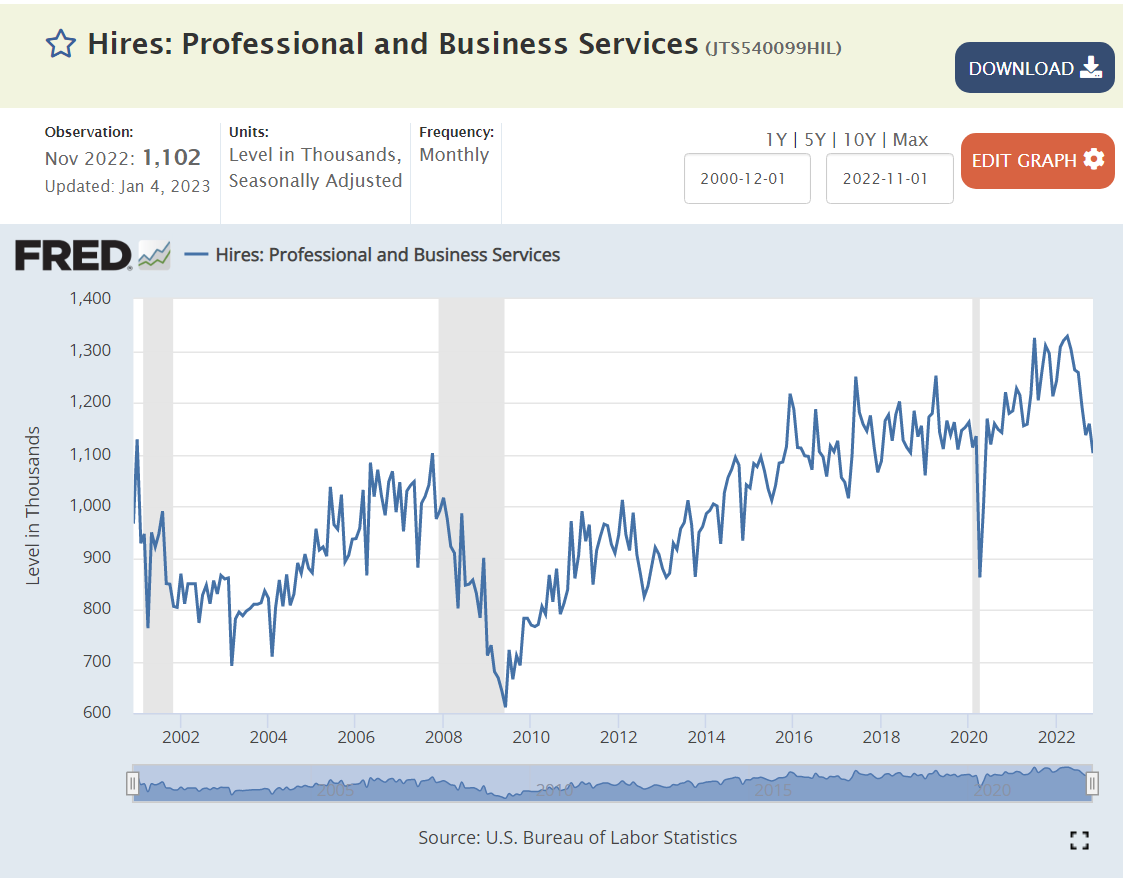
Firms hire 75M people each year. The typical job tenure is just 2 years.

Separations and hires generally move together. The net 2M jobs added annually is a small fraction of employment, hires, separations, gross job adds and gross job losses.

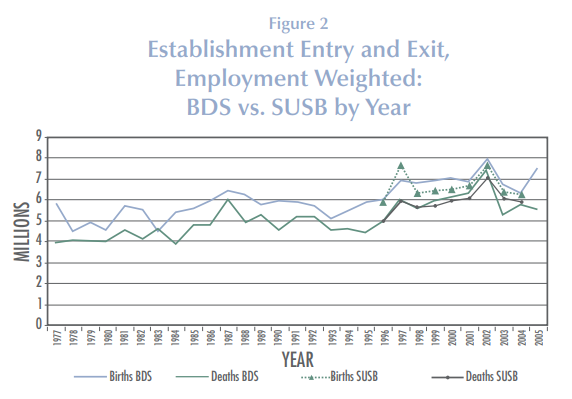
Establishment births exceed establishment deaths except during deep recessions.

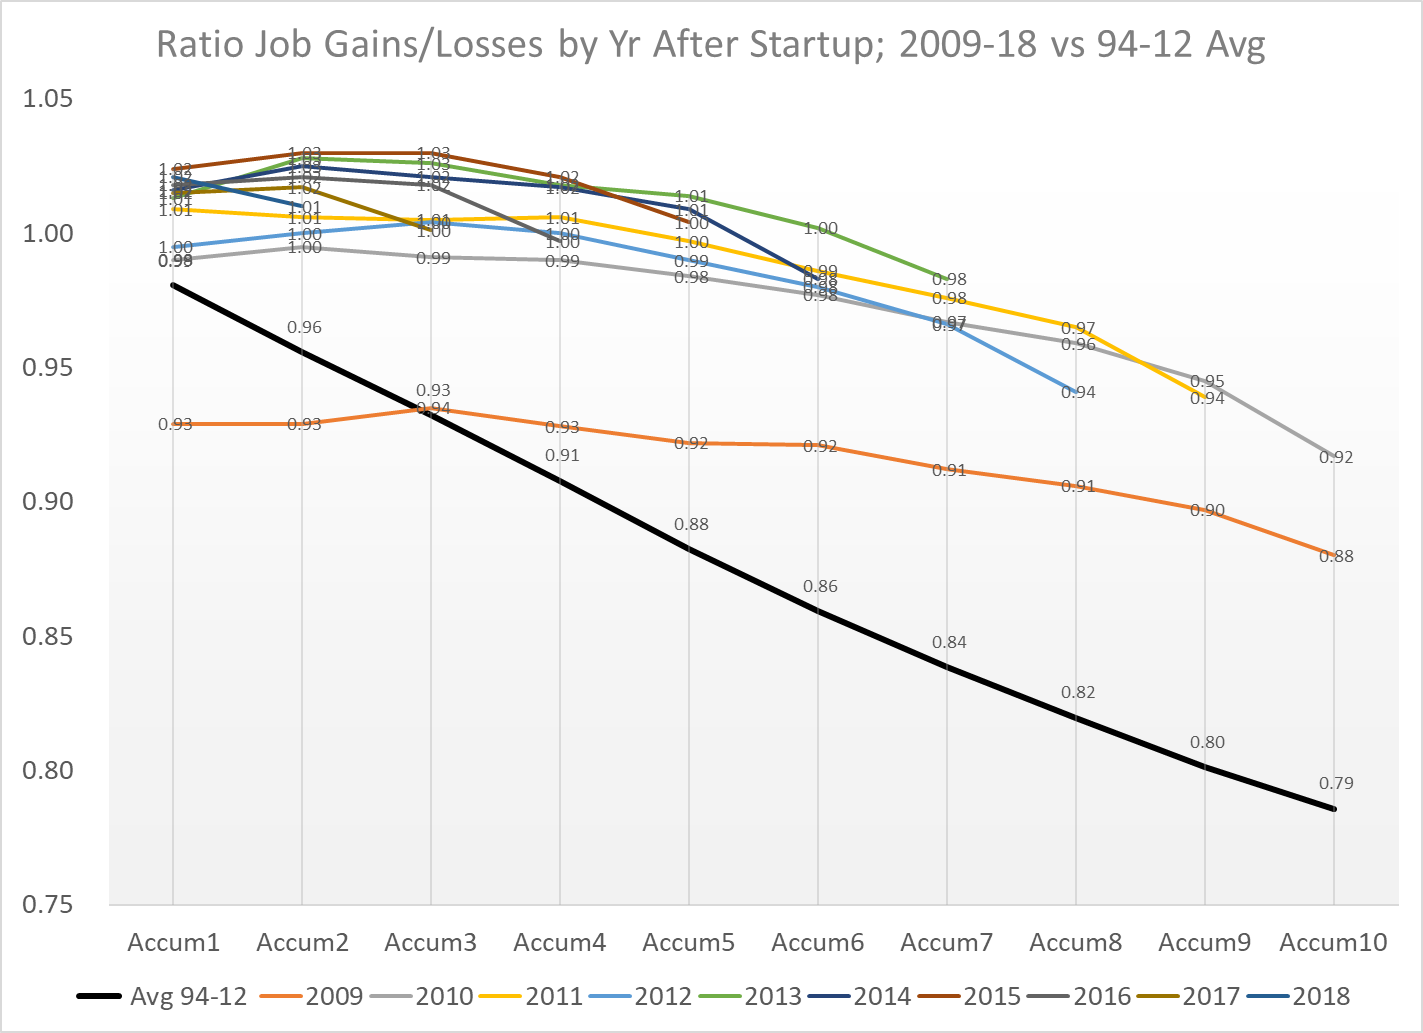
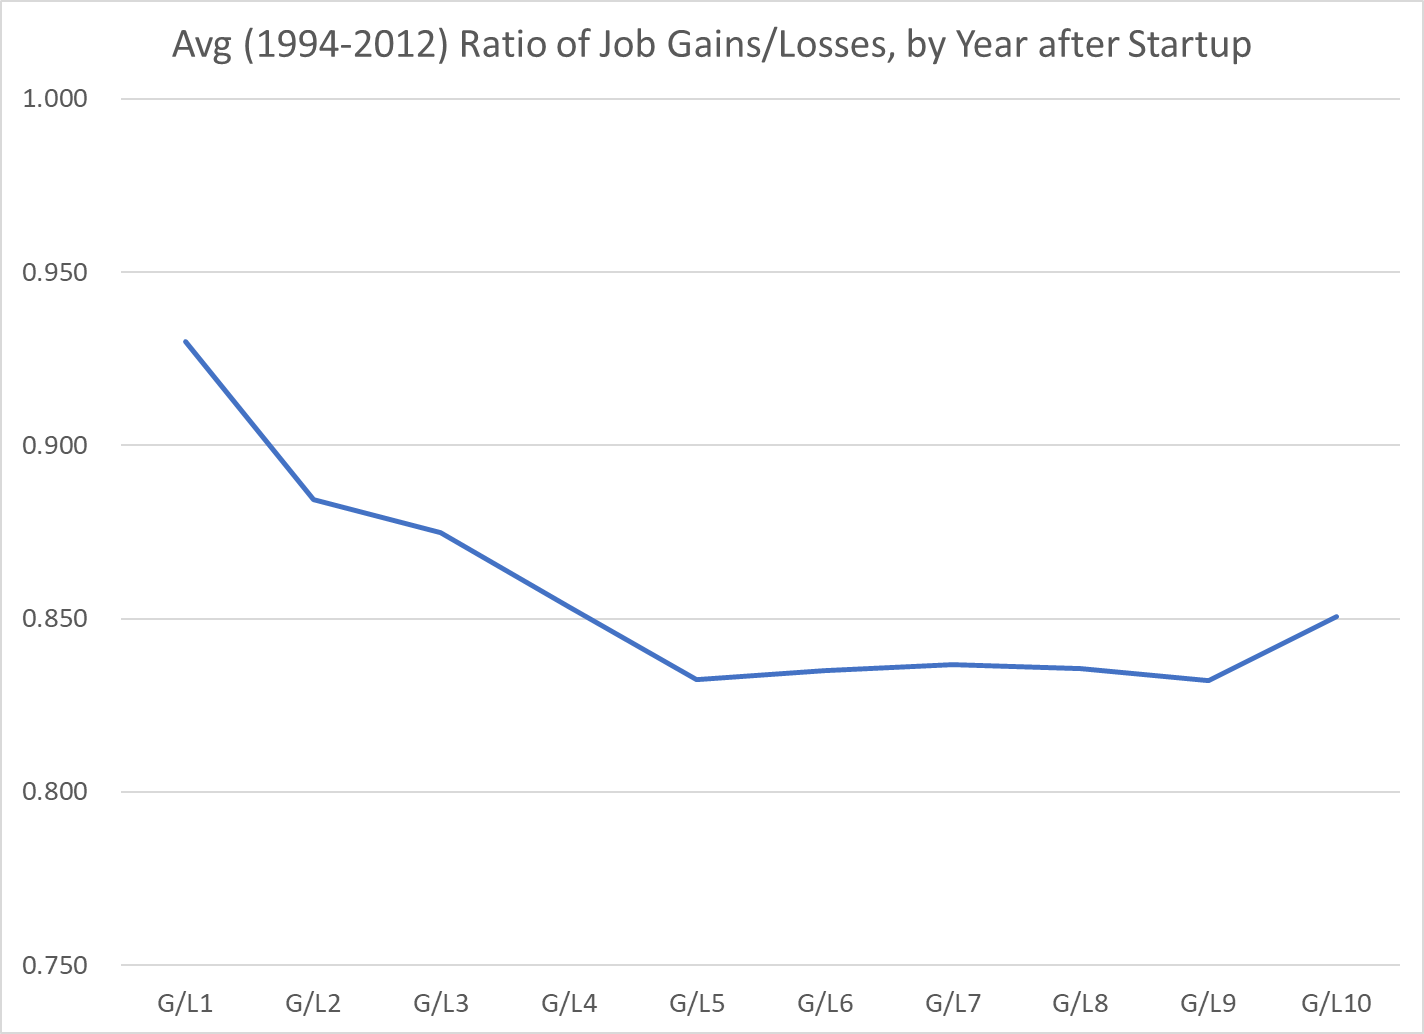
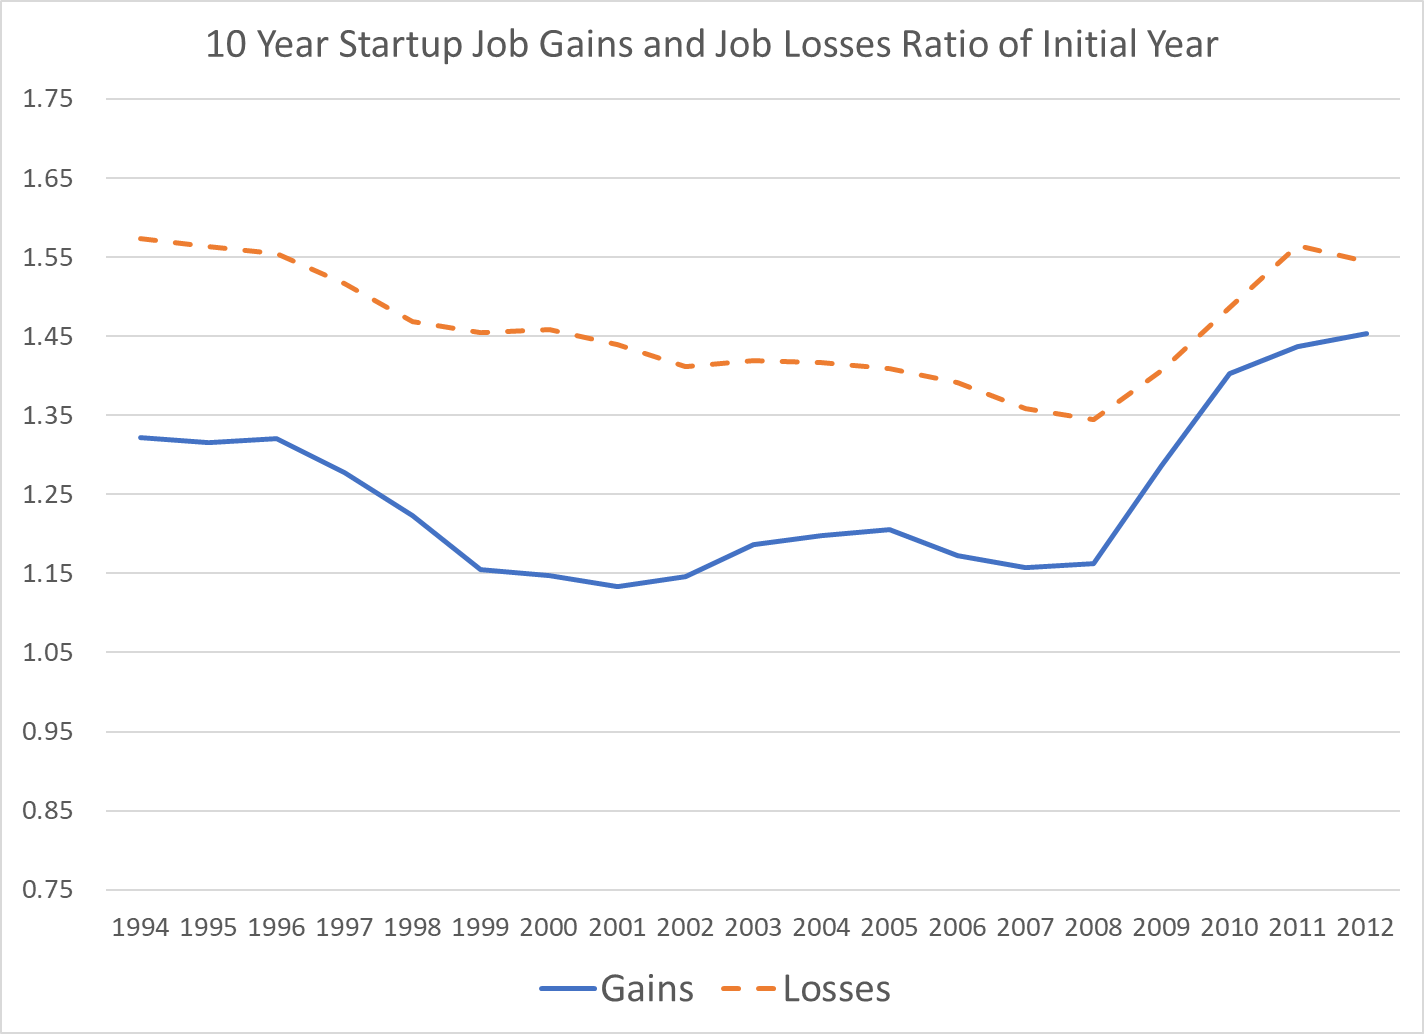
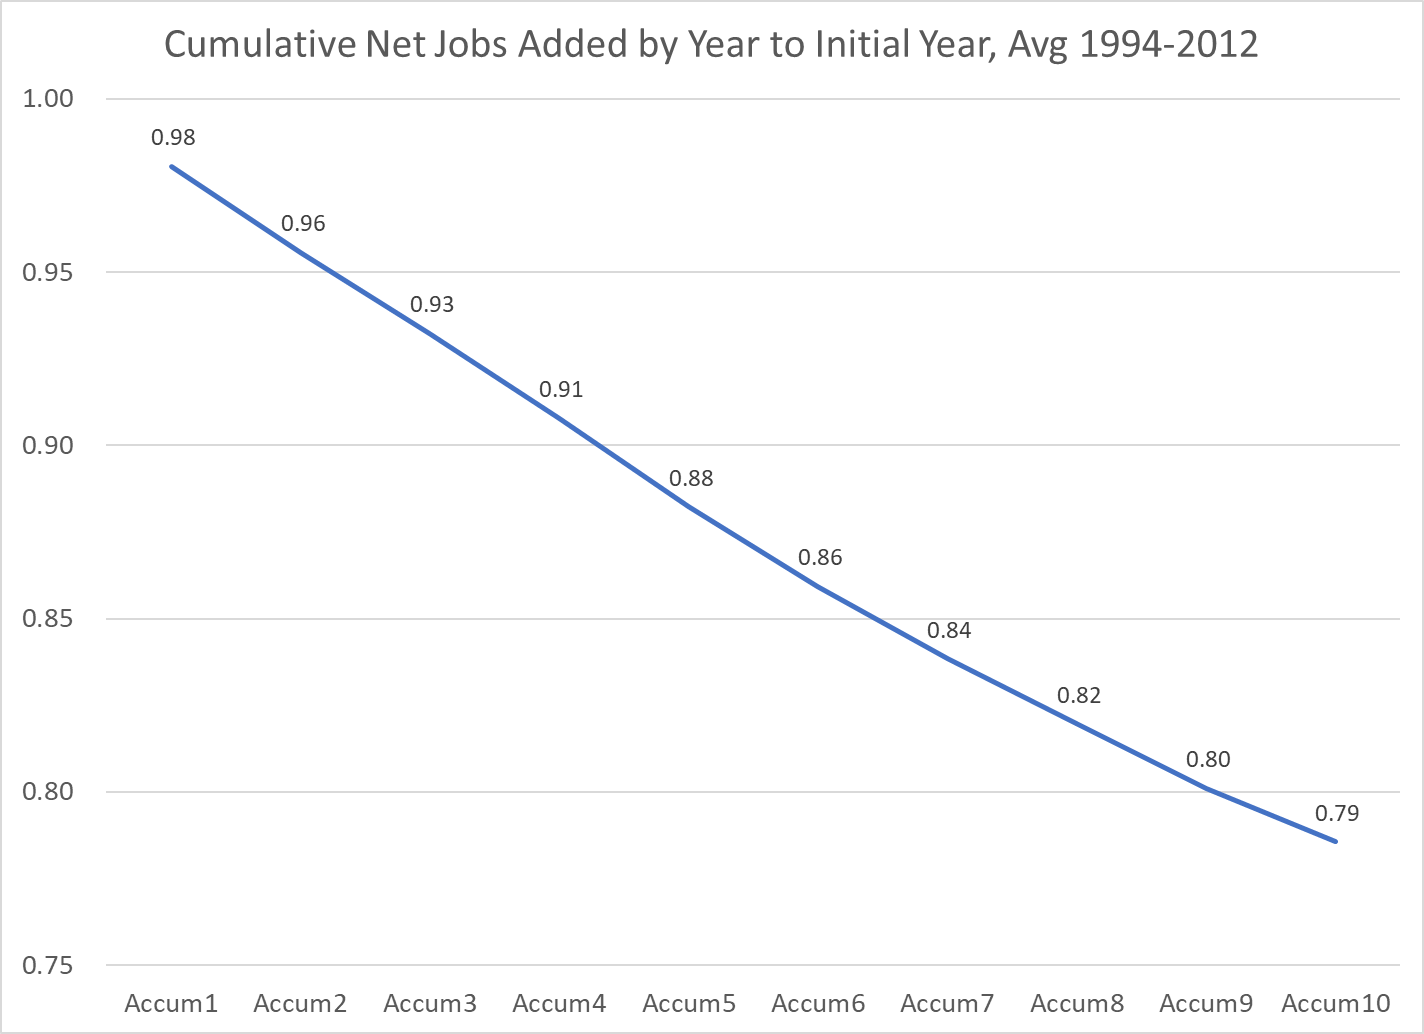
New firms have high failure rates. Fortunately, firms that survive their first year have high percentage rates of new hires. They start with a small number of employees (4) and grow rapidly. The survival rate improves with the age of the firm and the employment growth rate of surviving firms tends to decline as they grow. The combined effect is that 80% of the new employees added by startup firms remain after 10 years. This employment survival rate has been improving in the last 15 years, partially offsetting the reduced number of start-up businesses.

https://www.bls.gov/spotlight/2022/business-employment-dynamics-by-age-and-size/home.htm

The first-year survival rate has remained roughly the same at 80% for 25 years.

The percent of non-business owning adults who start a business each month has shown a small upward trend before jumping up in 2020 and 2021.

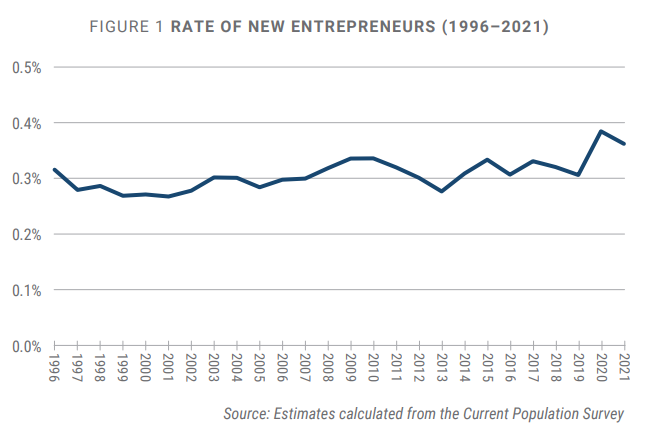
The ratio of new employer businesses to population dropped significantly after the Great Recession, but has recovered in the last 4 years.

The share of “new employer businesses” dropped after the Great Recession and has not fully recovered.

The number of application for new business tax ids increased significantly after the Great Recession and jumped by 50% after the pandemic.

The Census Bureau also tracks a subset of the total new business applications based upon industry classification that is a better predictor of actual businesses eventually started. This measure shows modest growth after the Great Recession and a 30% spike after the pandemic.

About 10% of new business applications become new businesses. Hence, the rate of new business formation to be reported for 2022 is expected to be very high.

https://www.silive.com/business/2022/08/new-business-applications-are-on-the-rise-heres-what-led-to-a-record-setting-year.html

https://www.nber.org/digest/202109/business-formation-surged-during-pandemic-and-remains-strong

https://www.oberlo.com/statistics/how-many-new-businesses-start-each-year

https://bipartisanpolicy.org/blog/trends-in-new-business-creation/

https://bipartisanpolicy.org/blog/trends-in-new-business-creation/

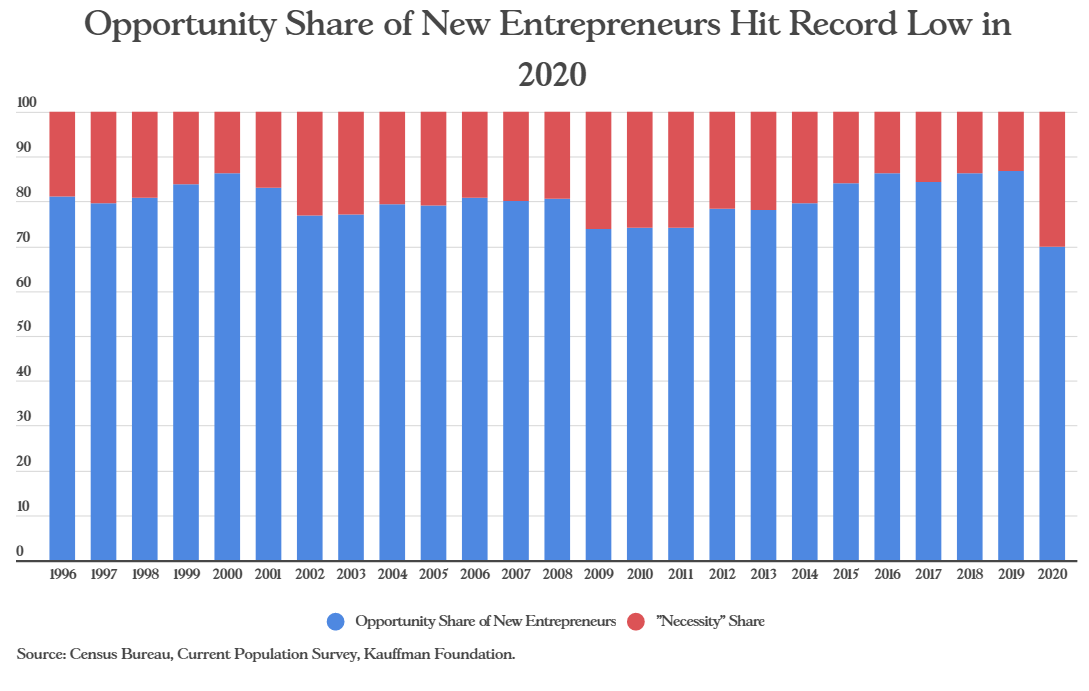
About 80% of new businesses are formed based on opportunity and 20% based on necessity. Kauffman estimates that 2020 business formation was 30% based on necessity.

Summary

The US economy continues to generate 2 million new jobs in each non-recession year, even more in boom periods like the last 2 years. Firms and establishments are born, grow and die. The net employment growth rate for established firms is less than zero in their first 5-10 years and then slightly positive. The annual death rate of existing firms and establishments is relatively low, but on a 150M employee base it is 4M per year. The new jobs added by startup firms and new establishments allow the total number of employees to grow in normal years.

There is no “iron law of employment” that requires new firms or establishments to be created in numbers greater than the job losses. There is no law that requires surviving young firms to nearly offset job losses by young firms that die at a high rate. There is no law that requires mature firms (10 years old+) to add new employees or to die at slow rates. But these results have been consistent or improving for the last 40 years. I look forward to continued success.

Good News: US Startups Still Create Many Jobs (!!!)

I’ve always been a sceptic about the many claims that entrepreneurs, startup firms and venture capital are the “most” important drivers of improved quality of life in the US in my lifetime. I remain a sceptic. I believe that large firms deliver even more added value (driven by self-interest). I believe that the government and not-for-profit sectors play an equally important role. I believe that the government’s definition of the “rules of the game” and our culture’s influence on how people live their everyday lives are also very important. I’ll come back to the role of small firms in a separate blog post. I’ll try to tie together all of the strands of our amazing US labor market in another blog post.

But today, I want to tip my hat to the truly amazing role that startup firms play in driving the US economy and labor market.

https://www.bls.gov/bdm/us_age_naics_00_table1.txt

The US Bureau of Labor Statistics (BLS) tracks new jobs added (gains) and jobs lost (losses) each year in detail by firm and establishment (branch), including links to the year the firm was first created. At the total country level, we see that job creation and destruction follows the business cycle. The Great Recession, subsequent expansion and pandemic periods are obvious above. In the Clinton years, job gains averaged a great 15 million per year. The Bush, Jr. years showed still solid 13-14 million annual new jobs added. The Obama recovery increased new jobs from 10 to 13 million per year and Trump maintained this positive level at the end of a very long period of economic growth.

Job losses generally followed the pattern of job growth. Job losses are even more volatile. They peaked in the recessions of 2002, 2009 and 2021.

In the last 3 decades, the US economy added 2 million new jobs each year during periods of expansion.

Many economists, journalists and politicians claim that startups account for ALL new job growth. This is an “amazing” claim that deserves deeper analysis, investigation and description. I’ll chase this separately. The claim is “largely true”.

Startup firms delivered 4-5 million new jobs each year in the 1990’s. This declined to 2.5 million jobs during the “oughts”. It increased back to 3 million new jobs per year in the teens. In non-recessionary periods during the nineties and “oughts”, existing firms destroyed 2 million jobs each year. In the teens, the job destruction rates were much lower, roughly 1 million jobs per year. The startup jobs minus existing firm jobs number was typically 2 million net new jobs per year in positive economic years.

The BLS separates job gains from job losses and categorizes them by the firm’s first year of existence. Job gains at existing firms were roughly flat at 10 million per year. Startup firm new jobs declined from 4.5M in the nineties to 2.5 M in the “oughts”, recovering to 3M per year afterwards. Startup job creation declined from 45% to 31% of existing firm job creation, a one-third reduction.

The BLS provides data on the subtotal of all firms founded before 1993. These “mature” firms display a similar pattern. Annual job gains fell a bit from 4.5M in the “oughts” to 3M in the teens. Annual job losses fell even faster, from 6M in the “oughts” to 3.5M in the teens. Net job losses averaged 1.5M annually in the “oughts”, but just 0.5M in the teens.

The number of new jobs created by startups declined by one-third during this period, from 4.5 to 3 million per year.

The BLS data allows us to track the gains, losses and net jobs added by first year of existence for firms. First year startup jobs declined from 4.5M to 2.5M. The cumulative jobs created measured 10 years after startup is more positive. Cumulative new jobs, measured 10 years after startup, increased from 3M to 3.5M then dropped back to 3M in 2001. The startup classes of 2009-12, despite the Great Recession, report 2.5M net jobs added each year, as measured after 10 years.

Job losses have fallen much faster than job gains in the last 20 years, measured by a full decade of performance. The ratio of job gains to job losses has improved markedly. This ratio averaged 83% in the nineties, indicating that 1/6 new jobs was destroyed within a decade. This ratio has greatly recovered to the mid-90’s. indicating that new startups, in total, essentially maintain their initial jobs count a decade later. Other data shows that one-third of startups don’t exist after 10 years. Hence, this means that the successful remaining one-third have roughly tripled their employment in their first decade.

Firms die much faster than employment. There are many studies that claim that one-half, three-quarters, fourth-fifths or nine-tenths of employees at startup firms are eliminated in 10-20-30 years. These are mostly exaggerations.

Ten years after their founding, startups still employ 80-90-95% of their initial year hires. Job losses fell during the teens. Job gains grew rapidly after the Great Recession.

For the 18-year period where we have ten years of data on startup firms, we have a clear pattern of net employment decline at the end of the decade, on average. The ten-year retained employment level at almost 80% of the initial level is far higher than the 50% claimed by some commentators.

The years since 2009 show a clear pattern of startups maintaining 90-95% of their initial employment levels after 10 years.

Summary

The US economy typically added 2M net new jobs each year during periods of economic expansion. Historically, startups added 4M jobs annually to offset the 2M jobs eliminated by existing firms. The job destruction rate of existing firms has slowed. The jobs retention rate of startups has improved. Net, net, the US economy still generates 3M+ new jobs each year which essentially still remain a decade later. One-third of the firms are gone, but the winners employ 3 times as many as when they started.

Good News: The US Economy is Still Firing on All 12 Cylinders

Allison V-1710-7 (V-1710-C4) V-12 engine (A19600125000) engine. One-half left front view.

New hires remain above 6 million at the end of 2022! The high in 2002-7 was 5.5 million. The economy barely reached 6 million during the historic 10-year expansion from 2009-2020. New hires in 2021 were above trend, but 2022 remains on the positive track. We’ve been in a “negative” economic climate for 18 months, but the economy has just slowed a bit.

The “distribution” business is doing very well. People are embracing the Amazon model of home delivery. This requires more staff here and less in retail and wholesale trade. 1.1M new hires prior to the Great Recession. Drop to 0.8M afterwards, recovering back to 1.1M for 2015-19. Growing to 1.3M after the pandemic!

The “leisure” industry continues to grow as a share of the US economy, from 900K new hires to 1.2M new hires. There is some slowdown in the second half of 2022.

The broadly defined business and professional services industry continues to grow as a share of the US economy, from 800K new hires in 2004 to 900K by 2011 and 1.1M in 2016. This industry continues to grow, although it has clearly backtracked a bit at the end of 2022.

The retail trade sector has generally been weak for the last 2 decades, with new hires plummeting from 800K to 550K after the Great Recession before recovering to 750K from 2015-19. Retail hiring actually increased after the pandemic before falling back to its historical level of 750K hires.

Health Care continues its forward march to consume all of the US economy. 😦

Manufacturing new hires dropped by one-third after the Great Recession, but very surprisingly recovered from 250K to 350K new hires by 2018-19. Manufacturing new hires grew even faster, above 400K after the pandemic.

The government sector has less variability. New hires have increased to 400K after the pandemic.

New hires in the Construction industry peaked before the pandemic and have drifted downwards ever since.

Hiring in the Financial Services industry dropped by one-third due to the Great Recession, but has slowly recovered to almost the 240K level.

The Arts sector has recovered to its pre-pandemic level of hiring.

Hiring in the Wholesale Trade industry fell from 180K to 120K with the Great Recession but has since recovered to 160K.

The Education industry has continued with its increased hiring.

Summary

The annual rate of new hires has dropped by 10% from 6.6M to 6M. 9 of the 12 sectors have drifted sideways. 3 have fallen significantly in the last 9 months: professional and business services, retail trade and transportation, warehousing and utilities. The economy is clearly in a slow-down period, but the ongoing trend of growth is clear.

Inflation is Slowing

Brief Analysis Below Each Chart:

Since July, overall inflation is immaterial (1%), about 2% on an annual basis.

The Services sector is the most concerning, with annual inflation still running near 6%. The recovery from the pandemic started with the goods sector and then slowly rotated into the services sector as “in person” services re-emerged.

Since March, 2022 durable goods have reassumed their long-term price Deflation.

Nondurable goods are back to 0% inflation.

Energy prices are clearly falling now.

Gas prices have retreated back to $3 per gallon as quickly as they increased.

Food prices have fallen but remain abnormally high, growing at 6% annually. Global pressures may keep this category above normal during 2023.

Wage-push inflation remains a thing of the past. Real wages remain flat.

Strong economies with solid currencies are able to import cheaper goods and reduce domestic inflation.

Producer prices have fallen by 6% from their peak.

US fiscal policy for 2022 was at the same expansionary level as pre-pandemic 2019. I think it was a little too expansionary, but this level of deficit did not significantly drive the increased inflation in 2022. The budget deficit for fiscal year ending September, 2023 is expected to increase by a small amount, even though the latest official CBO forecast showed a smaller deficit.

https://www.cbo.gov/publication/58470

Monetary policy was very loose in 2020, attempting to offset the many threats to the economy. It has since been closer to “neutral”. There is no solid historical or theoretical basis to carefully predict the effect of this huge increase in the money supply two and a half years later.

The Federal Reserve Bank has increased interest rates and the housing, stocks, bonds, construction and commercial investment markets have been impacted, slowing aggregate demand for assets, goods and services.

https://www.federalreserve.gov/econres/notes/feds-notes/excess-savings-during-the-covid-19-pandemic-20221021.html#:~:text=By%20the%20third%20quarter%20of,%241.7%20trillion%20by%20mid%2D2022.

The stock of “excess savings” which supported the rapid recovery from the pandemic peaked in early 2021 at $2.25T. It had fallen by 20% to $1.75B by the 3rd quarter of 2022 and continues to fall, reducing aggregate demand.

Summary

The scariest inflation scenarios are no longer plausible. Durable goods, nondurable goods, producer and energy prices are falling. Food and services prices remain elevated at 6% but are not in double digits and are not increasing. Real wages spiked briefly during the heart of the pandemic but quickly returned to pre-pandemic levels where they have remained.

The federal budget deficit in 2022 was the same as in 2019 when inflation remained low. Even with a slowing economy, the forecast 2023 budget deficit remains about the same as in 2022, not adding materially to excess demand. Monetary policy in 2022 has consistently been tighter and tighter, with the Federal Reserve chairman promising to “do whatever it takes” and highlighting the much greater negative consequences of inflation that does not return to the target level. Weakened fiscal and monetary policy should help to further reduce any remaining supply chain constraints in the global economy. The housing and capital investment sectors are declining. The impacts of changed monetary and fiscal policies are seen 6-24 months later.

Double-digit and accelerating inflation are no longer credible. Deflation is the rule in a large part of the US economy. Monetary and fiscal policies are tightening. Overall inflation is falling. The economy has already slowed, so we may even be entering a period of self-reinforcing lower rates of inflation.

Recession!?, Recession!?, I Can’t Find Any Recession!

October State Level Unemployment

https://www.bls.gov/web/laus/laumstrk.htm

15 of the 50 states have unemployment rates in the TWO’s!

The Great Plains region has 7 states with 2% unemployment rates: MN, SD, ND, Mo, KS, NE and IA.

Utah (2.1%) and Idaho (2.9%) standout in the Rocky Mountain states.

In the Southeast, Alabama (2.6%), Florida (2.7%) and Georgia (2.9%) enjoy minimal unemployment.

New Hampshire (2.4%) and Vermont (2.3%) represent New England and Virginia leads the Middle Atlantic (2.7%).

Another 20 states report 3% unemployment rates, for a total of 35 (70%) at 2-3%.

The remaining 15 states and the District of Columbia (4.8%) enjoy 4% unemployment, historically considered better than “full employment”. Illinois (4.6%) and Nevada (4.6%) have the highest unemployment.

September Metro Area Unemployment Rates

https://www.bls.gov/web/metro/laummtrk.htm

A plurality (40%, 149) of the 370 US metropolitan areas report employment rates of 3%, consistent with the 3.5% overall national rate.

More than one-third (34%, 124), enjoy rates in the 2% range!

About one in seven (14%, 51) reflect better than classic “full employment” rates in the 4% range.

24 metro areas (6%) enjoy astonishingly low 1% unemployment rates.

22 metro areas (6%) are outside of “full employment” at 4.9%. 17 are in the 5% range. 5 exhibit 6%+ unemployment rates.

The statistics for just the top 100 metro areas show the same pattern. The distribution of unemployment rates weighted by population shows less dispersion, with just 3% each in the 1% and 5%+ ranges and a heavier 47% in the central 3% range.

22/370 Metro Areas Not at Full Employment (5-7% Unemployment Rates)

California: Yuba City, Madera, Fresno, Hanford, Merced, Bakersfield, Visalia

Texas: Corpus Christi, Brownsville, Beaumont, McAllen

Illinois: Danville, Kankakee, Decatur, Rockford

Michigan: Muskegon, Saginaw, Flint

Pueblo, CO, Rocky Mount, NC, Farmington, NM and Las Vegas, NV

42 of the 50 states enjoy having all of their metro areas with full employment.

24 Metro Areas with Far Better than Full Employment (1% Unemployment Rates)

Missouri: Columbia, Jefferson City, Springfield, St Joseph, Joplin, Cape Girardeau

Lincoln, NE and Ames, IA

Minnesota: Mankato, Rochester, St Cloud, Minneapolis-St Paul

Dakotas: Fargo, Grand Forks, Bismark, Sioux Falls, Rapid City

Utah: Provo, Logan, Ogden, Salt Lake City

Burlington, VT, Columbus, IN and Bloomington, IN

Summary

The labor market stands out as a very positive measure of the health of the US economy in October, 2022. A general, prolonged, material decline in economic health is difficult to see on top of this broadly very positive economic base. A slow-down? Highly likely.

Has Inflation “Turned the Corner”?

http://news.bbc.co.uk/cbbcnews/hi/find_out/guides/trends/rollercoasters/newsid_1578000/1578955.stm

The stock market reacted quite positively yesterday to the slightly better than expected news regarding measured inflation. The total measure and the “core inflation” measure excluding more volatile food and energy prices were both a little lower than expected for the month and for the 12-month calculation.

https://www.cnbc.com/2022/11/09/stock-market-futures-open-to-close-news.html

I don’t think that trend inflation was ever as high as the markets and voters perceived (double digits) and I don’t think that today’s reaction/perception of a peak or recovery in the inflation rate is correct, as inflation totals and details have been slowing for seven months, since March. In hindsight, the business cycle tends to reflect a smooth “sine-wave” curve of increasing, flattening and then decreasing various measures. It is VERY difficult to separate the “signal from the noise” as the monthly data is released on GDP, employment, inflation, etc.

As usual, we need to look at nearly a dozen measures of inflation and its components and 2-3 views of each component to try to identify the “signal”.

When I look at the consumer price index, I see an inflection point in March, 2022, when a quickly accelerating curve paused its growth rate. Inflation appeared to resume at its prior pace in April and May, not faster than in prior months, indicating that March was a fluke, but at about the same pace, indicating that, overall, there was the beginning of a slow-down in Feb-May. In June, I see a second inflection point, and the pace of price growth has clearly slowed for the next 4 months. The annual inflation rate from March to October was 6.2%

The inflation rate from September, 2021 to March, 2022 was 9.8%. This was the highest rate indicated by this data. 6.2% is a good one-third lower than 9.8%, strongly indicating that the inflation rate has peaked. It might not be declining, but it has clearly peaked.

The annual, 12-month price change measure tells the same story. At September, 2021, the trailing annual inflation rate was 5.4%. At March, 2022, the rate had reached 8.6%. It appears to have peaked at that time, levelling off in the low 8% range. A peak was reached in June at 9%. The next 5 months have shown a declining trend to less than 8%.

The monthly percentage change is much more volatile. Monthly changes reached 0.88% in Jun 21 and 1.32% in Jun 22. There were also lower monthly changes during this period, keeping the 12-month measure to 9% or less. The last 4 months have shown good news, with monthly inflation of 0%, 0.1%, 0.4% and 0.4%, a total of 0.9% for 4 months, or 2.7% annually. This measure is too volatile to claim victory, but it reinforces the notion that inflation has peaked and is beginning to decline significantly.

The “core” inflation index appears to have peaked at 6.4% of annual inflation in Feb, 2022. Most economists focus on this measure because the excluded food and energy components are much more volatile and tend to return to their low long-term inflation rates, so high monthly increases tend to be followed by offsetting declines. The core inflation index appears to have levelled off at 6.5%, but evidence of a future decline is not obvious in this measure.

The monthly core inflation measure fluctuates between 0.4% and 0.6% for the last 18 months, indicating annual inflation of 5-7%. A lasting decline is not obvious, but the October measure is encouraging.

The food consumer price index clearly accelerated from late 2020 through mid 2022. Monthly inflation grew from 0.2% in late 2020 to 0.6% in the last 2 quarters of 2021. Food inflation reached 1% monthly in February, 2022 and stayed at that level for 6 months, before beginning to decline quite sharply to 0.6% in the next 4 months.

https://fred.stlouisfed.org/series/CPIUFDSL#0

On a year-over-year basis, it took a little longer for food price inflation to become noticeable, as the earlier lower inflation months were combined with the growing inflation months. In June, 2021, the trailing 12-month food inflation rate was just 2.4%, comparable to the last 30 years. The annual inflation rate reached 6% by November, 2021 and peaked at 11.4% in August, 2022. The monthly food inflation rate and the trailing 12-month rate are clearly declining. Consumers face a grocery bill each week and are sensitive to these changes for key items.

https://fred.stlouisfed.org/series/CPIENGSL#0

Energy prices are volatile. That’s why they’re excluded from the “core” inflation measure. Nonetheless, from a consumer experience and future inflation expectations perspective, they matter. They matter greatly. The gas and electric bills arrive each month. Automobile fuel is purchased weekly or more often with huge price signs at the station. Monthly energy prices increased by 5% in June, 2021 alone and averaged about 2.5% per month for the next year and one-half. Energy prices then briefly increased by 19% in the next 4 months combined before finally dropping a bit. The monthly experience was one of 2 years of increases and 30% annual inflation for more than a year. The recent price reduction is seen as a release from relentless large increases.

https://fred.stlouisfed.org/series/GASREGCOVW

The most visible energy price. for regular auto fuel, dropped from $2.50 per gallon to just $2.00 per gallon during the first year of the pandemic before increasing to $3.00 per gallon in the second year and then up to nearly $5.00 per gallon in June, 2022. It has since declined to a slightly elevated $3.60 per gallon. Consumer perception of “gas prices” is mixed. It’s clearly higher than in 2019, 2020 or 2021, but it has come down from the peak level. Various threats and weekly volatility make consumers shy to conclude that gas prices are “really” declining.

https://fred.stlouisfed.org/series/CPIHOSSL#0

Housing/shelter is the largest component of the CPI. Both rental and home ownership costs are estimated, with adjustments used to try to smooth out variable month-to-month changes.

Annual housing inflation remained in the 2-3% range for the first year of the pandemic, but very quickly climbed to 6-8% as the supply of new homes was reduced and demand for housing of all kinds increased. Consumers saw this inflation in record high rent and housing prices (new or used).

https://fred.stlouisfed.org/series/MSPUS

https://www.cbsnews.com/news/apartment-rent-price-august-dip-realtor-costar/

With the Fed driving higher mortgage interest rates, consumers can afford less housing, so demand for new and used housing has dropped, causing owned and rental prices to flatten or fall.

Consumers have clearly seen the substantial increases in housing values and rents, and the subsequent flattening in recent months. Most consumers would estimate experienced annual housing inflation at more than 10% for the last 2 years and be unsure as to expected future housing and rent prices. When in doubt, consumers are likely to expect the worst; some level of continued increases in rents and total costs (mortgage payments).

https://fred.stlouisfed.org/series/CUSR0000SAD#0

The pandemic’s large consumer and business subsidies lead to a 20% spike in demand for durable consumer goods, which drove a 25% price increase in 18 months. Consumers obviously experienced this large price increase, even though it was implemented over more than a year. Prices effectively peaked by February, 2022 and then returned to their usual 0-2% annual level. Consumers can feel that “everything costs more”. Many durable goods are purchased infrequently, so the new zero inflation will take some time to shape consumer perceptions, but we are already 9 months into this cycle, so consumers are mostly feeling better about this category.

https://fred.stlouisfed.org/series/CPITRNSL

The “transportation” subset of the CPI looks like the durable goods graph. It contains the prices of cars and trucks, the cost of fuel, insurance and maintenance. I think that most consumers would say that transportation costs are up and have not yet begun to fall, even though the index indicates that they plateaued beginning in March, 2022. This is another category where expectations should slowly change to match the numbers.

https://fred.stlouisfed.org/series/CUSR0000SETA02

Used car and truck prices stayed flat or declined in the 7 years before the pandemic. In the 17 months from June, 2020 to November, 2021 they increased by 45% as private vehicle demand increased and new car supplies shrunk. Used car prices have essentially flattened in the last year. Consumers are aware that prices have stopped increasing but suspect car dealers of still trying to raise prices further. A little more positive experience on this higher profile measure will help to reduce inflation expectations.

https://fred.stlouisfed.org/series/CPIMEDSL#0

Medical cost inflation was a bit elevated at 5% heading into the pandemic, then fell to less than 2% during 2021. It has since returned to 5%. Consumers have relatively weak perceptions of medical costs due to the buffer of insurance policies. Most service prices were restrained during the first 2 years of the pandemic as demand for durable goods was up, but demand for services was down.

https://fred.stlouisfed.org/series/LES1252881600Q

Another way that consumers gauge inflation is through their “real”, inflation-adjusted incomes. Real incomes were increasing slowly in the 3 years before the pandemic, following many flat years. Businesses bid up wages during the first year of the pandemic, but then reduced the increases in their offered wages to less than the increase in inflation. Hence, real wages have decreased by about 2% annually in each of the last 2 years. Hence, at a total level, workers are feeling inflation, because their wages are able to buy a little less at the end of 2022 than at the end of 2020 or 2021.

Summary

The data clearly indicates that inflation has peaked and is heading downward. The rate of decline is unclear. It’s unclear how long it will take to return to a stable 0-2% rate. Consumer perceptions are likely to lag the data by 3-6 months.

Total inflation reached an inflection point in June, 2022, pointing to 3% inflation, rather than 8-9%. Core inflation increased quickly throughout 2021 to a 6% annual level, but has remained flat at 6%. Food inflation reached a 12% annual level, but has slowed to 7%. Energy inflation reached 30% for an extended period of time, but has decreased to “just” 20% with high variability. Official housing costs rose by 8% annually, while consumers experienced 10% plus cost increases. The official housing inflation rate has declined a little to 6%, while consumer perceptions of current and future housing inflation are mixed. Durable goods inflation exceeded 12% annually, but has dropped back to its typical 0-2% range. Broadly defined transportation costs increased by 12%+ for more than a year and have flattened out recently at close to zero percent. Medical cost inflation was low after the pandemic, but has increased back up to 5%. Real worker wages have declined by 4% in the last two years, making inflation a felt reality. There is no sign of a wage-price spiral.

The worst of the post-pandemic inflation appears to be over. Key sectors show flat or declining inflation. Gas prices and used car prices are down. Consumers have used up most of their excess savings. Government spending is way down in real terms. Increased interest rates and a tight labor market are slowing the economy. Consumer inflation expectations are coming down with experienced inflation. Barring another major supply chain disruption, inflation should be under 3% before the end of 2023.

Good News: The US Economy

https://www.indystar.com/story/news/local/hamilton-county/carmel/2022/05/13/carmel-indiana-parking-garages-add-1-300-new-spaces/9515644002/

Recovery from Covid Pandemic

https://fred.stlouisfed.org/series/GDPC1

https://fred.stlouisfed.org/series/PAYEMS

https://www.cnbc.com/2022/10/07/jobs-report-september-2022.html

Real, inflation adjusted, GDP has quickly resumed its long-term growth rate. GDP grew in the 3rd quarter and on an annual basis has continued to grow through the 3rd quarter of 2022. Employment recovered more slowly, but has exceeded the pre-pandemic peak. Very solid job growth has continued through September, 2022.

Real Consumer Spending

https://fred.stlouisfed.org/series/PCESC96

https://fred.stlouisfed.org/series/PCEDG

https://fred.stlouisfed.org/series/PCEC96

Real, inflation-adjusted, consumer spending quickly recovered from the pandemic and continues to grow. Consumers have enough income and savings to spend more, despite inflation challenges.

Best Labor Market in 50 Years

https://fred.stlouisfed.org/series/UNRATE

https://fred.stlouisfed.org/series/JTSJOL

https://fred.stlouisfed.org/series/LNU01300060

https://fred.stlouisfed.org/series/LES1252881600Q

This is the labor market we have been waiting for since I graduated from high school in 1974. Record low unemployment, twice as many job openings and real wages above those of 2018-19, after inflation.

The Growing Economy

https://fred.stlouisfed.org/series/GDPC1#0

https://fred.stlouisfed.org/series/EXPGS

https://fred.stlouisfed.org/series/IEAMGSN

https://fred.stlouisfed.org/series/DTWEXBGS#0

https://fred.stlouisfed.org/series/OUTMS

https://fred.stlouisfed.org/series/MANEMP

https://fred.stlouisfed.org/series/B1448C1A027NBEA

https://fred.stlouisfed.org/series/B359RC1Q027SBEA

The overall US economy continues to grow, faster than other countries, including China. Exports are up by 20% as US companies continue their competitive wins. This is in spite of a much stronger US dollar. Imports are also up by more than 20%, providing consumers with the best of all global choices. Manufacturing output and employment have recovered to pre-pandemic levels. Farm incomes and output are up significantly.

Government Deficits Are Way Down

https://bipartisanpolicy.org/report/deficit-tracker/

https://www.pewtrusts.org/en/research-and-analysis/articles/2021/10/15/states-financial-reserves-estimated-to-surpass-pre-pandemic-levels

https://www.pewtrusts.org/en/research-and-analysis/articles/2022/05/10/budget-surpluses-push-states-financial-reserves-to-all-time-highs

The federal budget deficit has been cut in half, with fiscal year 2022 back to the 2019 level. States have strongly recovered from the pandemic with increased revenues and slowly growing expenditures. State reserve funds are at record levels. 11 states had enough reserves to provide rebates to their taxpayers.

Personal Assets Are Way Up!

https://fred.stlouisfed.org/series/SP500#0

https://fred.stlouisfed.org/series/MSPUS

https://fred.stlouisfed.org/series/CUSR0000SETA02

https://fred.stlouisfed.org/series/LNS11324230

https://fred.stlouisfed.org/series/CP

Retirement savings is at a record high. House values are up by one-third. The US stock market is up by one-third, despite the significant declines in 2022. Used car values are up by one-third. Retirement after age 55 remains very attainable for a majority of individuals. This growth in personal asset values has taken place while corporate profits have increased by one-half.

Fewer Downsides

https://fred.stlouisfed.org/series/MORTGAGE30US#0

https://fred.stlouisfed.org/series/DRSFRMACBS

https://fred.stlouisfed.org/series/DRCCLACBS

https://www.axios.com/2022/09/14/child-poverty-rate-census

Most Americans today have fixed rate mortgages at 2.5%-3%-4%, locking in advantageous low mortgage payments for 10-30 years. New home buyers and those who must move and get a new mortgage do face 7% interest rates. Mortgage delinquencies are down by 80% and credit card delinquencies are down by one-third. Child poverty, after transfers, is at a record low.

Summary/Interpretation

The news media and politicians want to highlight the negative aspects of the US economy: higher inflation, lower personal savings rates, higher mortgage rates, higher home and apartment rents and prices (lower affordability).

It’s important to put all of the pieces in perspective. Inflation is higher and threatens fixed income and low-income households. Households are using up their extra pandemic period savings. The real estate market is slowing, but prices remain high. Economic growth is close to zero, so there are relatively fewer open positions and net new jobs created. There is a threat of a mild recession continuing through the second half of 2023. BUT …

The overall economy has quickly recovered from the pandemic and exceeded record pre-pandemic levels. Recall that the post-Great Recession recovery continued for almost a full decade. The economy recovered from the record pandemic lock downs and “lost jobs” faster than anyone expected.

Economic growth was low, marginally below the arbitrary 0.0% level in the first and second quarters, but recovered to 2% in the third quarter. Annual GDP growth is likely to be in the -1% to +1% level for the next 3-4 quarters as the Federal Reserve Bank’s increased interest rates work through the economy. We may have an “official recession”, but households will encounter limited negative effects.

The labor market is likely to continue its very positive status. Firms still have 10 million open positions that they expect will EACH deliver positive net economic results. We have a labor shortage. At some point, business Republicans will join Democrats to revise restrictive immigration rules and other policies that limit labor force participation.

Firms, businesses, retirement plans and state governments are in very solid economic shape. Assets are very high, liabilities are low. Net assets are at record levels. The Federal government budget deficit is back to the pre-pandemic level.

There is no evidence of a wage-price spiral of inflation. The president and most Democrats seem to accept the Federal Reserve Bank’s actions to increase interest rates, slow the economy and return inflation to its prior 30 years of modest 2%.

Behavioral economists have repeatedly shown that most people are much more sensitive to losses and risks than they are to economic gains. Hence, it is natural to focus on higher inflation and slower growth and discount the many other positive results.

The US economy quickly recovered from the severe pandemic recession with less collateral damage than anyone expected. The growth in the money supply and federal spending/transfers to ensure that we avoided a business, banking and personal meltdown drove a faster than expected recovery resulting in supply chain disruptions, labor shortages and inflation. The “experts” were slow to identify this situation and take offsetting policy steps. Fortunately, fiscal and monetary policy during 2022 have been tight, slowing the economy. We are in the difficult months of transition. No one knows if the steps taken so far are adequate, exactly right or too much. We need another 3 quarters to decide.

Economy: Solid Landing

https://aviationweek.com/defense-space/sticking-landing-us-navy-software-eases-aircraft-carrier-landings

It’s time to revisit the state of the US economy. The media and stock market are overreacting to the positive news today that the US economy added about 250,000 jobs in September. Pundits and investors deem this as a “too hot” labor market which will drive higher inflation and force the Federal Reserve Board to further increase interest rates to slow the economy. We need to look at history, components of the economy and specific measures carefully to evaluate our position.

In a nutshell, the US Congress and President spent so much to offset the pandemic that we have classic inflation from higher demand and lower supply. At the same time, the Fed increased the money supply and lowered interest rates to zero to ensure that the banking sector did not provide a “credit crunch” to businesses or households. Foreign governments and banks acted similarly. This allowed the world economy to work through the pandemic with minor negative effects. However, the boost to the economy was too much and governments and central bankers were slow to reduce the stimulus they provided. The world was tightly focused on “recovering” to the pre-pandemic GDP and employment levels during 2021, so major changes in government spending and the money supply were not implemented until near the end of 2021. By the start of 2022, it was clear that growth was unsustainable and inflation was rising quickly, so policy makers needed to adjust. They have now done so and the impacts can be seen. So far, the economy is slowing, official recession or not, to low/zero growth and looks to remain at that level through the end of 2022 with low/slow growth expected in the first half of 2023.

We can call this a “soft landing”. We can call this a “growth recession”. We can call this a “recession” or a “recessionette”. There is no evidence of a “major recession” with 2% GDP declines or 3% unemployment rate increases or “50% declines” in housing starts or bank lending freezes or massive industry balances to liquidate or … Inflation is high and seems to have peaked. It is not coming down as quickly as most experts (or me) predicted during the first half of 2022, but many factors indicate that we are not in a self-perpetuating inflationary spiral.

https://fred.stlouisfed.org/series/GDPC1

With the benefit of hindsight, real GDP growth during 2018-19 was somewhat above trend and unsustainable. A 2% excess output doesn’t seem like much, but it does matter. The economy at the end of 2021 was in roughly the same place with 3.5% style unemployment. 4Q, 2021 was more than $1 trillion higher (5%) than 4Q, 2020. 5% real annual economic growth is very rare for a large, modern, developed economy. This was after the immediate pandemic bounce. The 3rd and 4th quarters of 2022 are likely to be reported as essentially flat with the 2nd quarter. Consensus forecast is near zero growth in the first half of 2023, returning to 2-3% growth in the second half.

https://www.conference-board.org/research/us-forecast#:~:text=This%20outlook%20is%20associated%20with,percent%20year%2Dover%2Dyear.

https://seekingalpha.com/article/4514734-soft-landing-in-economics

https://www.npr.org/2022/07/24/1112770581/inflation-recession-soft-landing-rates-jobs-fed

https://www.washingtonpost.com/business/energy/why-fed-aim-is-growth-recession-a-not-soft-landing/2022/09/01/c85e9eb8-29c3-11ed-a90a-fce4015dfc8f_story.html

https://www.cnn.com/2022/09/26/investing/premarket-stocks-trading

https://www.bloomberg.com/news/articles/2022-09-13/jpmorgan-says-soft-landing-not-recession-base-case-for-markets

https://fred.stlouisfed.org/series/FYFSD

Federal spending added $2 trillion to aggregate demand in each of the first two pandemic years. In retrospect, too much extra demand.

https://www.cbo.gov/publication/58416

US government budget deficit will be $2 trillion lower in the fiscal year ending September, 2022. This is good news. The “excess” spending was capped more than one year ago, so the trend rate is part of the current core economy. “Excess government spending” is not driving inflation today. It contributed to the inflationary build-up during 2021 into the first half of 2022 (economic stimulus works with a lag effect).

https://fred.stlouisfed.org/series/PCEDG
https://fred.stlouisfed.org/series/CUSR0000SAD

The increased money in consumers’ pockets lead to a 30% increase in purchases of durable goods. Consumers had money. They were afraid to consume in-person services. They bought stuff. They’re still buying stuff. The transition from buying goods to buying services has been slower than expected. This has led to extended supply chain disruptions (globally), higher demand for many commodities and increased goods prices which feed higher inflation and higher demand for labor. The total demand for durable goods has flattened and prices have stopped increasing. This is a much-improved situation from late 2021.

https://fred.stlouisfed.org/series/PSAVERT

Consumers did save some of their extra earnings during 2020 and the first half of 2021, but as prices increased and services became available, consumers chose to spend more and reduce their savings rate down to just 4% of income, well below the 7-8% of the prior expansion period. So, part of the “excess demand” in late 2021 was the drawdown of savings. That cannot happen again. It’s possible that low consumer confidence will reduce spending in the next year, but flat spending is more likely.

https://fred.stlouisfed.org/series/ISRATIO

Most business cycle recessions show a clear build-up and subsequent liquidation of business inventories. Inventories were reduced (involuntarily) in the recovery from the pandemic and have increased a bit since then. There is no current indication of a pending “inventory recession”. In a “zero growth” retail holiday sales season, there will be some eternally optimistic retailers that have to cut prices to move goods, but this happens nearly every year.

https://fred.stlouisfed.org/series/WM2NS

The Fed increased the money supply by an historically unprecedented 25% in response to the pandemic. And then by another 10% during 2021. In hindsight, the 25% was too much and the extra 10% was irresponsible. Fortunately, the money supply growth ended by the fourth quarter of 2021 and has remained flat.

https://fred.stlouisfed.org/series/MORTGAGE30US

Mortgage rates were held to less than 3% for 2 years to support the recovering economy. They have now more than doubled, in excess of 6%. These higher interest rates will slow economic activity in many dimensions: lending, home buying, consumer credit, consumer spending, business investment, risk taking, stock prices, etc. Higher interest rates work with a lag to slow economic activity. They were still at “crazy low” rates at the end of 2021. The impact of higher rates is now being felt.

https://fred.stlouisfed.org/series/MSPUS
https://fred.stlouisfed.org/series/MSPNHSUS

With extra savings, higher earnings, lower unemployment, restricted services available and historically low mortgage rates, consumer demand for housing grew rapidly while supply increased marginally. Housing prices (and rents) grew by 30%. Demand has now slowed. Housing inflation has slowed, perhaps to zero. This is a major channel through which GDP is decreased and inflation is reduced. Home purchases usually trigger thousands of dollars of additional move-in and fix-up expenditures.

https://www.nar.realtor/blogs/economists-outlook/existing-home-sales-decline-5-4-as-home-prices-continue-to-rise-in-june-2022
https://fred.stlouisfed.org/series/HOUST

Housing sales and new housing starts have adjusted to the new interest rate environment. Note that the level of new housing starts remains above the pre-pandemic level, so some further decline is possible in the second half of 2022.

https://fred.stlouisfed.org/series/CP
https://fred.stlouisfed.org/series/SP500

The US and global stock markets very quickly rebounded from the initial pandemic fear levels (-25%) back to the pre-pandemic levels which were more than 10% above the 2018-19 trend line. Stock markets increased after the initial pandemic recovery by 50% in line with growing profits. They have since dropped by one-quarter, a combination of lower expected future profits and higher interest rates increasing corporate financing costs and the cost of equity investors’ funds. Lower stock market prices usually have a negative “wealth” effect, with nominally poorer investors spending less in the current economy.

https://fred.stlouisfed.org/series/CPIAUCSL#0

By the second quarter of 2021 we started to see 7-10% annual inflation rates. Increases finally slowed (or stopped) in the last 2 months. Reported inflation on a 12 months apart basis will remain above the 2% target level for the next 9 months, as high monthly inflation during the end of 2021 and the first half of 2022 remains in the measurements. Experts have a wide range of inflation forecasts for the first half of 2023, ranging from 3% to 8%. Most expect inflation to be close to the 2% target by the second half of 2023.

https://fred.stlouisfed.org/series/PPIFIS
https://fred.stlouisfed.org/series/PALLFNFINDEXQ

Producer price increases followed the same general pattern as consumer prices. They appear to have reached their peak. Producer prices better reflect global prices, especially the higher price of most commodities. Note the 30% increase in US demand for durable goods.

https://fred.stlouisfed.org/series/DCOILWTICO
https://fred.stlouisfed.org/series/DCOILBRENTEU

Global energy prices played a significant role in recent inflation. The last few months displayed an easing of prices, but recent OPEC+ decisions to reduce output indicate oil prices rising some again.

https://www.atlantafed.org/chcs/wage-growth-tracker

Nominal wages accelerated during 2022, perhaps peaking at 7% annual growth.

https://fred.stlouisfed.org/series/LES1252881600Q

Yet, real wages have been falling for 2 years. We do not have a 1960’s style wage-price spiral.

https://www.washingtonpost.com/opinions/2022/10/07/september-jobs-report-analysis-no-recession-yet/
https://fred.stlouisfed.org/series/JTSJOL

Job openings were at a historical high before the pandemic and quickly returned to that level by the end of 2020 and then nearly doubled in the next year+ as businesses saw opportunities to profit from the expanding economy, but could not find workers at the somewhat elevated prevailing wage rates. The number of unfilled jobs has dropped by nearly 2 million recently, from 12 to 10 million. The labor market is returning towards “normal”, but with 10 million open positions, the number of net new positions added is likely to increase throughout the fourth quarter, even as the Fed attempts to slow the overall economy.

https://fred.stlouisfed.org/series/CIVPART

The US labor force participation rate slid from 67% to 66% to 63% from 2000 to 2009 to 2015. It dropped by 1.5% due to the pandemic (61.5%) and has since partially recovered to 62.3%, still a full 1% below the recent peak rate just before the pandemic. The labor market recovery has been good, but not great.

https://fred.stlouisfed.org/series/LNU01300060

The core, 25-54 year old labor force participation rate has increased by 1.5% since the pandemic to more than 82.5%, less than one-half percent below the recent high of 83% before the pandemic. By this measure, the labor market is recovering nicely, but not completely.

https://fred.stlouisfed.org/series/LNS11324230

Retirement age workers have not returned to the work force, with more than 1.5% of potential workers choosing to not join the labor market. Employers will need to be more innovative to attract workers back into the labor market.

Summary

The economy is slowing down, inflationary pressures are easing, but the labor market still looks strong. Slow to zero growth for the prior (3rd) and next 3 quarters is likely as inflation falls from 7-8% to 2-4%. Unemployment rates may increase, but it appears that the total number of employees will increase slowly during this low/zero growth period.

Houston, We Have A Problem. Corporate Profit Growth Has No Limit

https://abc13.com/houston-we-have-a-problem-weve-had-remember-when-history/1869513/

Introduction

US Corporate profits grew from $1.9 Trillion(T) on an annual basis in the second quarter of 2019 before the pandemic to $3.0T in the second quarter of 2022; plus $1.1T (+57%)!!! US nominal gross domestic product (GDP) grew by 17%, from $21.3T to $24.9T, an increase of $3.6T. Real, inflation-adjusted, GDP grew by just 4%, accounting for a $0.8T increase in the real economy. Inflation grew by 13%, causing the other $2.8T of measured GDP. The $1.1T of increased corporate profits represents 39% of the inflation which has occurred in the last 3 years.

Analysis

Let’s look at the growth of US corporate profits from a half-dozen starting points to try to put this into perspective.

https://fred.stlouisfed.org/series/CP

YearProfitReal ProfitAnnl Incr StageCum Annl Incr
197055142
19802732717%6.7%
19954683071%3.1%
20061,3886288%4.5%
20121,8808193%4.3%
20181,947775-1%3.6%
20223,0121,0237%3.9%
https://www.minneapolisfed.org/about-us/monetary-policy/inflation-calculator/consumer-price-index-1913-

US corporate profits reached $3 Trillion in 2022, up from essentially zero in 1950. I’ve selected 7 peak profit years to outline this growth. Nominal profits increased from $55B in 1970 to $3.0T in 2022. In real, inflation-adjusted terms, profits have grown from $142B to $1,023B, a 7-fold increase in 52 years! Annual profit growth has been erratic, increasing by a high of 8% from 1995 to 2006 and a low of -1% from 2012 to 2018. The cumulative annual real profit growth has stayed near 4% throughout the period. 4% compounded for 52 years is a little more than 7x.

The US population grew from 200.3M to 338.3M during this period, 1.0% per year. So, corporate earnings grew by 3% per year above the rate of population growth for 52 years!!!! This kind of compound growth rate cannot continue for long periods of time without greatly impacting other sectors of the economy.

https://www.macrotrends.net/countries/USA/united-states/population

https://www.bloomberg.com/news/articles/2021-12-06/stock-market-u-s-corporations-hit-record-profits-in-2021-q3-despite-covid?sref=d6fKRvkp&leadSource=uverify%20wall

Corporate profits fluctuated in the 4-6% of GDP range from 1947 through 2000. Profits jumped up to 10% of GDP by 2010 and have largely remained at this two-fold elevated level for a decade. Profits reached a new record of 12% in 2022!

https://fred.stlouisfed.org/graph/?g=1Pik
https://fred.stlouisfed.org/series/A466RD3Q052SBEA

This measure shows profits growing eight-fold since 1970. (I’m going to ignore the detailed differences between the various measures of profit. They are important, but not necessary to see the major growth in profits, which is broadly consistent across the various measures.)

https://fred.stlouisfed.org/series/W273RE1A156NBEA

A tighter measure of corporate profits shows an increase from 4.5% to 7% of GDP, even before the most recent profit growth.

https://fred.stlouisfed.org/series/A445RE1A156NBEA

An alternate measure of just “domesticly earned” corporate profits shows a flatter trend.

Another way to consider profits is to view its complement, the share of national income received by labor.

https://www.epi.org/blog/the-fed-shouldnt-give-up-on-restoring-labors-share-of-income-and-measure-it-correctly/

By this measure, labor has lost 10% of its income, while capital has gained 10% since 1980.

https://www.epi.org/blog/the-fed-shouldnt-give-up-on-restoring-labors-share-of-income-and-measure-it-correctly/

6% of GDP was moved from labor to capital.

https://www.mckinsey.com/featured-insights/employment-and-growth/a-new-look-at-the-declining-labor-share-of-income-in-the-united-states

Consulting firm McKinsey shows an 8% of GDP transfer and provides 5 explanations.

https://www.oecd.org/g20/topics/employment-and-social-policy/The-Labour-Share-in-G20-Economies.pdf

Most analyses of the growth in profits and decline in relative wages note that labor productivity has continued to rise by 2% or more annually, but labor has received almost no portion of those gains in the last 30 years.

https://en.wikipedia.org/wiki/Labor_share

Labor share of total income has dropped by 15% in the long-run by this measure.

https://www.bls.gov/opub/mlr/2017/article/estimating-the-us-labor-share.htm

This author calculates a 6-8% decline for labor.

https://taxfoundation.org/labor-share-net-income-within-historical-range/#:~:text=The%20average%20labor%20share%20from,long%20decline%20in%20labor%20share.

A right-leaning think tank adjusts the data and claims that labor’s share remains constant in the long-run. The Tax Foundation does delve into the various measures of income and provides arguments for their preferred measure.

https://fred.stlouisfed.org/series/SP500

Stock prices tend to follow profits. The S&P 500 index has grown by 50% in the last 2 years (despite the recent decline), reflecting the amazing growth in corporate profits during a “once in a century” pandemic driven recession.

https://www.yardeni.com/pub/stmktbriefrevearndiv.pdf

S&P 500 company earnings (a subset of total profits earned) continued to grow strongly through and after the pandemic.

https://cdn.pficdn.com/cms/pgim-fixed-income/sites/default/files/2021-04/The%20Evolution%20of%20U.S.%20Corporate%20Profits_2.pdf

This investment advisor says that profits increased by 5% of GDP.

https://fred.stlouisfed.org/series/LES1252881600Q

Median REAL, inflation-adjusted, earnings remained flat at $330/week from 1979 through 2014, a period of 35 years! This is during periods where profits were growing at 4% per year in REAL terms. In the last 8 years, REAL wages have increased by 9%, a bit better than 1% per year on average.

The media has published many articles, especially noting the increase of profits, overall, since before the pandemic. This is a popular topic because the result is certainly counterintuitive and because President Biden and the more left-leaning national Democrats have been criticizing corporations for “price gauging” and causing the recent inflation spike.

https://fortune.com/2022/03/31/us-companies-record-profits-2021-price-hikes-inflation/

https://www.marketwatch.com/story/corporate-profit-is-at-a-level-well-beyond-what-we-have-ever-seen-and-its-expected-to-keep-growing-11649802739

https://www.cbsnews.com/news/corporate-profits-boom-may-lead-to-higher-wages/

https://finance.yahoo.com/news/us-corporate-profits-stayed-high-through-2021-even-as-inflation-took-hold-160908829.html

A variety of sources provide compelling data and logic to indicate that corporations are “taking advantage of” the post-pandemic inflation caused by supply chain issues and expansive fiscal and monetary policies to boost prices at rates faster than their costs of inputs (suppliers, labor, capital).

https://www.epi.org/blog/corporate-profits-have-contributed-disproportionately-to-inflation-how-should-policymakers-respond/

https://www.wral.com/fact-check-are-corporate-profits-at-record-highs-because-companies-are-overcharging/20068026/

https://abcnews.go.com/US/record-corporate-profits-driving-inflation/story?id=87121327

https://fredblog.stlouisfed.org/2022/07/corporate-profits-are-increasing-rapidly-despite-increases-in-production-costs/

https://www.theguardian.com/business/2022/apr/27/inflation-corporate-america-increased-prices-profits

Most economists and analysts point to the increased concentration of firms (fewer) by industry increasing their pricing power and allowing them to raise prices during periods of change.

https://academic.oup.com/rof/article/23/4/697/5477414

https://www.uschamber.com/finance/antitrust/industrial-concentration-in-the-united-states-2002-2017

This is pretty dense and dry stuff. There is a general consensus among economists who focus on this topic that concentration and pricing power have risen very significantly. This is partly due to the simple aging of industries with fewer players left standing. The winners in a world of global competition are simply “much better” than the losers so they continue to take market share. US anti-trust enforcement in the last 40 years has been very limited, following the theory that “open competition” in the long run (Schumpeter’s creative destruction) eventually undermines leading companies with innovative products, processes and market strategies.

The US Chamber of Commerce argues that industry concentration has not increased, noting that consumer choices in broadly defined industries have increased greatly through time.

https://www.uschamber.com/finance/antitrust/industrial-concentration-in-the-united-states-2002-2017

Summary

By a dozen measures, profit has consistently grown as a share of the American economy in the last 40-50 years. This necessarily means that the share of output and income received by labor is much smaller as a percentage of the total pie. The recent surprising ability of American corporations to effectively work through the pandemic supply chain disruptions, lose more than 10% of their labor force, increase nominal wages significantly, encounter severe input price inflation and still engineer price increases to come out much further ahead on profits is a major story for our time.

It is attracting attention to what I believe is an even more important story: the ability of corporations to incrementally capture nearly all of the increased value added by the productive American economy across 40-50 years and share very little with labor. This structural advantage of a very effective corporate sector “doing its job” within the relatively low-tax and low-regulation US political context is now completely proven.

In an ideal world, we would be developing and considering serious policy options that would limit this excess power without “killing the goose that lays the golden eggs”. Unfortunately, the Republican party remains focused on tax and regulation cuts as the main economic tools and the Democratic party alternates between 1960-70’s era Biden “centrist” policies and much further-left Bernie Sanders style policies.

11 Million Open Jobs! 2 Jobs for Every Applicant

Available Positions

Industry2007 Pos2019 Pos2022 PosAdds
Govt12.212.511.8-.4
Other5.45.95.6.2
Construct7.77.57.6-.1
Manufacturing14.212.812.7-1.5
Mining.7.7.6-.1
Logistics5.06.16.91.9
Education3.03.83.7.7
Health15.320.320.45.1
Leisure13.316.515.11.8
State/Local Educn10.210.410.20
Finance8.48.78.9.5
Information3.02.82.9-.1
Profl Svcs17.820.921.84.0
Retail15.715.615.8.1
Wholesale5.95.85.8-.1
Total137.8150.3149.812.0
https://www.bls.gov/jlt/

Industry2007 Open2019 Open2022 OpenMore Open
Government.3.5.7.4
Other.2.2.4.3
Construction.2.3.4.2
Manufacturing.3.5.9.5
Mining0000
Logistics.1.3.5.4
Education.1.1.2.1
Health.71.21.91.2
Leisure.61.01.61.0
State/Local Ed.1.2.3.2
Finance.3.4.5.2
IT.1.1.2.1
Profl Svcs.91.32.01.2
Retail.5.91.10,6
Wholesale.2.2.3.1
Total3.67.111.26.6
https://www.bls.gov/jlt/

Open Positions as a Percent of Jobs Available

Industry2007 Rate2019 Rate2022 Rate
Government2.43.65.4
Other3.14.07.3
Construction2.23.84.8
Manufacturing2.33.46.4
Mining2.13.85.6
Logistics2.74.87.4
Education Svcs2.42.94.9
Health4.35.48.6
Leisure4.35.79.8
State/Local Ed1.32.03.2
Finance3.54.25.4
IT4.64.76.7
Profl Svcs4.85.78.6
Retail3.05.26.4
Wholesale2.93.55.0
Total3.34.57.0
https://www.bls.gov/jlt/

Open Positions by Industry, 2021-22

The Department of Labor’s monthly survey provides various measures by industry. I’ve broken down the data into 15 industry segments. Eight (8) of these segments account for 5/6ths of all positions and I’ll focus on these 8.

The number of open jobs in the last year, July, 2021 – July 2022, is lead by Professional Services (2.0), Health (1.9), Leisure (1.6), Retail (1.1), Manufacturing (0.9), Government (0.7), Logistics (0.5) and Finance (0.5).

Seven industries accounted for 5/6ths of the increase from 4.6M openings in 2006-7 to 11.2M open jobs today. Health (1.2), Profl Svcs (1.2), Leisure (1.0), Retail (0.6), Manufacturing (0.5), Government (0.4) and Logistics (0.4) are the open job gainers.

The pre-pandemic increase averaged 40% of the total 15-year increase for most industries. The Manufacturing industry showed job declines between 2006 and before the Pandemic, so 80% of it’s openings increase has been since the pre-Pandemic peak. The Business and Professional Services industry has also grown faster since the Pandemic, with 68% of its job growth in recent years. The Retail industry shows an opposite pattern, with 60% of it’s job growth before the Pandemic and a relatively weaker 40% post-Pandemic (on-line sales growth impact).

Total Positions Available by Industry

Total positions increased by 12M, from 138M in 2006-7 to 150M in the last year. Just 4 industries account for all of the growth, lead by Health (5.1), Profl Svcs (4.0), Logistics (1.9) and Leisure/Hospitality (1.8). The migration from ag/extraction to manufacturing to pure services is accelerating.

Open Positions Rate by Industry

The open positions rate more than doubled, from 3.3% in 2006-7 to 4.5% in 2018-19 to 7.0% in the last year. Unfortunately, the larger and growing industry sectors have above average open position rates. Leisure and hospitality shows an incredible/unsustainable 9.8% job openings rate. Professional and business services and Health Care report nearly as high 8.6% vacancy rates. The Logistics industry has a higher than usual rate of 7.4% as it adds jobs at a faster rate in the home delivery era. The Retail and Manufacturing industries show elevated 6.4% open jobs rates. The Government and Finance industries exhibit 5.4% openings rates.

Changes in the Job Openings Rate

The overall job openings rate more than doubled from 2006-7 to the last year, from 3.3% to 7.0%. Keep in mind that 2006-7 was the peak of that business cycle with job openings at a cyclical low point. The Leisure and Hospitality industry had the largest increase, from its usually relatively high 4.3% to an “other worldly” 9.8%. The pandemic drove down travel and it has slowly recovered. The Logistics industry displayed the second highest increase, from 2.7% (it’s usual Manufacturing-like rate) to 7.4% as the Pandemic drove individual shipments to consumers. The Health Care industry continued its labor intensive growth, doubling from 4.3% to 8.6% of open positions. The Manufacturing industry evolved from its usual low 2.3% all the way up to 6.4% as labor demand in other industries grew and attracted its workers. The Professional and Business Services industry kept growing, resulting in a 3.8% increase in unfilled roles, from a typically high 4.8% to a very high 8.6%. The Retail and Government sectors had lower increases at 3%. The Finance sector had a lower than average 2% increase in open jobs.

Just a “Mix” Variance?

The US economy is very dynamic. Industries with low, medium and high job openings rates in 2006-7 each employed about 45M people. The low job openings rate industries (Govt, Manufacturing, Mining, and Educn Svcs) actually LOST 1.4M positions between 2007 and 2022. The middle rate of job openings industries (Logistics, finance, trade, other) added 2.6% net new jobs (1.7M). The high job openings rate industries (Health, Leisure, IT and Profl/Bus Svcs) added an incredible 10.8M jobs (22%)! The US has moved from agriculture to extractive to manufacturing to services employment. The personal and professional services industries are both the fastest growing and the most difficult to staff today.

What Happens During a Mild Recession?

Business and Professional Services openings drop by 3% of the total or 600K people. Health industry jobs decline by a smaller 1% as they are less sensitive to the business cycle, falling by 100K. Leisure and Hospitality are very understaffed and this is harming their growth. They might trim their employment by 2% or 300K positions. The Retail industry is in a long-run decline, so a 2% decline is likely, eliminating 300K jobs. Manufacturing is more cyclical than other industries, so its labor demand will fall more sharply, 3%, removing 400K job postings. The Government sector is somewhat buffered from recession pressures, so job openings might fall just 1% or 100K. Logistics firms are struggling to deliver, so a 2% job decline is the most I see, cutting another 100K positions. The Finance sector has been less volatile, so I estimate a 1% decline and 100K dip.. The remaining industries are likely to fall in tandem, requiring an additional 400K open jobs decline to meet budgets. This total 2.4M open position trim reduces the balance to 8.8M, far above the 7.1M pre-Pandemic level in 2018-19. I don’t think that the labor market will play its usual role in transmitting/amplifying negative finance, banking, housing, international trade, energy and other disruptions through the American economy.

Summary

The US economy was at “full employment” in 2006-7 with just 4.6M unfilled positions. The extended recovery after the Great Recession delivered an even lower unemployment rate, but it also delivered a much increased 7.1M open positions. The post-Pandemic economy has returned to an amazing 3.5% unemployment rate, but the unfilled position count has climbed to a much higher 11.2M and stayed there. The current 7% vacancy rate is largely driven by 6 of the 15 industries with the highest rates: Leisure (9.8%), Health (8.6%), Profl Svcs (8.6%), Logistics (7.4%), Manufacturing (6.4%) and Retail (6.4%). American business is slowly learning to manage with a tight labor very market. Demand for labor should fall significantly in the future as firms employ greater technology, processes, capital goods and imports.

NOT.