We have lost control of our political system and confidence in our institutions. I offer some root cause reasons for this situation in a series of posts. Second post in the series.
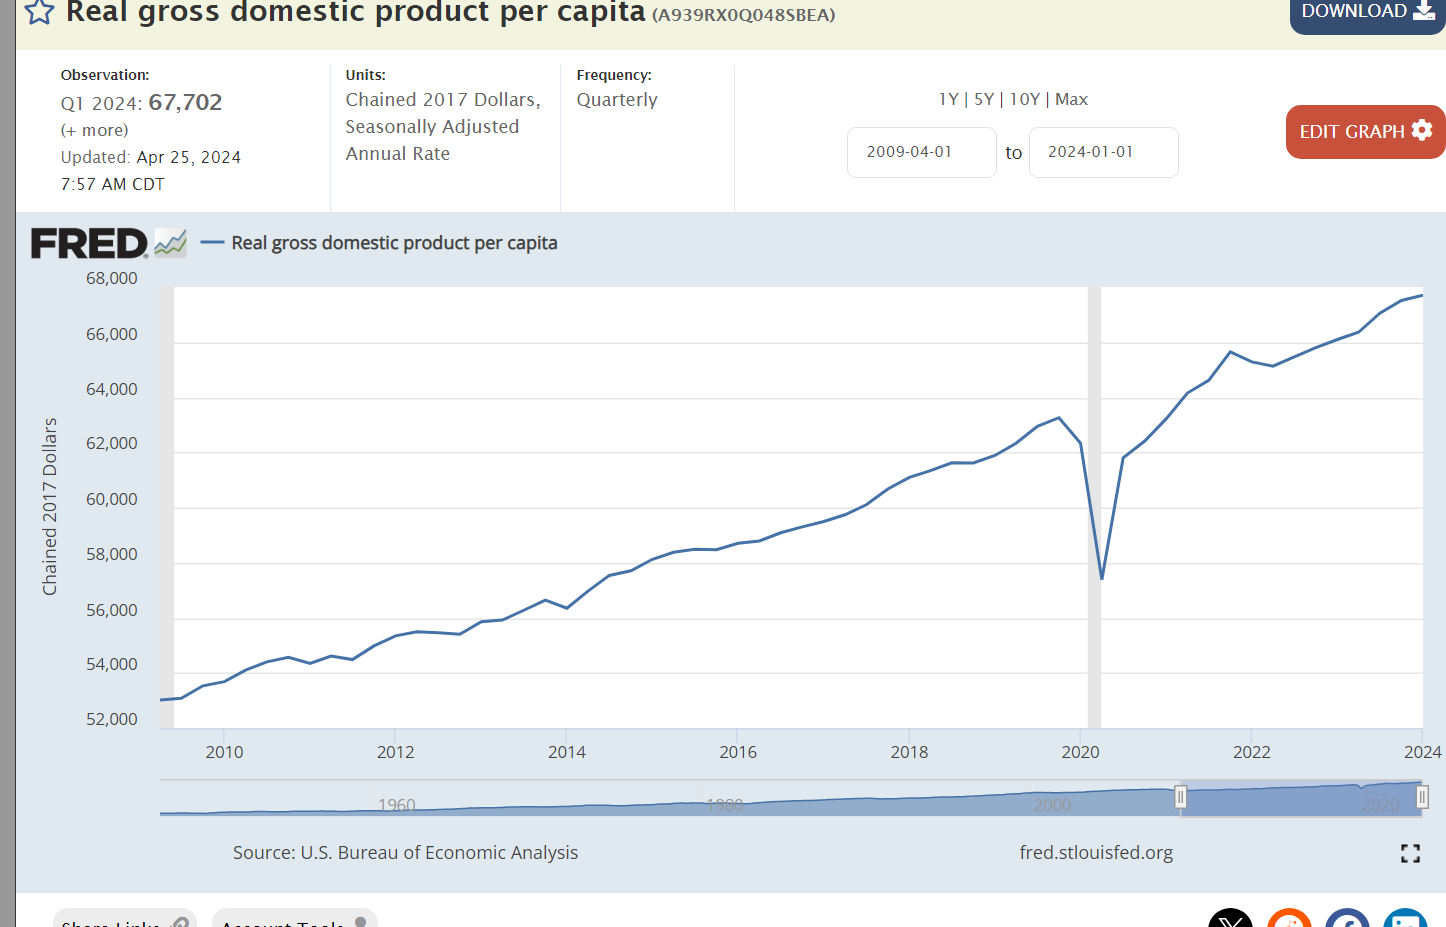
Real, inflation adjusted, gross domestic product (GDP) is up 4 and 1/2 times since WWII when the American economy was the savior of Western Civilization and about to invest in the recovery of Europe and Japan. In this long-term perspective, growth is very constant. Critics can point to the capture of a greater share by the wealthy. Optimists can point to the radical improvement in quality not captured by GDP, increased consumer choices available and a larger share of retirees in the population.
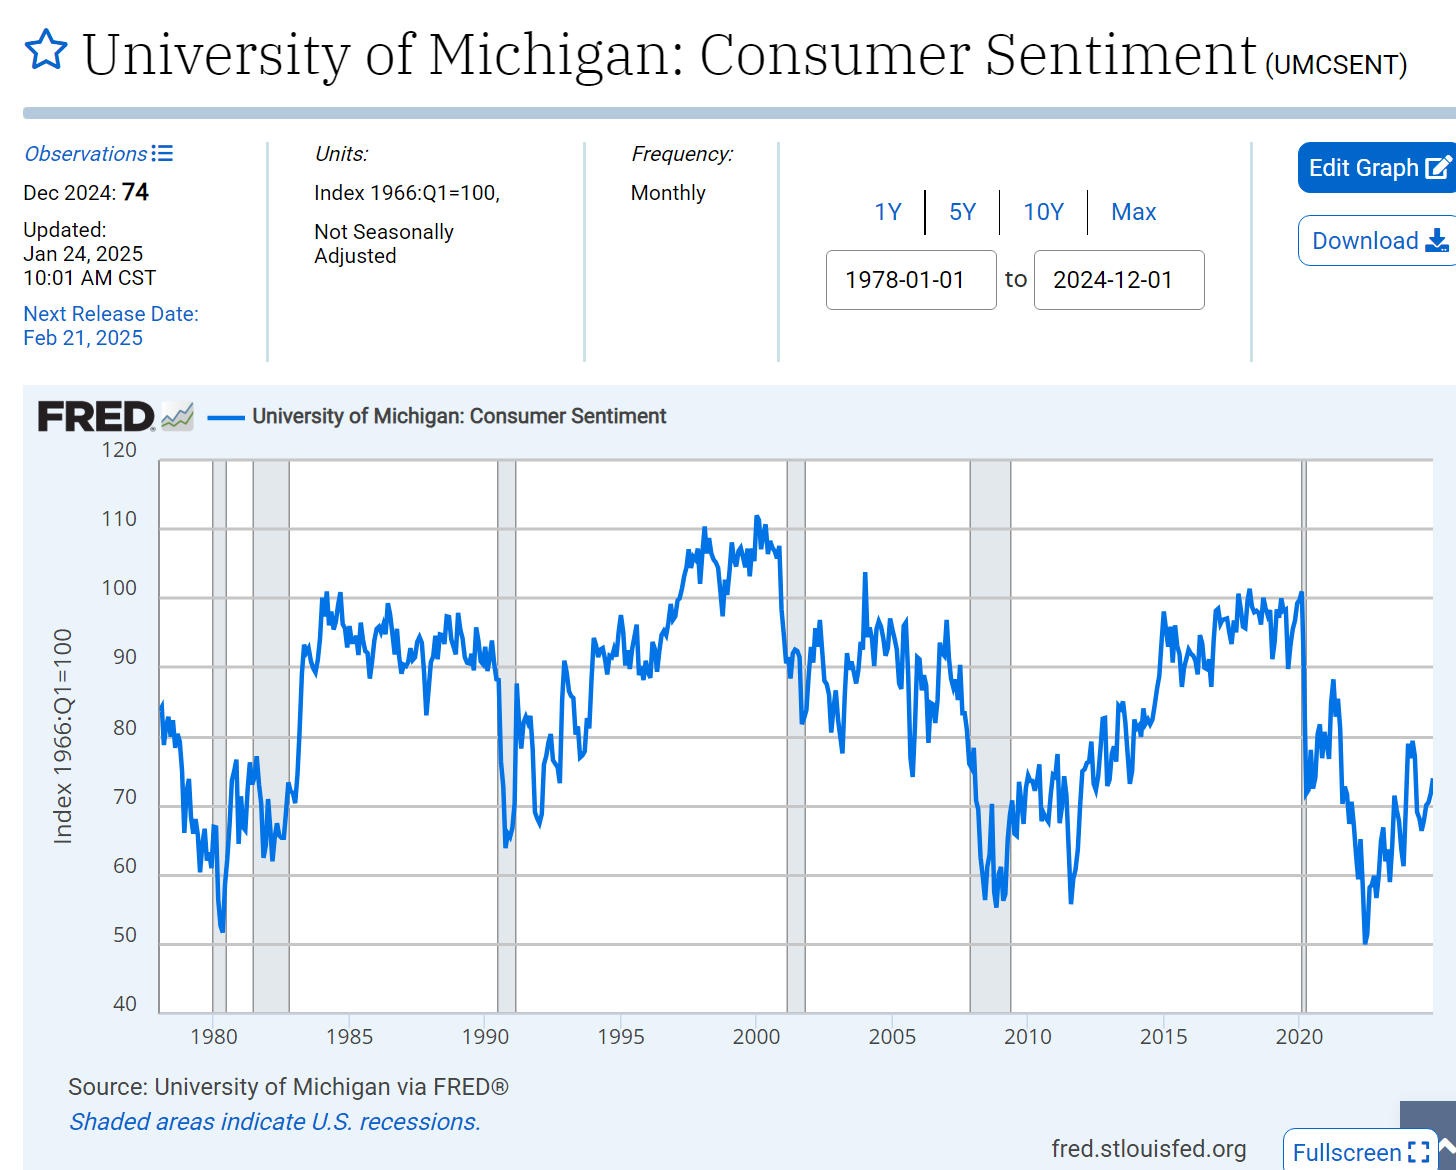
Economic Satisfaction Stagnates
Consumer confidence rises with the economy and declines with recessions and polarized politics, but it has no upward trend to match real incomes!
Unlimited Wants, Limited Satisfactions
Economists assume that people have unlimited wants. Most research and common-sense experience show that this is true.
Post-war economists have persistently claimed that Americans “now” have everything they need materially to be happy, but they have been persistently wrong.
Once we have an idea in mind, we tend to consume information that confirms the idea and avoid or deny challenges. Positive, constructive people will be optimists. Others will be pessimists and follow the bad news media.
When we do try to rationally assess our current situation, we compare it with something obvious. It’s usually something prominent, recent, large, and shiny. We compare today with our best ever experience or situation. We reset our expectations to compare with something prominent in our experience. We don’t plot graphs of our real annual earnings, wealth and leisure. Our expectations are anchored in our best experiences. Current expectations tend to move back to a neutral evaluation.
Humans want more. We are rarely satisfied. That means we are easily distracted in the modern world by marketers, influencers, journalists, bloggers and politicians. Human nature has not changed. Our true economic condition has improved with little impact. Our access to information, education, knowledge and wisdom has increased with minor impact. The ability of communicators to influence our perceptions of the world has greatly increased and we have generally not improved our defenses. “We have much, much work to do today” – Mr. Thoburn Dunlap, 1970, Fairport Harbor, Ohio high school teacher.
This 2017 bestseller was applauded by the WSJ, The Economist, Harvard sociologist Robert Putnam, JD Vance (as a complement to Hillbilly Elegy) and Barrack Obama. It tells the story of Janesville, Wisconsin as a General Motors assembly plant with 3,000 workers was permanently closed in the turmoil of the Great Recession. It focuses on the impact on real people and the community’s response. The author concludes that neither the liberal response of job training nor the conservative response of economic redevelopment incentives was adequate to meet the community’s needs. What could work?
The Core Issue
The US economic and legal system protects the property rights of investors, corporations, and banks. It doesn’t protect or promote the property rights of the other actors in society quite so well: workers, suppliers, local governments, charities, retirees, and children. It is the fundamental discrepancy between different groups that is highlighted in this book, catalyzing the last 15 year’s populist reaction against our system, and begging for a practical solution.
The Core Challenge
Financial interests are flexible. They can be bought, sold and mortgaged. They are geographically mobile. Money and financial instruments are fungible. They can be exchanged with zero to small loss of value.
Other interests are much less flexible and mobile. Labor assets are tied to an individual. Individual labor assets may be tied to a specific situation OR broadly applicable. Real property is tied to a local and regional location. Local governments and charities are tied to a geography. Families are emotionally tied to a location.
The historical political conflict was between the wealthy and the non-wealthy. Landed aristocracy and peasants. Capitalists and workers.
Wealth still matters. The advantages of financial wealth have multiplied in the modern world. Financial rates of return are higher. International opportunities exist. Financial markets are effective and efficient. Risk can be managed through portfolios and derivatives. The shear amount of wealth, and wealth per person, is large enough to be scientifically managed. Generational wealth is preserved. Wealthy interests have effectively “captured” the political system to ensure they are not over-taxed or over-regulated. Network effects from neighborhoods and elite colleges accumulate. The network effects from large metropolitan areas accumulate.
As the advantages of financial wealth have compounded in our society, the distribution of income and wealth has become more and more unequal. For the good of our whole society, it’s time to take some steps to “level the playing field”. This is not strictly about protecting the poor or “fairly” taxing the rich. It is about providing “roughly” equal protection to the various property interests in our society.
The Pinches
In a meritocratic, capitalist society, there will be an unequal distribution of income and wealth. It is difficult to find an obvious “rule of thumb” to limit this dispersion. The higher income and wealth individuals are sure that they have “earned” their returns. Many libertarians and conservatives believe that the “job creators” and “value creators” in society are under rewarded, even before progressive taxation claims a greater share. Most working, middle and professional class earners are sure that they are underpaid compared to their value-added and that the tax system is designed to benefit “others”. Many vote for the conservative political party because they accept this as unavoidable, see disincentives and unintended consequences from attempts to change this, or aspire to become one of the winners. Economists and psychologists report that individuals are much more motivated by economic losses, taxes, risks or takeaways than gains. Hence, any kind of straightforward income or wealth redistribution system is difficult to achieve or maintain. The incentives to pull towards one end or the other are very strong. The philosopher John Rawls’ argument that everyone can, should, will agree to a set of reasonable policies pointing towards limiting income and wealth inequality has been applauded by the left, criticized by the right and ignored by most everyone. We need to find a different framework aside from the “tug of war”.
A dynamic capitalist economic system will include Schumpeterian “creative destruction”. There is enough new wealth to be made and captured that competitors will disrupt and compete with existing leaders in all markets. Firms will grow and die. New firms will be founded. Some will succeed. The real and financial capital within some firms at some times will be destroyed. For some firms this will be part of the portfolio of growing, stable and dying components. For some firms, this will be death. Capitalists will focus on the core goals of value creation, value capture and value preservation. They will do whatever is required to meet these goals. As Milton Friedman argued, at the extreme times they will not look out for the interests of other stakeholders. In good times, perhaps, a little. Based on social pressures, in good times, perhaps, a little. We need to clearly separate “what is” from “what should be”.
Financial investors do not have geographical responsibilities. They have financial responsibilities to owners and lenders. They have secondary interests in maintaining positive relations with suppliers, customers, key employees, key executives and regulators. Large organizations will close low performing assets as required, be they small stores or 3,000 employee factories. New and existing businesses locate plants, offices and distribution centers based on expected costs and benefits, risks and rewards. They are also guided by the convenience and views of their senior executives who generally prefer to live in cosmopolitan surroundings. Firms will decentralize and decentralize to meet various needs. For most firms, local economic incentives are a very minor factor.
Employees, suppliers, governments and charities are fundamentally local. They live real lives with a small number of interactions. They stay in place and appreciate the familiarity of their home, church, school and community. They might move when they finish college or before they have children in school or to meet an extreme need. The move from the east coast to the Midwest to the west took centuries. The move from the farms to the cities has continued for more than a century. The consolidation of the population into less than 100 metro areas has accelerated in the last 75 years. The move from the Midwest, northeast and Middle-Atlantic states to the sunbelt has continued for 75 years. Individuals move based on circumstances and incentives. A fair society provides support for individuals who do not wish to move because economic situations have changed.
The Solution: Protected Assets for All
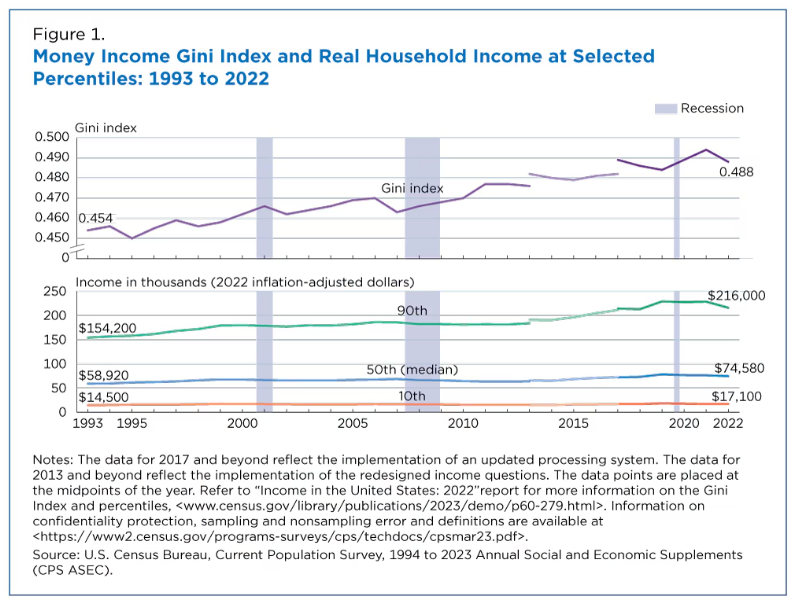
Individuals who honestly review the growth of incomes, wealth and standards of living in the US for the last 75 years must celebrate the amazing 6-fold increase in real per capita Gross Domestic Product (GDP). Labor productivity and overall productivity have improved similarly. Median incomes rose with GDP and productivity until 1975, stalled for 25 years and have since slowly resumed their climb. Quality of life, including health, economic choices, economic security, leisure, safety, product quality, entertainment, and product choices has continued to improve, even when income growth lagged behind output growth. The US economic system produces great wealth and benefits. There is an inherent tendency for the owners of financial wealth to capture an increasing share. We need to find a balanced solution, not undermine the economic system through misguided taxation or regulation.
Health Assets
The US is an outlier in the developed world in not managing health care as a public good. Liberals see health care as a human right. A majority of Americans disagree. We will not soon adopt “socialized health care”. We can work together to adopt policies that reduce the total cost of health care, and which prevent health care costs from bankrupting our fellow citizens.
Provide catastrophic health care coverage for all, covering single event expenses exceeding $25,000.
Provide payroll contribution funded ($200,000 max) annual income catastrophic family medical insurance (>$100,000/year) to all citizens. (alternative to $25K government provided fund)
Invest in nominal co-pay front-line mental health screening, intervention, listening, training, group sessions and counseling services for less critical conditions.
Allow any group of 10 states to create a “medicare for all” health care program as a substitute for the Affordable Care Act.
Allow any group of 10 states to create a private insurance-based (qualify in 2 states, qualifies for all states to ensure competition) health care program as a substitute for the Affordable Care Act.
Pay-off all student loan debt for professional degree medical professionals serving 5 years in non-metropolitan county or metropolitan county with less than 300,000 population.
Require states to provide tuition free medical care and residency spots for one doctor per 10,000 citizens each year.
Reduce medical school preparation requirement to 3 years.
Offer reciprocal medical licensing arrangements with 30 leading countries and expedited review and specific qualifications training and experience requirement defined for all others within 90 days of application.
Family Assets
Provide an annual $10,000 childcare funding source for up to 4 children aged 0-6.
Provide home childcare volunteer refundable tax credit up to $100 per week.
Offer a supplemental 5% Earned Income Tax Credit for two-income families with combined family income below $60,000, phased out to zero at $90,000.
Exclude the first $100K of owned homestead property from taxation and prohibit property taxes on first $250,000 for those aged 70 or above.
Community Assets
We live in a society that prefers to support communities locally and not rely upon government support. We can fine-tune our laws to encourage local support.
Provide a $15/hour volunteer hour tax credit for up to 200 hours annually, including service with religious organizations.
Remove the limits on charitable donation tax deductions for gifts made to public charities and local governments (not private foundations).
Allow large employers to setup new employees with default 1% contribution to local United Way/Community Chest umbrella funding services.
Determine paternity for all births, set and enforce child support agreements, provide basic level support from the state as required.
Subsidize high-speed internet for rural counties.
Offer 10 year T-bill interest rate financing for qualified “low cost” retailers to build stores more than 15 miles away from any existing qualified store.
Levy a $500 per employee annual “closing costs” fee on large employers (250+) for a maximum 20 years to fund local redevelopment programs starting with $5,000 per discontinued employee.
Levy a 0.5% of annual rentals fee on landlords to fund local redevelopment of abandoned properties and areas.
Limit state and local economic development incentives to no more than $10 million per project or location.
Offer a 50% federal tax credit for first $10,000 of cross-state moving expenses.
Offer workers up to $5,000 for relocation or temporary housing as an alternative to up to 2 years of unemployment benefits. (alternative to tax credit for moving expenses)
Restrict issuance of new building permits in counties that do not have one-third of affordable housing permits proposed for units below the existing median unit property value.
Greatly expand availability of 1-2 year National Service programs for young adults and senior citizens.
Invest in prison to work transition programs.
Increase the minimum foundation endowment spending from 5% to 6% to provide more current social benefits and limit the accumulation of assets by universities and other not for profits with $100 million plus of invested assets. Provide an option to pay a 0.5% of assets annual fee to keep 5% or a 1% fee to only spend 4%.
Financial Assets
In our modern world we have to ensure that all individuals are financially prepared for 30 years of retirement. Early and constant savings. Wise investments. Good advisors. For everyone.
Provide a 50% federal 401(k) match on the first $5,000 of savings. Offer a federally backed guaranteed return fund for 401(k) accounts with an after-inflation return of 3%.
Make social security employee tax payments optional after age 62.
Remove social security payment offsets from earned income after age 65.
Auction to private firms the right to offer standard 401(k) financial advisory services for 0.5% of asset value with 100% federal match below $50,000 and 50% federal match below $100,000.
Create voluntary 5% of income home down payment savings program that accumulates to $50,000 after 10 years of full-time employment contributions.
Financial Security
Lifetime employment is gone. Fixed benefits pensions are gone. We live 20 years longer. We need a more robust unemployment insurance system. Individuals may secure a position that pays 25% – 33% – 50% more than their “second best” alternatives. When individuals lose their jobs, we need to buffer their losses and nudge them towards their “next best” options in a timely manner.
Reform unemployment insurance to provide 75% of historical income for 6 months and 50% of income for 12 months. Limit coverage to $60,000 of base income.
Provide a 50% “bridging subsidy” for individuals whose income has dropped by more than 25% for up to 3 years. This would handle the effects of international trade and firm bankruptcies.
Overhaul the “welfare system” to combine various programs into a single program combining a universal basic income (UBI) and the earned income tax credit (EITC).
Create a self-funded unemployment lump-sum payment system based on prior 5 years earnings. 4 months award available after 10 years. 6 months after 15 years. 8 months after 20 years. (Alternative to higher benefits and bridging option)
Maintain a present value of future social security benefits asset balance for each participant. After age 35, allow once per decade 10-year term loan at 10-year T-bill plus 2% for up to 20% of balance, maximum of $50,000 loan balance. Repayment through social security system earnings.
Set a $15/hour adult minimum wage, indexed to 70% of the median income.
Consumer Assets
In the modern world, consumers face sophisticated marketers and professional services firms. They can benefit from centralized support.
Set all import tariffs at zero percent, eliminating the effective tax on purchases.
Eliminate all specific import tariffs but levy a 3% tariff on all goods to “protect” domestic producers and help fund government programs. (alternative to 0%)
Set maximum prices per service and per hour for home and auto repair firms.
States contract for metro and area multiple listing services and limit total real estate commissions to 4% of transaction value.
Require financial advisors to meet the fiduciary standard of professional care, putting the client’s interests first.
Certify public advisors to provide general advice on consumer economics, budgeting, banking, investing, real estate, insurance and health insurance for $100/hour to citizens, with a $50/hour, 8-hour maximum annual refundable tax credit.
Staff state professional licensing boards with a minority of regulated active professionals. Reduce licensing requirements to meet public safety standards.
Set a national cap on individual and class-action lawsuits at $2 million per person, adjusted for inflation.
Auction regional licenses for private firms or states to offer low annual milage limit used car leases to low to medium credit score individuals using federal funding for the inventory.
Education/Human Capital Assets
It looks like our economic system is going to require one-thirds college educated and two-thirds less than college degreed adults. Economically and socially, we need to support all individuals to serve in their roles and for all of us to support the various roles. Think “essential workers” during the pandemic.
Offer $10,000 for 2 years for high school graduates for their education and training, including “career and technical” training.
Create German-style public-private partnerships for broad range of vocational training opportunities.
Offer career and technical training grants for up to 2 years equal to state subsidy of college education.
Provide alternate sets of courses and experience to meet minimum requirements for standard level high school diploma, rather than requiring gateway courses like Algebra II.
Offer an all-industries state administered “career skills” certification program that can be earned in 3 years of employment and classes, including some classes for academic credit in high school.
Require governments and large employers to justify any strict “BA needed” job requirements versus “education and experience” options.
Tax university tuition income above $15,000 at 25% rate to fund public colleges.
Expand veterans hiring preferences to state and local governments, government suppliers and large employers.
Increase the minimum foundation endowment spending from 5% to 6% to provide more current social benefits and limit the accumulation of assets by universities and other not for profits with $100 million plus of invested assets. Provide an option to pay a 0.5% of assets annual fee to keep 5% or a 1% fee to only spend 4%.
Government Services Assets
The corporate world reduces costs and improves valued results by 1-2% year after year after year. We need to set the same expectations for local, state and federal governments.
Sunset laws requiring reapproval of substantive changes after the first 10 years.
Bipartisan staff recommended simplification and clean-up laws, one functional area per year, package approval, no amendments.
Independent staff recommendation of lowest 10% benefit/cost ratios for regulations by agency every 10 years, package approval, no amendments.
Implement balanced budget across the business cycle law that considers unemployment rate and debt to GDP levels.
Require offsetting spending cuts or funding sources for new spending programs.
Require federal programs to have a minimum 20-year payback from investments.
Migrate to minimum 80% federal funding of all federal programs assigned to states.
Outsource the USPS by region, maintaining 3 day per week delivery minimums.
Tax Fairness
Set a separate 10% income tax rate on hourly earned overtime income, excluding it from regular “adjusted gross income”.
Limit corporate type taxation to 10% for revenues below $1 million and 20% for revenues below $5 million.
Limit combined state and local sales taxes to 5% of purchase values.
Revise the “independent contractors” social security law to require the 12.4% self-employed contribution to be identified and deposited for all income.
Eliminate the “carried interest” loophole benefit for investors.
Limit the reduction of “capital gains” taxes versus labor income to a maximum of 20%. Increase the minimum period for long-term capital gains to 3 years. Provide a 50% of annual inflation above 4% credit in the detailed calculation.
Require income earners to pay social security taxes on $1 million annually.
Eliminate the mortgage interest deduction on second homes.
Increase the IRS audit budget by 50%.
Levy a 20% tax on inherited assets above $5 million, allowing a 10-year tax payment plan.
Funding Sources for “Everyone Has Assets”
Levy an annual 0.25% of assets tax on banks and financial institutions.
Levy a 0.25% financial transactions tax on stock and bond investors and traders.
Set a 10% “luxury tax” on all transportation asset transactions worth $1 million or more.
Set a 0.25% annual federal “luxury” real estate tax on all residences worth more than $2 million.
Levy a 0.25% of deal value fee on all “mergers and acquisitions” transactions of $100 million or more.
Levy a 0.25% excess profits tax on earnings above a 5% real, inflation adjusted return on assets (ROA) for firms with revenues of $100 million or more.
Reduce the depletion allowance base on mineral assets by 10% of the acquisition cost.
Starting with the 35% tax bracket ($462,501 married filing jointly), reduce allowable itemized tax deductions to 0 at $2 million of income.
Add a 40% tax bracket at $2 million of income.
Levy a 5% of excess price paid on personal vehicles sold for more than $50,000, boats for more than $100,000 and recreational vehicles for more than $100,000. (alternative to 10% above $1M)
Add a 10% surcharge to property tax rates for residential properties larger than 5,000 square feet. (alternative to surtax above $2 million)
Setting Firm Limits on Taxes
I have separately proposed a set of constitutional amendments that limit taxation of the wealthy, allowing them to support steps like those above without fear of being fleeced.
Our society hasn’t found a clear organizing principle to guide it between the claims of the people and its leaders. We tend to lean towards the individual, liberty and freedom. This has led to a large number of modest initiatives. We have an opportunity to help our community embrace and support the political steps required to achieve our goals.
On a personal note, I grew up in Fairport Harbor, Ohio, a small village of 3-4,000 people. The Diamond Alkali chemical plant once employed 5,000 people. It shut down in 1976. My dad was a pipefitter and union leader. My uncle Joe was also an employee and a union and political leader. The negative community impact was very large. The negative impacts described by Amy Goldstein in Janesville were exactly the same in Painesville 40 years earlier.
The president-elect’s tariff threats are rejected by all professional economists and almost all business leaders. They are mistakenly intended to provide international relations negotiating leverage, force firms to build US factories, and increase domestic manufacturing employment employment. They are based upon the misguided belief that the US economy is broken. It is ironic that Democrats and liberal have trumpet the amazing condition of the US economy.
The US economy continues its evolution from agriculture to manufacturing to services to information. President Trump was responsible for the US economy from February, 2017 through January, 2020. President Biden assumed responsibility in February, 2020. In order to compare the two presidents, let’s look at Trump for the 3 years of sustained growth deep in the business cycle before the pandemic. For Biden, let’s look at a comparable 3-year period from June 2021 through June 2024, after the post-Covid rebound. Trump benefitted from an 8-year long business cycle expansion. Biden had to deal with a once in a century pandemic driven economic depression.
Inflation: Advantage Trump
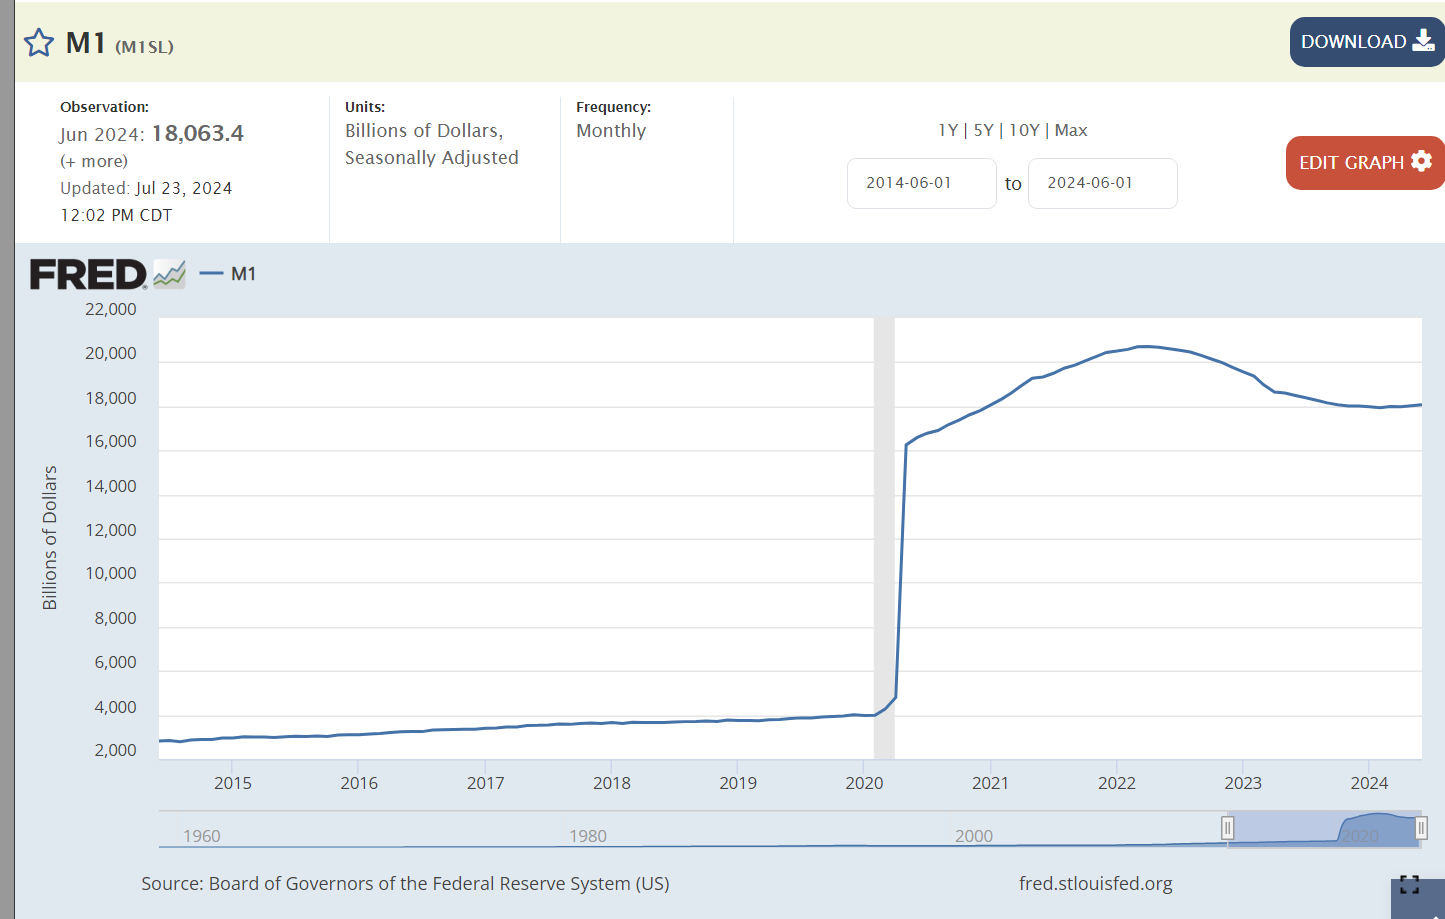
The independent Federal Reserve Board responded to the pandemic by greatly increasing the money supply to ensure that profitable, well-run financial institutions would be able to survive the temporary disruptions in the real economy. The Fed increased the money supply by 4-5 times its prior level to ensure the economy did not collapse! The extra money supply had to end up somewhere. It drove up consumer prices and increased asset values in the stock market and for home prices.
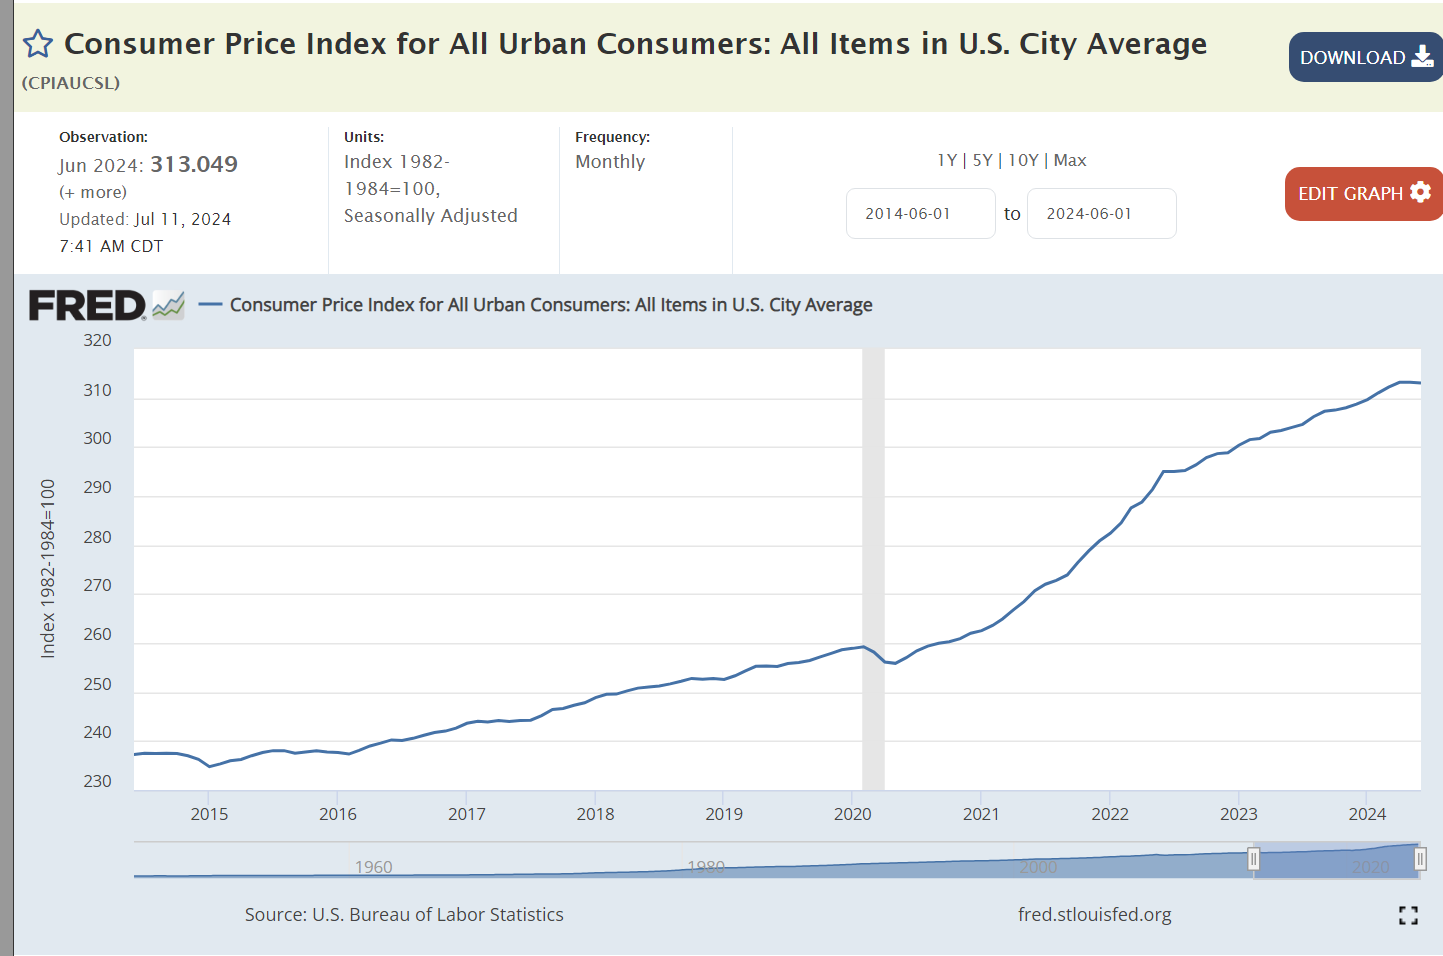
Inflation grew by 2% per year with Trump. It grew by 5% per year, on average, with Biden. Overall prices are 9% higher with Biden. Trump’s economic policies extended the Obama recovery for 3 years without triggering an increase in inflation, despite a low unemployment labor market.
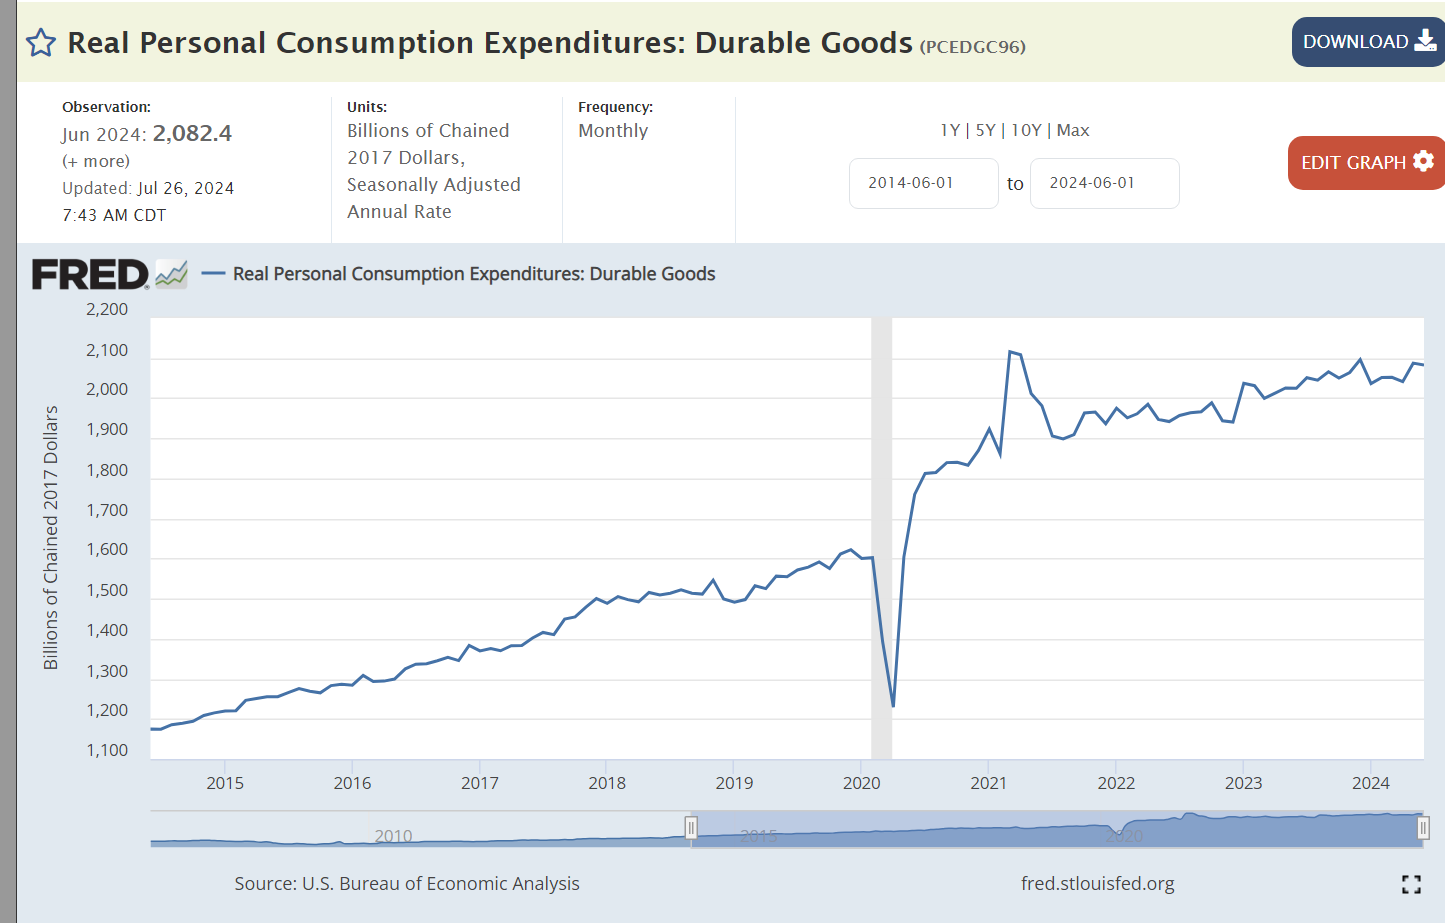
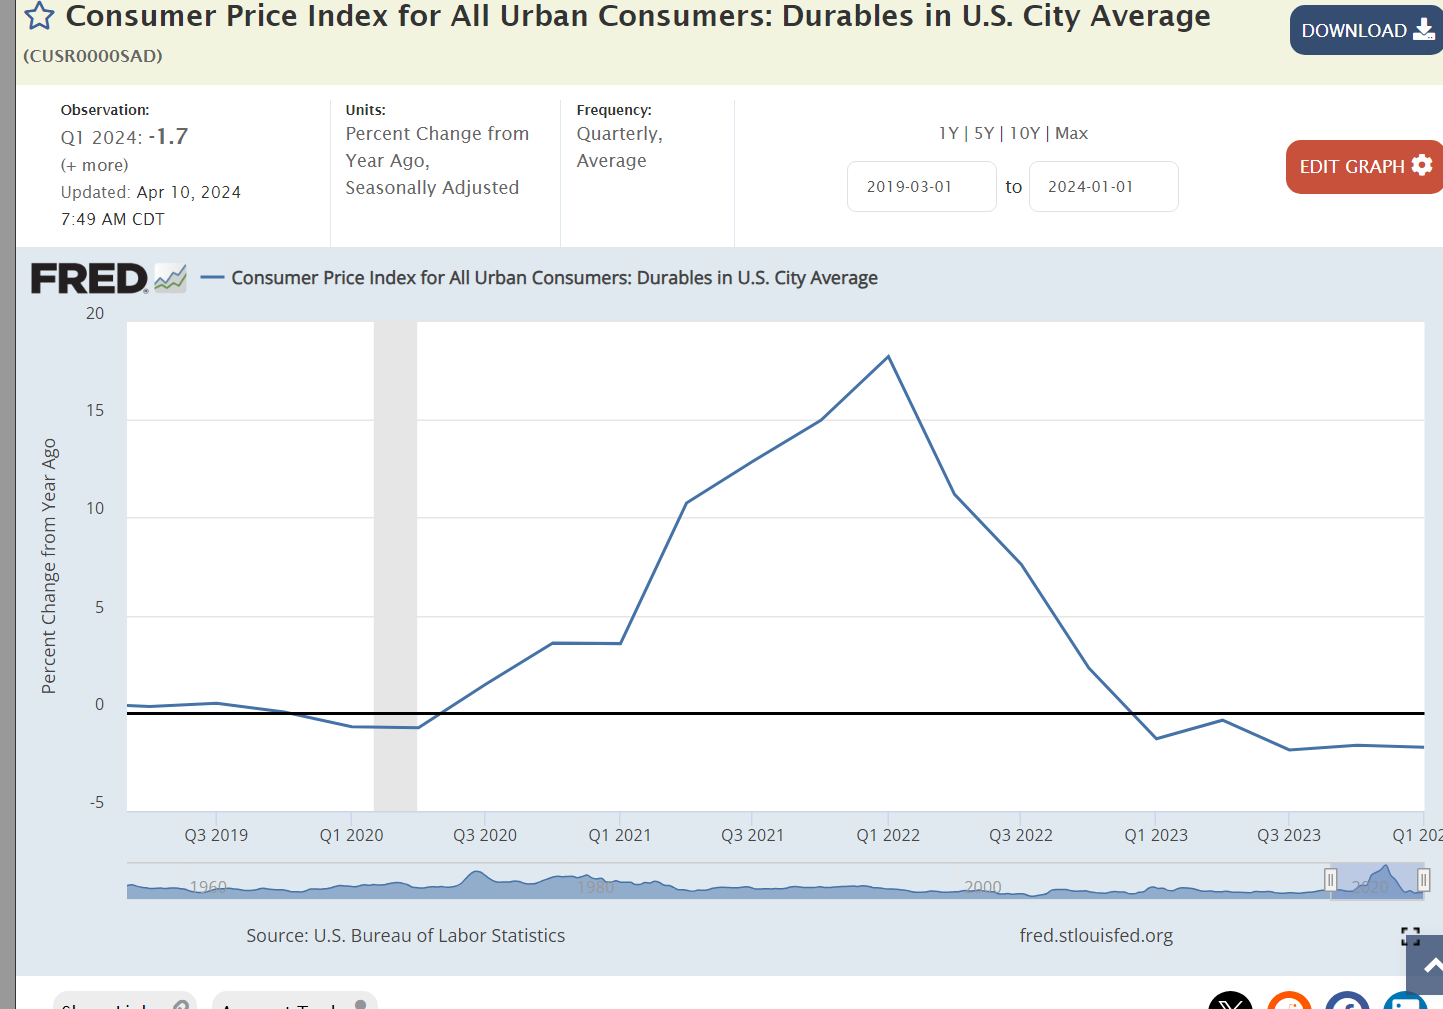
The largest cause of higher than usual inflation in Biden’s term was the 20% spike in US and global demand for durable goods. Factories shut down during the pandemic. Demand rebounded within 6 months as consumers chose to spend money on goods rather than in-person services. Consumer demand at the end of the Biden period is 50% higher than at the start of Trump’s term in office.
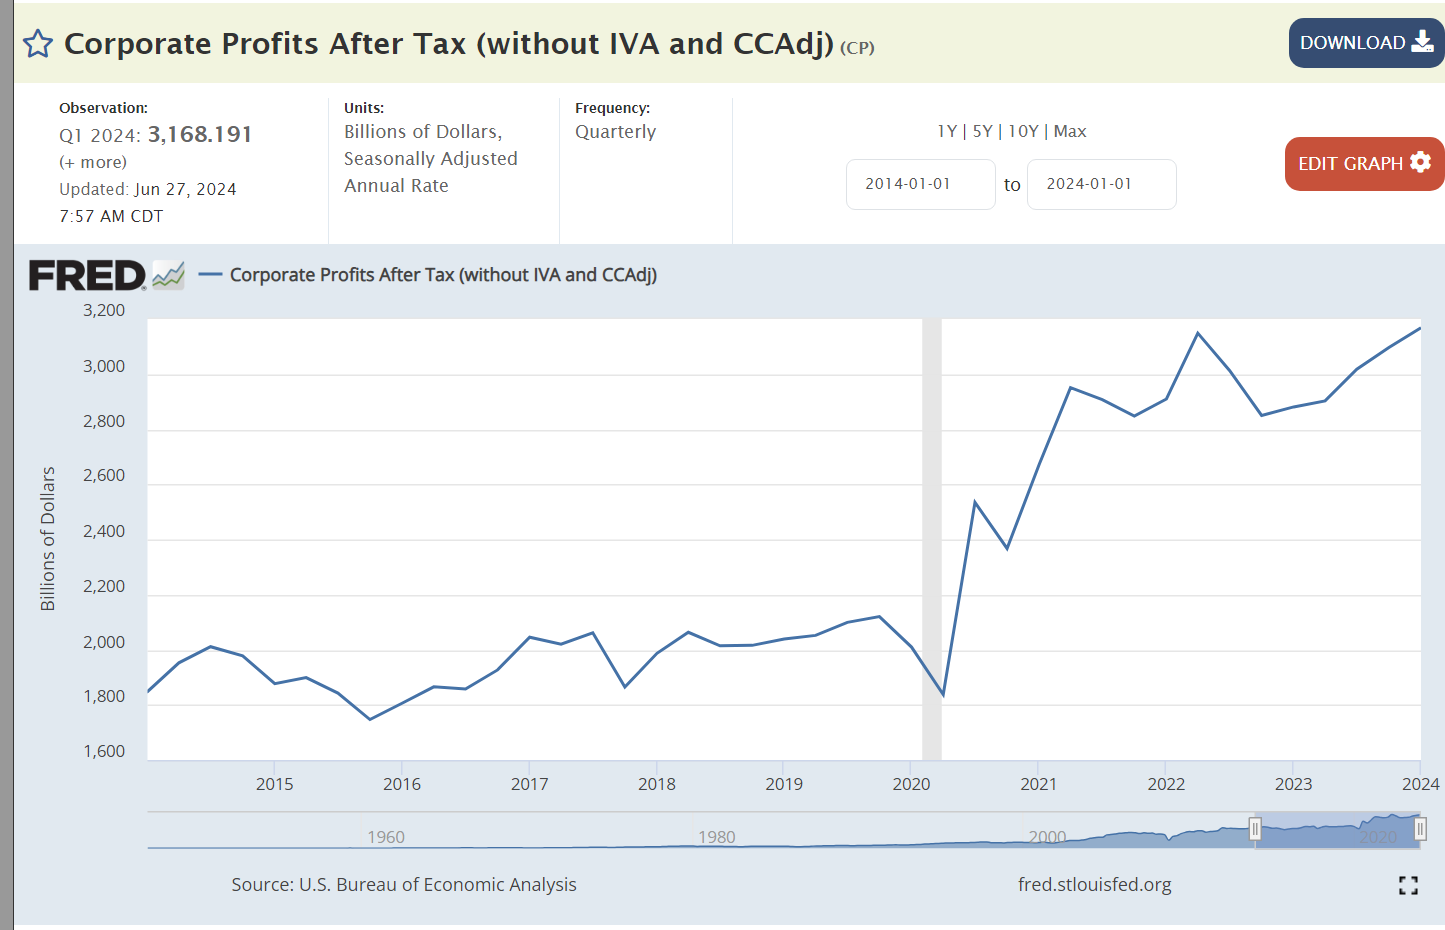
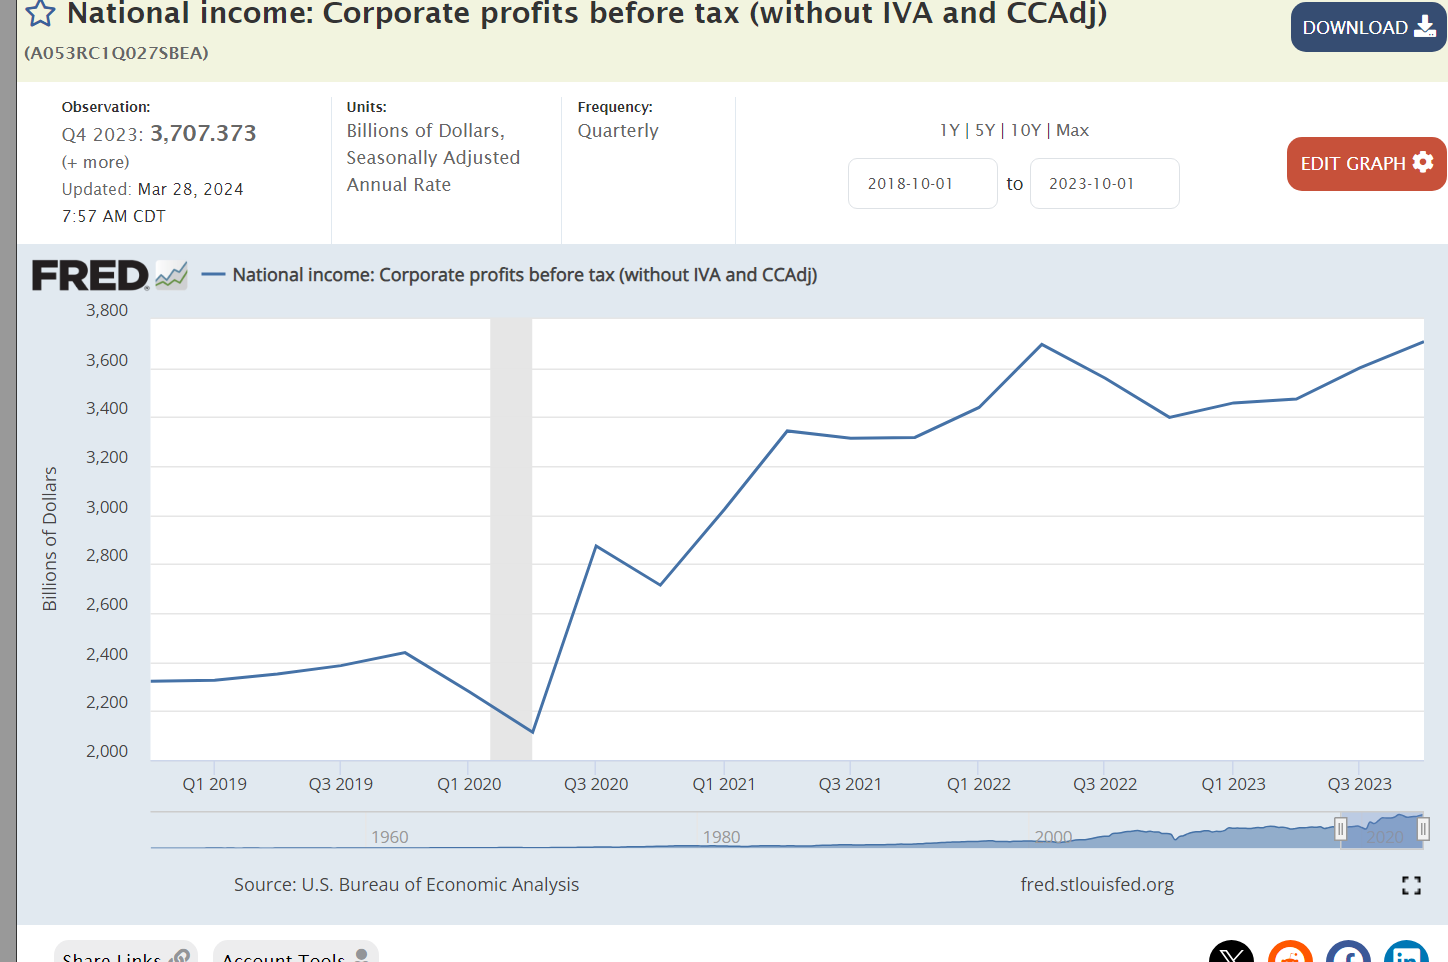
Corporations were able to capture and maintain a 50% profit increases due to market disruptions of the pandemic. Experts mostly reject Biden’s claims that corporate profits were the main driver of inflation, but they clearly aggravated the impact of the supply chain disruptions.
Obama was able to reduce federal budget deficits by two-thirds by the end of his presidency. Deficits doubled on Trump’s watch before the pandemic arrived. Biden cut deficits from their record highs during the pandemic, but they have been 50% higher than the pre-pandemic Trump era. Most economists consider the budget deficits to be the main cause of the continued higher than typical rates of inflation, accounting for 3%, 2% and 1% extra inflation in the 3-year Biden time we’re considering.
High profile gas prices remined flat during Trump’s period. Global supply and demand caused prices to increase from $2.50 per gallon to $3.50/gallon where they have remained for the last 3 years.
Trump enjoyed historically low 4% mortgage interest rates, a thin 2% above the inflation rate. The expansion of the money supply drive rates down to 3% during 2020 and 2021. They rose to 7% as inflation rose sharply and has stayed there. Inflation has fallen but markets typically require years of data to reset expectations of long-term inflation which drive mortgage rates. The Federal Reserve Bank has hesitated to cut its benchmark interest rates until inflation is clearly approaching its 2% target.
Labor Market: Advantage Biden
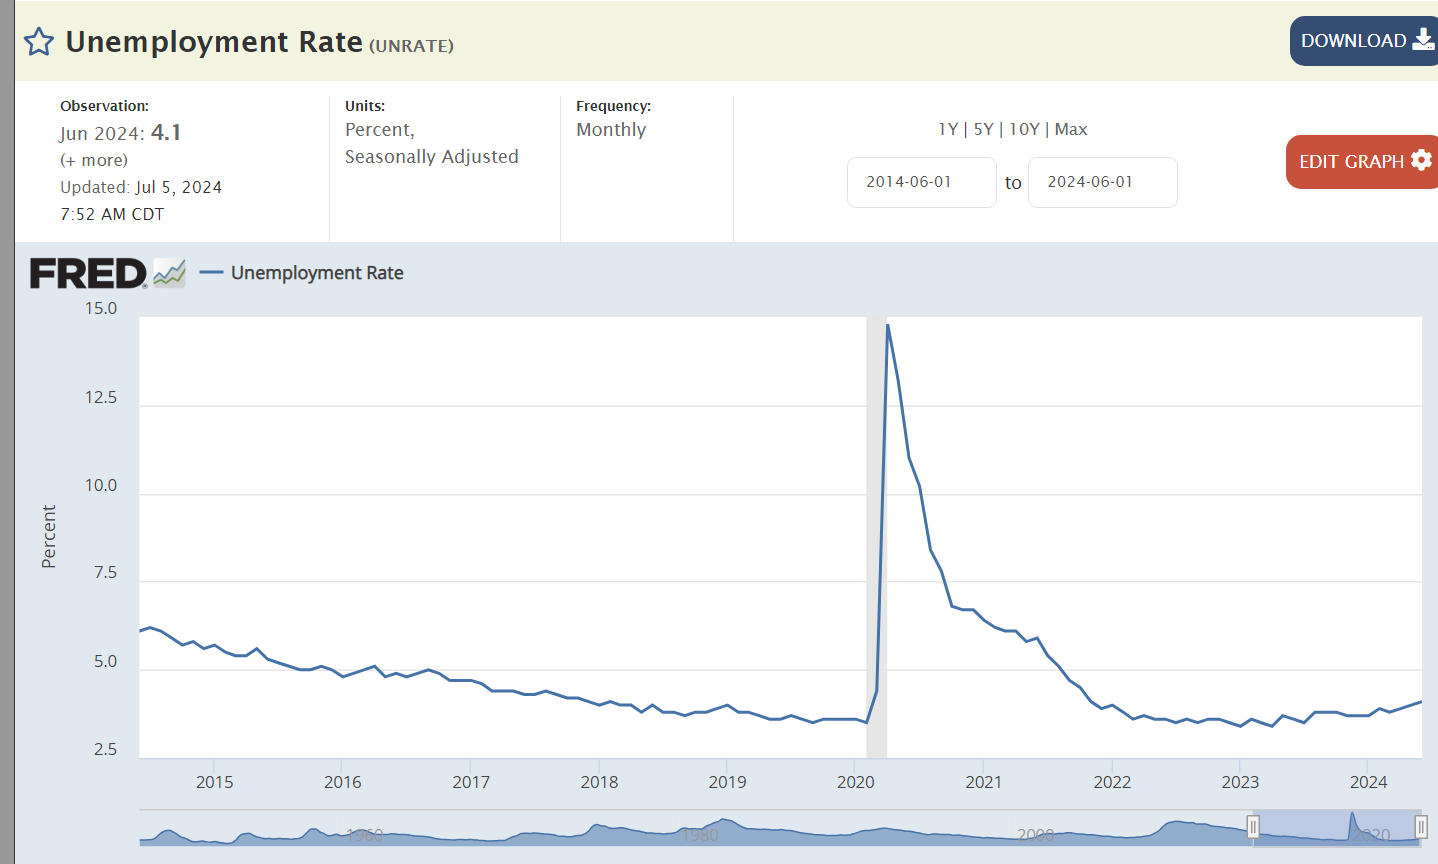
Trump reduced unemployment by 1%. Biden reduced it by 2%. Both presided over best in 50 years overall labor markets.
Layoffs have remained at historic lows, with Biden enjoying slightly lower rates.
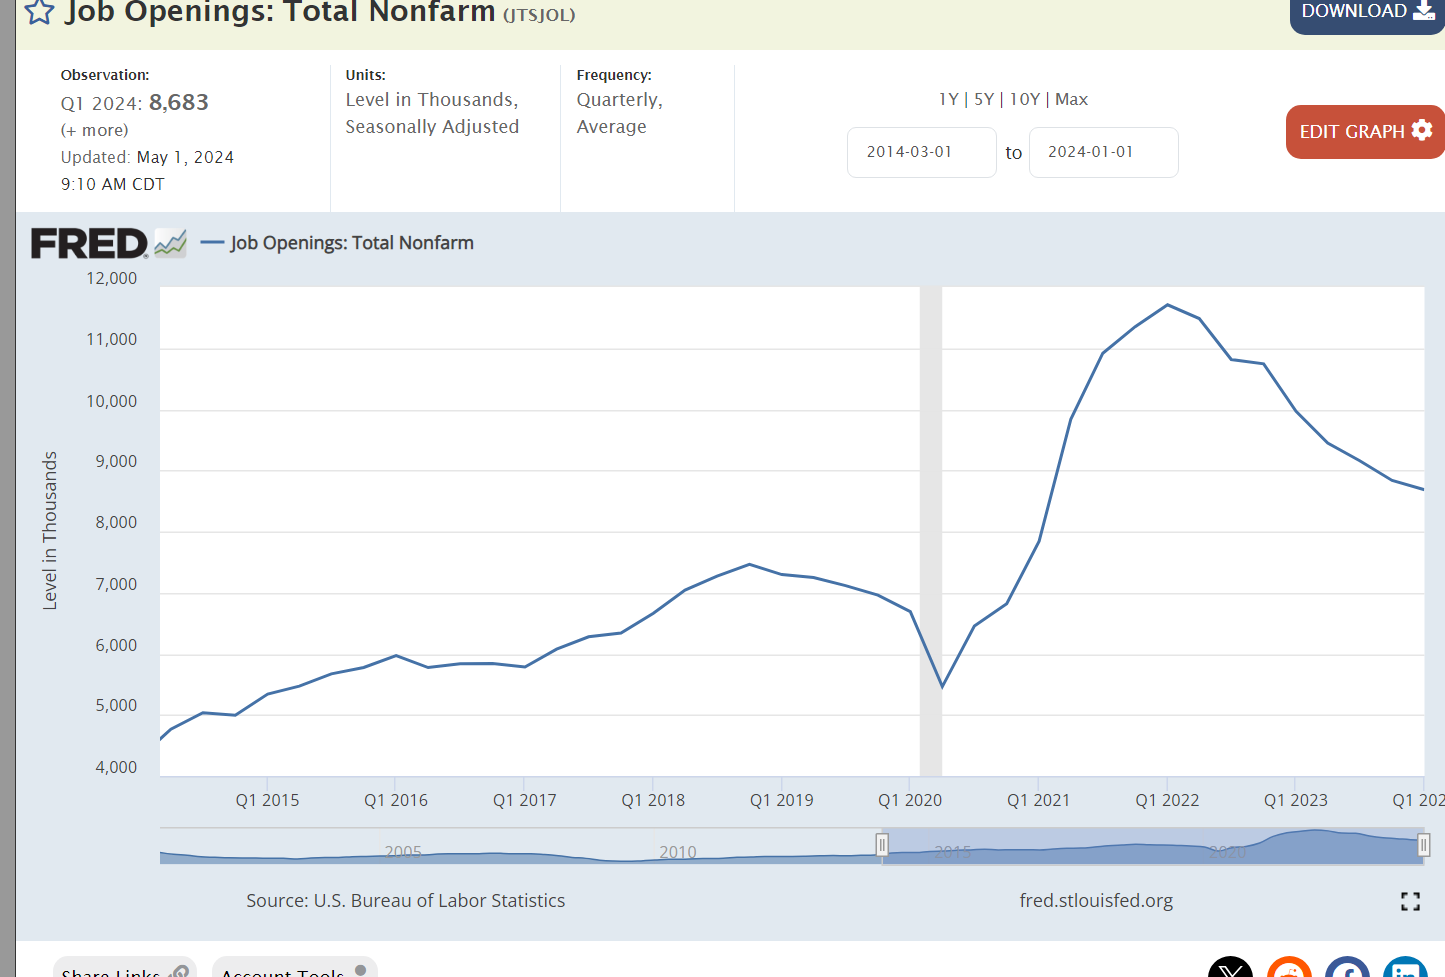
Job openings in the Biden market have been 50% higher than the Trump market, reflecting a strong economy with growing labor demand, despite the impact of the pandemic.
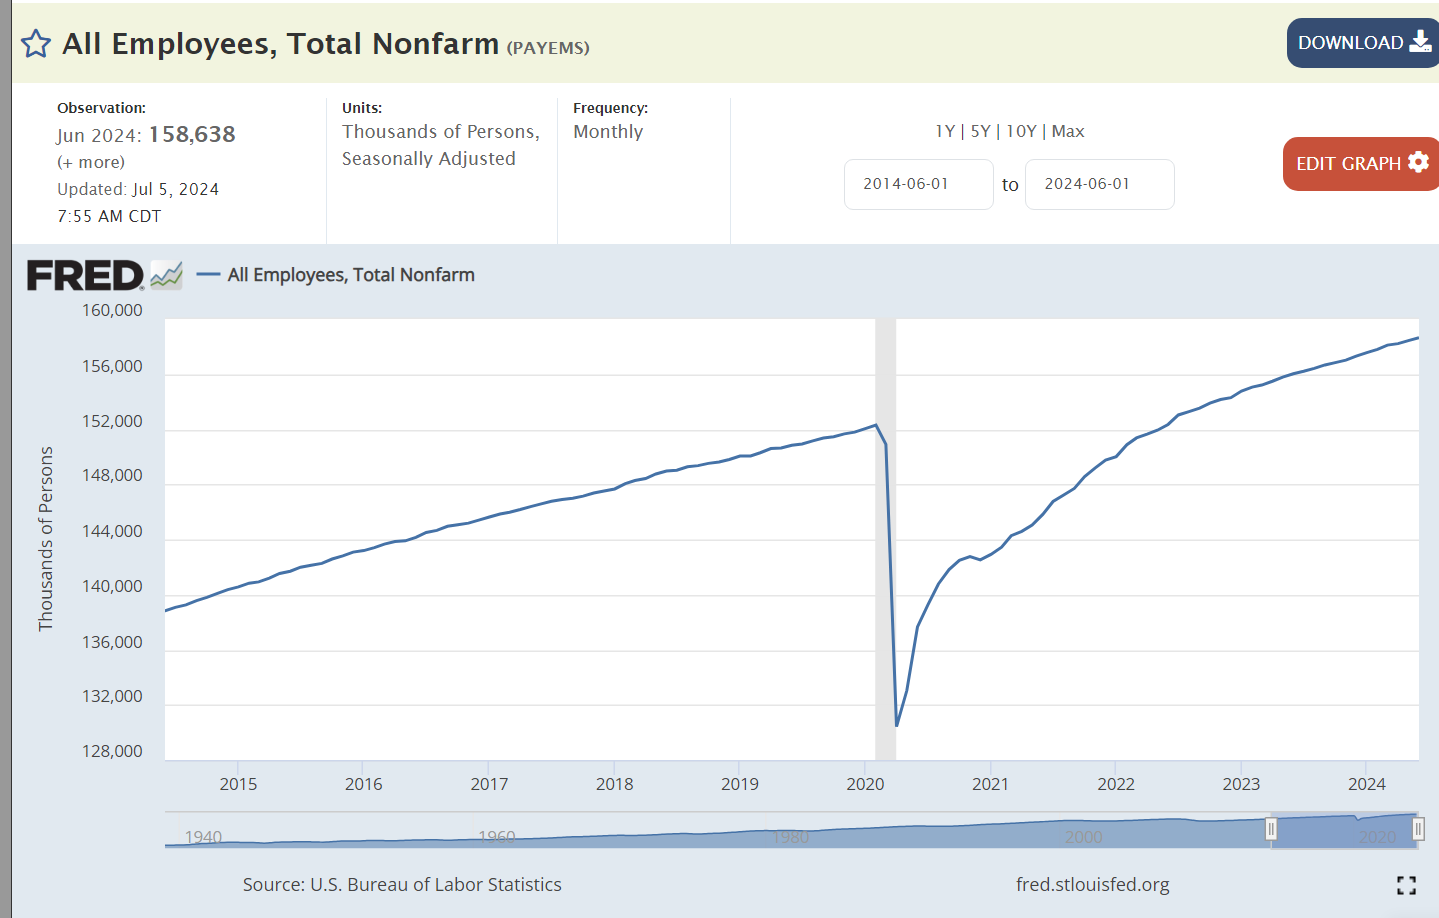
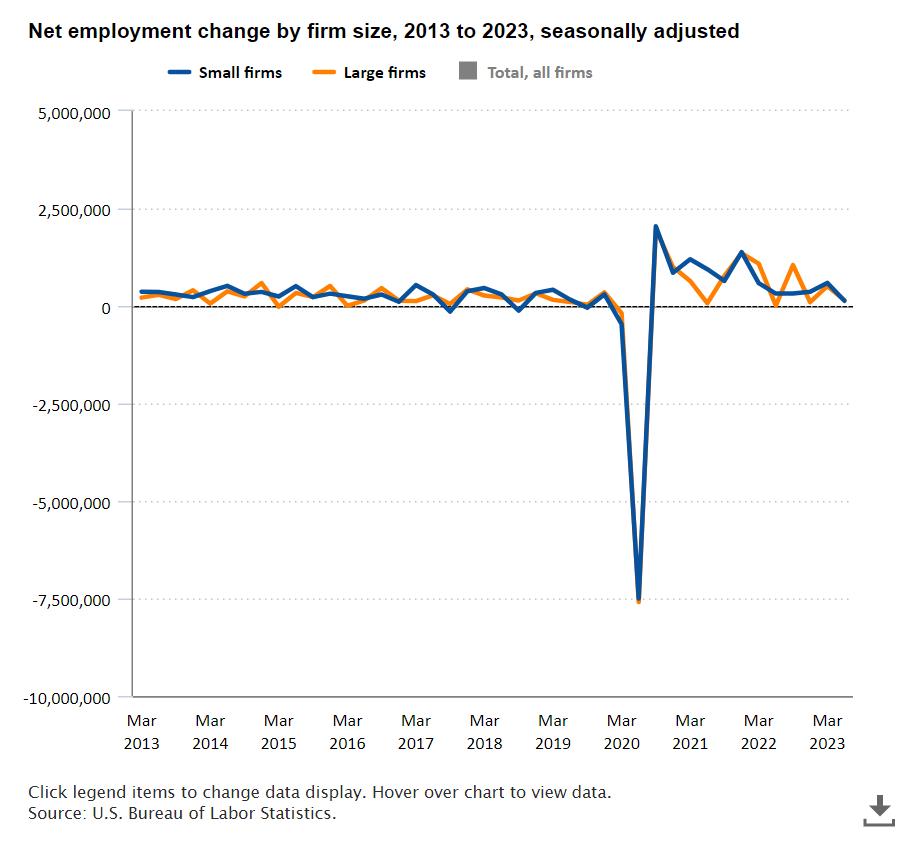
The Biden economy recovered all 20 million jobs lost in the pandemic within 2 years, much faster than expected. Total employment has continued to grow at the trend rate to a record 159 million.
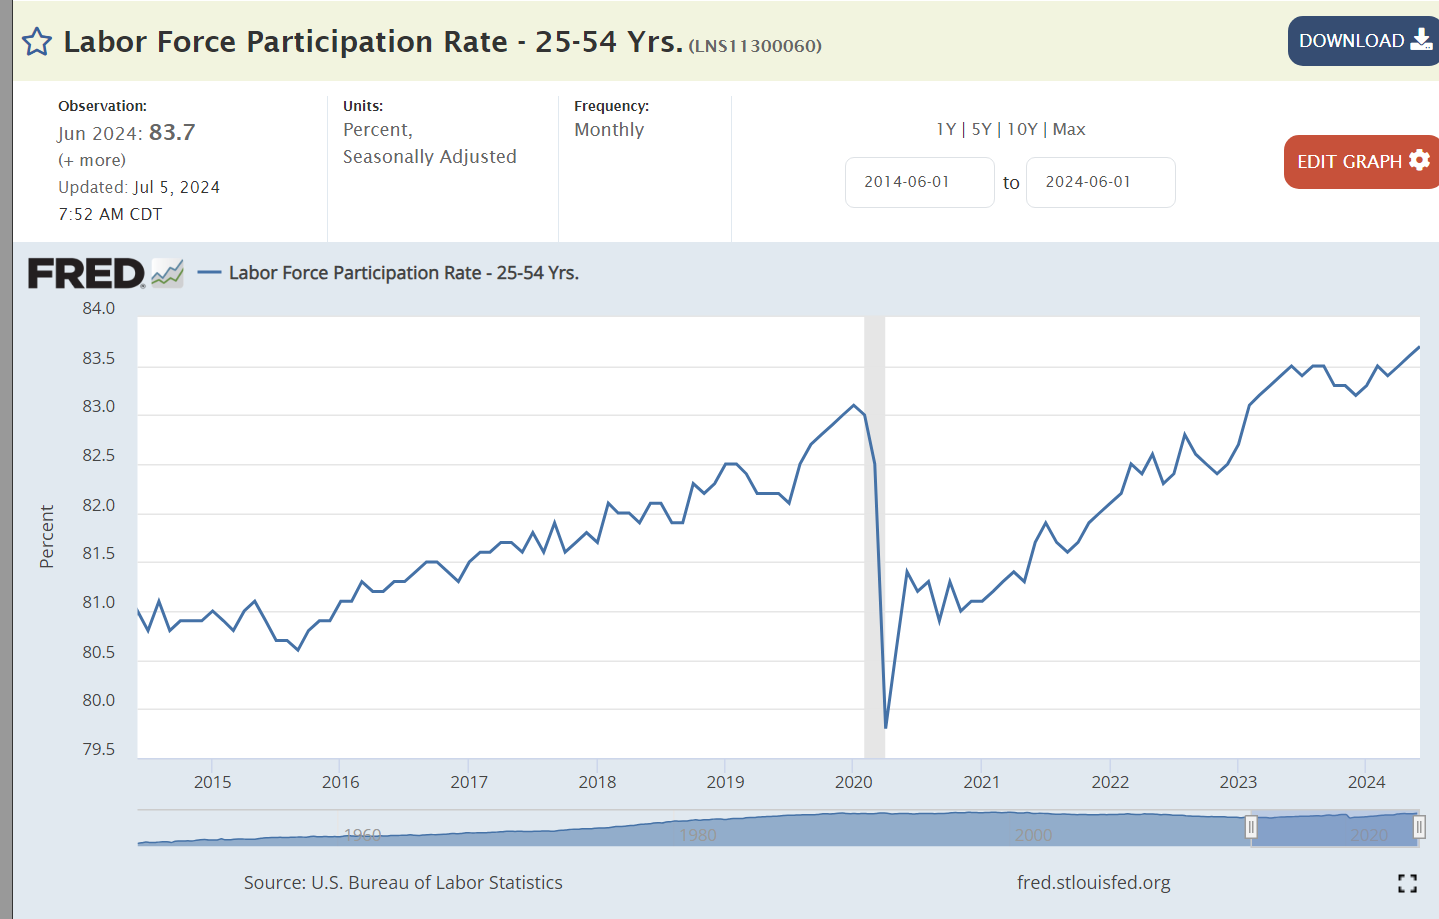
Core labor force participation is 1% higher with Biden than Trump. The current participation rate was last achieved in 2001.
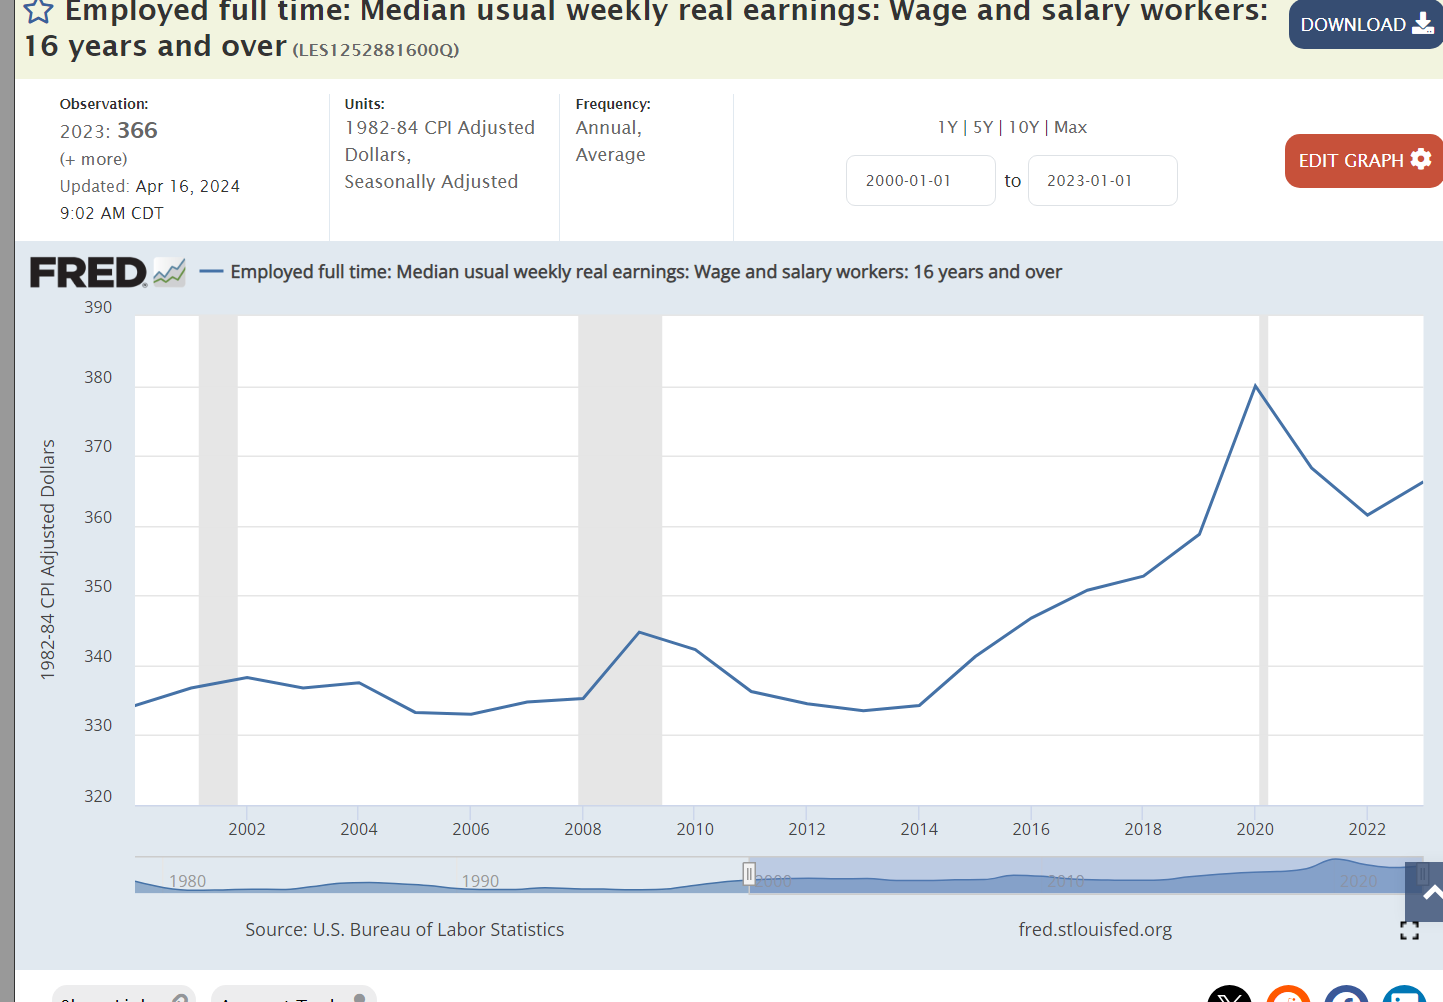
Median real wages have been slightly higher during Biden’s tenure.
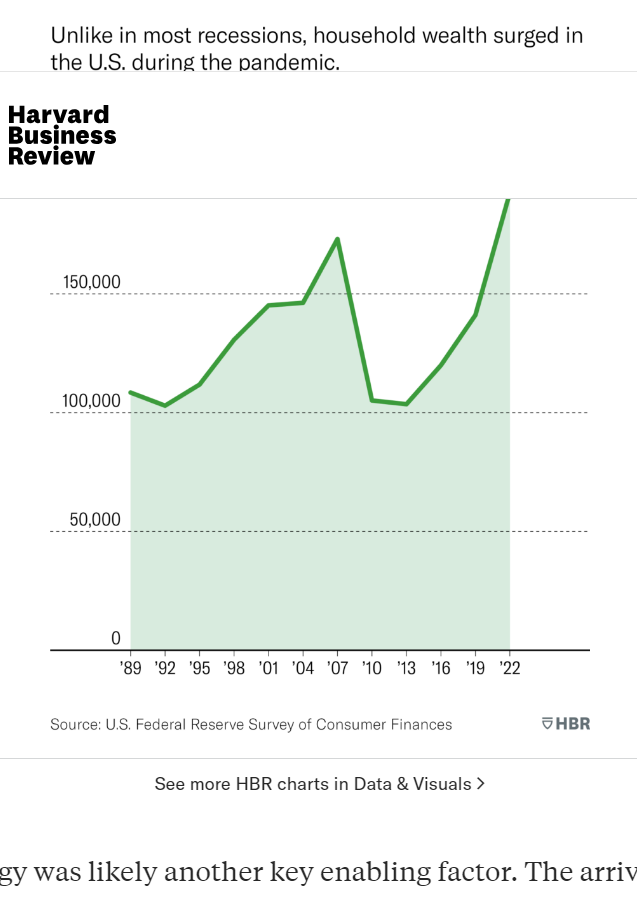
Asset Values: Advantage Biden
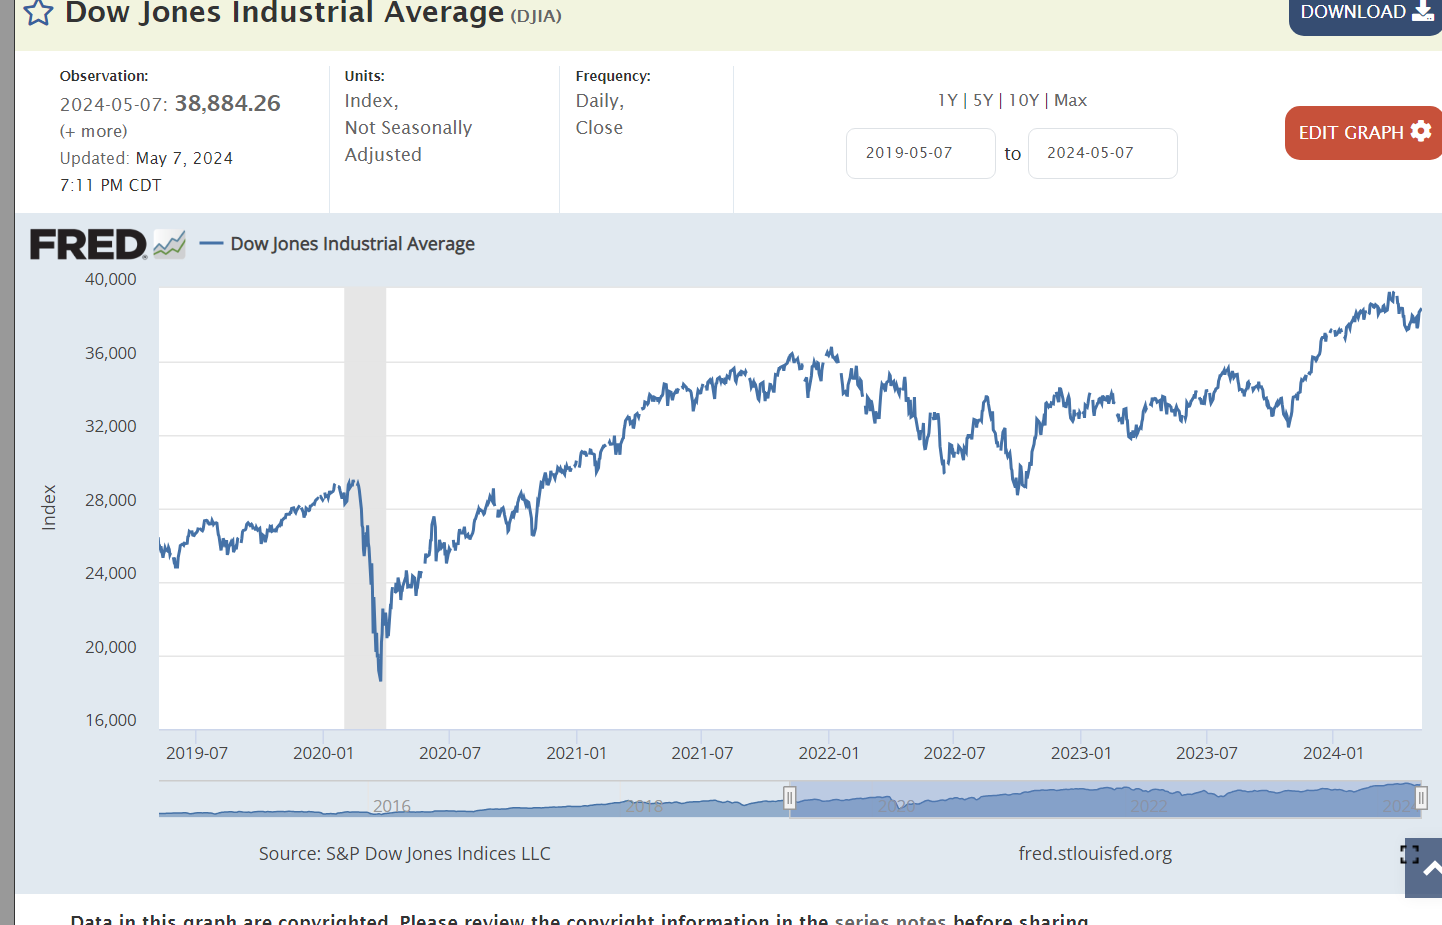
Despite the pandemic disruptions and losses, US firms are worth 70% more today than before the pandemic. This reflects the 50% profits increase and continued positive future prospects.
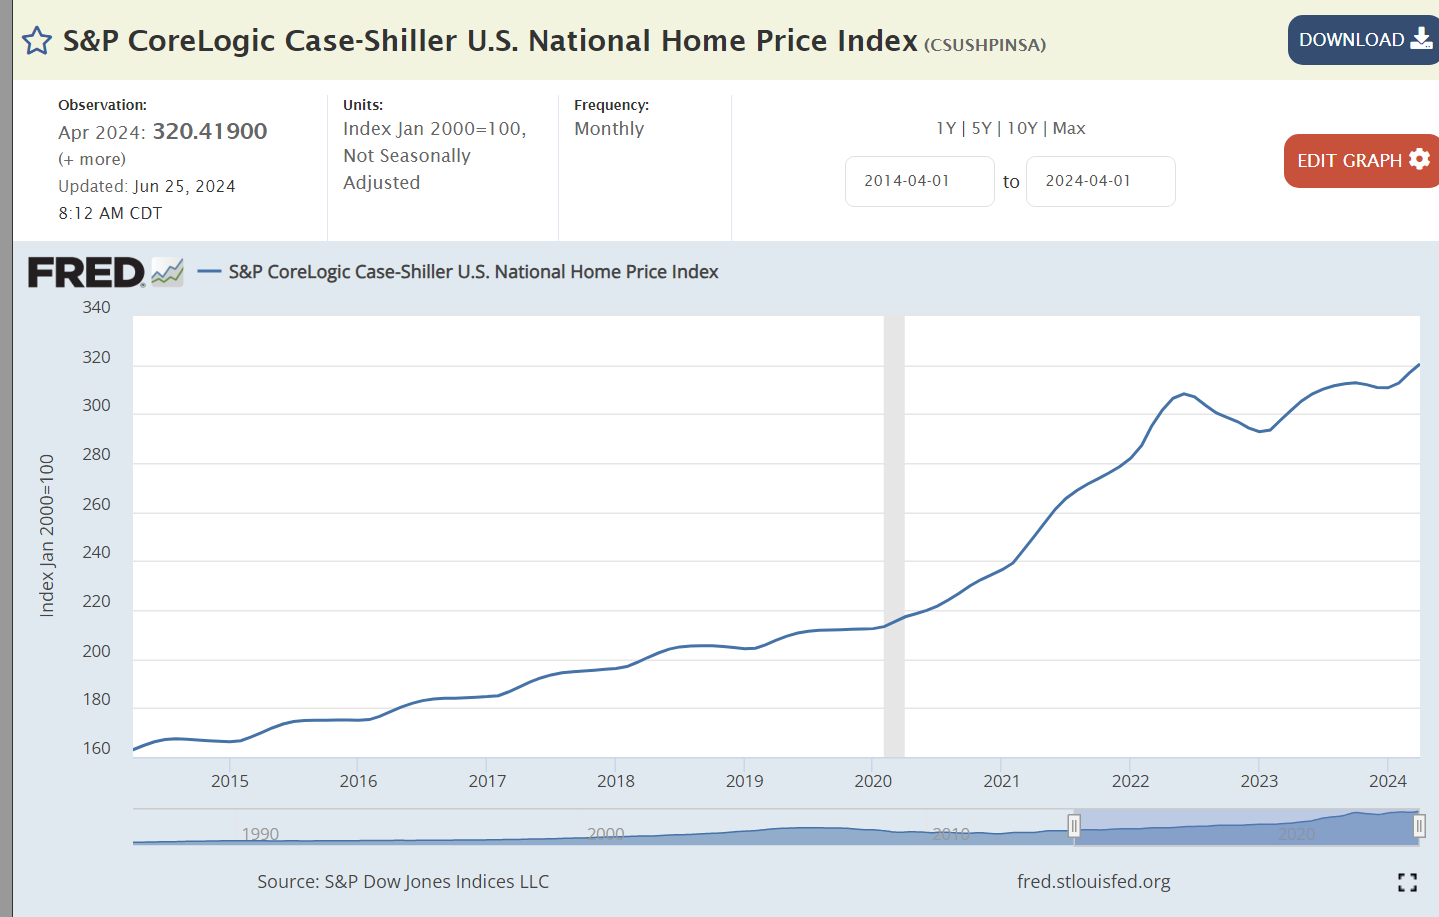
Home prices have nearly doubled since before the pandemic, reflecting the post Great Recession decline in home building, construction issues during the pandemic and general asset inflation caused by the rapid expansion of the money supply.
The US enjoyed a solid 7% savings rate before the pandemic, an extraordinary high 10% after the pandemic, falling to just 4% for the last 3 years.
Human assets increased during Trump’s presidency and resumed growth after the pandemic. As college graduation rates have increased throughout the post WWII years, the cumulative number of college educated individuals continues to rise each year. The growth in masters and professional degrees is noteworthy.
The Economy – Advantage Biden
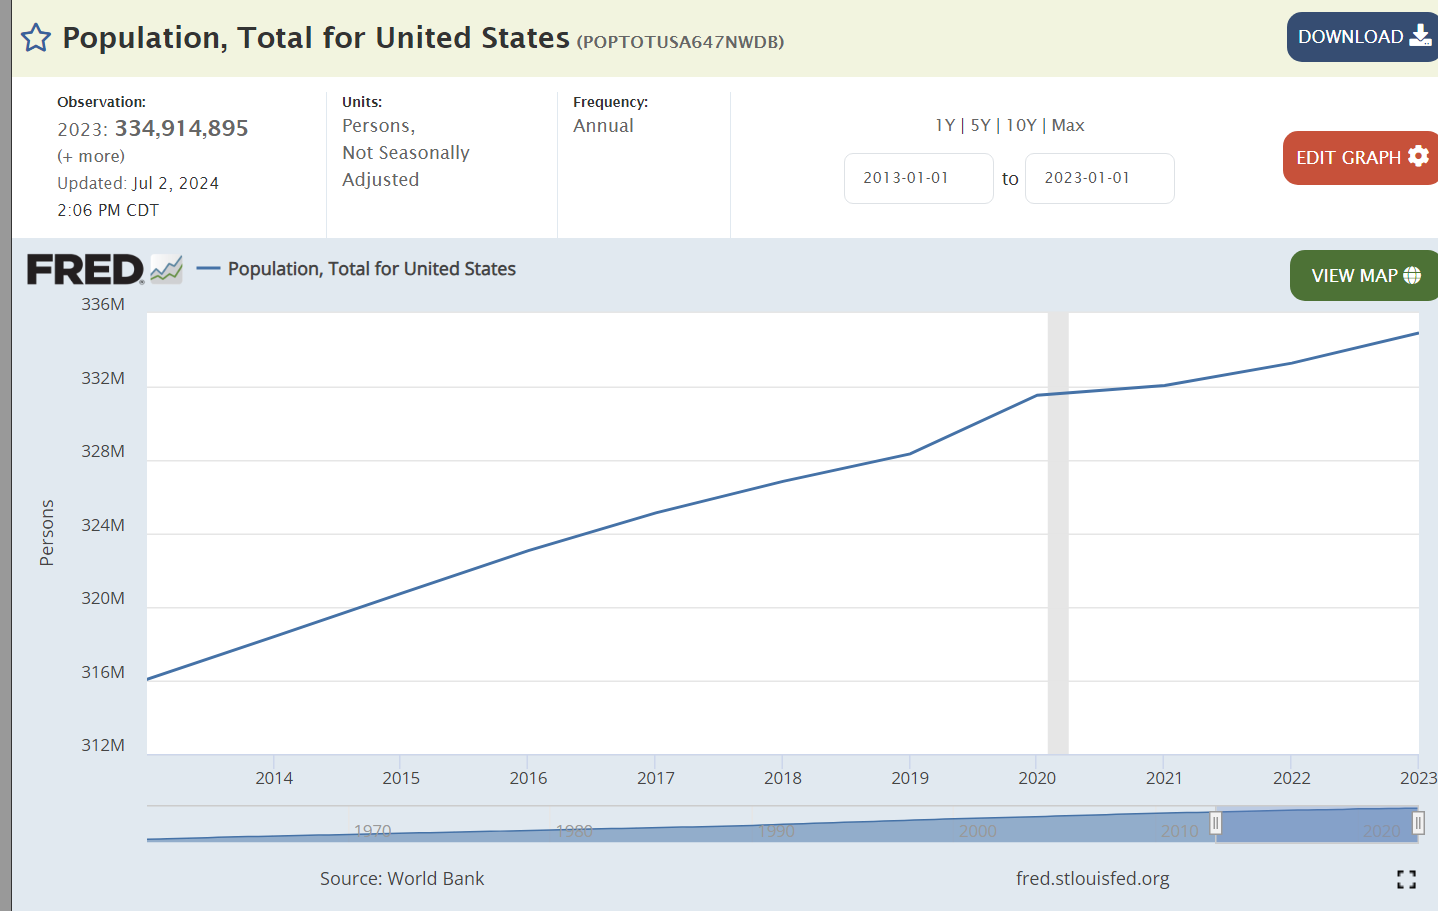
Population growth has resumed after the pandemic.
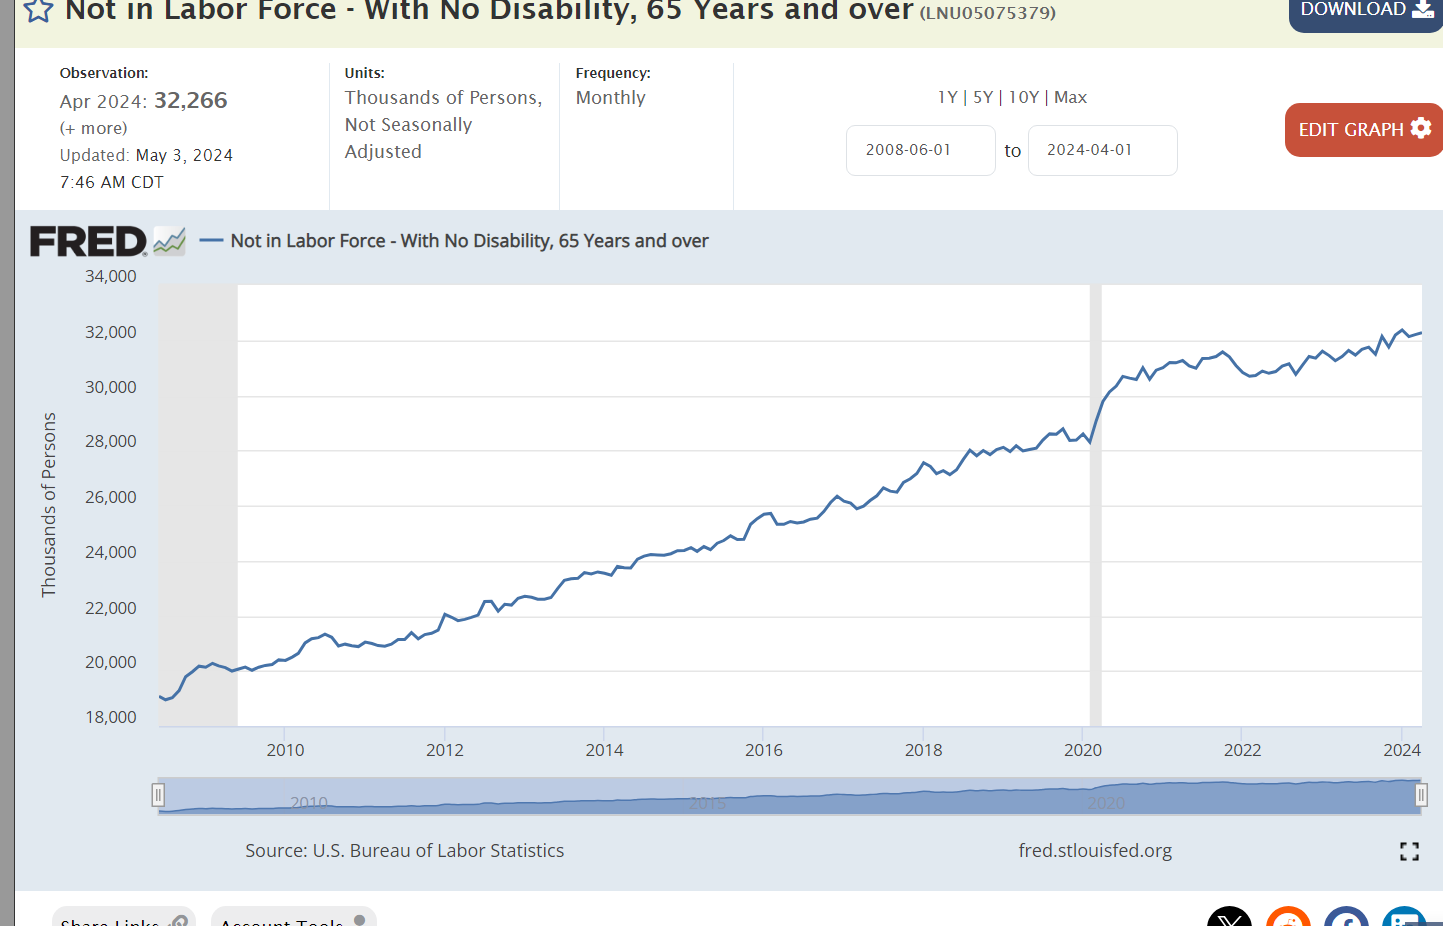
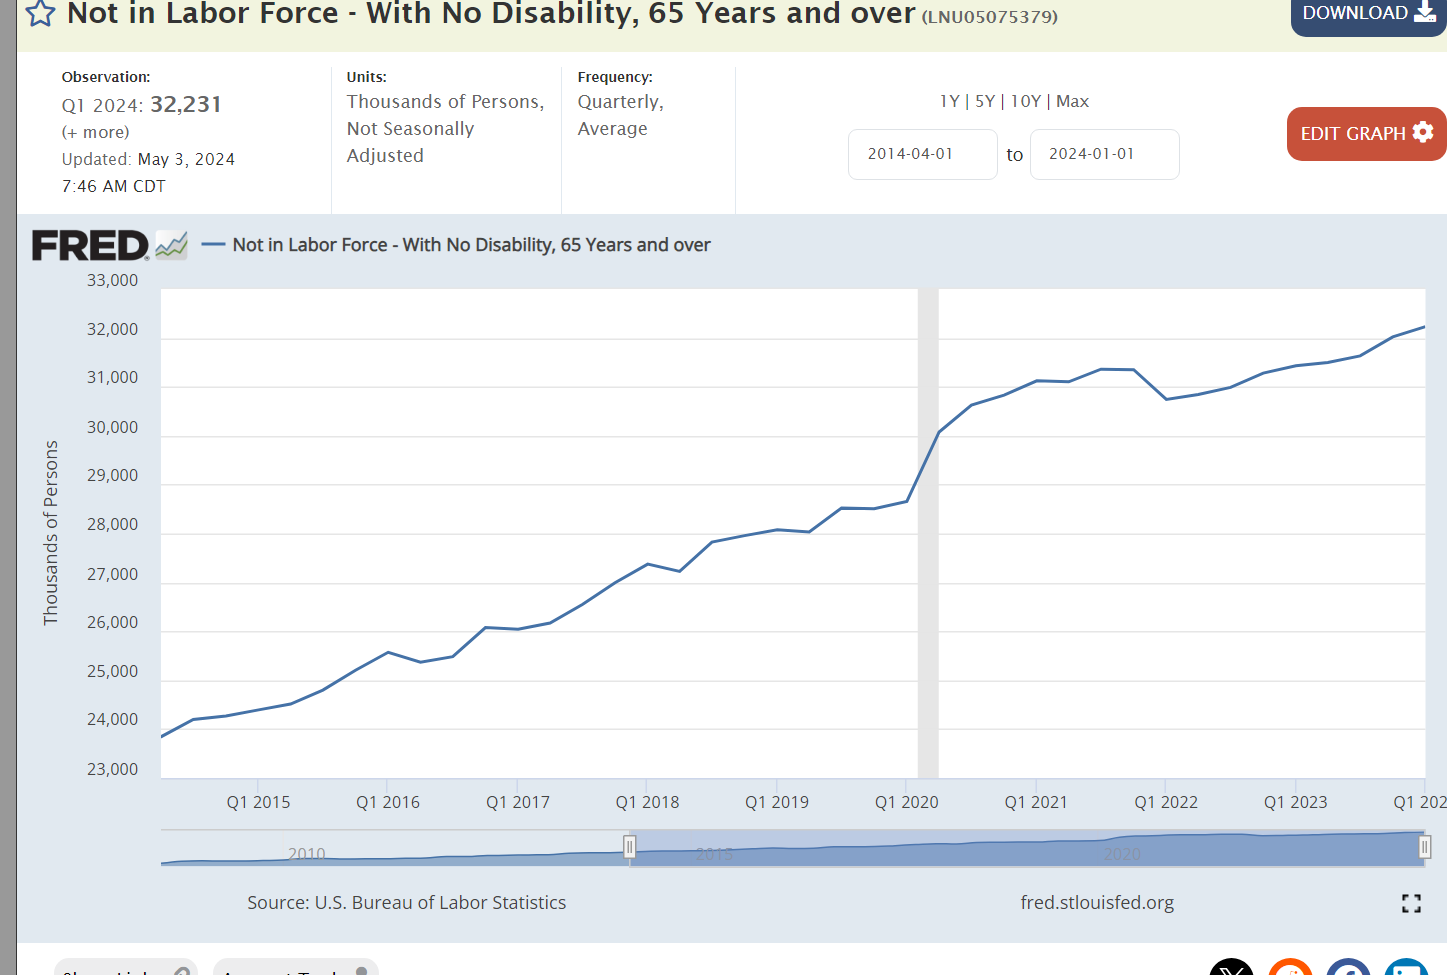
The healthy US economy is able to support 3 million more retirees after the pandemic.
Real dollar GDP is 2 trillion dollars larger than before the pandemic disruption. That increase is the same size as the total GDP of Russia, Canada or Mexico. We added the Canada economy during Trump’s time and the Mexican economy during Biden’s time.
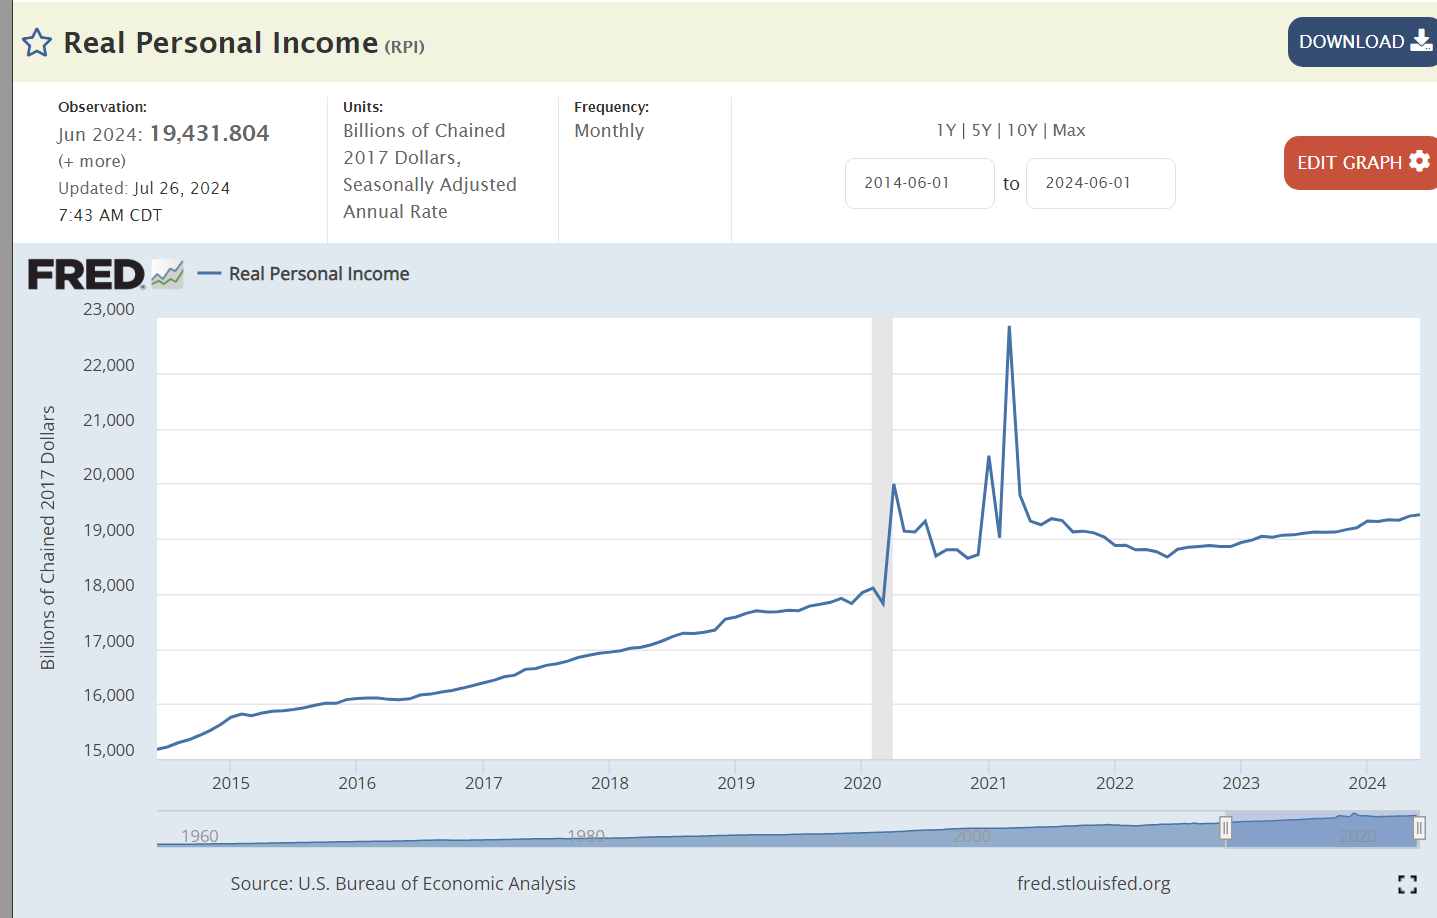
Real personal income grew a little bit faster during Trump’s time and more smoothly. Personal incomes jumped up during the pandemic but have been flat since that time with corporations capturing a greater share of the economy’s returns.
Workers have been 8-10% more productive in the Biden economy.
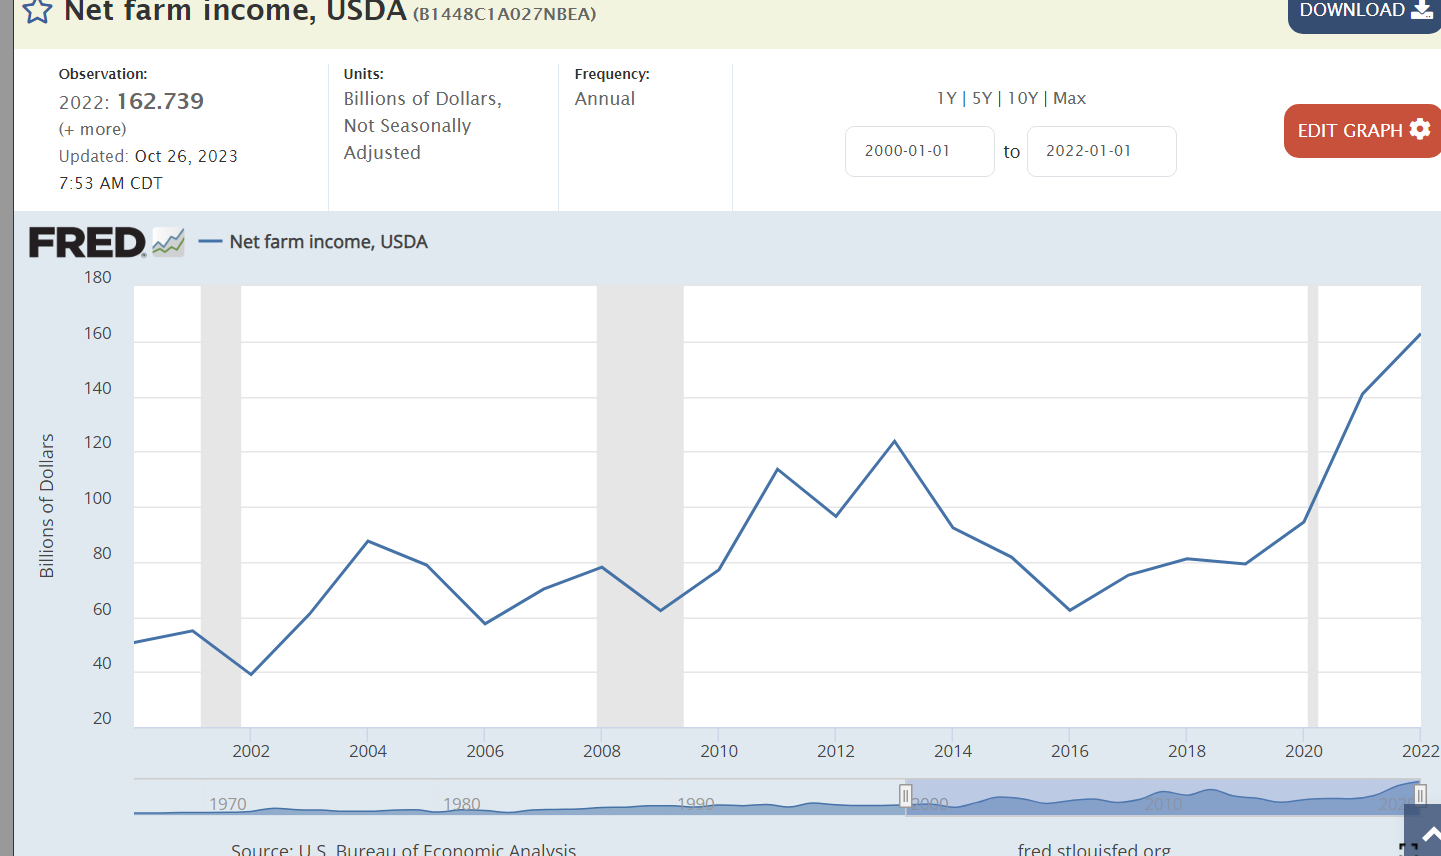
Farm income has doubled in the Biden economy.
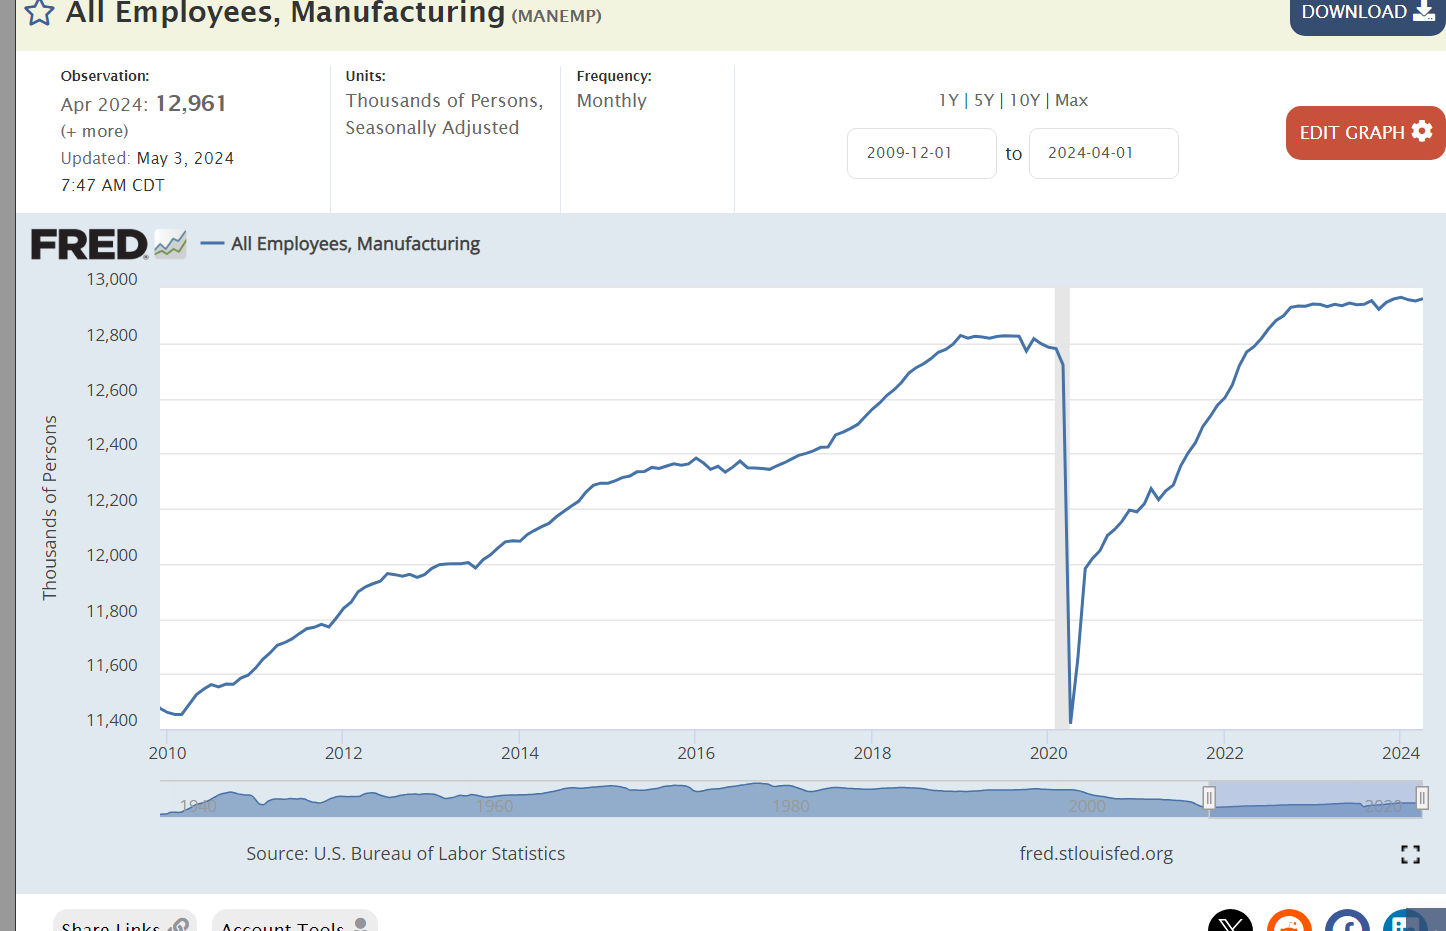
Manufacturing employment grew by a surprising 3% in Trump’s term. It is slightly higher in the Biden era.
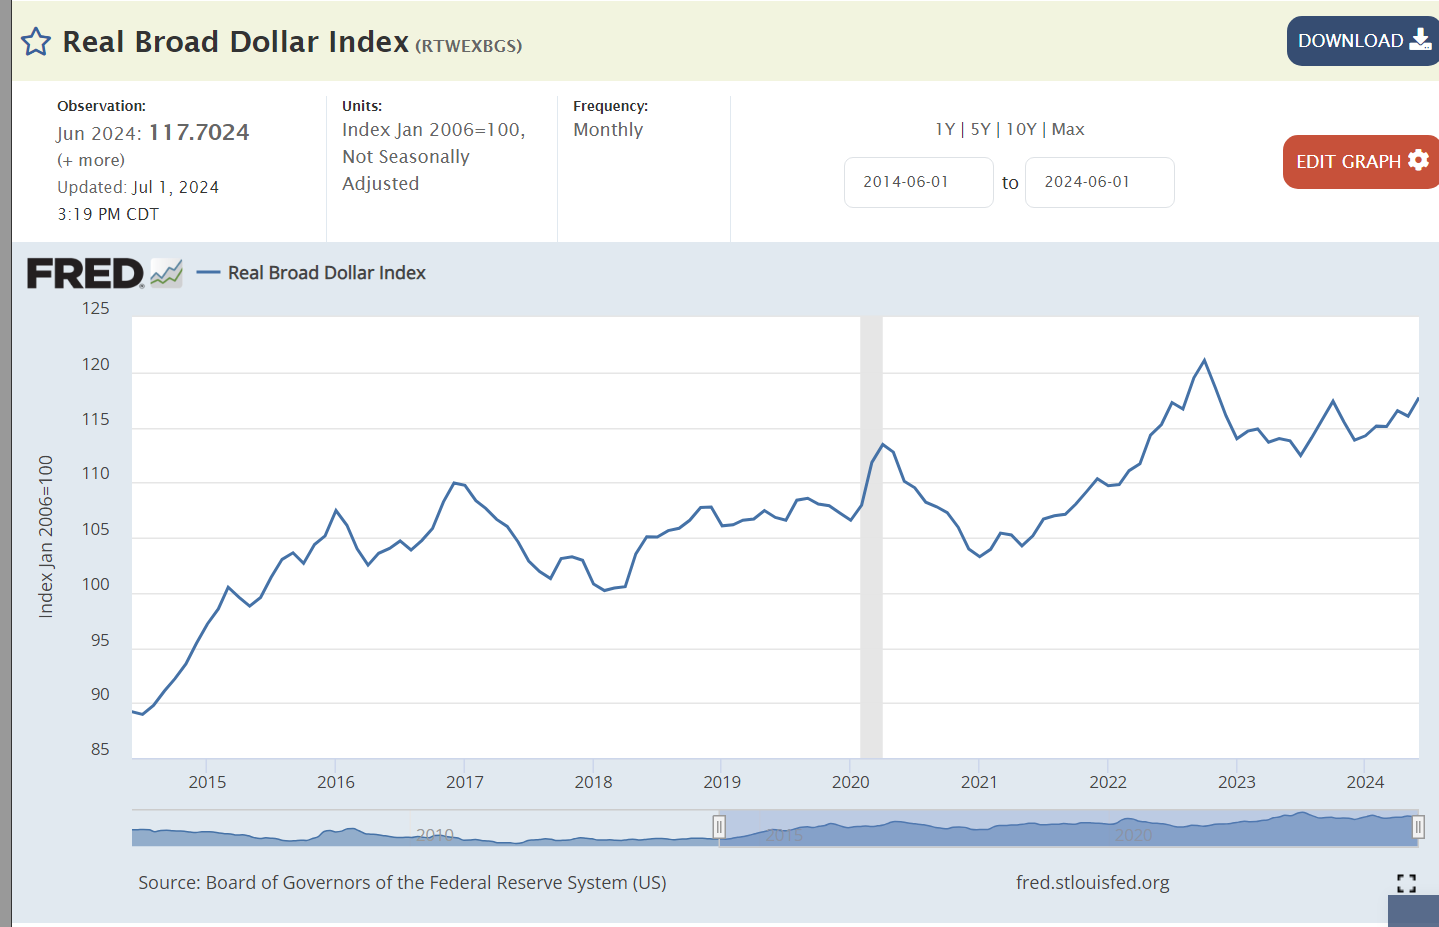
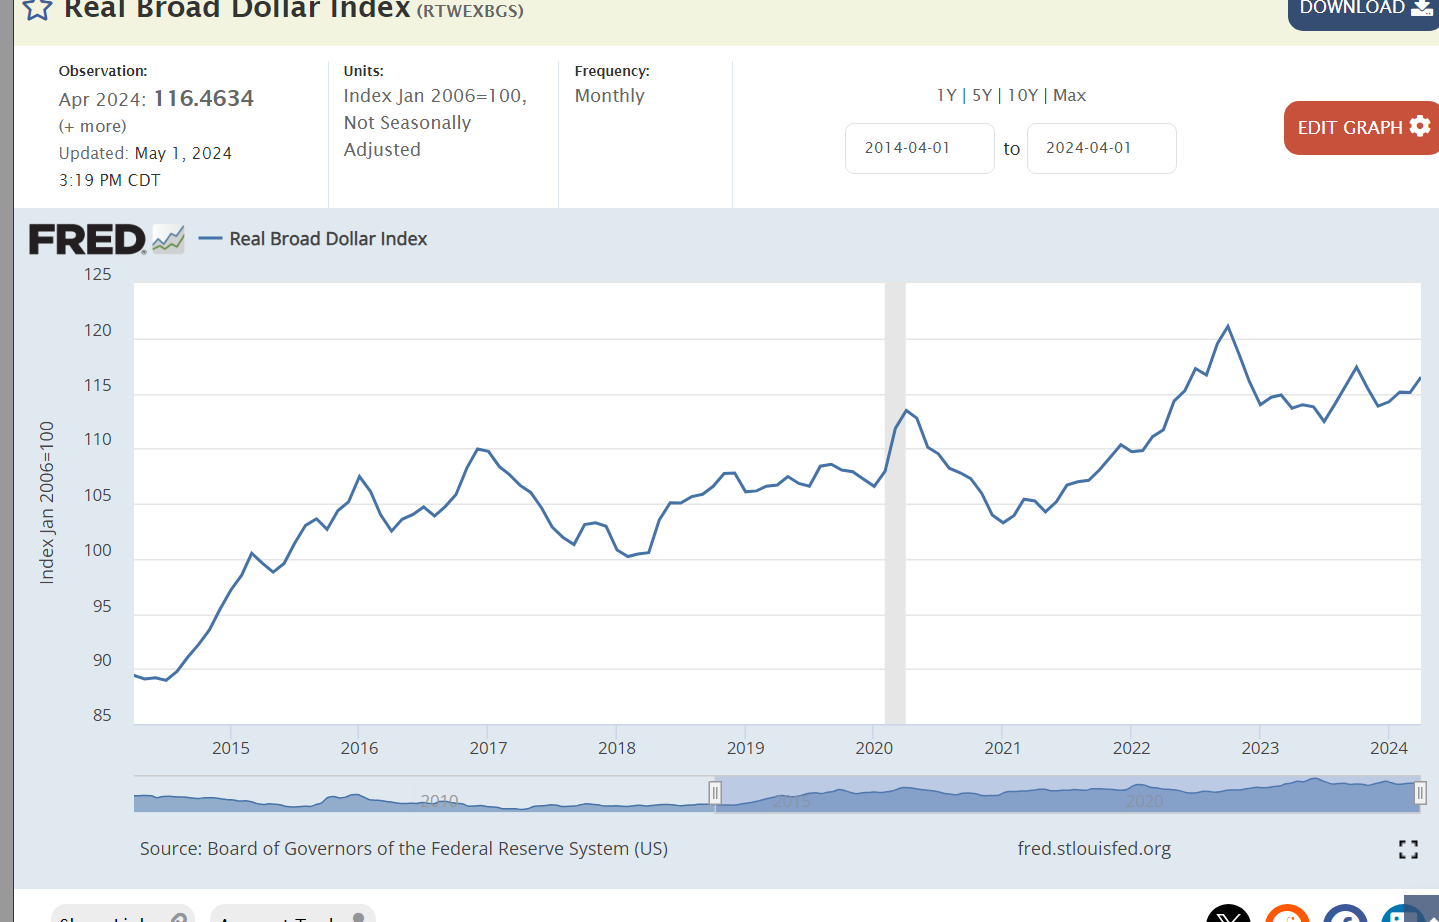
Real dollar exports increased during the Trump presidency and then again during Biden’s time despite a greatly stronger US dollar which hampers exports.
The world is willing to pay 10% more to hold US dollars in the Biden period, reflecting strong economic realities and prospects despite the risks of higher US inflation and budget deficits.
Summary
The US economy is very strong. Trump was able to extend the Obama recovery for longer than most expected, keeping inflation, interest rates and unemployment at low levels. Biden managed the recovery from the pandemic induced recession better than expected. The economy, asset prices and labor market have recovered very nicely. Inflation has remained the weak part of the Biden economy. It is lower than in comparable global economies and trending towards the 2% target in 2025. Critics point to excess government spending as an avoidable source of high inflation.
The Trump economy built upon the success of his predecessor. The Biden economy overcame the disruption of the pandemic to produce equal or greater results. Both presidents delivered solid results.
Inflation is dropping nicely but won’t reach 2% this year. Technical issues in calculation of housing costs which drives inflation a year later than reality. Government spending / budget deficit in a full-employment economy pushes inflation. Physical goods prices are declining. Services prices are stickier, with a smaller wage-price spiral effect. Global economy is weaker than the US, which is helping. Independent Federal Reserve is holding interest rates high longer than required, making up for its prior slow increase in interest rates.
Fiscal and monetary policy matter. Other industry level policies can greatly reduce inflation. The president and congress have not responded to my early 2022 advice!
November, 2022. Inflation fears are high. The data is positive, but mixed and not enduring enough to be confident that inflation is falling, not accelerating.
Corporations took advantage of supply chain disruptions and shortages to increase prices quite dramatically. Prices had been smooth for a decade. Firms increased them quickly. Prices have NOT continued to increase. They have dropped a bit, especially for goods.
I encourage us to always “look at the big picture”: across time, nations, industries, occupations, institutions and political views when considering the “state of the economy”.
Recent surveys indicate that many (partisan) Americans believe that the economy is in recession, the stock market is down, and unemployment is up (false). The US economy continues to lead the world out of the pandemic driven recession. I’ve documented the tremendous strength of the US economy in GDP growth, job creation, wage growth, profit growth and wealth creation. Today I’d like to focus on entrepreneurship and new firm creation, where the US once again leads the world.
The US economy led the world in creativity, technology, job growth and firm creation in the 1990’s as it recovered from the global economic challenges of the late post-war era. The deregulation and technology driven changes produced benefits into the “oughts”, the first decade of the new century. Unfortunately, the dynamic pace of new firm creation based on economic, trade, relocation and technological changes did not strongly continue in the first 20 years of 21st century. New firm creation lagged. Larger firms held onto jobs as they consolidated industries and protected their positions. Venture capital firms facilitated the most successful new companies to quickly expand market share and vanquish weaker competitors. Many Schumpeter disciples worried that the engines of “creative destruction” had lost their momentum and effectiveness.
The Great Recession of 2007-10 destroyed wealth, slowed economic growth, job creation and new firm starts. The Obama-Trump expansion was longer than expected by historical standards, but slower growing. Many critics and commentators concluded that the US had “lost its entrepreneurial spirit”.
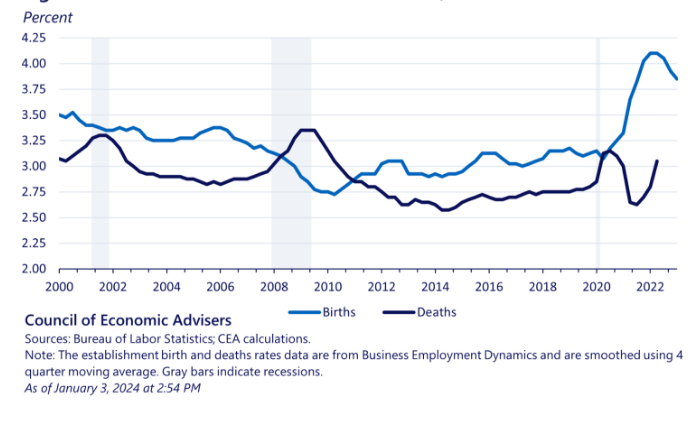
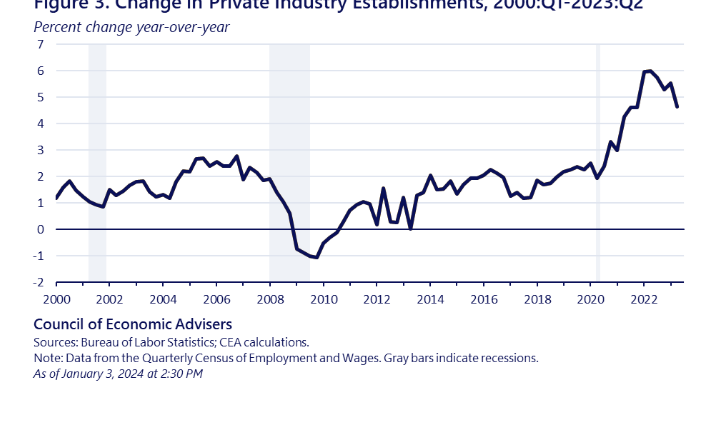
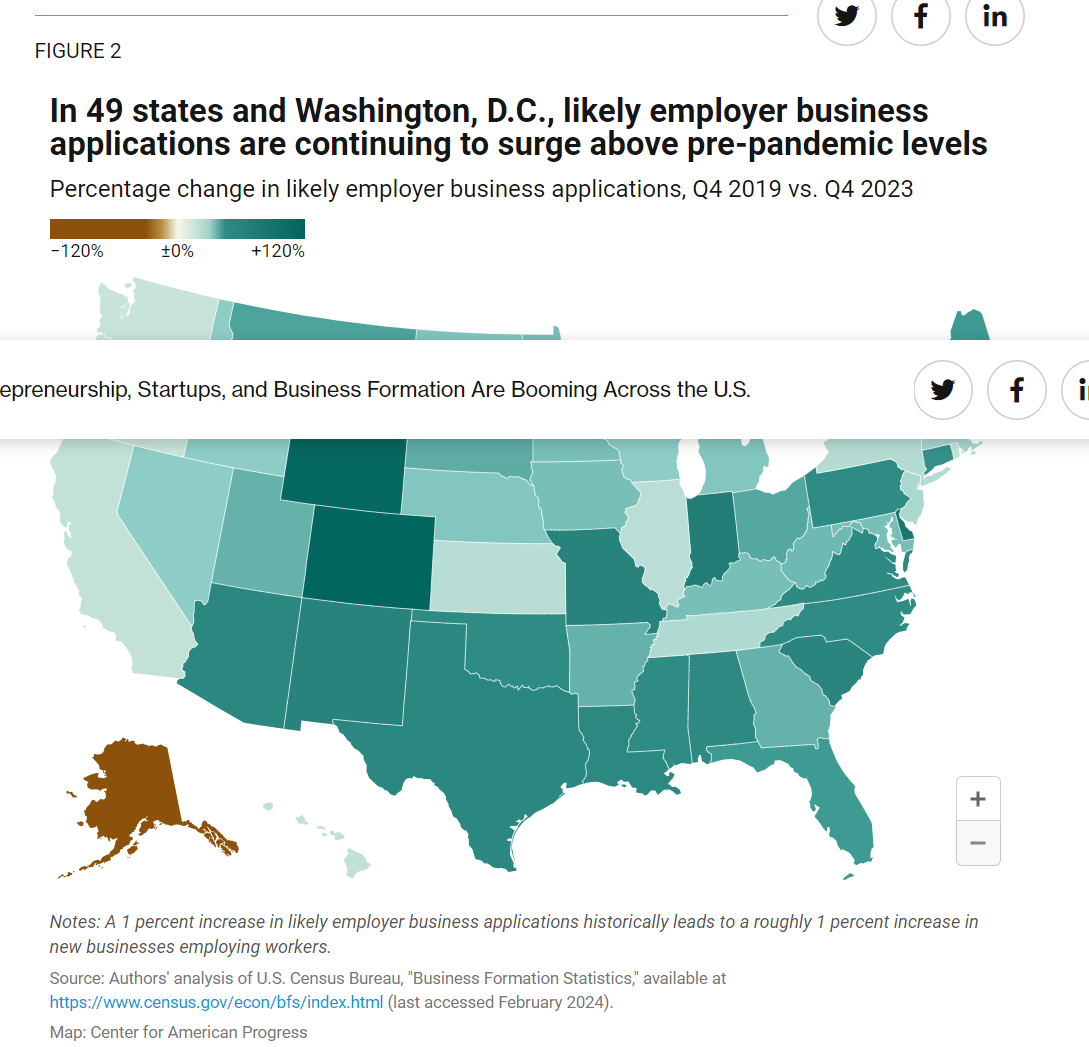
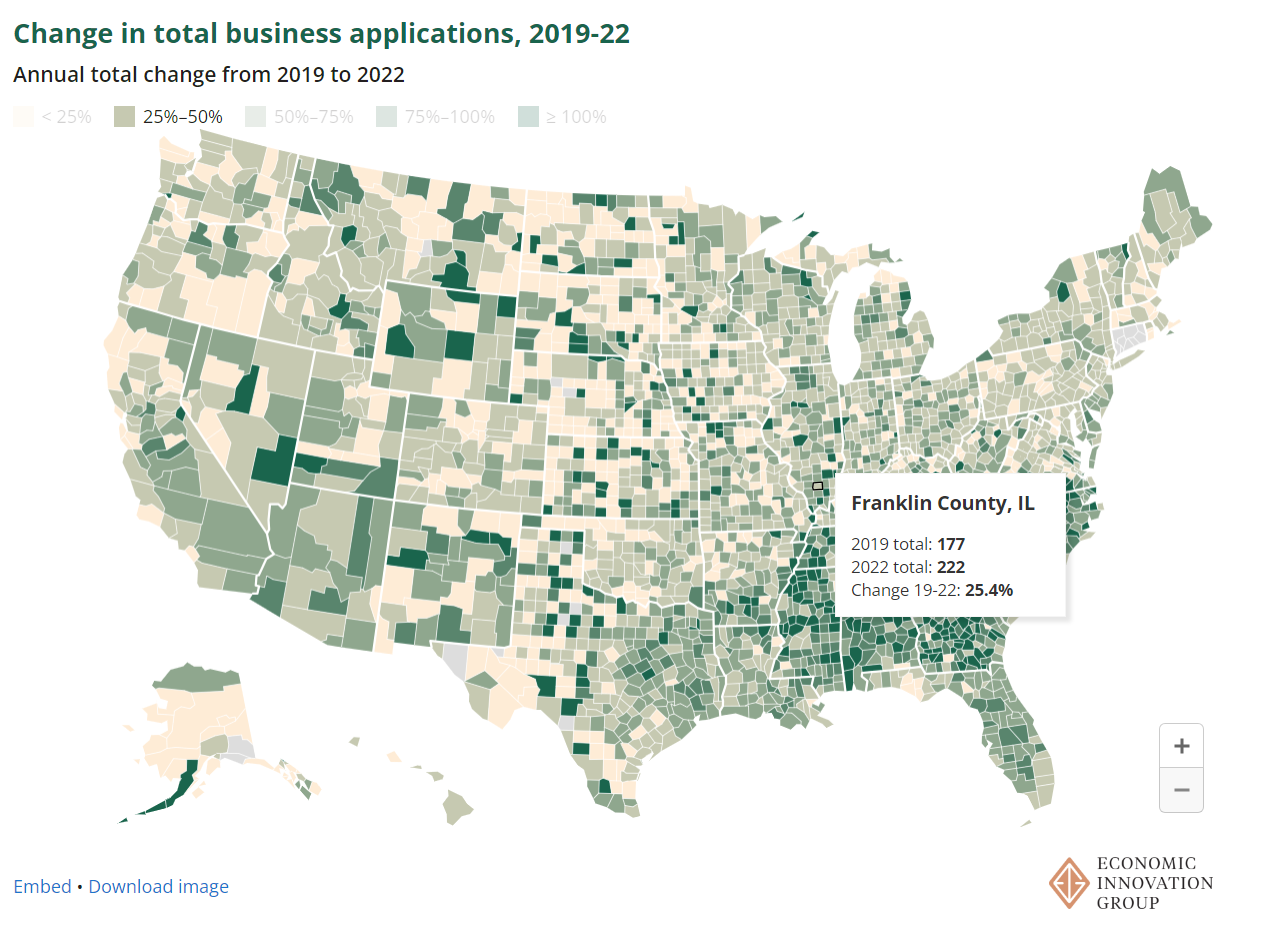
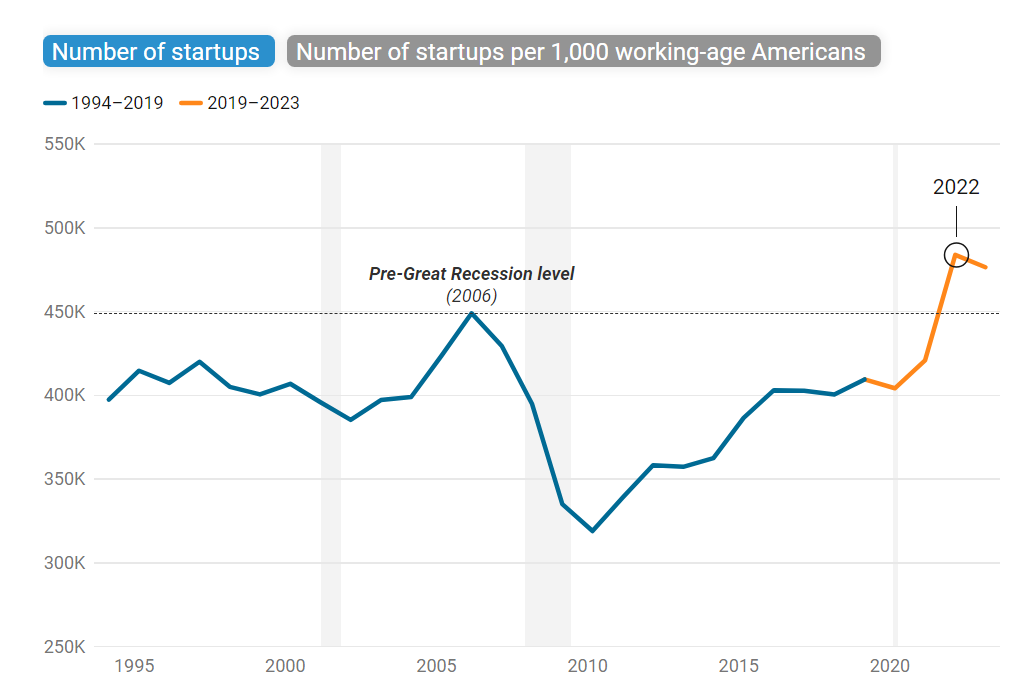
New firm creation since the pandemic has basically been 50% higher than before the pandemic.
This is an AMAZING and unexpected result for the US. During the pandemic, economic activity ground to a halt. Supply chains stopped functioning. People stayed home. 20 million jobs were lost. 1 million lives were lost in the US. Many firms closed. Global trade and military tensions increased. Trust in governments, corporations and other institutions was damaged. In 2020, there was no reason to believe that the pandemic would be medically controlled soon, or that economic growth would quickly rebound and resume its trend growth rate. But it did!
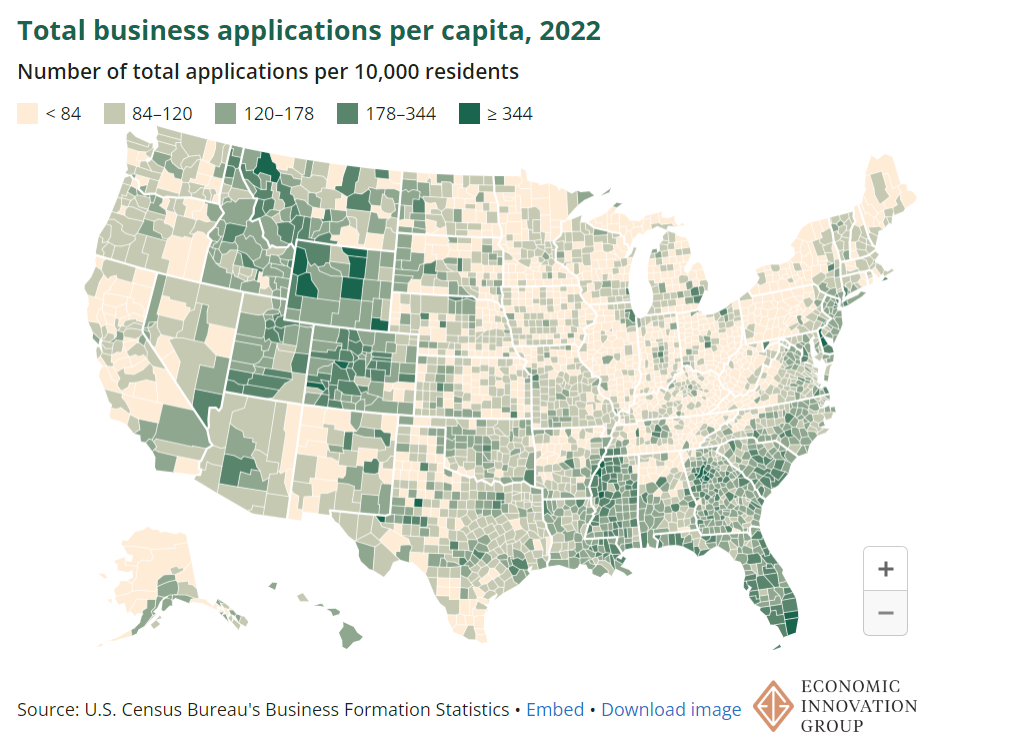
The IRS tracks new firm tax license applications. Most firms never really do business, but the ratio of initial applications to real firm creations has been stable through history. The Census Bureau has determined which subset of IRS license applications leads to real new firm creations. Both measures show the tremendous 50% increase between the pre-pandemic and post-pandemic eras.
As Wendy’s Clara spokeswoman exclaimed long ago, “show me the beef”. Did the increased rate of tax applications during 2021-22-23-24 result in new firm creation?
The initial surge in new businesses did NOT include the IT or manufacturing sectors which look ready to benefit from AI and government investment policies. Firm creation should continue at its record pace for the next 2-3 years.
Why/how did this happen? US economy did not see wealth destruction during the pandemic as occurred in the Great Recession. Bipartisan government funding during the pandemic protected small businesses and individuals. The US labor market was strong before the pandemic and recovered very quickly to full employment with high quit rates, high job openings, low layoffs, wage growth, high labor force participation, and new immigrants included. There was no “credit crunch” destroying businesses. Venture capital firms were flush with capital, able to invest in the very best prospects. The US economy was mature as an “information age” economy, identifying opportunities. The virtual economy was mature, allowing individuals with minimal technical skills to easily create new businesses, market their services, and engage skilled resources. Individuals experienced being out of work and at home and determined that they could create new firms from home.
The Biden administration claims that its various public policies have leveraged the “natural” rebound.
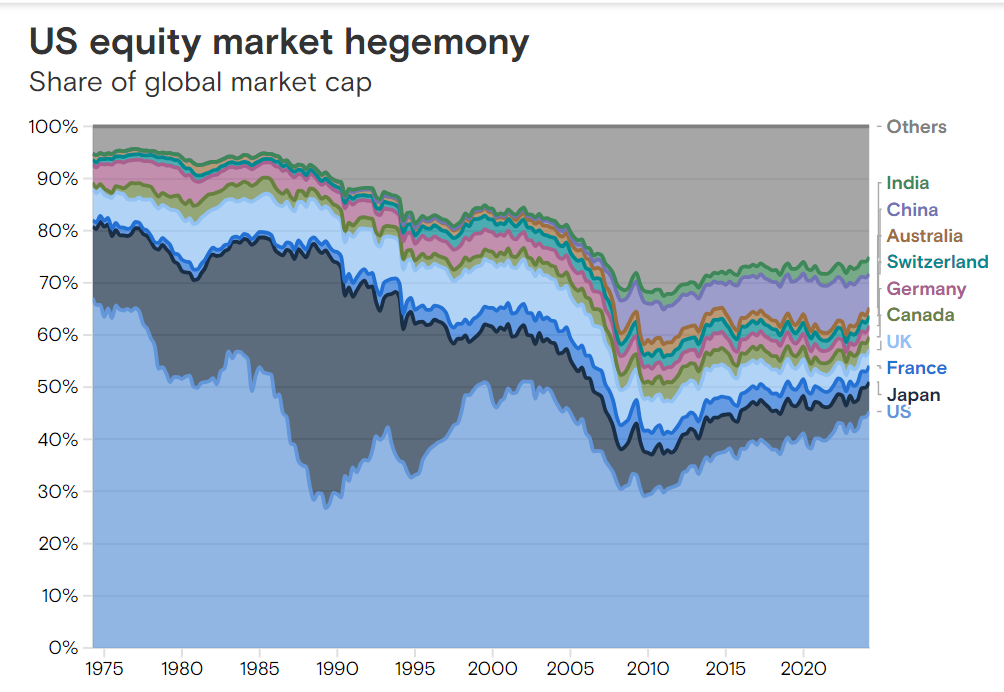
Of 10 largest economies in the world, the US has the 3rd highest GDP growth rate at 3.0%. Less developed China (5%) and India (8%) lead the way. The median growth rate is 1.2%. The UK and Germany have negative annual growth rates (recession)! The US has the second lowest unemployment rate at 3.8%, only bettered by Japan at 2.6%. The median is between China at 5.2% and Canada at 6.1%. France and Italy record 7.5% while Brazil and India trail at 8%.
Despite its high wages, high standard of living and highly valued currency, real dollar US exports exceed the pre-pandemic level.
Real dollar imports have returned to their growth trend level, allowing US consumers to take advantage of the differentiated global economy’s strengths.
The misery index, the sum of the inflation and unemployment rates, is down to 7% and trending lower, materially below the 8% average of this century.
US inflation reached 8-9% in 2022 and has fallen to 3%. The “stickiness” is half caused by the lag in housing and rental prices in the index and half due to the continued high 6% federal government budget deficit as a percent of GDP.
There is nominal inflation or actual deflation in most sectors of the US economy today!!!!
On average, the US economy has been adding 2 million new jobs per year for 14 years. 28 million jobs. This is an amazing result.
During the same period, 12 million more people have retired.
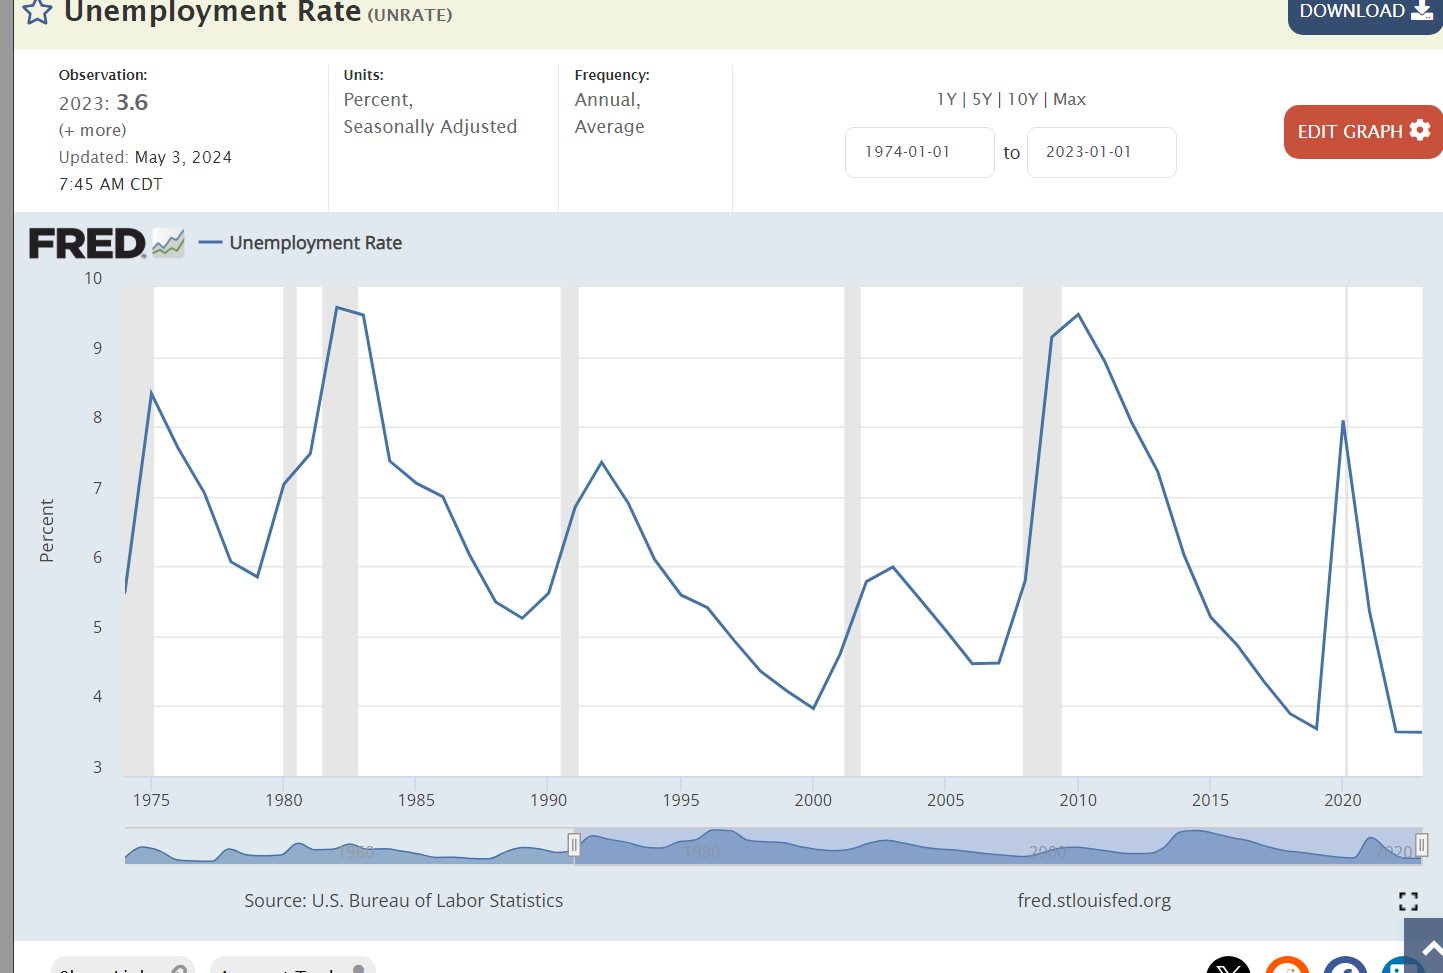
The unemployment rate is at a 50-year low. When I was studying economics in 1974-78, there was a big debate about 5% becoming the lowest possible “structural” unemployment rate possible without escalating inflation. 1997-2007 established that a 4.5% to 5.0% unemployment rate was possible. We raced back up to 9% during the Great Recession. The 35-year average was 6.5%. We experienced 3 years of sub-4% in 2017-19 as economists claimed that this was simply impossible. Unemployment rates are still below 4%.
The Black unemployment rate has been chopped in half, from 11% to 5.5%.
The demand for labor remains high. Job openings peaked at 7.5 million before the pandemic. Job openings remain 20% higher at 9 million 5 years later.
The core labor force participation rate has rebounded from the pandemic reaching a level last seen in 2008.
10% fewer black men participated in the labor force between 1973 and 2013. Participation is now solidly increasing.
Real wages stagnated from 2000-14. They have increased by 10% since then.
Real GDP per capita continues to grow.
If you’re a homeowner, the recent one-third increase in home values is a windfall. If you’re a prospective buyer, housing is much less affordable.
US stock market values are up 50% in 5 years.
Coincidentally (?), corporate profits are up 50% in 5 years.
New business creation increased after the pandemic surpassing the pre-pandemic level and exceeding the pre-Great Recession level. Start-ups typically account for all job creation and ensure competition in product and service markets.
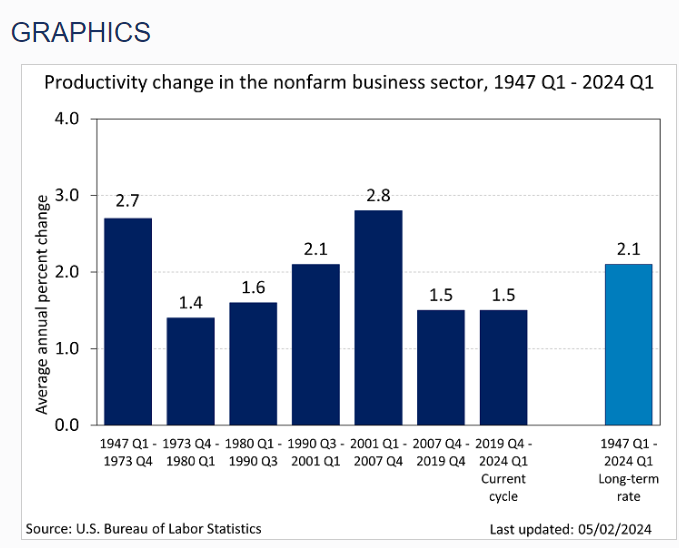
Overall productivity growth in the last 5 years has been the same as in 1973-1990 and 2007-19. In recent quarters productivity has begun to increase at a higher rate and many commentators believe that AI will drive productivity at a higher rate for the next 20 years.
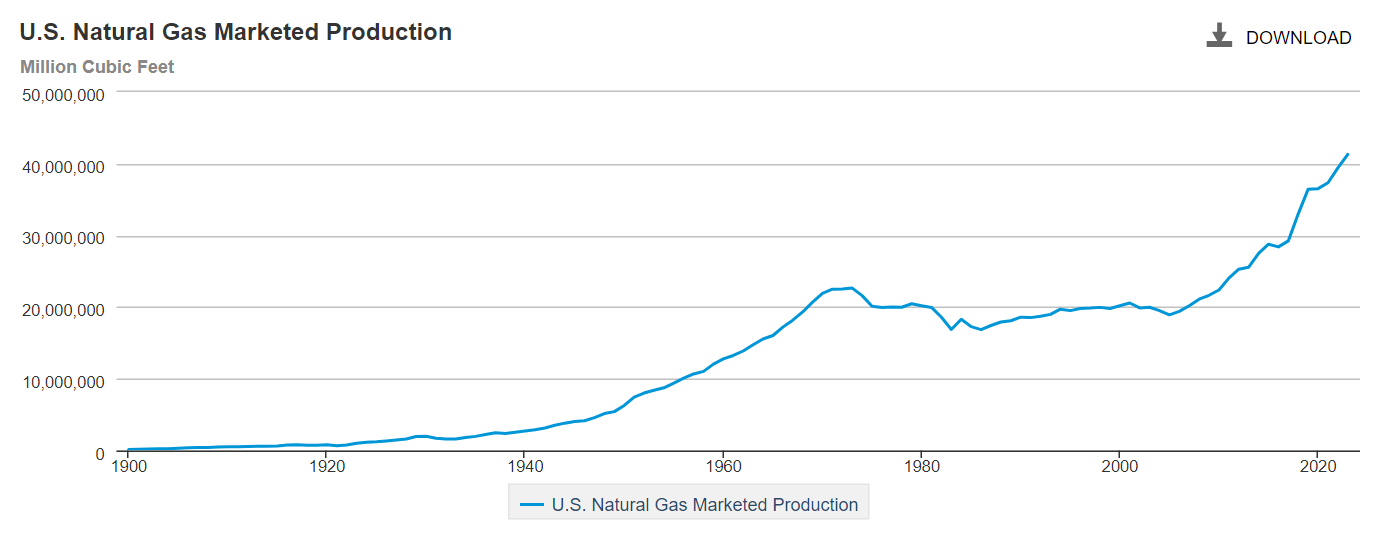
The US has achieved energy independence, doubling its production of natural gas in 20 years.
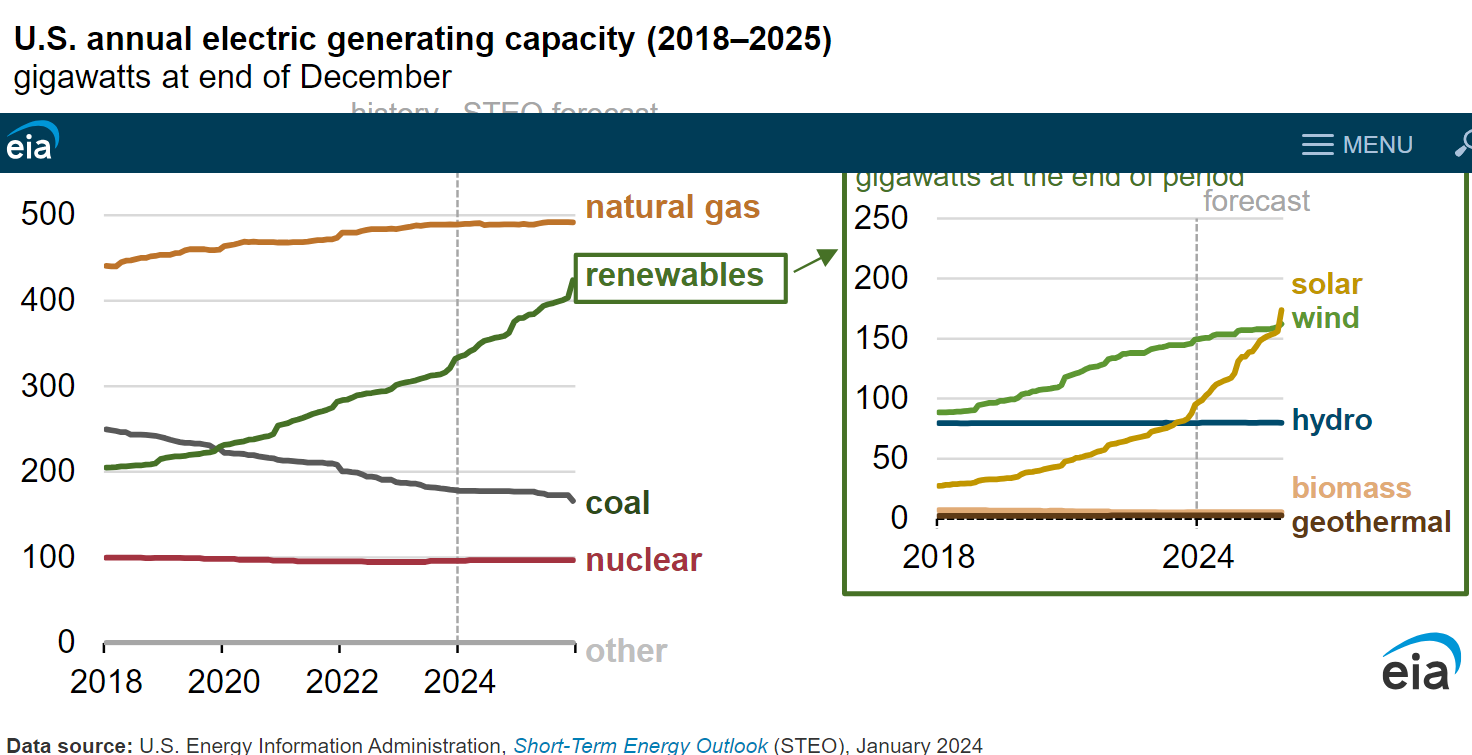
Renewable energy accounts for 22% of US energy generation.
US manufacturing employment has increased by 15% since the Great Recession. It is higher than before the pandemic despite the increase in real median wages and the increase in the value of the US dollar.
Net farm income has doubled since before the pandemic.
We have one-third more voluntary retirees in 2024 versus 2014.
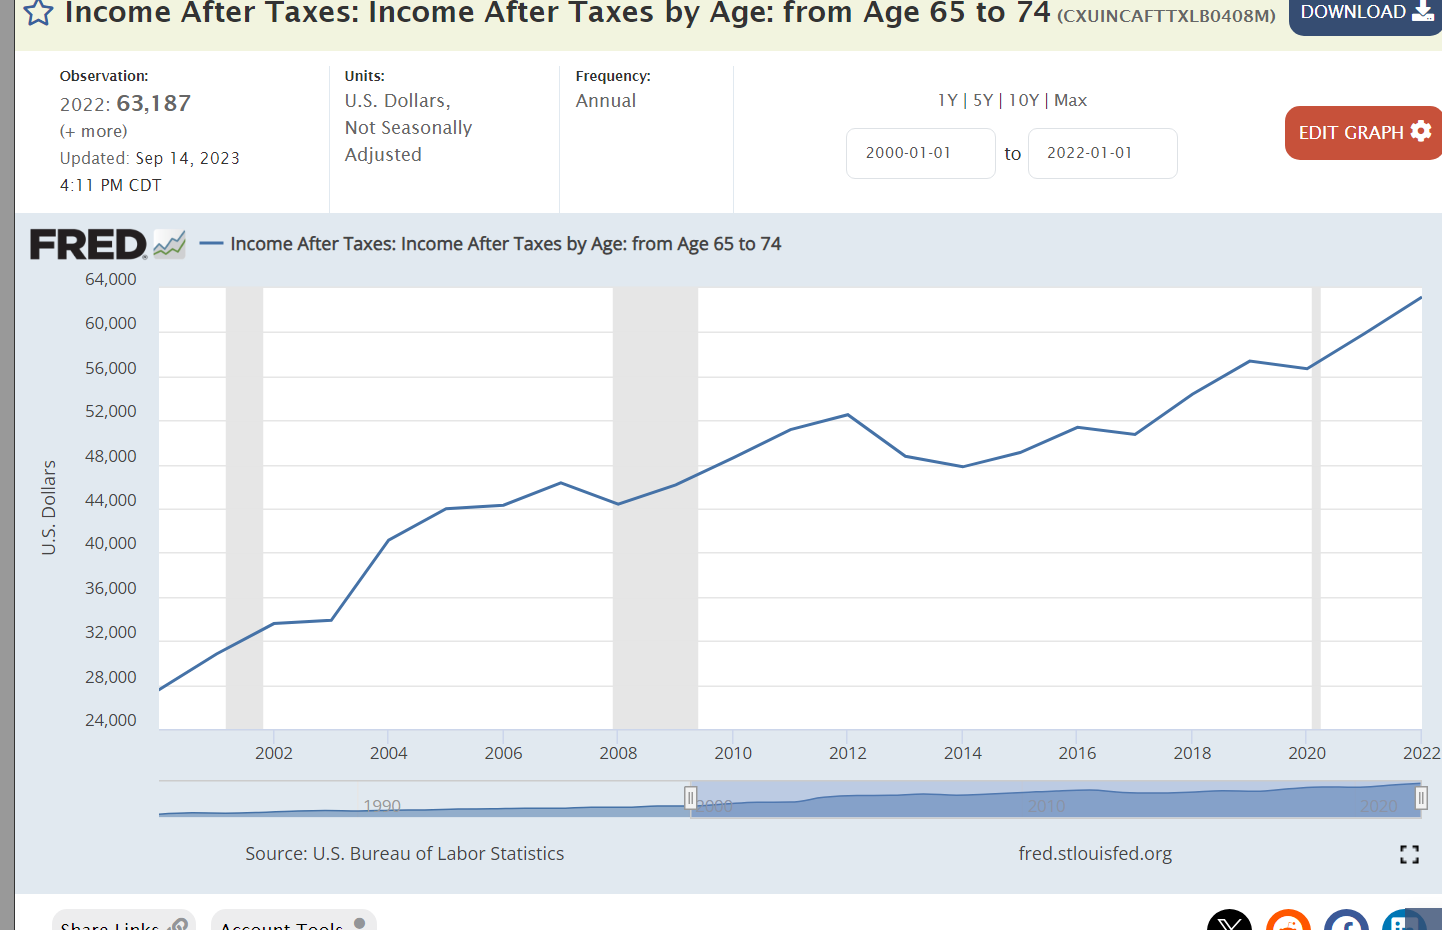
Those retirees are receiving significantly higher incomes.
Retirement assets have increased by 50% in the last 10 years.
US citizens pay very low taxes compared with their developed nation peers.
Summary
The US economy recovered from the uncertain pandemic period faster than other countries due to the combination of very loose fiscal and monetary policy. The fiscal policy boost was bipartisan. The monetary policy boost was nonpartisan. As the strength of the US recovery became apparent by the end of 2021, both Congress and the Federal Reserve Board should have reduced their stimulus levels. The FRB adapted slowly and increased rates. Congress and President Biden have not adapted.
The US economy is experiencing an extra year of excess inflation due to these actions.
It is important to look at the long-run trends and many indicators of economic health. Monetary policy in an independent Fed is effective. Fiscal policy is ineffective. Inflation is higher than ideal.
Let’s list the positive economic indicators. GDP growth, US dollar value, stock market value, exports, employment, retirees and incomes, unemployment, job openings, labor force participation, home values, corporate profits, startups, productivity, energy independence, green energy, manufacturing employment, farm incomes, income equality, poverty, generational progress, and tax burden.
The US economy continues to deliver very positive outcomes for our country. President Biden could do better on reducing the federal budget deficit by increasing taxes or reducing expenditures. Overall, his policies have allowed the economy to continue to deliver benefits.
Last July, I predicted that inflation would be “near 2% by the middle of 2024”. That is not going to happen. Let’s look at the components to assess the last year and the likely future.
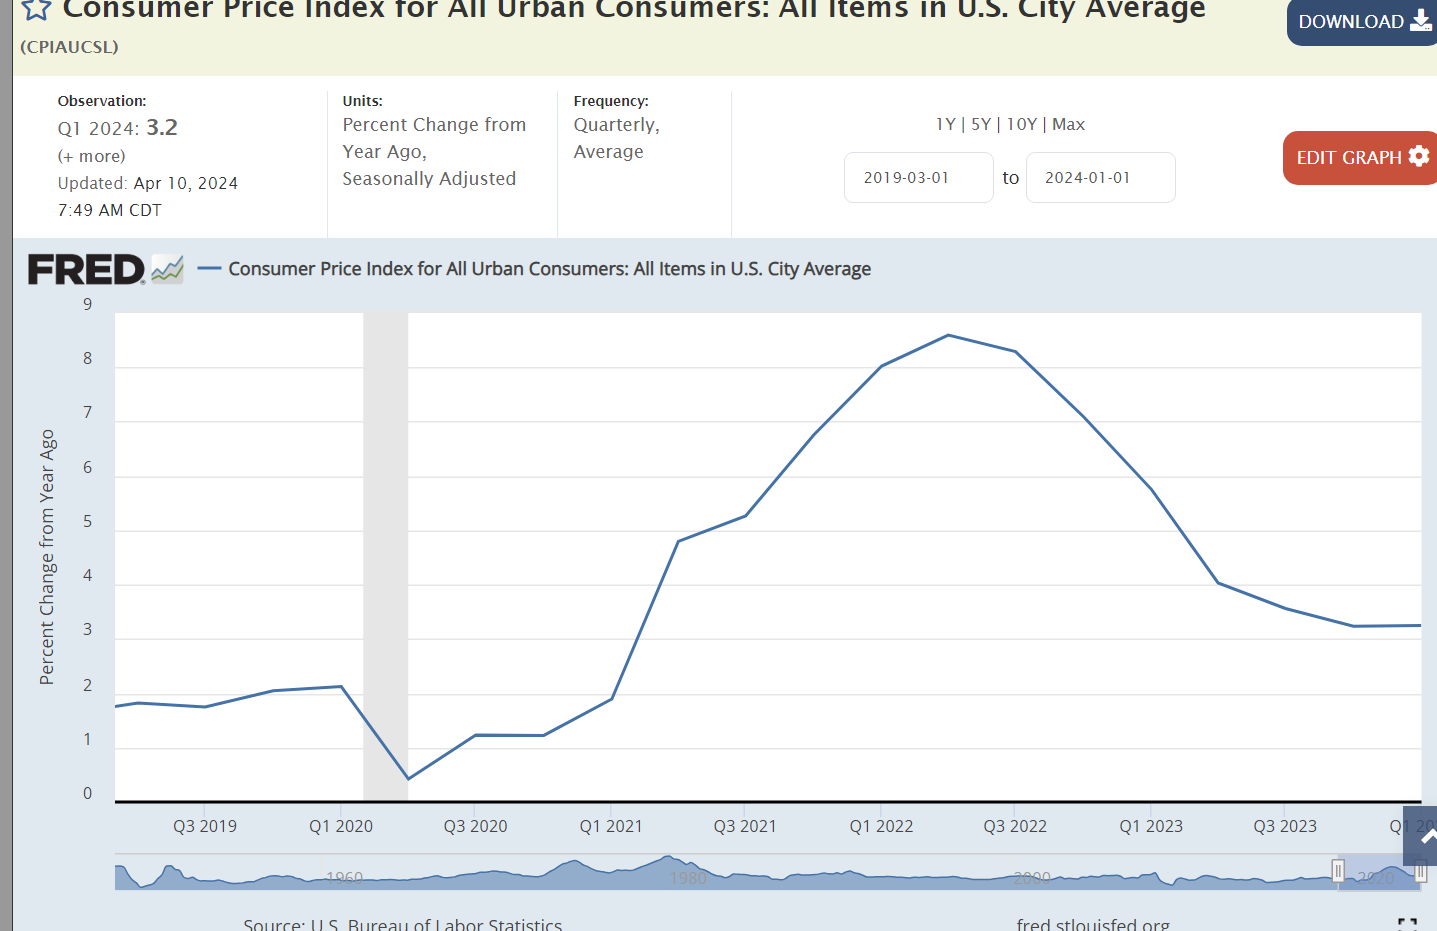
Year over year inflation rate peaked at 8.6% in 2nd quarter of 2022. It was more than cut in half at 4.0% a year later in the 2nd quarter of 2023. The last 2 quarters have been 3.25%. The “easy work” is complete. The “hard work” remains.
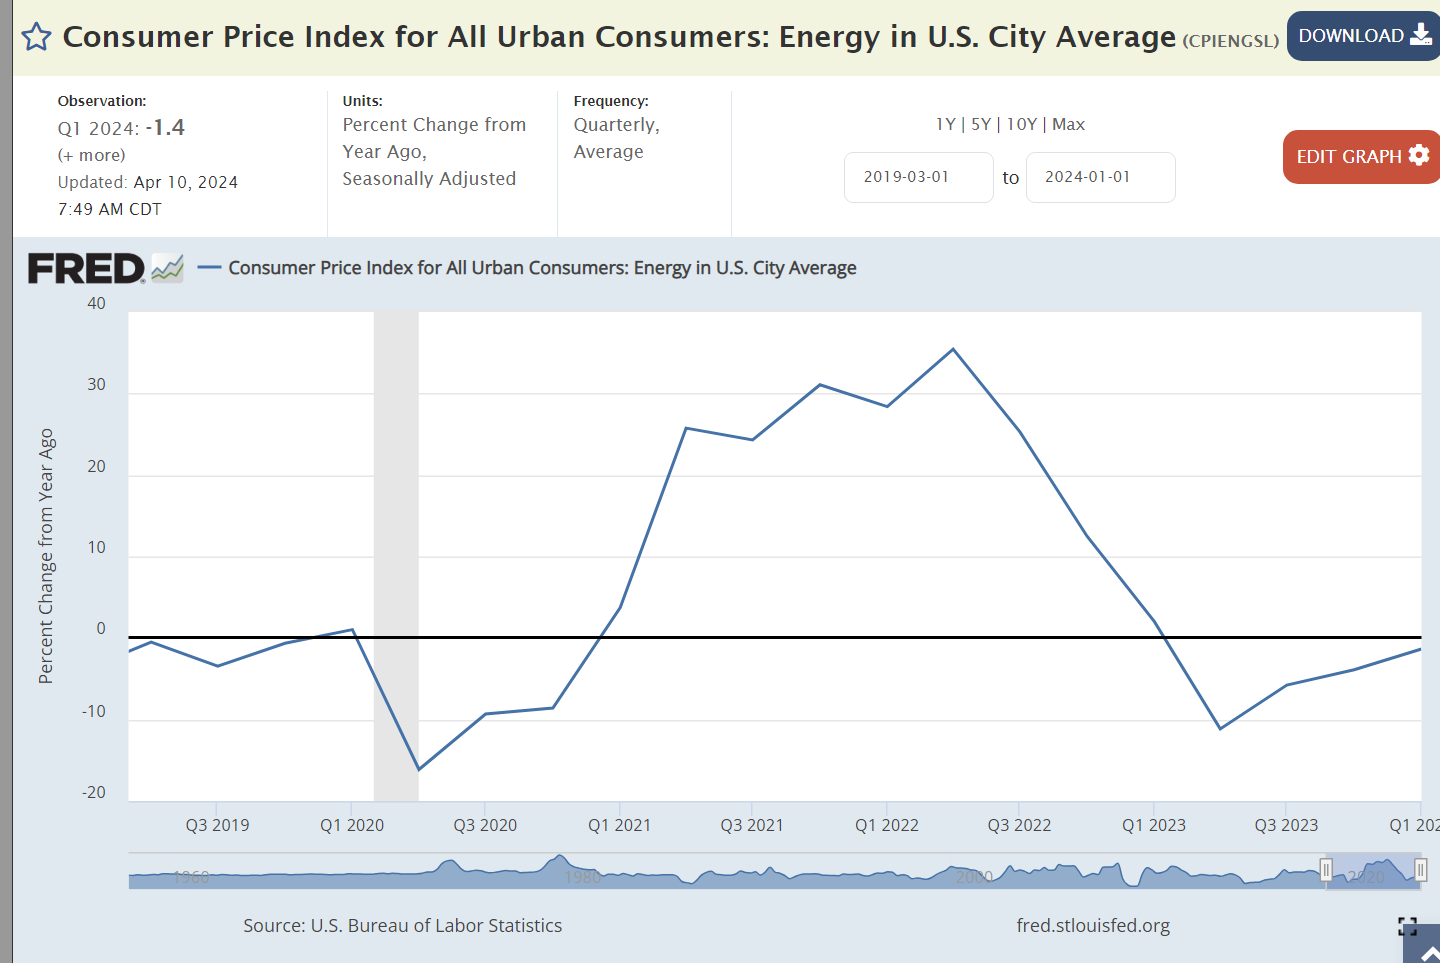
More volatile Food and Energy prices do not explain the continuing 3%+ inflation rate.
We have enjoyed energy price deflation for 3 quarters.
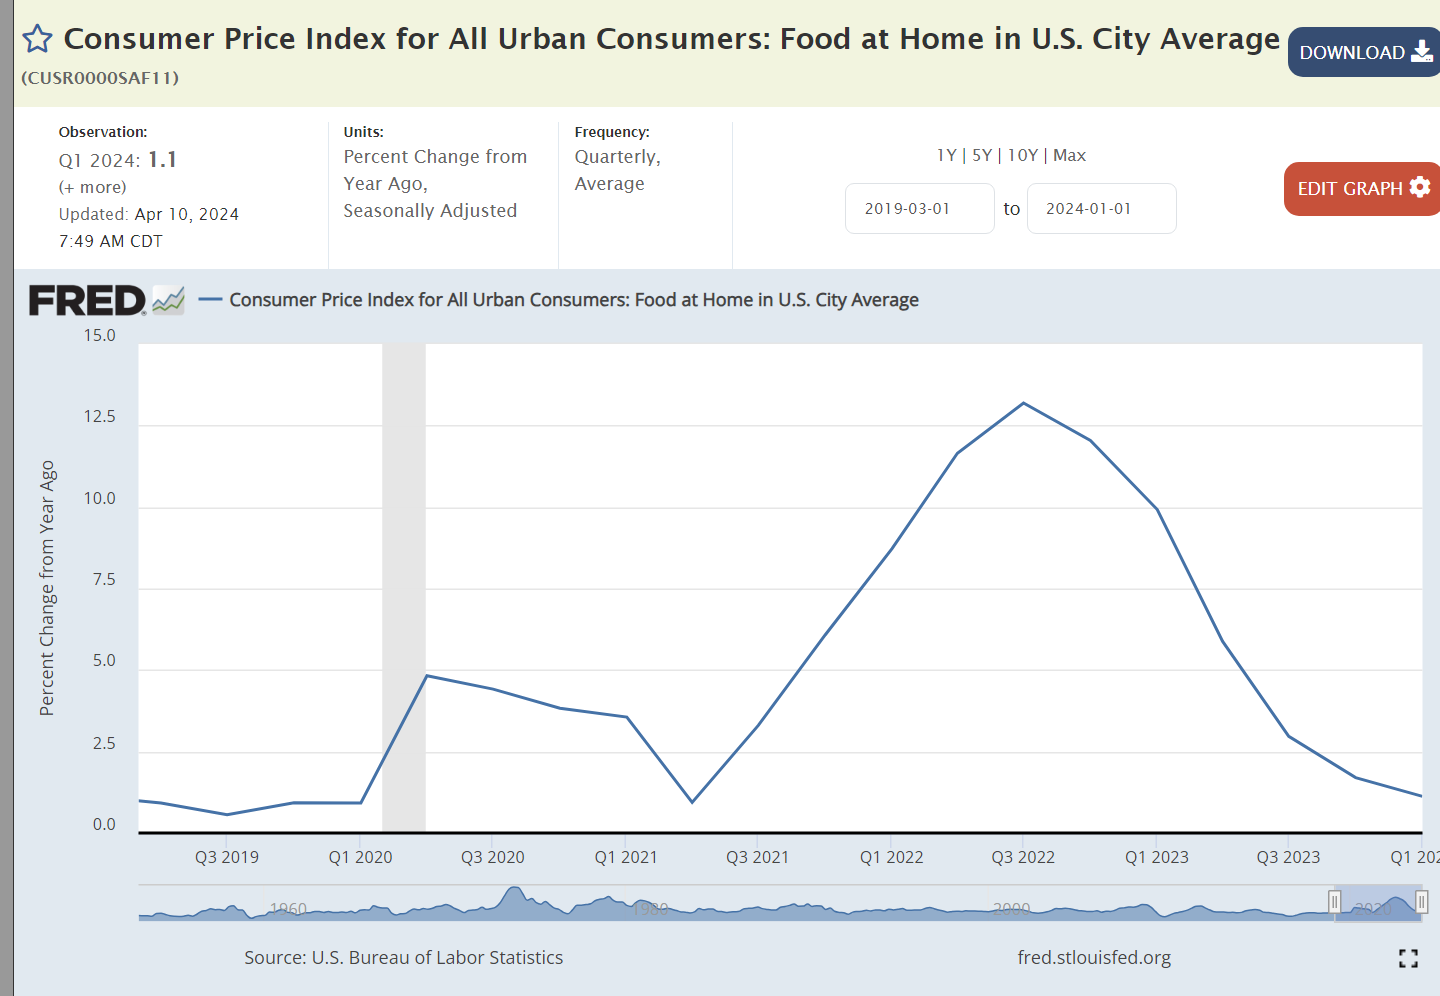
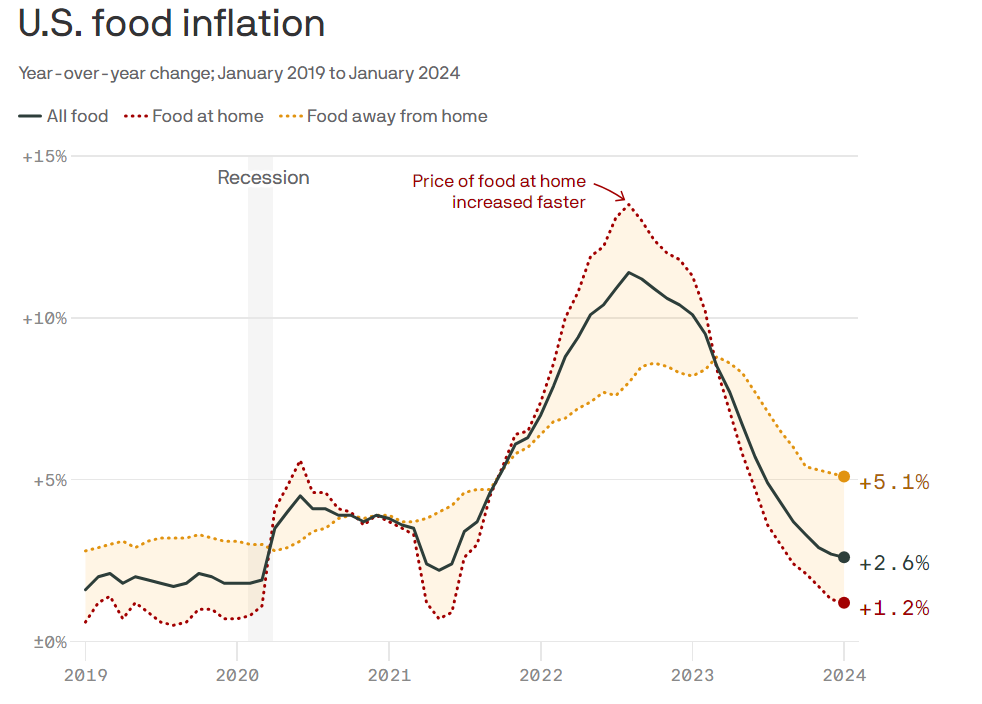
Food consumed at home prices have been nearly flat for the last 2 quarters after the 12-13% inflation during 2022.
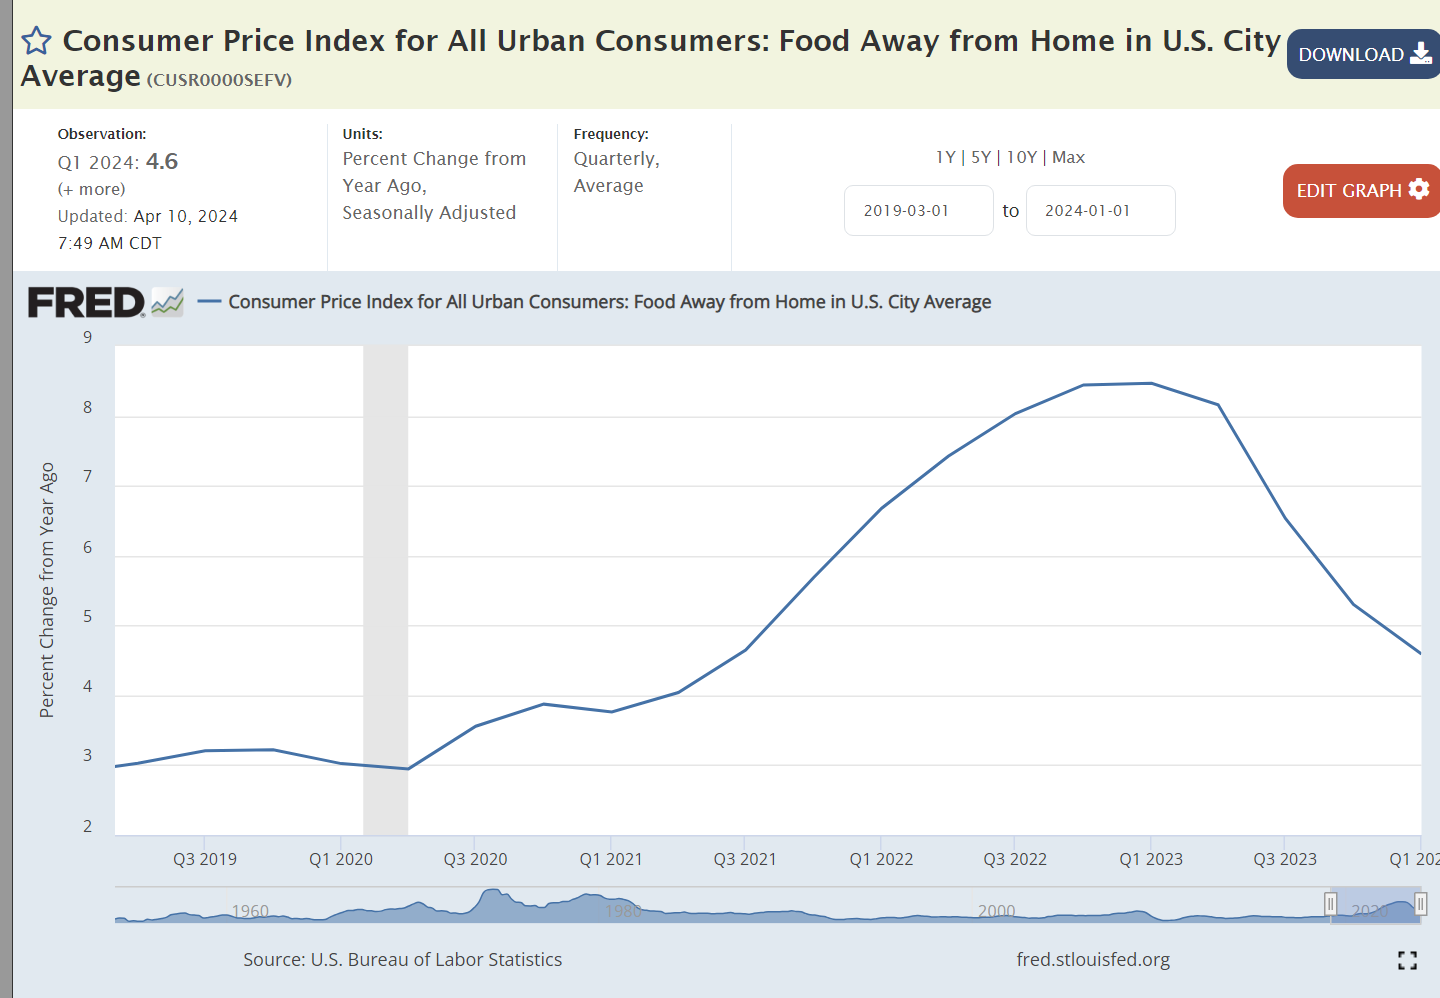
The price of food consumed away from home continues to rise at 4-5% annually. A tight labor market has increased staffing costs for restaurants. High food input costs taught them to better manage their menu prices. Many restaurants went out of business during the pandemic. Restaurants, large and small, lost money during the pandemic and are fighting hard to recover these losses. Following the lean pandemic years consumers have largely returned to their habits of eating out. This is a business sector where high aggregate demand driven by government deficit spending is creating inflation. It is not the “wage-price spiral” of the 1970’s in a manufacturing intensive economy but it is a similar situation in our retail-intensive economy.
We have enjoyed deflation in durable goods prices for 5 quarters as US and global manufacturers realigned their supply chains with more predictable demand patterns.
Nondurable goods inflation has been below the 2% benchmark for 4 quarters.
The broadly defined “services” sector at 5-6% inflation remains a stubborn problem area. It contains a number of sub-sectors with very different market conditions.
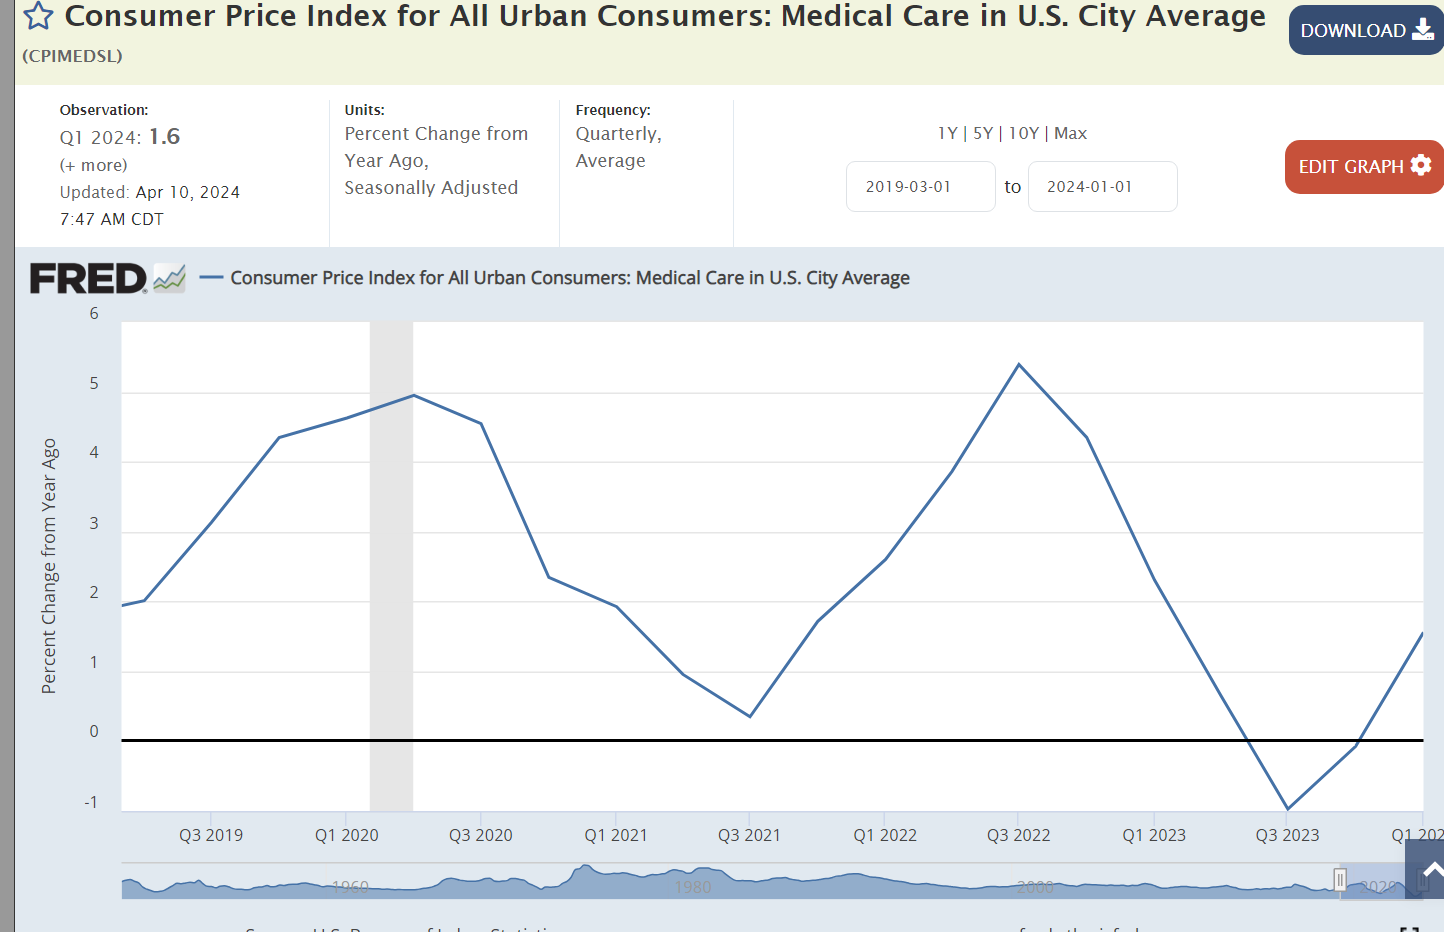
Medical care inflation above the overall inflation rate has been an issue for decades, but it has averaged just 1% for the last 5 quarters.
Transportation services prices have increased by 10% annually. This includes public and private transportation. Public sector transportation is attempting to recover from the pandemic driven decline in ridership. Private rail and truck carriers were disrupted by the pandemic as goods movements plummeted. The prospect of driverless trucks kept freight firms and drivers from returning. Transportation drivers are on the low end of wages. The overall increase in real wages at the low end of the labor market has made these physically demanding, away from home, jobs less attractive. This inflation is part long-term structural adjustment and part short-term recovery of freight flows in the economy. Transportation services is 5% of the CPI, material, but not large enough to drive the total.
The education and communications pair of service sectors has low inflation. Education is higher. Communications is lower.
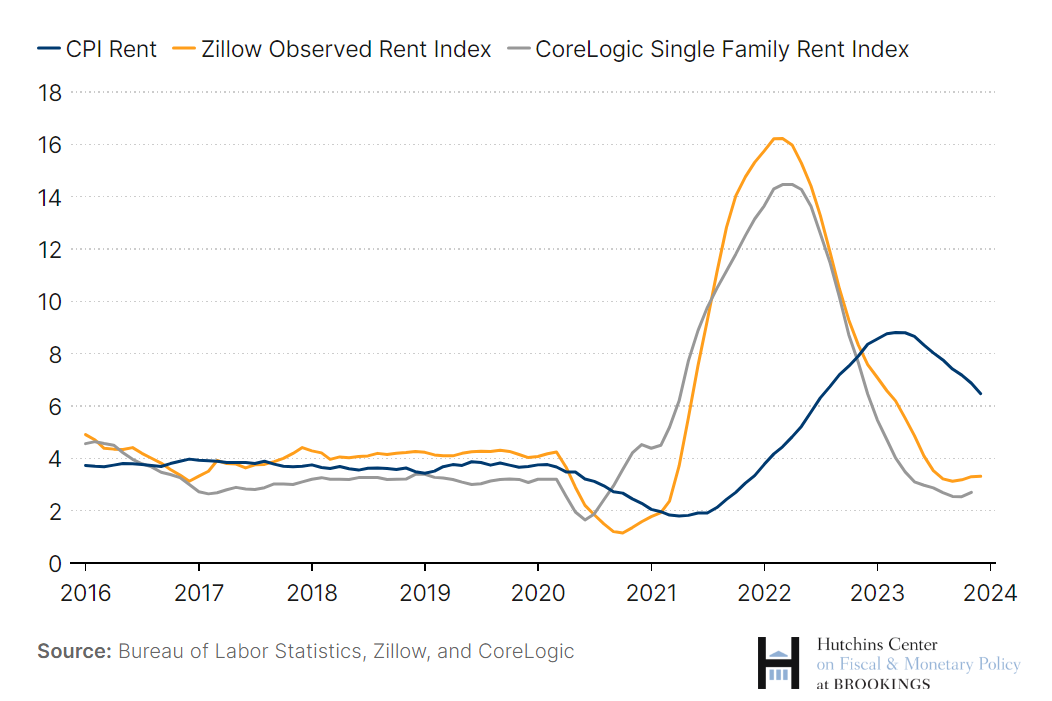
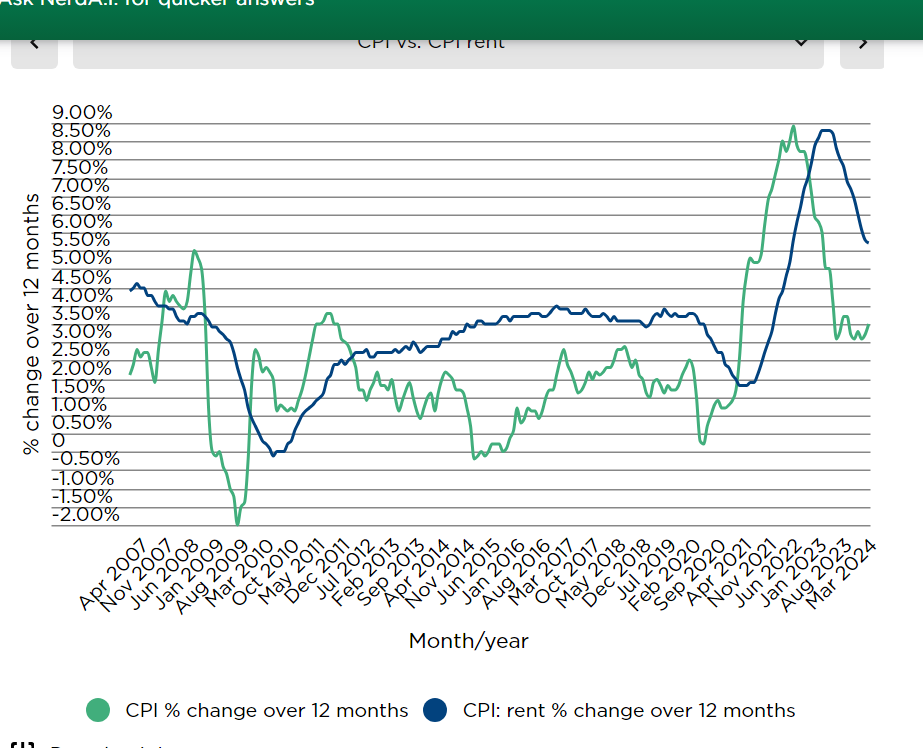
Housing is one-third of the total CPI. It is a very technical, wonky area. It combines a blend of actual rental charges and the estimated rental value of owned homes. Increases in home prices are smoothed out and their impact on the CPI tends to lag by 2-8 quarters. Housing inflation has fallen from 8% to 5%.
Housing sales prices have declined for 4 quarters. This will increasingly blend into the housing CPI, soon producing deflation rather than 4-5% inflation.
Market rent inflation remains in the 3-3.5% range based on the cumulative lack of US housing construction since the Great Recession of 2007-9. Combined with falling housing sales prices the combined housing CPI should decline to 2% by the fourth quarter of 2024.
Dreaded “cost-push” inflation is not a major factor for the US economy. A tight labor market has delivered 1% annual real wage increases for the last 5 quarters. This is a factor in inflation but not a driver or barrier to reaching 2% overall.
2024 looks like 2023, a very high budget deficit for a full-employment economy. In classical Keynesian economic terms, the aggregate demand pressure indicates continued 3% inflation.
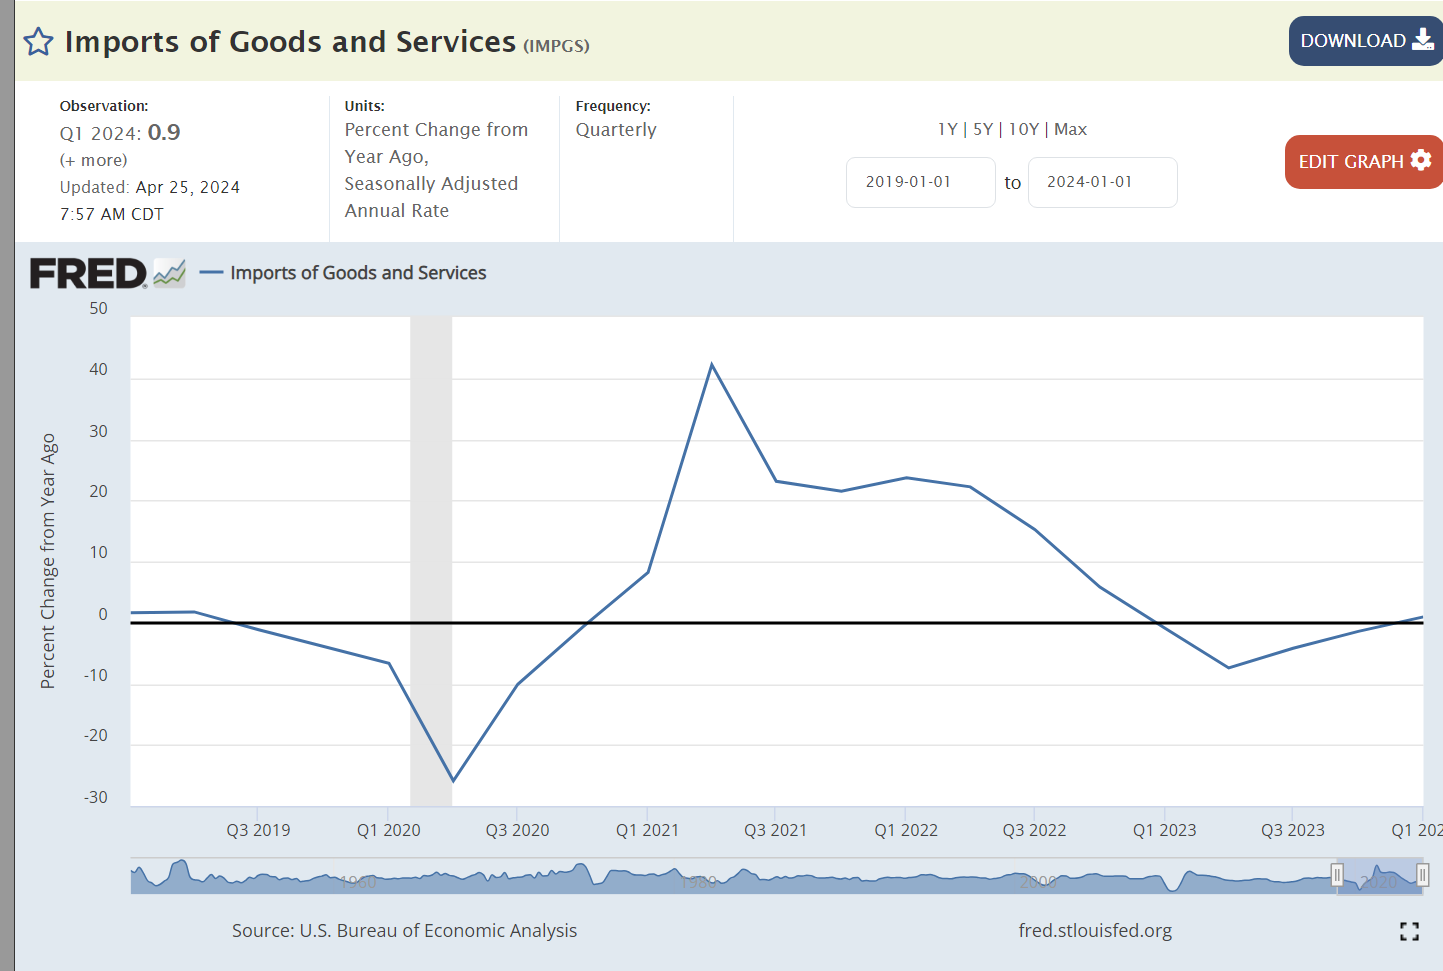
An overheated economy typically shows a strong increase in imports as demand reaches out globally. This is not the situation in the US this year.
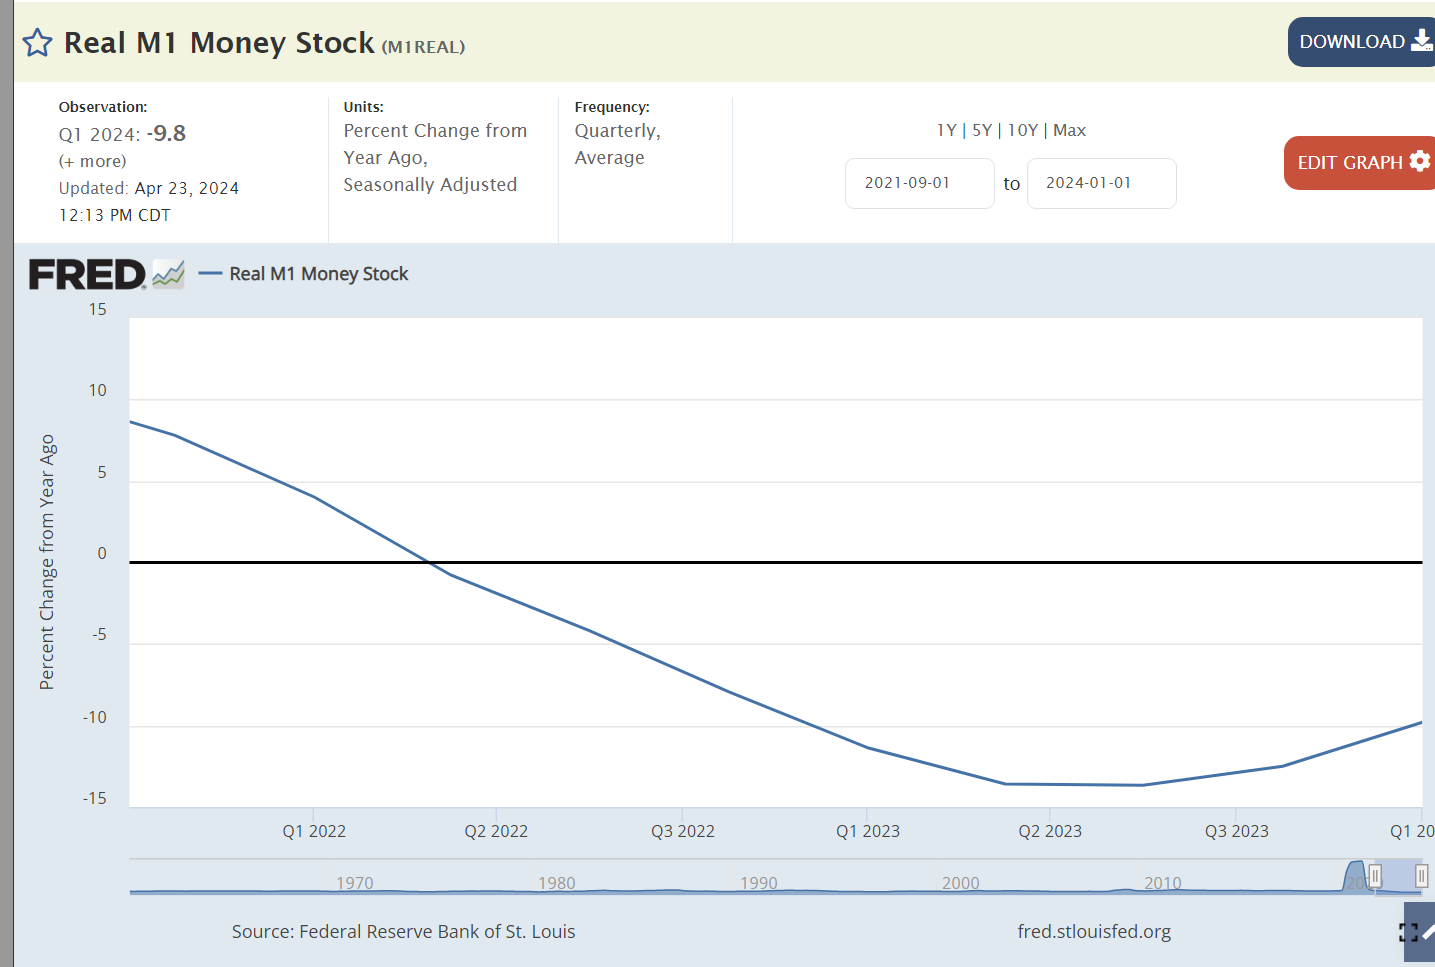
The money supply has a long-term impact on the economy, prices and inflation. The Federal Reserve Bank has been shrinking the “money supply” by 10% annually.
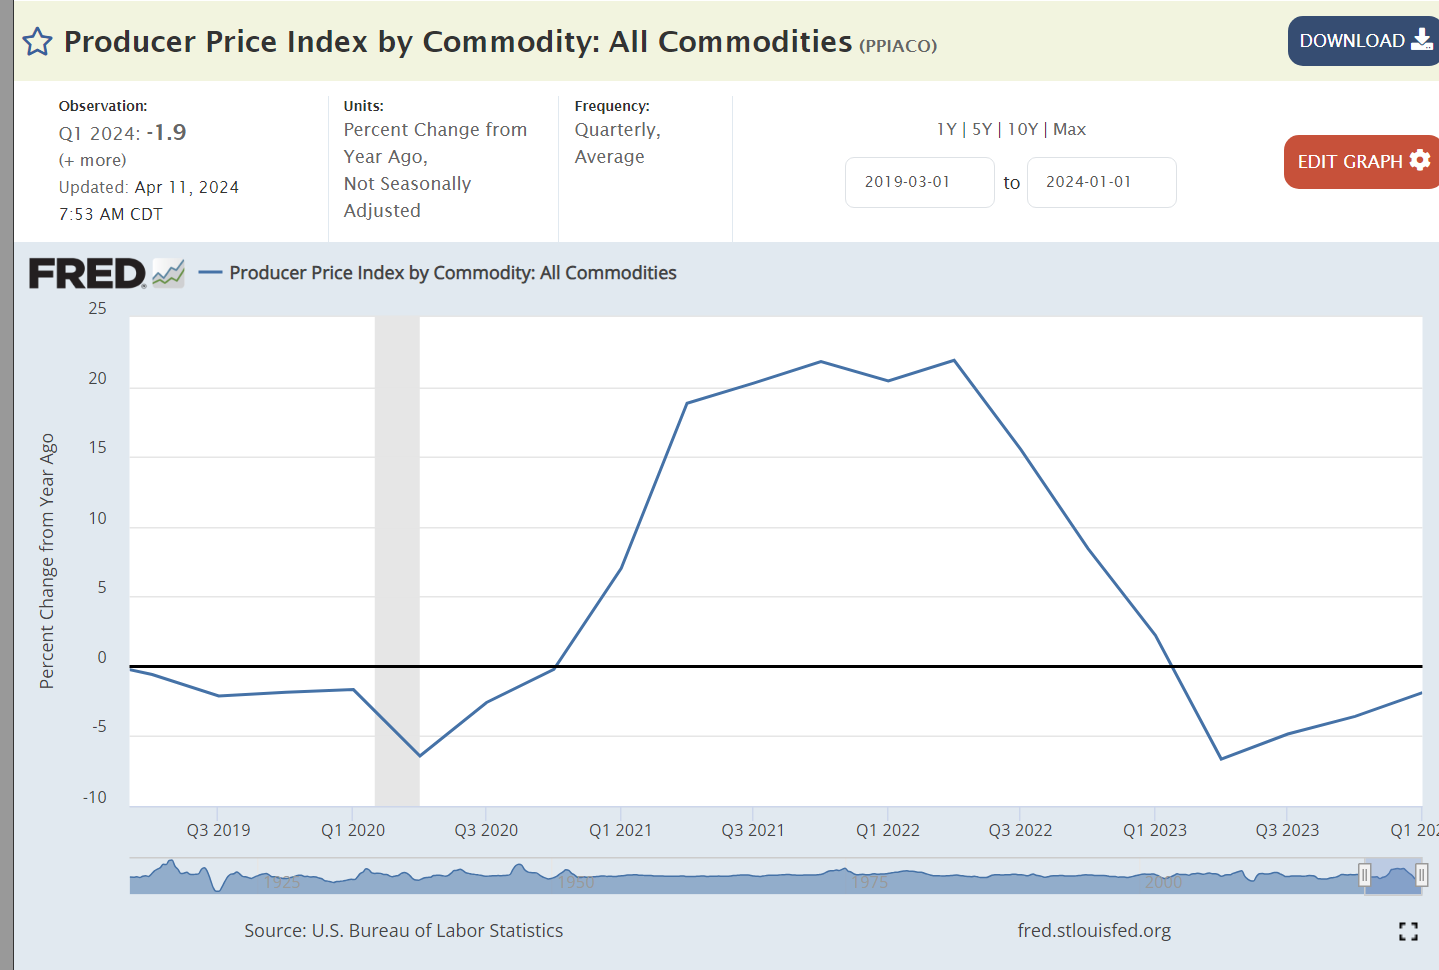
Commodities are the most volatile element of the global economy. Prices jumped by 20% with the unanticipated quick recovery from the pandemic. The last year has delivered commodities price deflation.
Changes in relative market power can drive inflation. Corporations increased profits by 50% in the first year of the pandemic. Profits have been relatively flat since then.
Summary
A dozen sectors point towards 2% inflation by year end. Energy, food at home, durable goods, nondurable goods, medical care, education/communication, housing prices, real wages, imports, money supply, commodity prices and profits.
Four sectors indicate concerns. Food away from home continues to drive high inflation.
Public and private transportation services have not yet reached equilibrium. This pressure may continue for another 4 quarters but should not be a long-term inflation driver.
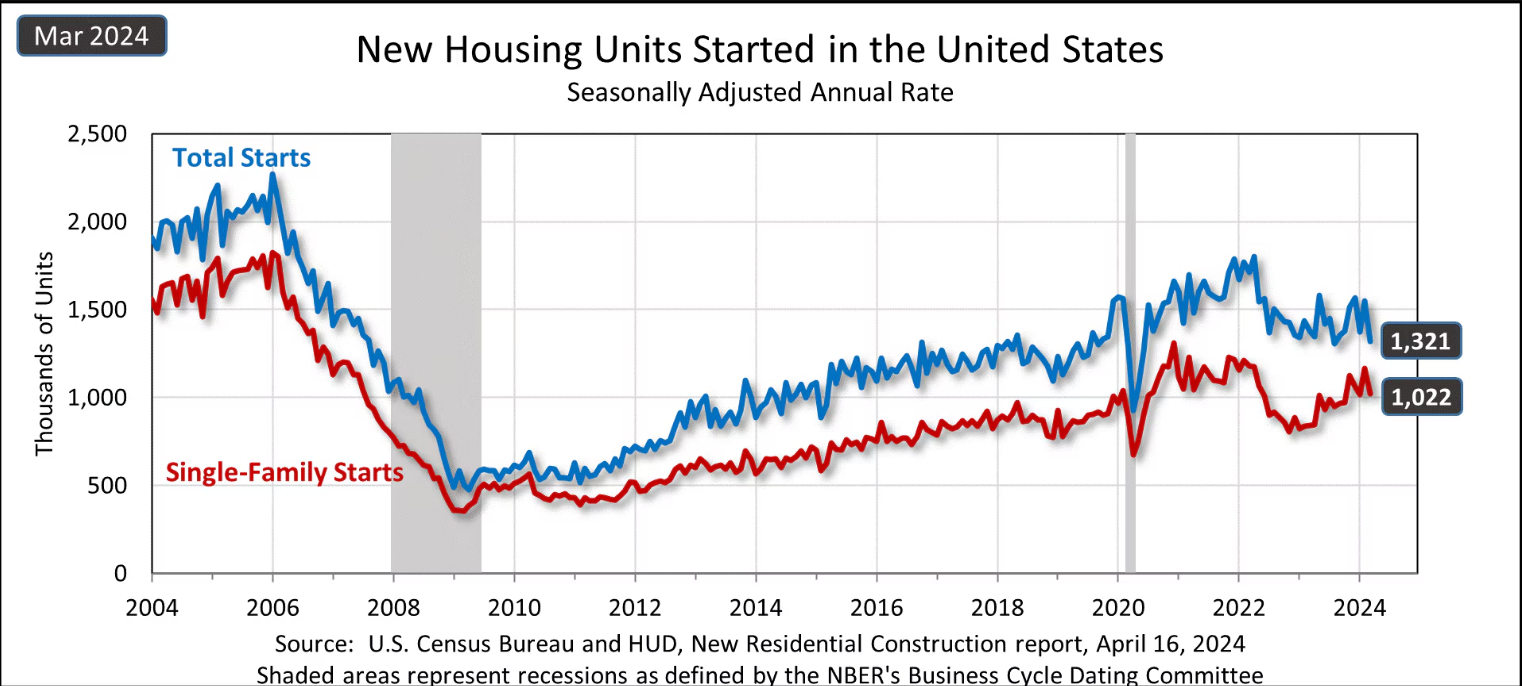
The “Great Recession” destroyed the construction industry. It has slowly recovered. Total construction has increased, perhaps not enough to bring housing supply into balance with demand 15 years later. Rental inflation at 3% is likely to continue.
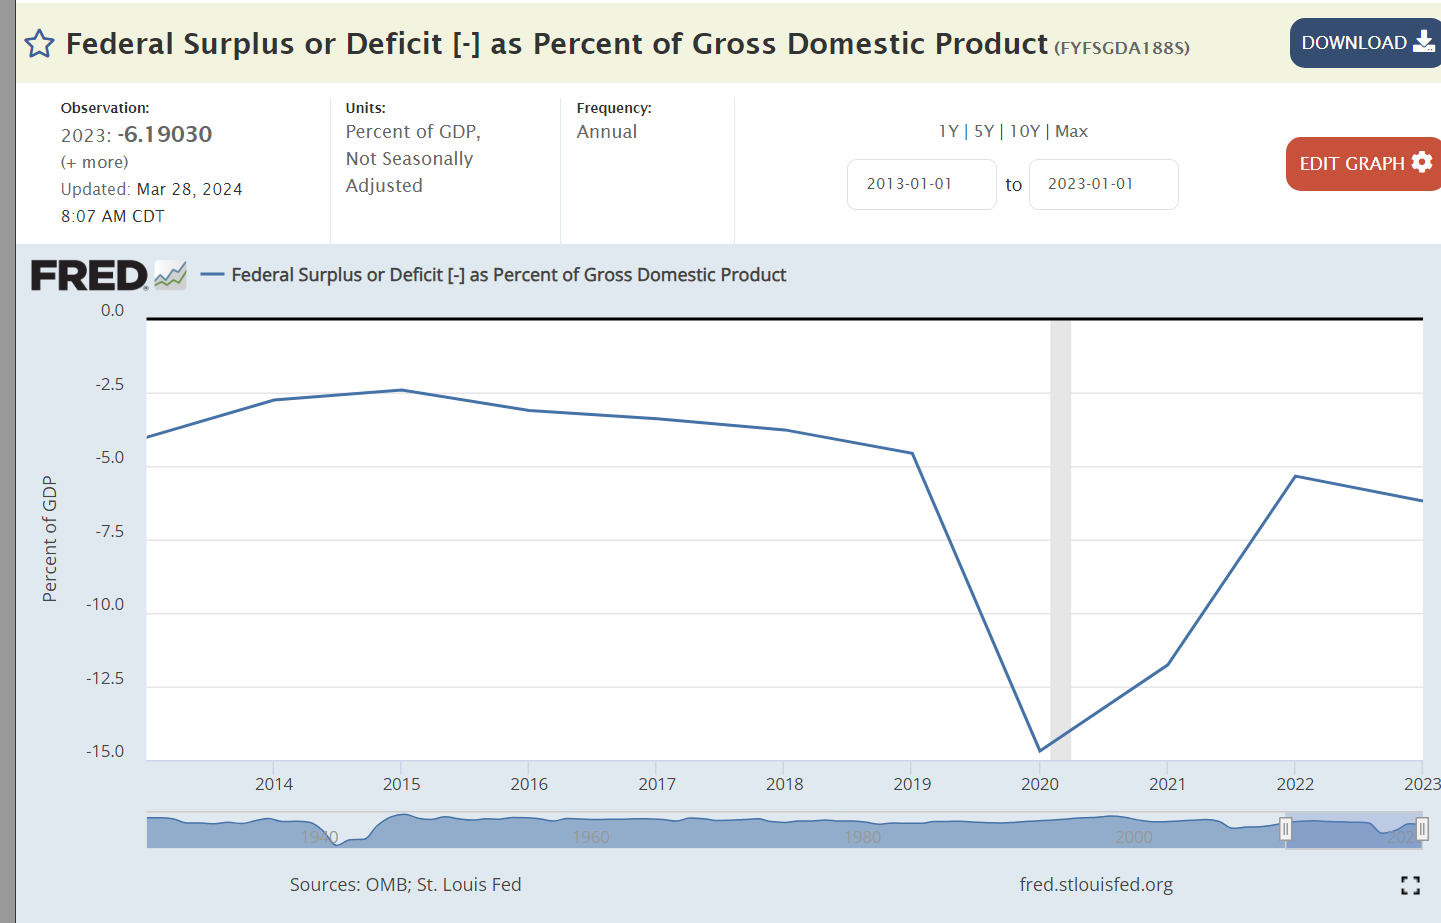
The federal budget deficit is the greatest concern. 6% of GDP is a huge deficit.
Net, net, I predict that the Urban Consumer CPI increase in the fourth quarter of 2024 versus the fourth quarter of 2023 will be 2.25%. The federal government spending deficit will directly and indirectly boost inflation.
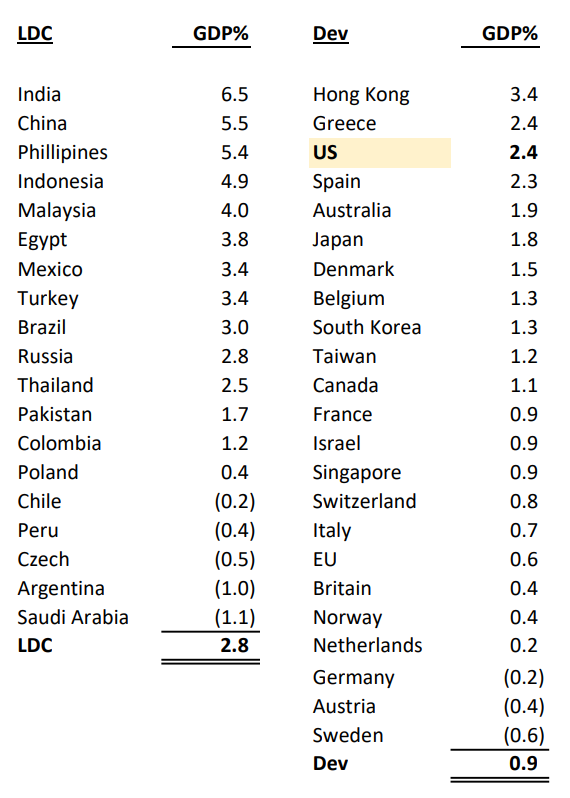
Global GDP growth in 2023 averaged 1.2%, slow but not recessionary. We have rebounded from the pandemic without a secondary recession despite the “soft landing” which has been achieved and we are now moving into take-off mode.
The US leads the “developed” world at 2.4% real growth, twice the global average.