
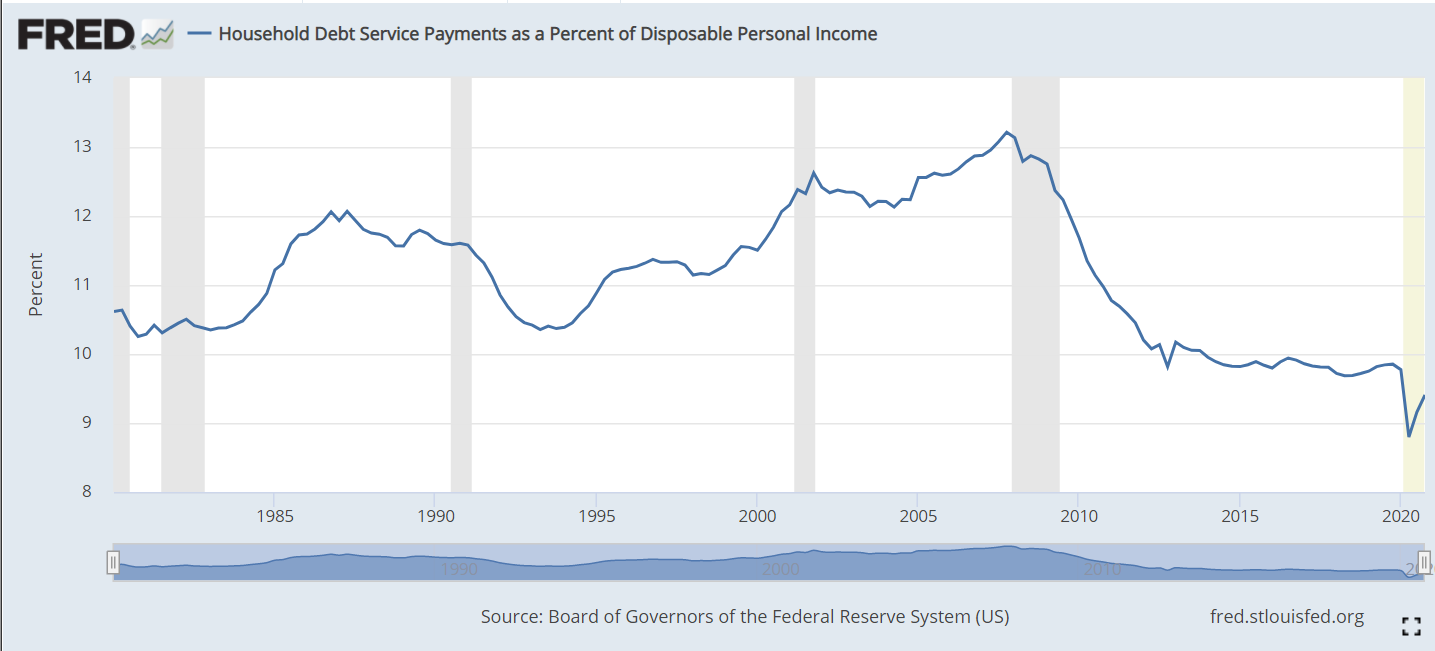
The ratio of household debt service (loan payments) to disposable personal income includes both mortgage payments and consumer debt payments. From 1980-2000 it fluctuated between 10.5% and 12%. Following the 2001 recession it increased to more than 13% before falling steeply to 10% in 2012. During the long recovery from the Great Recession it remained just below 10%. During the pandemic time it fell as low as 9% as personal incomes were boosted through stimulus payments. In total, this is a healthy situation. American families worked through an unsustainable runup of debt and payment during the “ought” decade, the Great Recession and the pandemic. They are well positioned at les than 10% to either save or spend, depending on their preferences. This is good news for the economy, the housing market and risks to financial markets. This is often called the Debt Service Ratio (DSR).
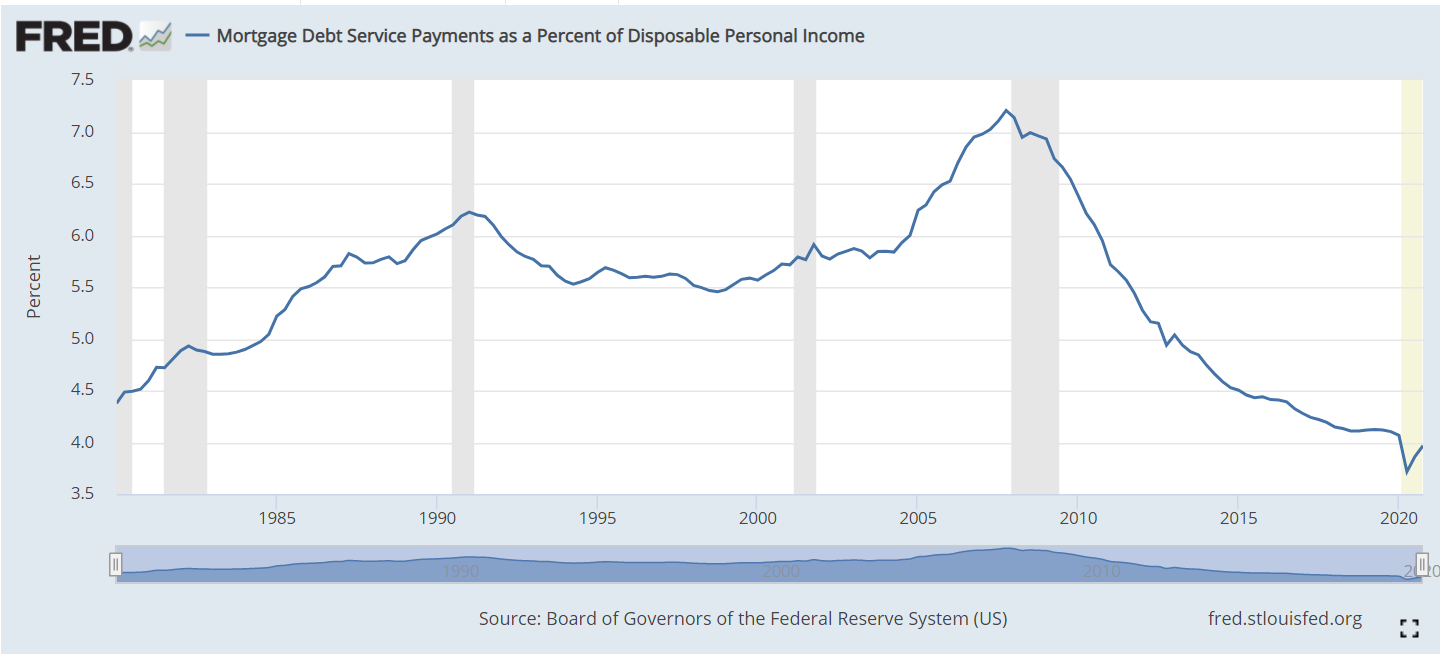
The mortgage component averaged 5.5% of personal income from 1980-2000. It remained below 6% through 2004, before increasing quickly to 7% in 2007. This was unsustainable. Mortgage foreclosures and revised lending standards reduced mortgage lending balances quickly. The Fed reduced interest rates and kept them low. Mortgage payments as a percent of disposable personal income fell to just above 4%. This is a 40% drop (3/7). Even compared with the 5.5% average, this is a 27% reduction in debt service expenditures. This ratio is threatened by future interest rate increases, but current mortgage holders will benefit from years of low mortgage rates and refinancing for decades to come.

Consumer debt has also fluctuated across these 40 years, reaching an early peak of 6.4% in 1986 during the confusing era of stagflation. In the next 6 years, families reduced their debt percentage by 1.7% to a safe minimum of 4.7%. Consumers were more confident through the 1990’s and took on more debt, allowing the payment ratio to rise to a new record of 6.6% before the 2000-2001 recession triggered less borrowing. Although mortgage payments increase during the 2000’s, consumer debt payments eased back to just 6.0%. Families were scared by the Great Recession and reduced their debt levels (and helped by lower interest rates) and payments to just 5% in 2010. The ratio remained low for 2 years, before resuming a familiar optimistic climb to 5.8% of disposable income before the pandemic.

The Household Financial Obligations Ratio (FOR) follows the same pattern as the Debt Service Ratio (DSR). It is a higher percentage as it includes other “fixed” obligations such as rent. We see relative stability between 16-17% through 2004. The mortgage driven increase to 18% by 2008 is evident, followed by a very rapid fall to 15% in 2012. This broader ratio has remained flat since then. The pandemic drop is due to extra stimulus income.

File:Total US household debt and its composition over time.png – Wikimedia Commons
The composition of total consumer debt for the last 20 years highlights the rise and fall and rise of mortgage debt and the increase in student loan debt.
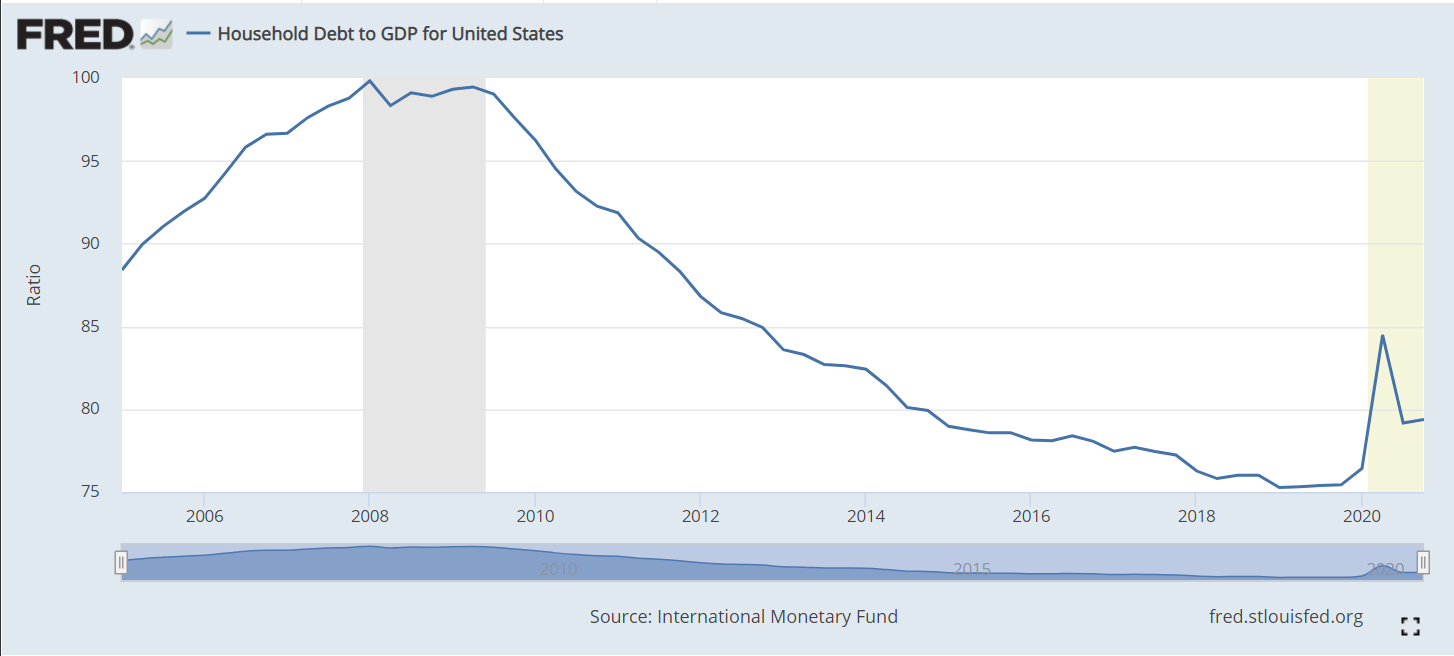
Household Debt to GDP for United States (HDTGPDUSQ163N) | FRED | St. Louis Fed (stlouisfed.org)
Household debt to GDP peaked at 100% before the Great Recession and has fallen by one-fourth in the next 10 years. Unpaid mortgages and other consumer debt have begun to accumulate in the last year.
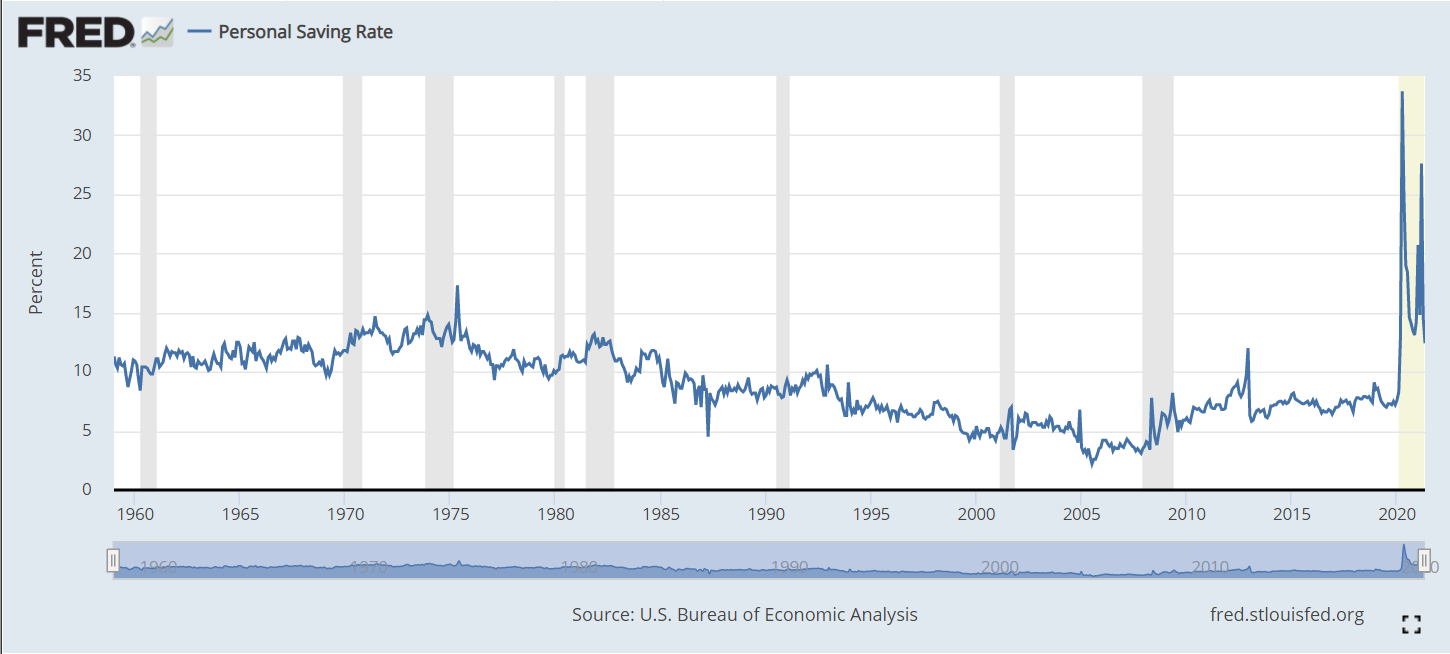
Personal Saving Rate (PSAVERT) | FRED | St. Louis Fed (stlouisfed.org)
The personal savings rate averaged 10-13% from 1960-1985. The country’s economic challenges lead families to save less to maintain their standard of living, falling in half (5%) by 1999. It remained in the 4-5% range through the next expansion. The Great Recession triggered families to replenish their savings, with a 7-8% rate. The pandemic period shows a 15% savings rate. In all likelihood, this rate will fall back below 10% soon.
Household debt jumps the most in 12 years, Federal Reserve report says (cnbc.com)
Household Debt Service Drops to a Record Low – AIER
Household Debt Rising, but Payments Remain Under Control | LPL Financial Research (lplresearch.com)

[…] Good News: Consumer Debt Payments at Record Low […]
[…] Traffic Fatalities Decline Good News: Measured Intelligence Increases Through Time Good News: Consumer Debt Payments at Record Low Good News: US Air Pollution Declines US Infant Mortality Rate: It’s Complicated […]