
Last July, I predicted that inflation would be “near 2% by the middle of 2024”. That is not going to happen. Let’s look at the components to assess the last year and the likely future.

Year over year inflation rate peaked at 8.6% in 2nd quarter of 2022. It was more than cut in half at 4.0% a year later in the 2nd quarter of 2023. The last 2 quarters have been 3.25%. The “easy work” is complete. The “hard work” remains.

More volatile Food and Energy prices do not explain the continuing 3%+ inflation rate.
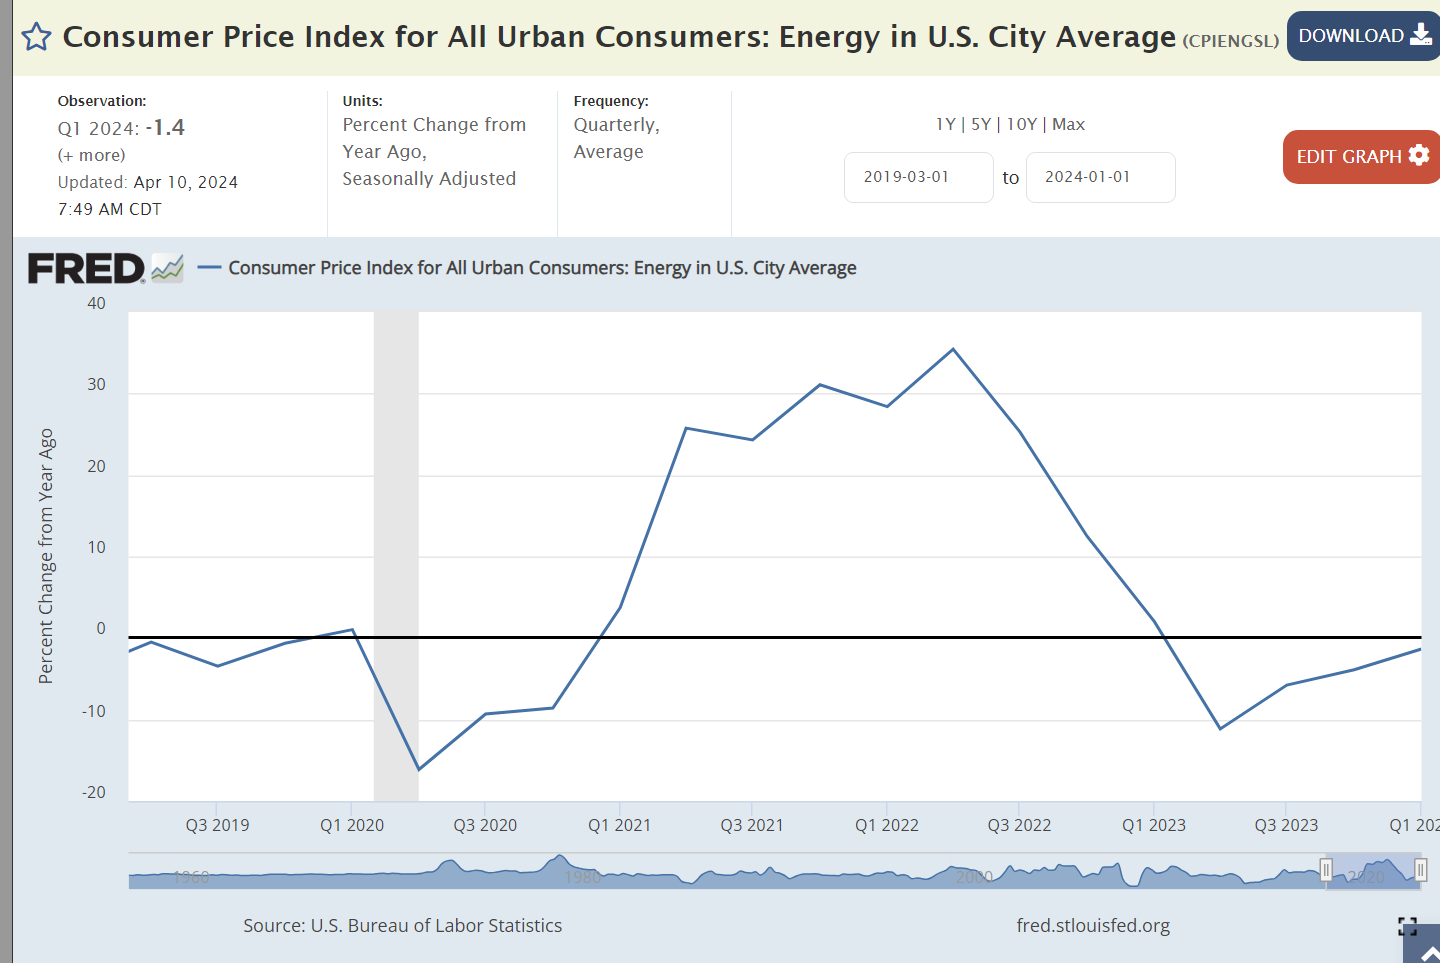
We have enjoyed energy price deflation for 3 quarters.
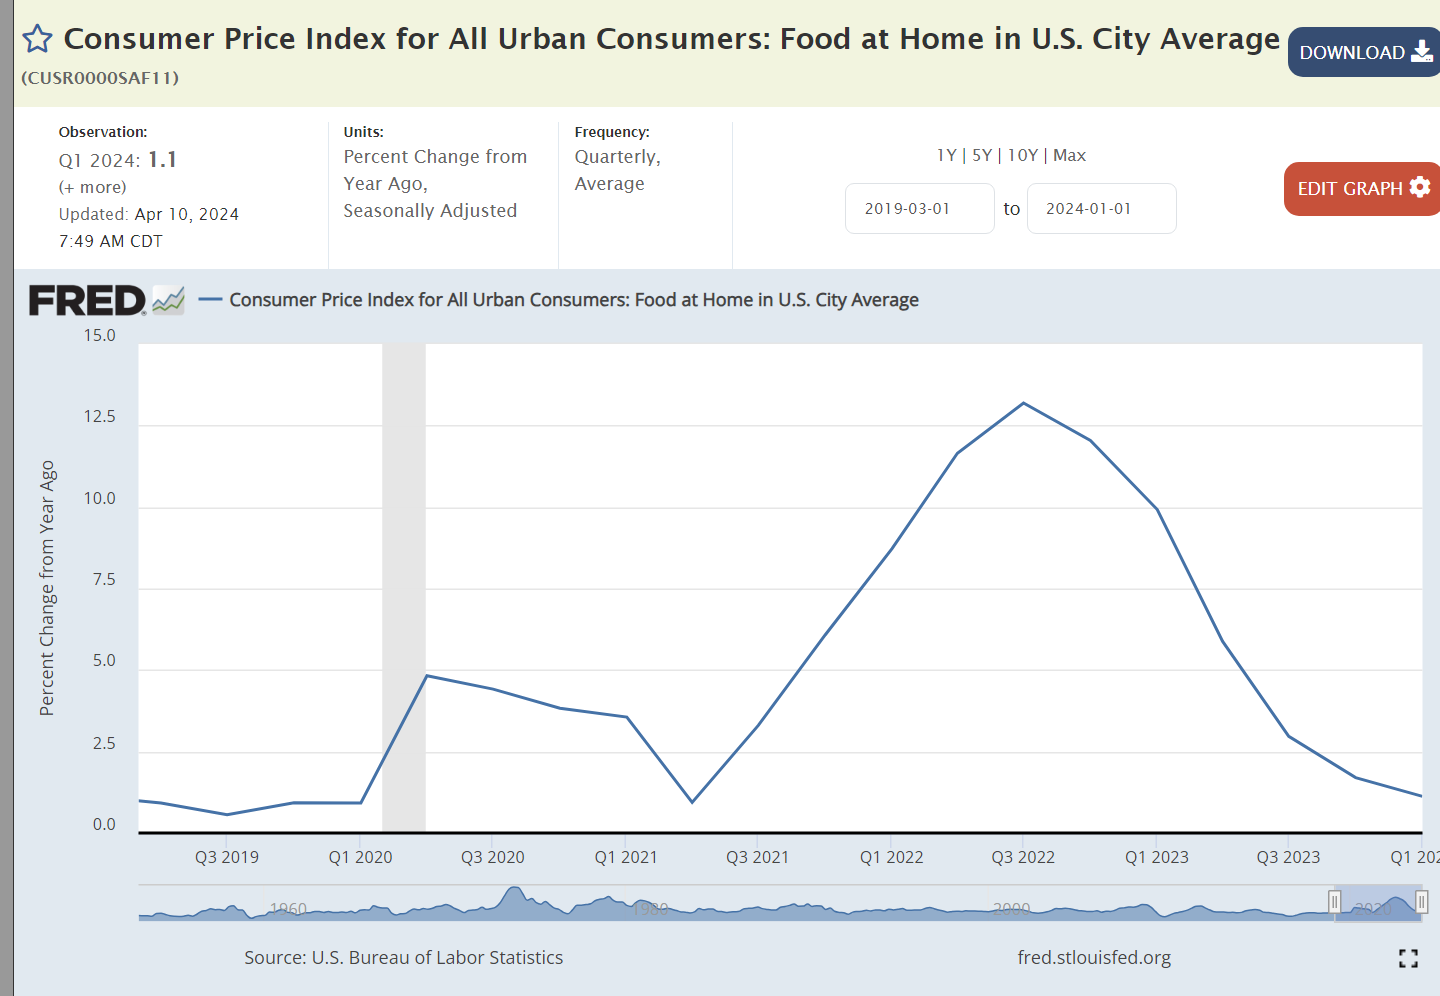
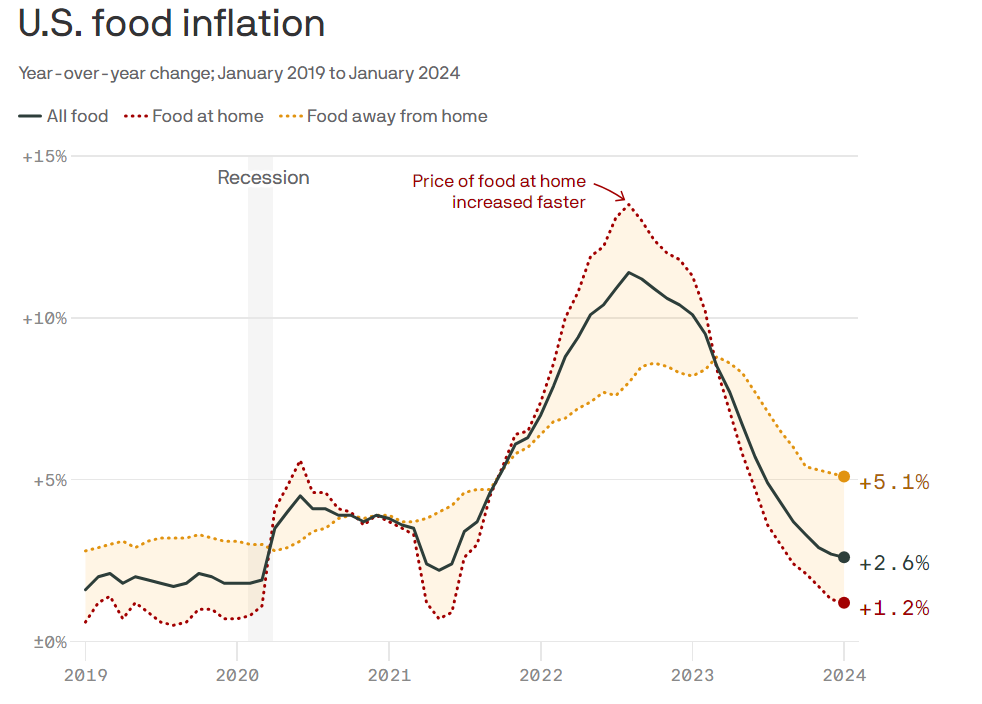
Food consumed at home prices have been nearly flat for the last 2 quarters after the 12-13% inflation during 2022.
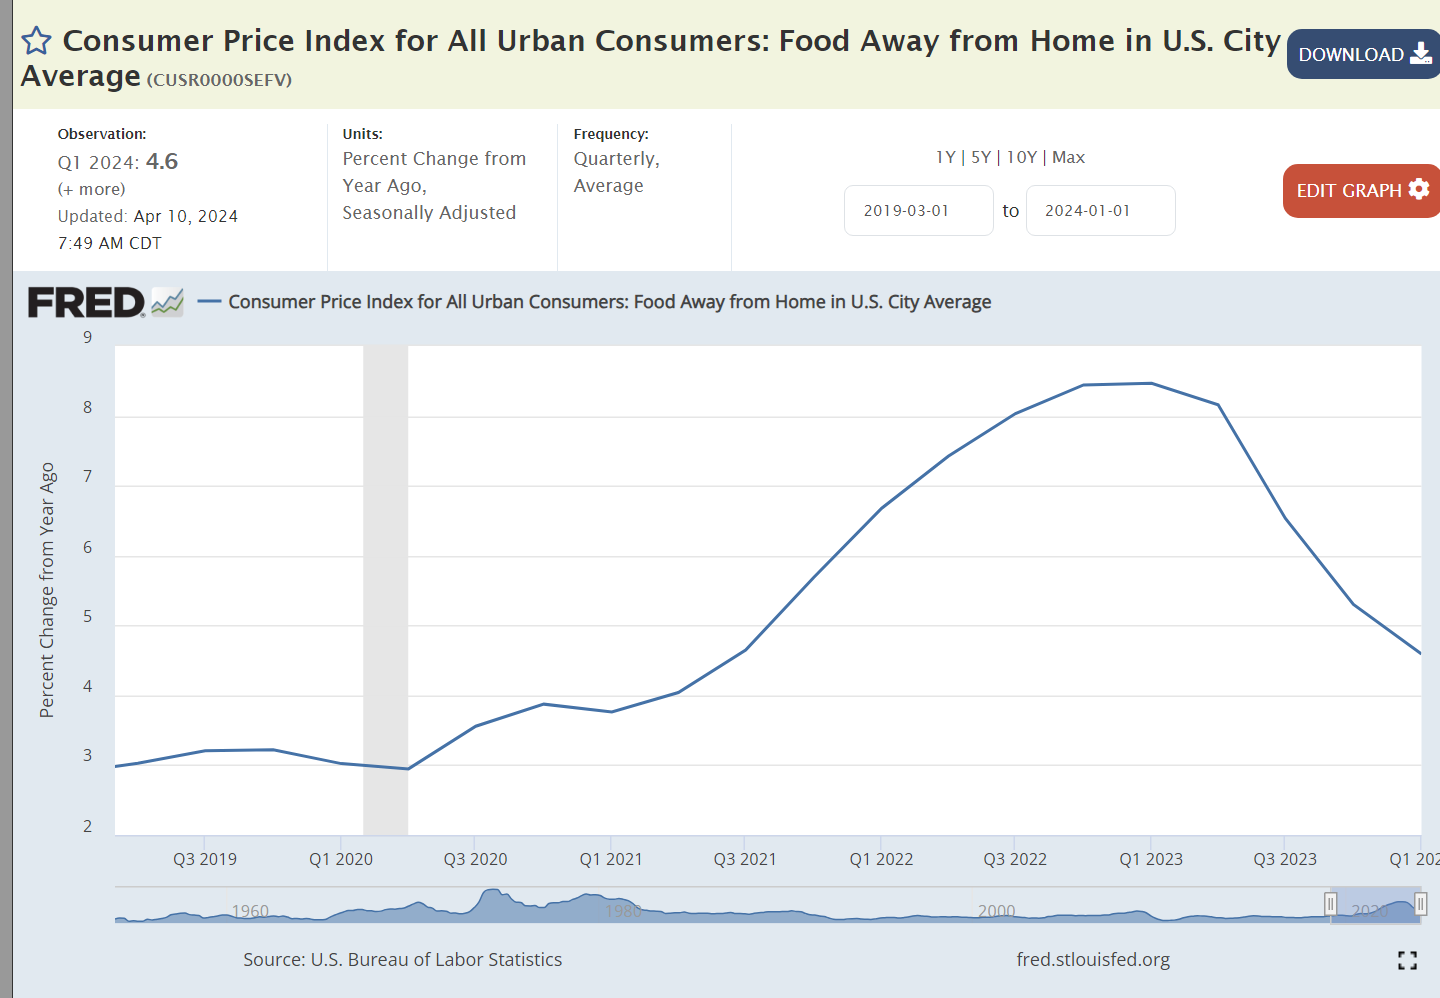
The price of food consumed away from home continues to rise at 4-5% annually. A tight labor market has increased staffing costs for restaurants. High food input costs taught them to better manage their menu prices. Many restaurants went out of business during the pandemic. Restaurants, large and small, lost money during the pandemic and are fighting hard to recover these losses. Following the lean pandemic years consumers have largely returned to their habits of eating out. This is a business sector where high aggregate demand driven by government deficit spending is creating inflation. It is not the “wage-price spiral” of the 1970’s in a manufacturing intensive economy but it is a similar situation in our retail-intensive economy.

We have enjoyed deflation in durable goods prices for 5 quarters as US and global manufacturers realigned their supply chains with more predictable demand patterns.

Nondurable goods inflation has been below the 2% benchmark for 4 quarters.

The broadly defined “services” sector at 5-6% inflation remains a stubborn problem area. It contains a number of sub-sectors with very different market conditions.


Medical care inflation above the overall inflation rate has been an issue for decades, but it has averaged just 1% for the last 5 quarters.

Transportation services prices have increased by 10% annually. This includes public and private transportation. Public sector transportation is attempting to recover from the pandemic driven decline in ridership. Private rail and truck carriers were disrupted by the pandemic as goods movements plummeted. The prospect of driverless trucks kept freight firms and drivers from returning. Transportation drivers are on the low end of wages. The overall increase in real wages at the low end of the labor market has made these physically demanding, away from home, jobs less attractive. This inflation is part long-term structural adjustment and part short-term recovery of freight flows in the economy. Transportation services is 5% of the CPI, material, but not large enough to drive the total.

The education and communications pair of service sectors has low inflation. Education is higher. Communications is lower.

Housing is one-third of the total CPI. It is a very technical, wonky area. It combines a blend of actual rental charges and the estimated rental value of owned homes. Increases in home prices are smoothed out and their impact on the CPI tends to lag by 2-8 quarters. Housing inflation has fallen from 8% to 5%.

Housing sales prices have declined for 4 quarters. This will increasingly blend into the housing CPI, soon producing deflation rather than 4-5% inflation.
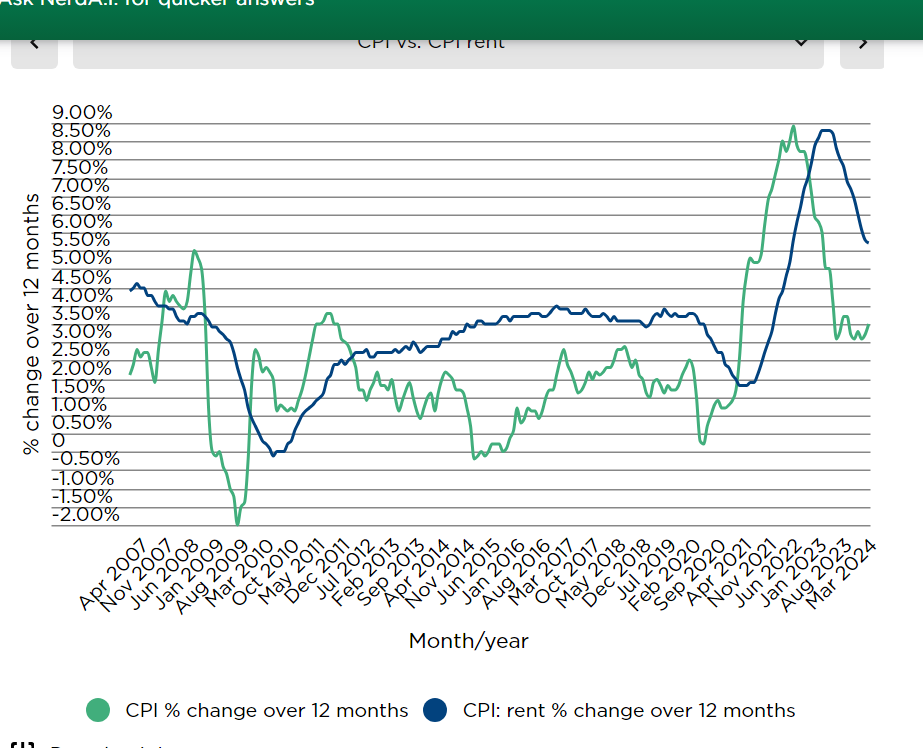
https://www.nerdwallet.com/article/finance/rental-market-trends

Market rent inflation remains in the 3-3.5% range based on the cumulative lack of US housing construction since the Great Recession of 2007-9. Combined with falling housing sales prices the combined housing CPI should decline to 2% by the fourth quarter of 2024.

Dreaded “cost-push” inflation is not a major factor for the US economy. A tight labor market has delivered 1% annual real wage increases for the last 5 quarters. This is a factor in inflation but not a driver or barrier to reaching 2% overall.

https://bipartisanpolicy.org/report/deficit-tracker
2024 looks like 2023, a very high budget deficit for a full-employment economy. In classical Keynesian economic terms, the aggregate demand pressure indicates continued 3% inflation.
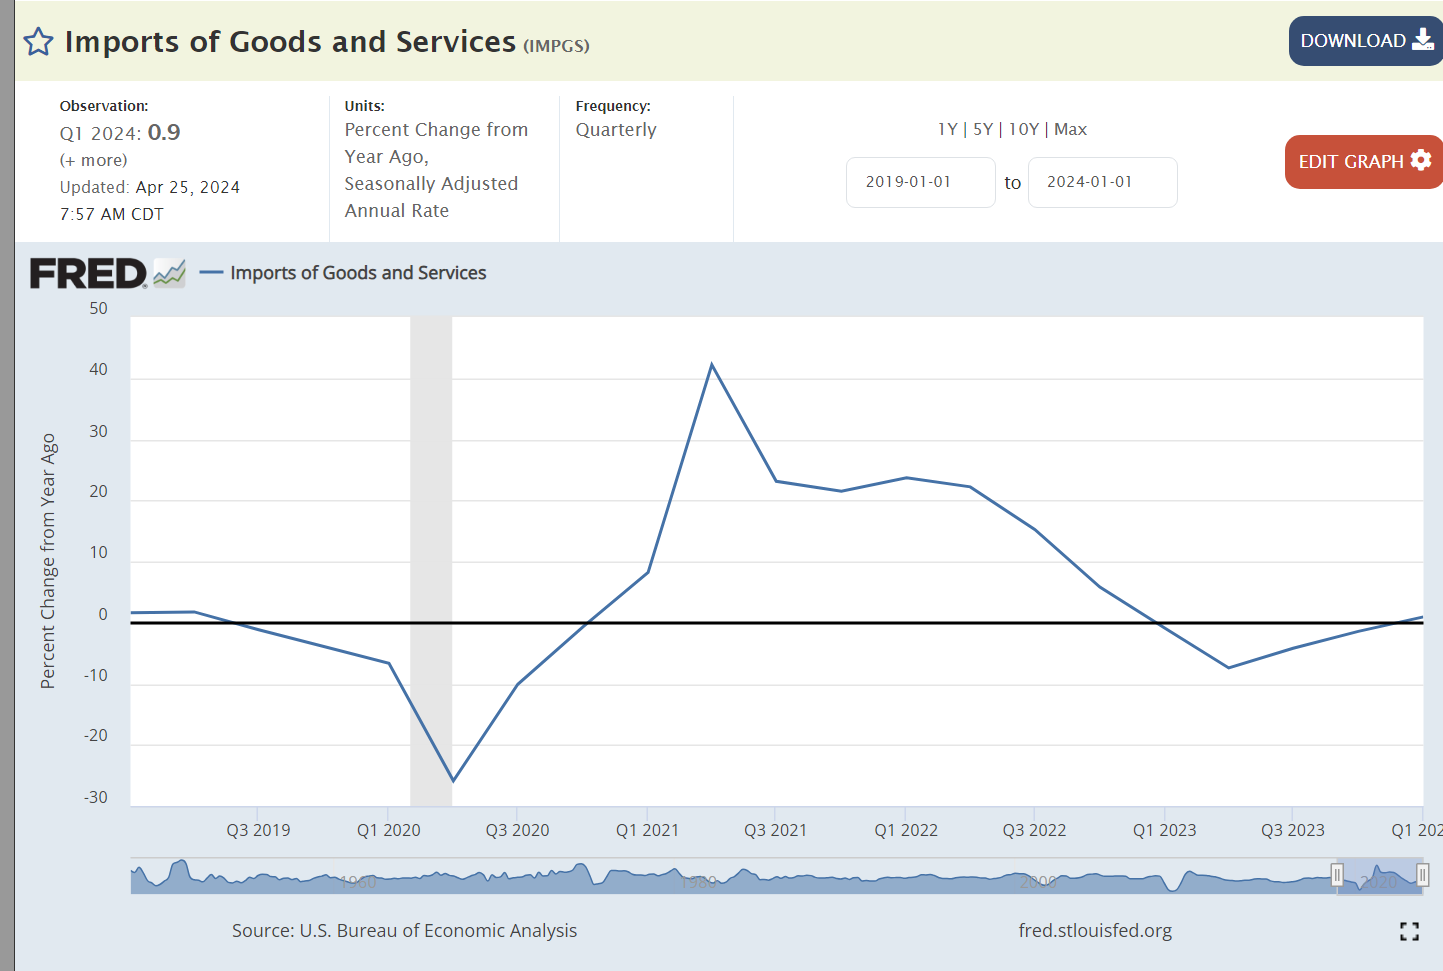
An overheated economy typically shows a strong increase in imports as demand reaches out globally. This is not the situation in the US this year.
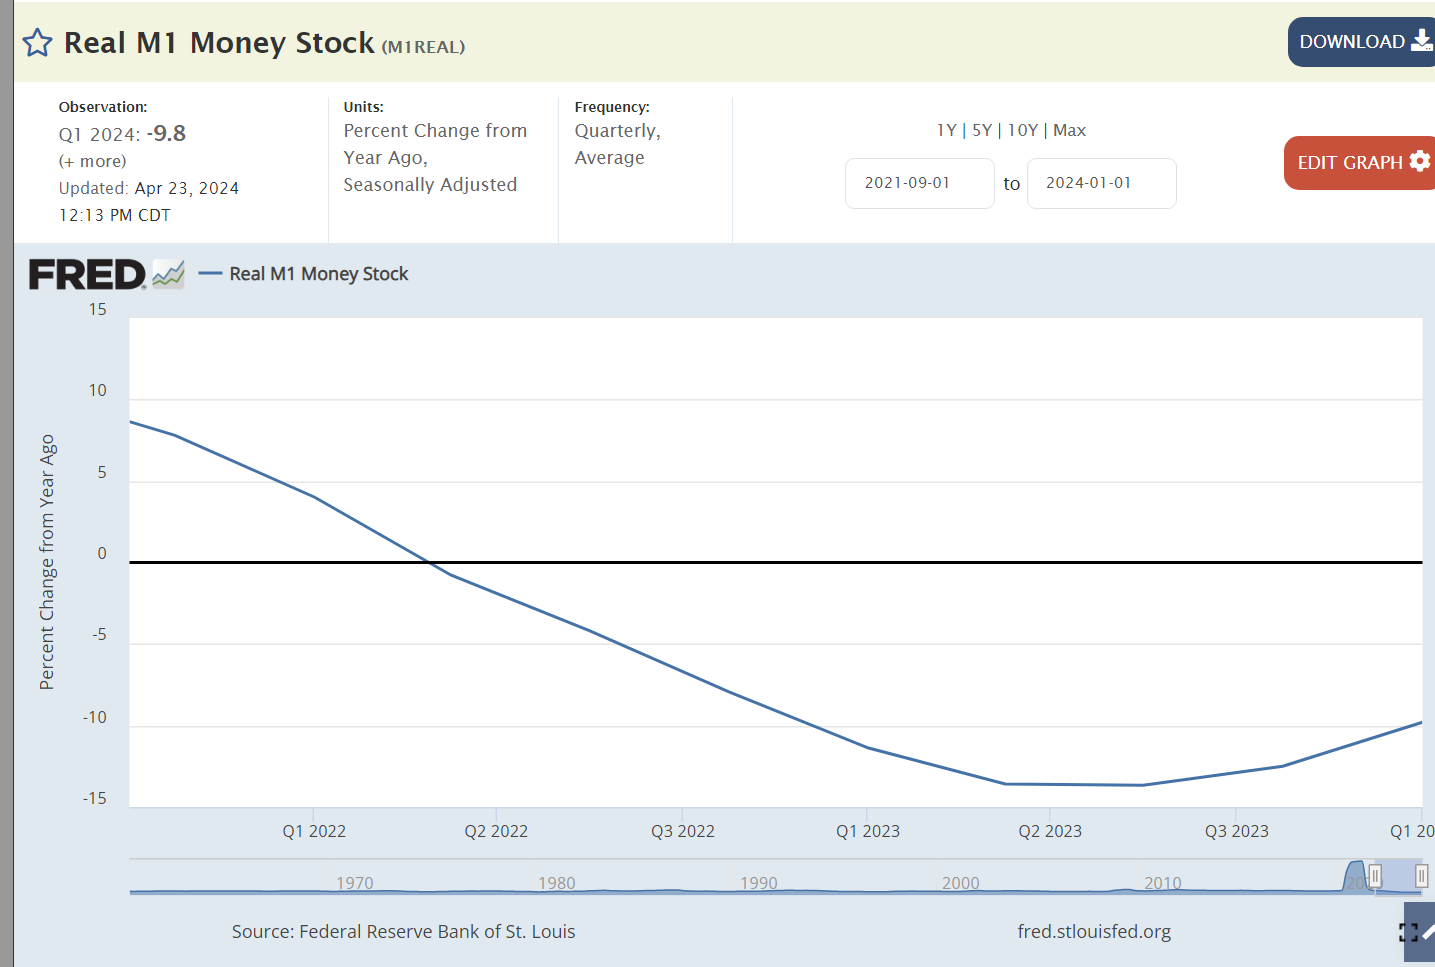
The money supply has a long-term impact on the economy, prices and inflation. The Federal Reserve Bank has been shrinking the “money supply” by 10% annually.
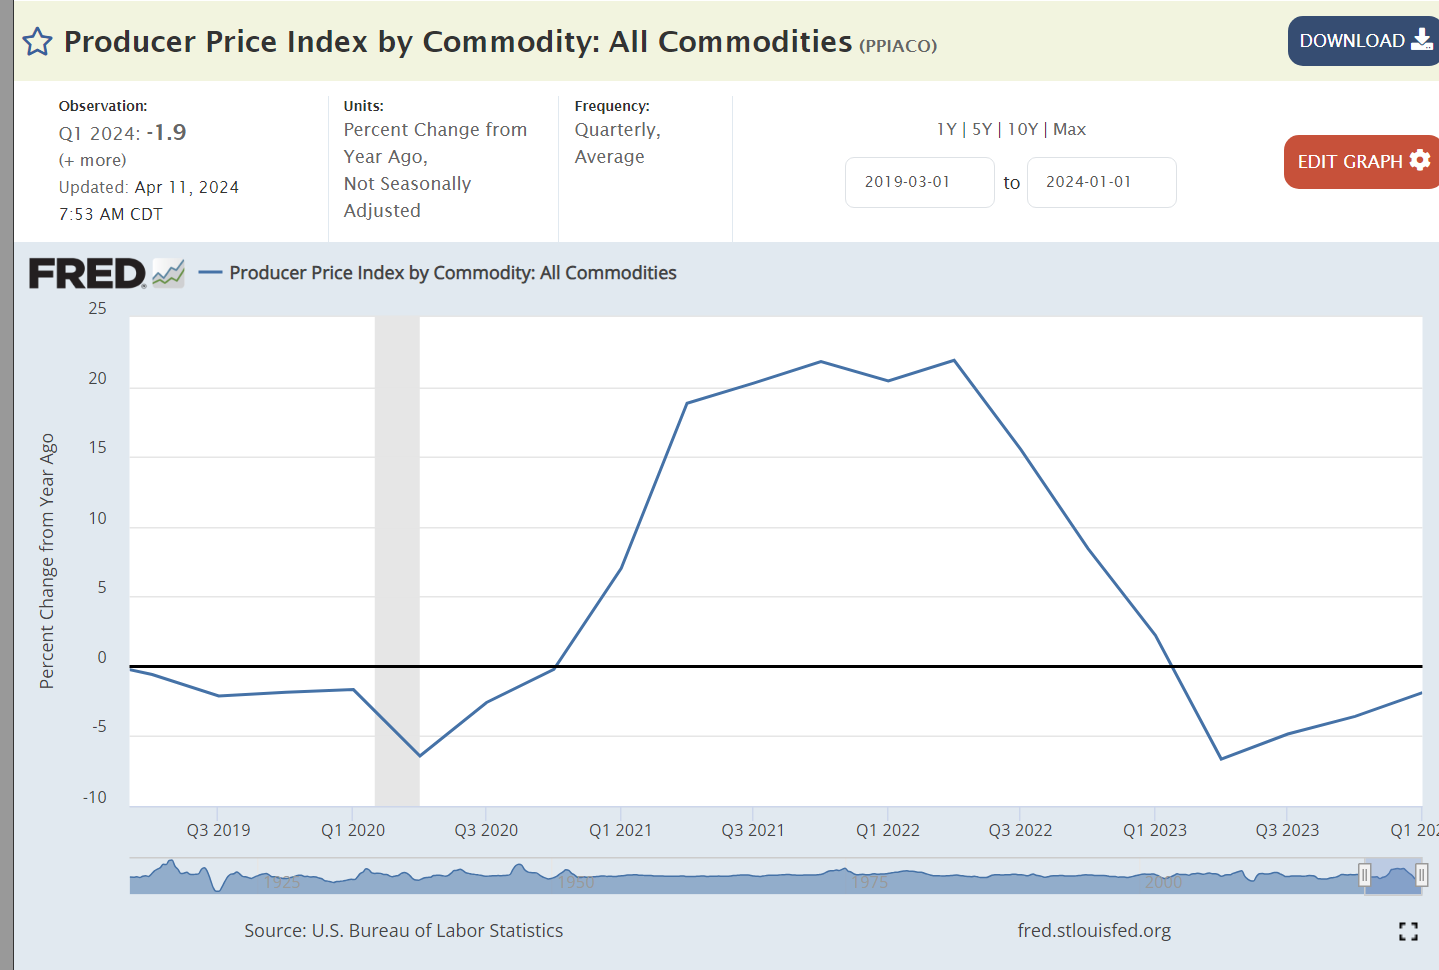
Commodities are the most volatile element of the global economy. Prices jumped by 20% with the unanticipated quick recovery from the pandemic. The last year has delivered commodities price deflation.

Changes in relative market power can drive inflation. Corporations increased profits by 50% in the first year of the pandemic. Profits have been relatively flat since then.
Summary
A dozen sectors point towards 2% inflation by year end. Energy, food at home, durable goods, nondurable goods, medical care, education/communication, housing prices, real wages, imports, money supply, commodity prices and profits.
Four sectors indicate concerns. Food away from home continues to drive high inflation.
https://www.axios.com/2024/02/13/cpi-food-inflation-dining-out
Public and private transportation services have not yet reached equilibrium. This pressure may continue for another 4 quarters but should not be a long-term inflation driver.
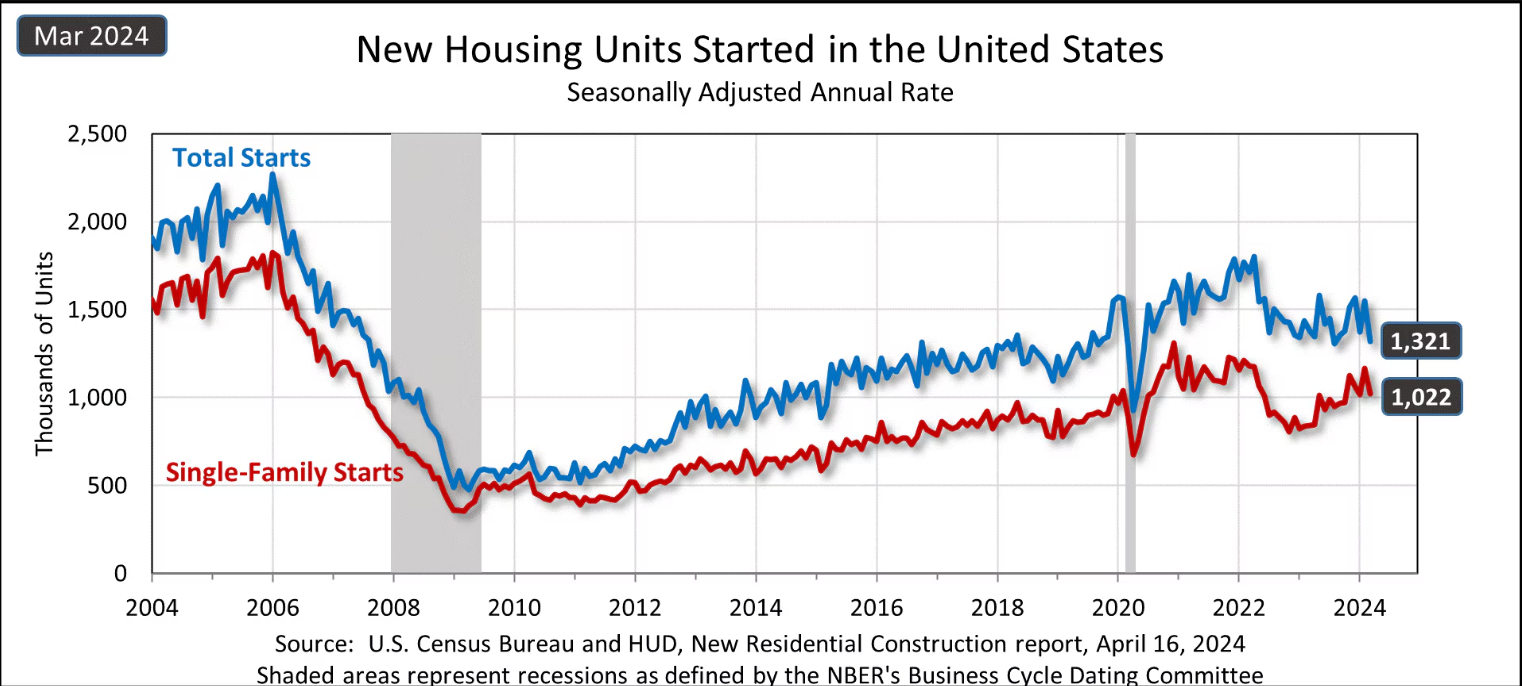
https://www.census.gov/construction/nrc/current/index.html
The “Great Recession” destroyed the construction industry. It has slowly recovered. Total construction has increased, perhaps not enough to bring housing supply into balance with demand 15 years later. Rental inflation at 3% is likely to continue.
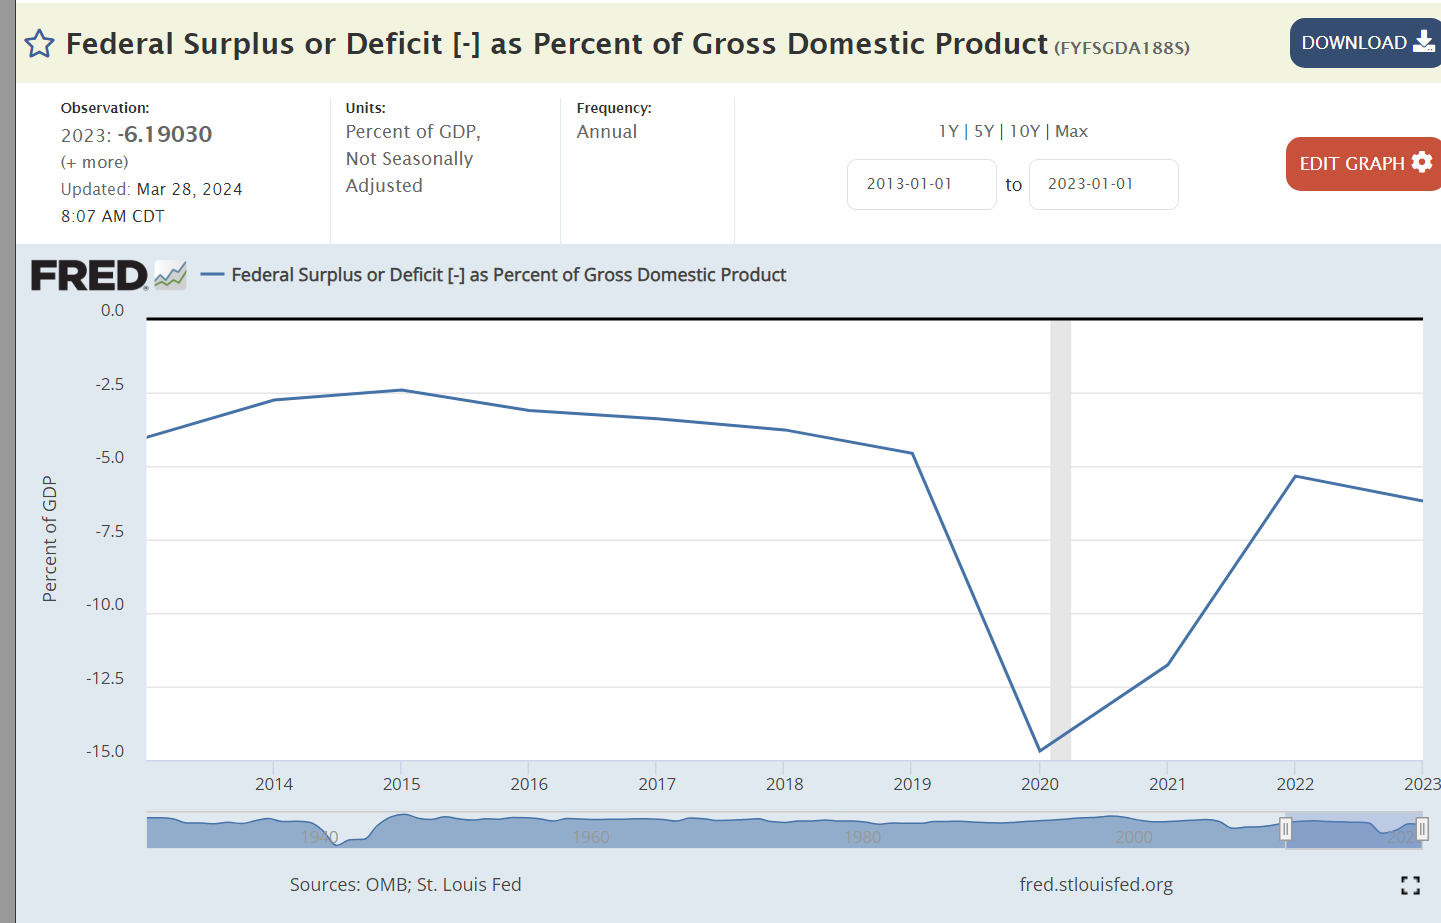
The federal budget deficit is the greatest concern. 6% of GDP is a huge deficit.
Net, net, I predict that the Urban Consumer CPI increase in the fourth quarter of 2024 versus the fourth quarter of 2023 will be 2.25%. The federal government spending deficit will directly and indirectly boost inflation.
